
Crypto World
Analytical Silver Price Forecasts for 2026 and Beyond

Silver continues to sit at the intersection of monetary confidence, industrial transformation, and geopolitical tension. Its price history shows repeated phases of sharp repricing followed by consolidation, reflecting shifts in macro conditions rather than steady progression.
Looking ahead, silver’s role in electrification, combined with fiscal and currency dynamics, keeps it firmly in focus for market participants. This article examines silver’s historical price behaviour and provides analysts’ silver price predictions for the next 5 years, placing recent developments within a broader market context.
Analytical Forecast Summary
2026
For 2026, estimates span roughly $92 to $262, with bank views clustering around $100 while some retail-aggregator models extend far higher. The spread reflects uncertainty around real yields, dollar direction, and how long physical tightness persists after the January volatility spike.
2027
In 2027, forecasts widen further, from about $112 to $374. Some views lean on a lower gold-silver ratio as a driver of relative upside, while others assume industrial thrifting and substitution cap follow-through after any sharp repricing
2028
Silver’s projected price in 2028 ranges from around $128 to $423. This gap largely comes down to how much PV and electrification demand offsets lower silver intensity per unit and whether supply response remains slow.
2029
2029 estimates run from roughly $136 to $443. Longer-range numbers diverge on whether investment demand remains episodic or returns in multi-quarter waves during macro stress.
2030
Forecasts for 2030 sit between about $143 and $499, implying continued volatility rather than a linear trend, with outcomes hinging on fiscal dynamics, monetary credibility, and the balance between demand growth and supply constraints.
Silver’s Price History
Silver’s price history is marked by dramatic fluctuations, reflecting the interplay of market forces, geopolitical events, and investor behaviour.
Silver Thursday (1980)
One of the most significant periods was in the late 1970s and early 1980s, notably during the Silver Thursday event of 1980. After the precious metal began climbing in the latter half of the 1970s, an attempt by the Hunt brothers to corner the market in January 1980 led to silver prices reaching an all-time high of $49.45 per troy ounce—from the 1979’s high of $28— before crashing to a low of $4.90 at the end of 1982.
The Early 21st Century (2000-2011)
Following the dot-com bubble burst in the early 2000s, silver and other precious metals began a bullish run as investors sought so-called safe-haven assets amidst economic uncertainty. However, after surging from a low of around $4.43 in November 2002 to a high of $15.23 in May 2006, prices stalled. It eventually rose again, driven by a combination of investment demand, industrial applications, and concerns over fiat currency devaluation in the run-up to the Great Financial Crisis of 2008.
While it dipped as the crisis unfolded, silver spiked in the following years, reaching an all-time high of roughly $50 in April 2011.
A Volatile Period in Silver’s History (2012-2026)
However, silver then reversed hard, ending 2011 near $27.80 and sliding again as tighter policy expectations built. The downswing carried into the mid-2010s, with a trough around $13.9 in late 2015/early 2016. For much of 2014-2019 it rotated in a $15-$20 band as US rates rose and the dollar firmed.
In March 2020, the COVID liquidity shock pushed silver below $12, then stimulus and reflation trades drove a fast rebound towards $29 by August 2020. A retail-driven “silver squeeze” wave in early 2021 lifted it to around $30 before momentum faded.
Fed tightening and a stronger dollar weighed again in 2022, taking prices back toward $18 before stabilising. A break higher gathered pace from May 2024 (moves through $32-$35 linked to tight physical conditions and strong solar-related demand signals), then 2025 accelerated: silver cleared the prior nominal record in October near $54.50 and pushed higher into year-end. In January 2026, price action became disorderly, with a spike to over $121 late in the month. At the time of writing on the 29th of January, silver stands at around $114.
Interested readers can head over to FXOpen’s TickTrader platform to explore silver price trends using our interactive XAG/USD charts.
Analytical Silver Prices Forecasts for 2026
Silver enters 2026 after a steep 2024–January 2026 run and a sharp volatility spike. The key issue for silver price predictions is whether the metal rises on strong fundamental factors, or corrects as the factors change.
Macro, Rates, and Debasement Concerns
Rate-path pricing and the US dollar remain central. If real yields drift lower and fiscal deficits stay elevated, concerns about currency depreciation may continue to influence investment flows into precious metals. Persistent budget imbalances, heavy Treasury issuance, and questions around long-term currency purchasing power remain a central part of the backdrop.
Industrial Demand and Manufacturing Thrift
Solar, electrification, and electronics demand stay in focus, but 2025 highlighted a clear constraint: higher prices encouraged reduced silver loadings in PV cells and components. If prices remain elevated, further thrifting and substitution may lower silver demand.
Supply, Inventories, and Physical Tightness
The silver market has recorded several annual deficits in recent years. Analysts note a decline in above-ground inventories and heightened sensitivity to regional physical flows. While recycling supply may rise in response to price incentives, primary mine output is likely to remain relatively inelastic given silver’s predominantly by-product production profile.
Volatility and Positioning
After the January spike, silver may trade in wide ranges driven by ETF flows, futures positioning, and liquidity conditions. The 2025 breakout zone around $28-$35 remains important; sustained trade below it could point to a deeper reset.
Analytical Silver Price Predictions for 2026
Silver price forecasts for 2026 reflect a market adjusting after sharp repricing, with views shaped by macro policy uncertainty, physical availability, and shifting investor positioning.
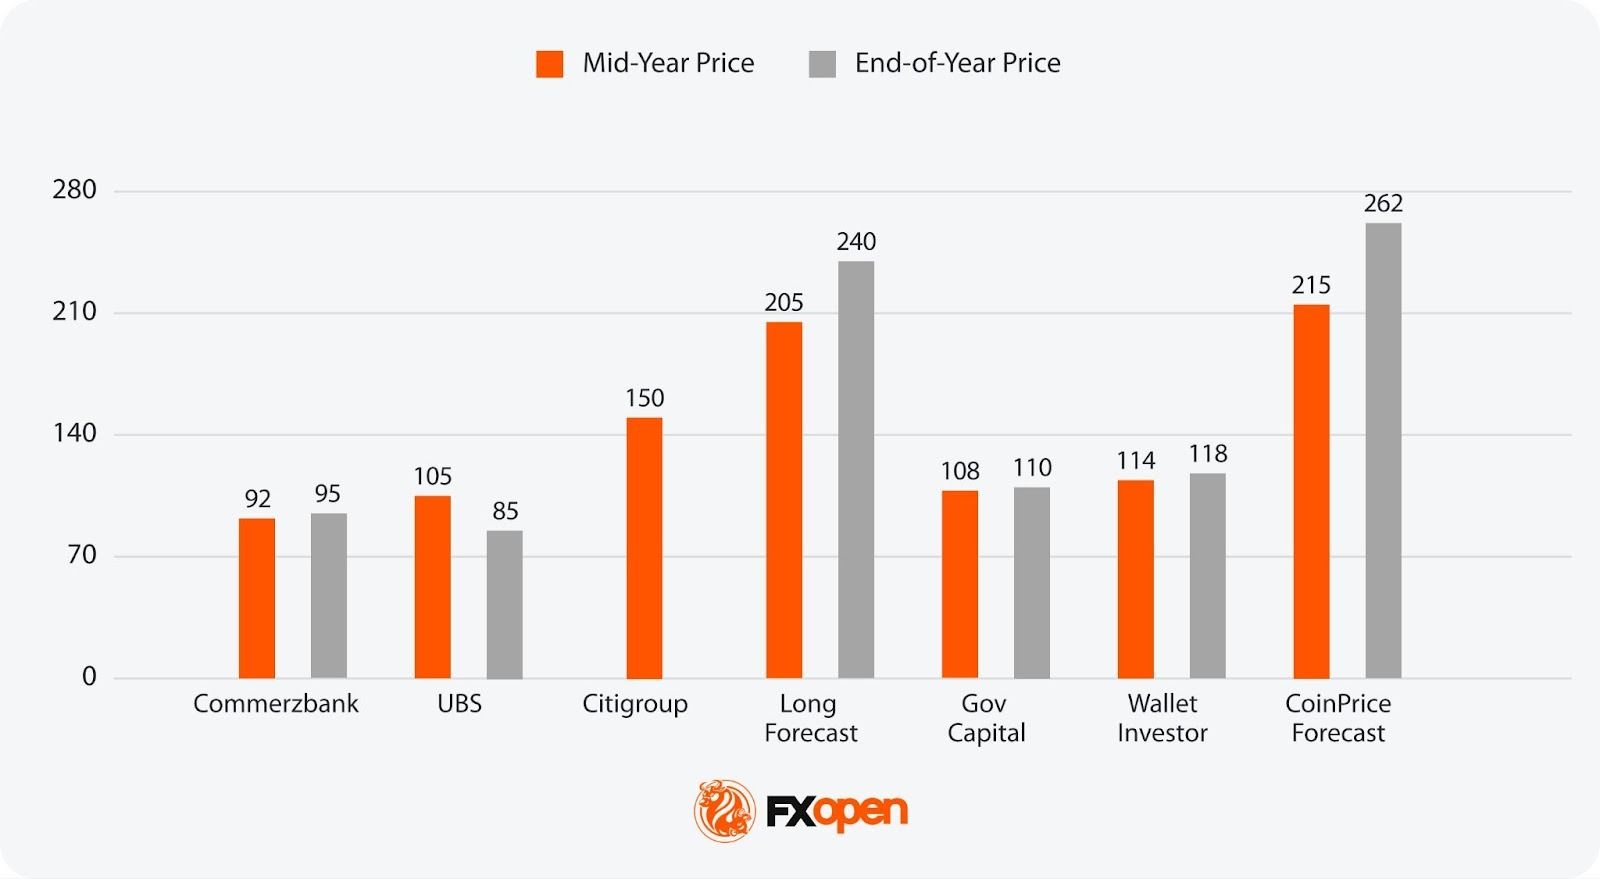
- Most Pessimistic Projection for Mid-Year 2026: $92 (Commerzbank)
- Most Optimistic Projection for Mid-Year 2026: $215 (CoinPriceForecast)
- Most Pessimistic Projection for End-of-Year 2026: $85 (UBS)
- Most Optimistic Projection for End-of-Year 2026: $262 (CoinPriceForecast).
Citigroup outlines one of the most aggressive near-term outlooks, pointing to $150/oz by mid-2026. Commodities strategist Max Layton links this view to strong Chinese buying, supply constraints, and persistent structural imbalances. Citi characterises silver as behaving like “gold squared”, arguing the move may persist until valuations appear stretched relative to gold.
Commerzbank has lifted its expectations materially, now seeing $92/oz by mid-2026 and $95/oz by year-end, up sharply from late-2025 assumptions. Analyst Carsten Fritsch points to escalating geopolitical tensions, including unrest in Iran and the risk of wider confrontation, while cautioning that higher prices may accelerate industrial thrifting or substitution towards cheaper metals.
Analytical Silver Price Forecasts for 2027 and Beyond
Beyond 2026, silver price predictions become less about short-term positioning and more about structural forces shaping demand, supply, and capital allocation.
Structural Demand Versus Intensity Decline
Solar, grid expansion, EVs, and data infrastructure continue to absorb material volumes, but the focus shifts from headline installation growth to silver intensity per unit. PV manufacturers, battery systems, and electronics producers are expected to keep reducing silver loadings where technically feasible. This creates a tension: total volumes may rise, but marginal demand growth becomes more sensitive to price. Periods of elevated prices risk flattening fabrication demand.
Fiscal Dynamics and Monetary Credibility
Longer term, silver remains exposed to currency debasement narratives rather than cyclical rate expectations alone. Persistent fiscal deficits, rising sovereign debt servicing costs, and political resistance to austerity may keep precious metals embedded in asset-allocation discussions. Unlike 2024–2026, this influence is expected to express itself episodically rather than through sustained one-way moves.
Supply Response Lag
Mine supply response beyond 2027 remains constrained. Supply elasticity remains low: as most silver is mined as a by-product, production levels are often dictated by the economics of copper, lead, or zinc rather than silver market trends. Recycling growth faces natural limits after several years of elevated prices pulling forward scrap supply. This could keep the market sensitive to demand shocks.
Analytical Silver Price Predictions: 2027
The 2027 outlook points to a continuation of longer-cycle themes, with some analyses focusing on relative valuation against gold while others factor in demand moderation from industrial thrift.
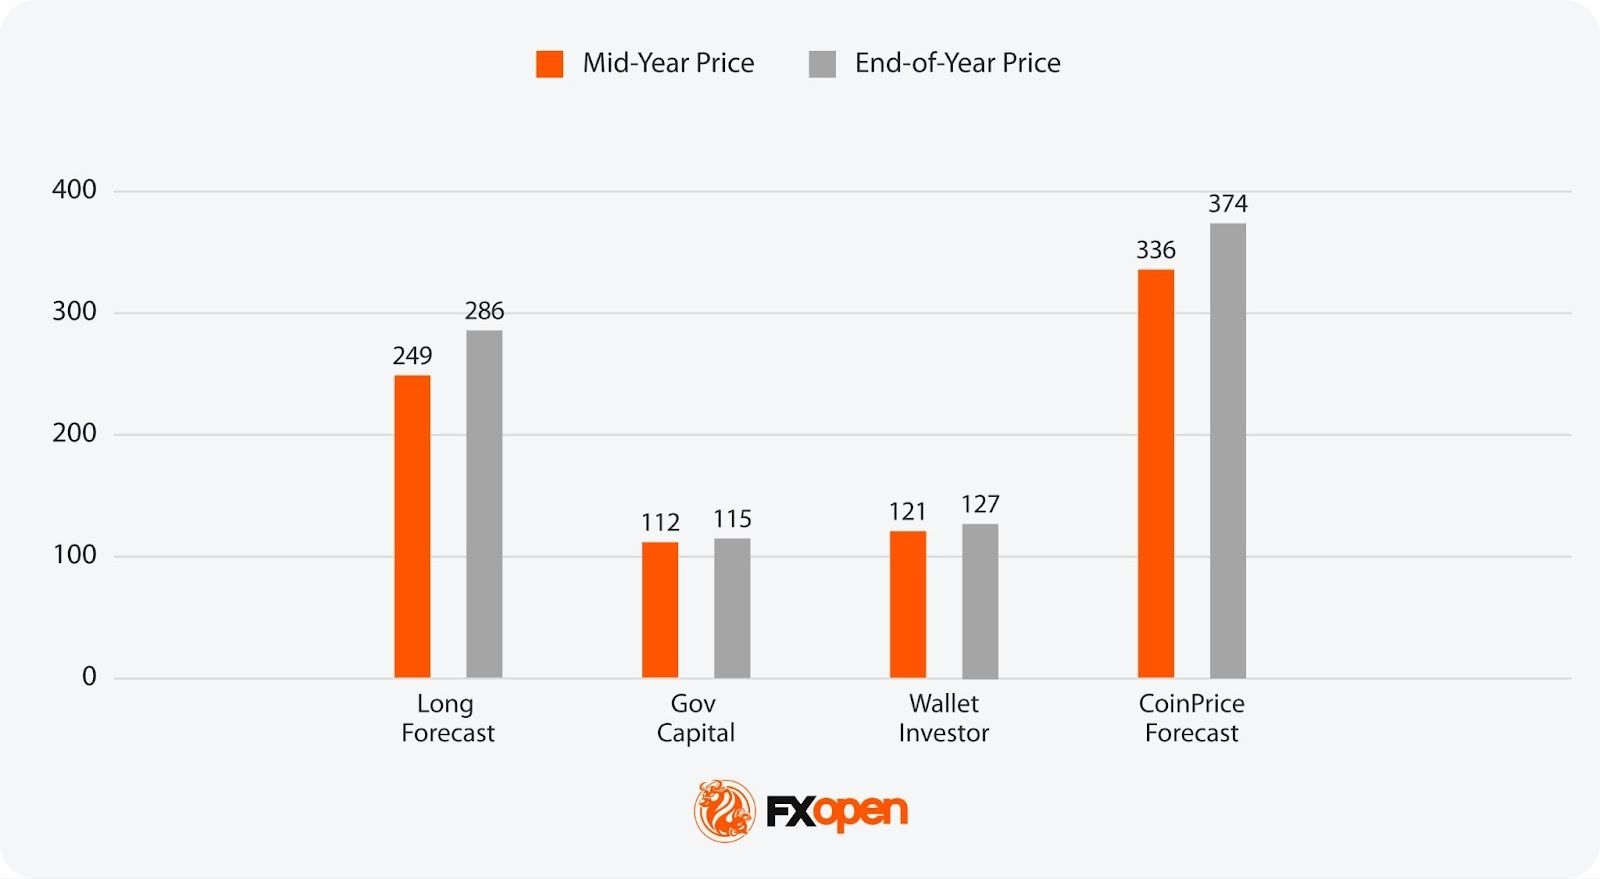
- Most Pessimistic Projection for Mid-Year 2027: $112 (Gov Capital)
- Most Optimistic Projection for Mid-Year 2027: $336 (CoinPriceForecast)
- Most Pessimistic Projection for End-of-Year 2027: $115 (Gov Capital)
- Most Optimistic Projection for End-of-Year 2027: $374 (CoinPriceForecast)
HSBC’s James Steel expects physical market tightness to ease gradually through 2027 as supply-side pressures resolve. The bank projects the global deficit narrowing further as industrial demand weakens, while mine output and recycling rise. Steel notes that elevated prices are encouraging “substitution, thrifting and design changes” across industrial applications, with jewellery demand “especially vulnerable.”
Oxford Economics, in a December 2025 report on behalf of the Silver Institute, projects that electric vehicles will overtake internal combustion engine (ICE) vehicles as the primary source of automotive silver demand by 2027. Electric vehicles consume, “on average, 67-79 percent more silver than ICE vehicles.”
Data centres powering AI systems represent another expanding offtake channel; as digitisation accelerates, demand for silver’s superior conductivity in servers and infrastructure is expected to rise in tandem. Oxford Economics characterises silver as a “next-generation metal,” concluding it will “remain an essential component across multiple high-growth sectors as industries race to embrace digital innovation and meet clean energy mandates.”
Analytical Silver Price Predictions: 2028
By 2028, projections diverge more clearly as assumptions vary around supply response timing, sustained electrification demand, and the durability of investment flows.
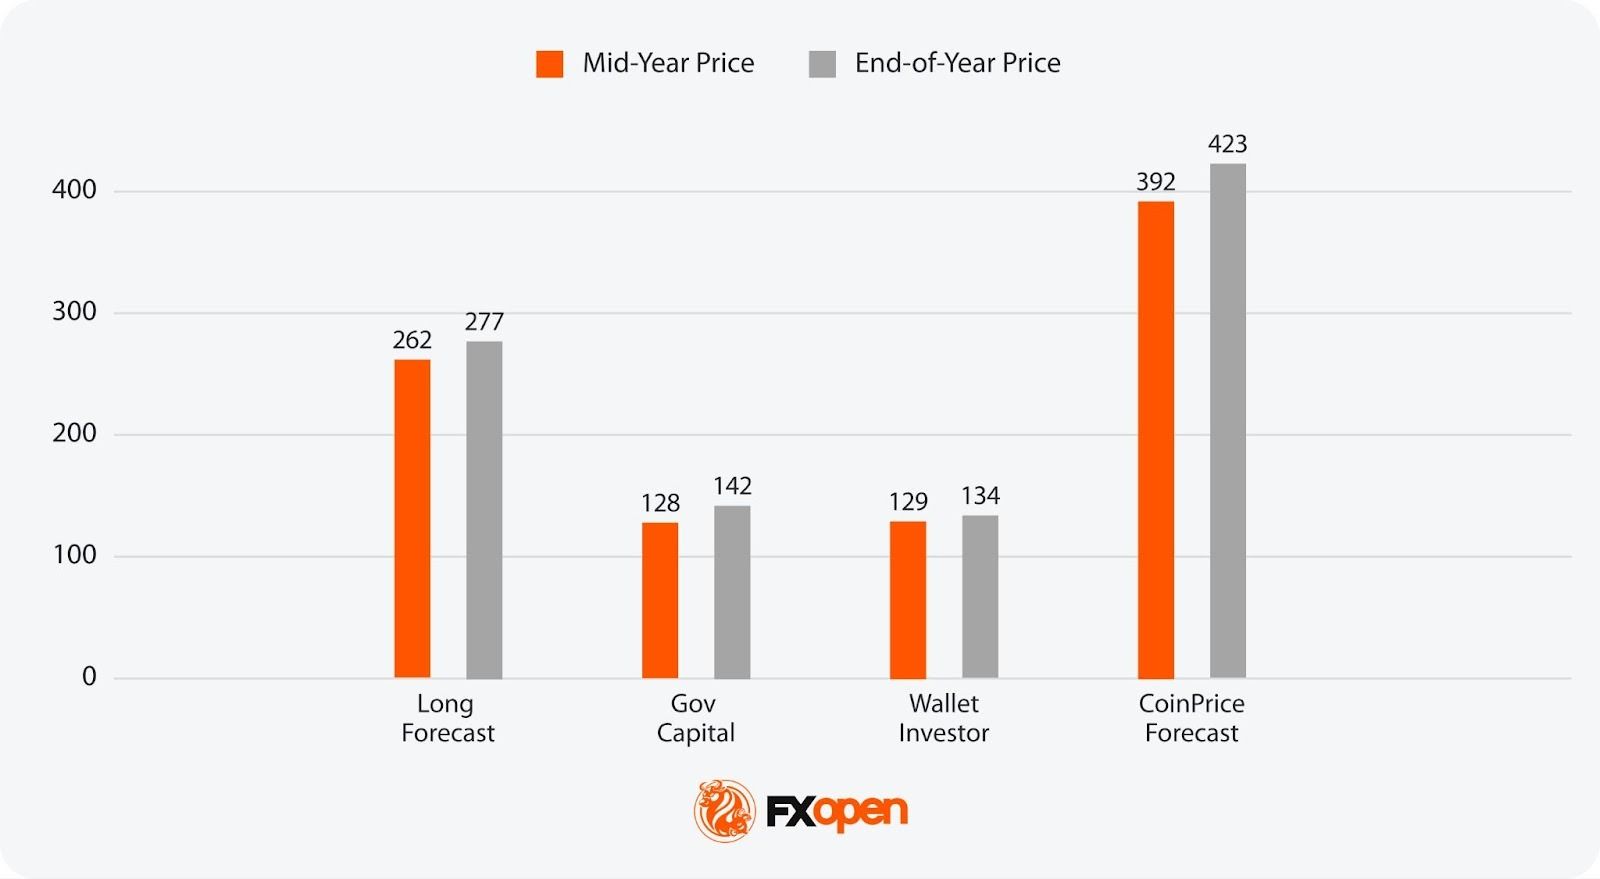
- Most Pessimistic Projection for Mid-Year 2028: $128 (Gov Capital)
- Most Optimistic Projection for Mid-Year 2028: $392 (CoinPriceForecast)
- Most Pessimistic Projection for End-of-Year 2028: $142 (Gov Capital)
- Most Optimistic Projection for End-of-Year 2028: $423 (CoinPriceForecast)
Analytical Silver Price Predictions: 2029
The 2029 outlook reflects growing uncertainty over macro structure rather than short-term cycles, with outcomes tied to fiscal dynamics, currency credibility, and episodic capital rotation.
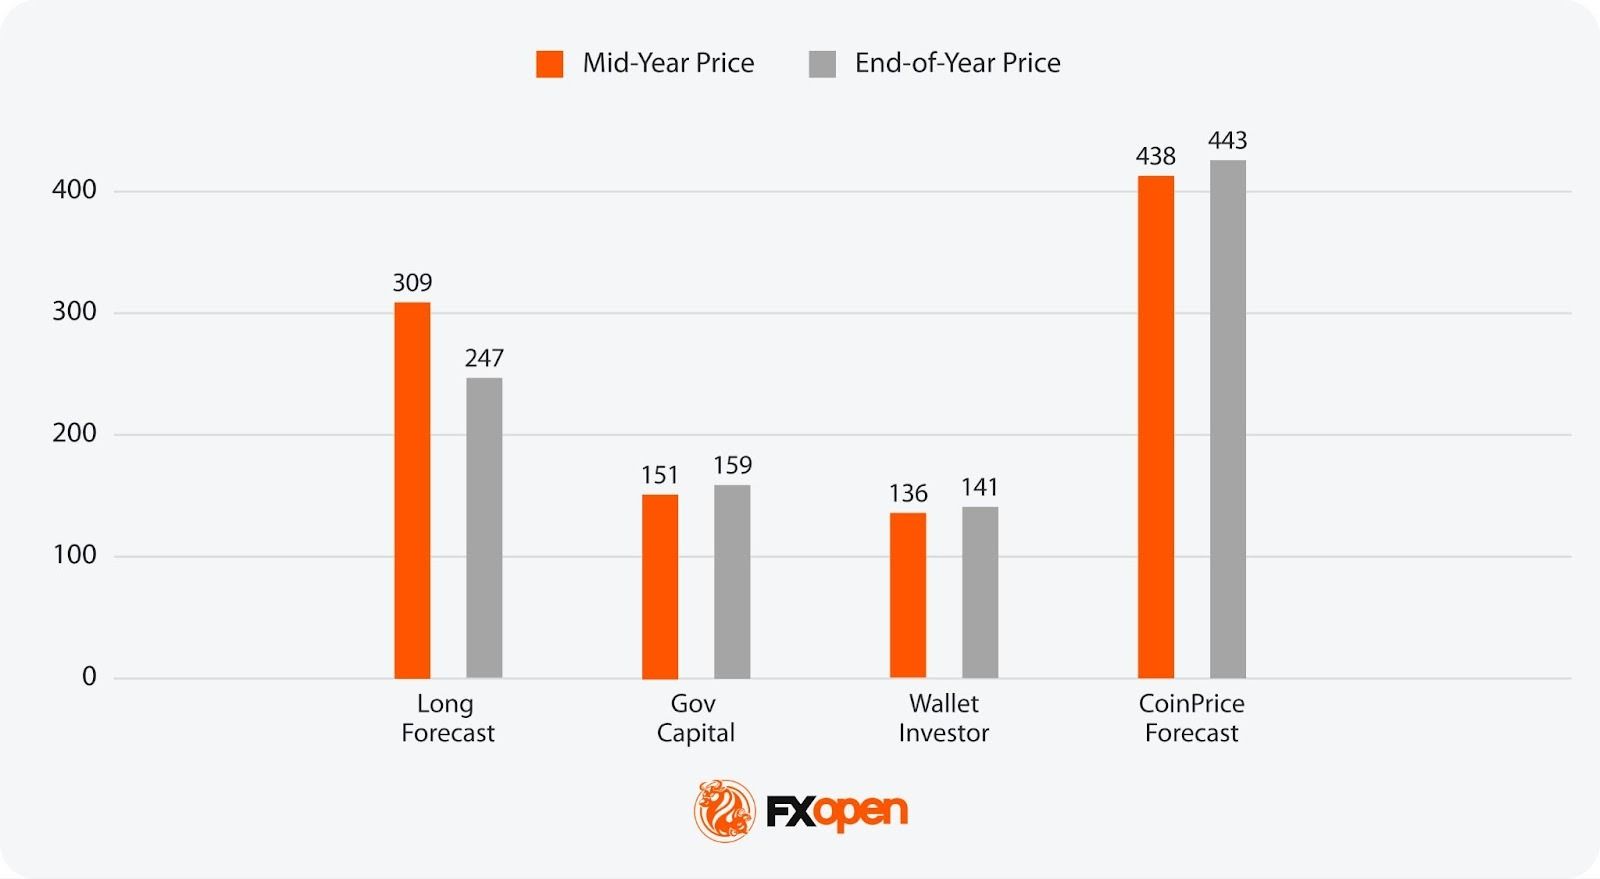
- Most Pessimistic Projection for Mid-Year 2029: $136 (Wallet Investor)
- Most Optimistic Projection for Mid-Year 2029: $438 (CoinPriceForecast)
- Most Pessimistic Projection for End-of-Year 2029: $141 (Wallet Investor)
- Most Optimistic Projection for End-of-Year 2029: $443 (CoinPriceForecast)
Analytical Silver Price Predictions: 2030
Looking at long-term silver price forecasts in 2030, estimates frame silver as a hybrid asset, where price behaviour depends on whether structural demand pressures outweigh gradual supply adaptation and periodic volatility.
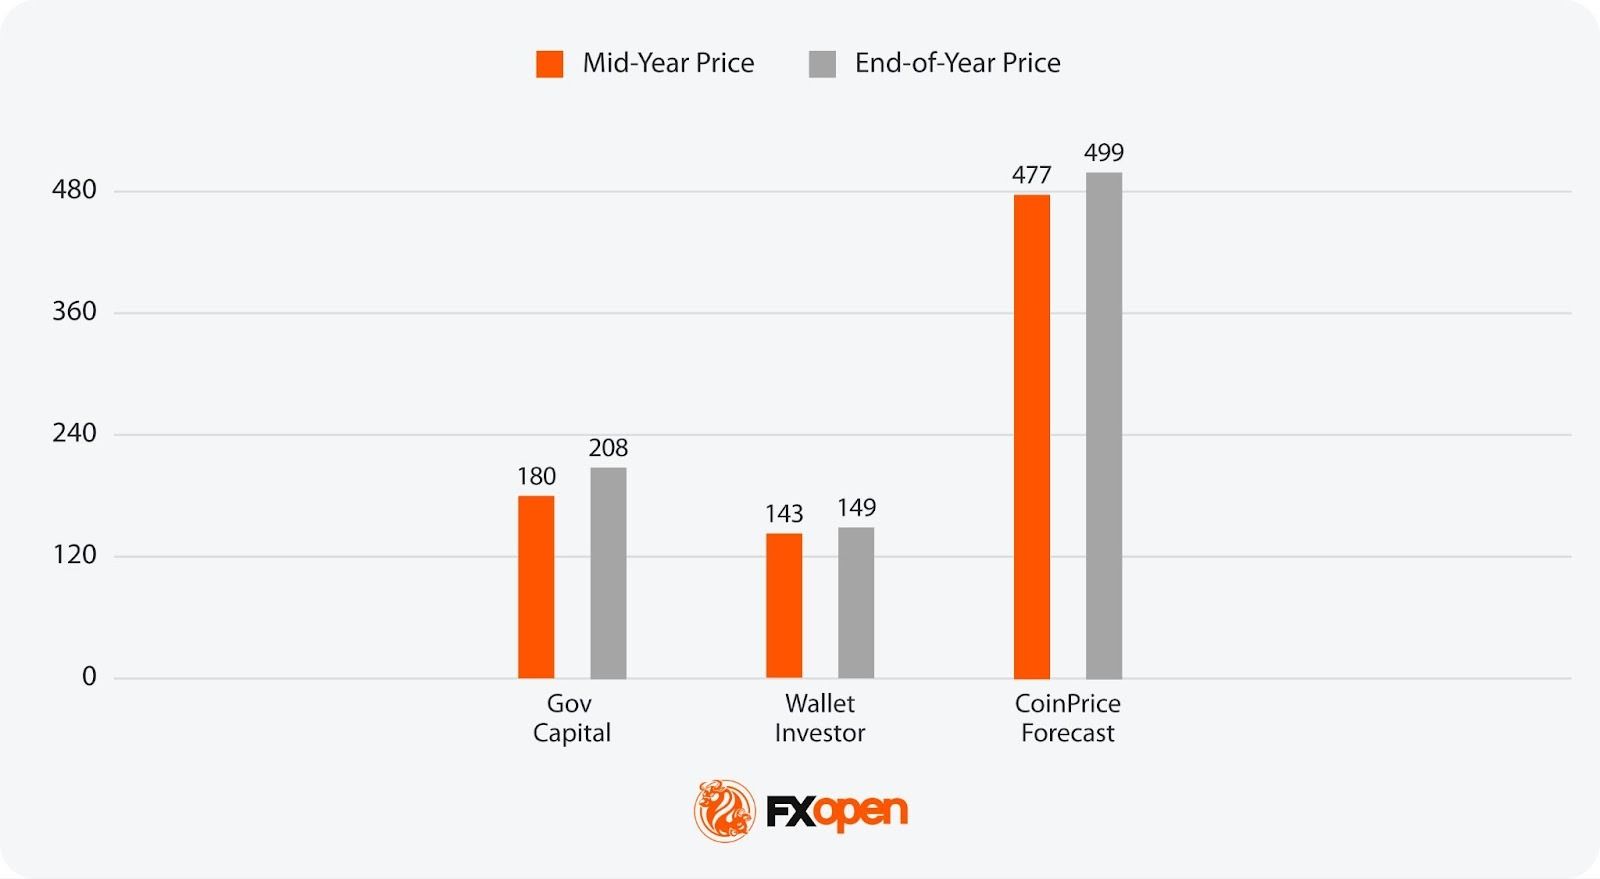
- Most Pessimistic Projection for Mid-Year 2030: $143 (Wallet Investor)
- Most Optimistic Projection for Mid-Year 2030: $477 (CoinPriceForecast)
- Most Pessimistic Projection for End-of-Year 2030: $149 (Wallet Investor)
- Most Optimistic Projection for End-of-Year 2030: $499 (CoinPriceForecast)
Factors That Might Affect the Silver’s Price
Silver prices are shaped by a dynamic blend of economic, geopolitical, and industrial factors, reflecting its dual role as both an investment and an industrial metal. Key factors going forward include:
- Industrial Demand: Silver’s extensive use in technologies like solar panels and electronics directly influences its price.
- Economic Conditions: Economic growth increases silver demand in manufacturing, while downturns often boost its appeal as a so-called safe-haven asset.
- Monetary Policy: Interest rate changes can shift investor preference between silver and yield-bearing assets.
- US Dollar Strength: An inverse relationship exists between XAG prices and the US dollar; a stronger dollar can suppress its price.
- Geopolitical Tensions: Conflicts and instability tend to increase investment in silver as a so-called protective measure.
- Gold/Silver Ratio: This indicator may help investors decide when to buy silver over gold, affecting demand and prices.
The Bottom Line
Silver’s outlook remains shaped by a mix of macro uncertainty, fiscal dynamics, and structural industrial demand. Price behaviour over the coming years is likely to reflect shifts in real yields, currency confidence, and supply constraints rather than linear trends, with volatility remaining a defining feature.
If you are looking to trade Silver via CFDs, you can consider opening an FXOpen account and get access to the advanced trading tools and more than 700 instruments.
FAQ
Will Silver Go Up in 2026?
Silver’s direction in 2026 depends on real yields, dollar trends, and physical market conditions. Some analysts point to support from tight supply and debasement concerns, while others highlight scope for consolidation after the January volatility spike.
Is Silver a Good Investment in 2026?
Silver is analysed as a hybrid asset with both industrial and monetary drivers. Its role in electrification and sensitivity to macro stress may support portfolio diversification, though price behaviour in 2026 is expected to remain uneven.
Will Silver Hit $200?
Some analyses outline scenarios above $200 based on historical gold-silver ratios compressing sharply. These outcomes assume sustained macro stress and strong investment flows, and sit well outside base-case assumptions from major banks.
What Will Silver Be Worth by 2030?
By 2030, analytical estimates range widely between $143 and almost $500, reflecting uncertainty around fiscal dynamics, supply response, and industrial demand intensity. Longer-range views agree that the future of silver prices will likely be volatile and shaped by macro structure and capital flows.
How Do Traders Trade Silver in Forex?
Silver cannot be traded on the forex market, as it is a currency market. However, it can be traded in the XAG/USD pair via CFDs. If you are interested in CFD trading, you can consider opening an FXOpen account and get access to over 700 instruments and 1,200 analytical tools.
This article represents the opinion of the Companies operating under the FXOpen brand only. It is not to be construed as an offer, solicitation, or recommendation with respect to products and services provided by the Companies operating under the FXOpen brand, nor is it to be considered financial advice.


CoinShares, a leading European digital asset manager with over $6 billion under management, is set to begin trading on the Nasdaq Stock Market under the ticker symbol CSHR.
The listing follows a $1.2 billion merge with Vine Hill Capital Investment Corp., a U.S.-based special purpose acquisition company (SPAC).
The asset manager, which had previously traded on the Nasdaq Stockholm in Sweden under the CoinShares International entity, formed CoinShares PLC through the merger.
The listing comes after BitGo (BTGO), went public earlier in the year, while various crypto firms listed in 2025 including stablecoin issuer Circle (CRCL), CoinDesk owner Bullish (BLSH), and exchange Gemini (GEMI).
CoinShares built its business around crypto exchange-traded products (ETPs) and now manages 39 funds across four platforms. The company generates most of its revenue through recurring fees, a model it says supports strong profitability and free cash flow.
“We are diversifying both our product and revenue mix, including new capabilities in listed asset management, active alternative strategies. and decentralized finance,” CEO Jean-Marie Mognetti said.
For investors, the move opens a new U.S.-based option to gain exposure to crypto markets through a firm already established in Europe. CoinShares says it’s leading the market in the continent with a 34% share.
CoinShares’ U.S. expansion will include product development and acquisitions, while proximity to U.S. regulators may help it adapt quickly to shifting compliance standards in the crypto sector.
UPDATE (April 1, 14:15 UTC): Updates to reflect that CoinShares previously traded on Nasdaq Stockholm


Ripple’s Digital Asset Accounts and Unified Treasury let corporates manage fiat, RLUSD, XRP and other tokens inside existing treasury systems, targeting on‑chain cash and stablecoin demand.
Summary
- Ripple has launched Digital Asset Accounts and Unified Treasury, a crypto fund-management stack for corporate finance teams.
- The platform lets enterprises manage fiat, RLUSD and XRP alongside other digital assets within existing treasury workflows.
- The launch builds on Ripple’s acquisition of GTreasury and targets rising demand for on-chain cash and stablecoins in corporate treasury.
Ripple has unveiled an enterprise-grade cryptocurrency fund-management system designed to let corporate finance teams manage fiat and digital assets on a single platform, in its latest push beyond cross-border payments into full-stack treasury infrastructure. The new stack, branded Digital Asset Accounts and Unified Treasury, allows companies to oversee assets such as RLUSD and XRP directly within existing treasury systems, without the need for separate wallets, exchanges or third-party custodians, according to a report from Decrypt.
The system embeds crypto rails into conventional treasury workflows, effectively turning tokenized balances into another line item alongside existing cash and securities positions. Ripple said the integration “supports corporate finance teams in managing fiat and digital assets on the same platform,” lowering onboarding frictions for enterprises that want exposure to stablecoins and on-chain liquidity but are unwilling to re-architect their internal controls around consumer-grade wallets. The release leverages Ripple’s earlier acquisition of corporate treasury platform GTreasury, a deal the company framed at the time as a way to “embed crypto capabilities into mature corporate financial infrastructure” and plug directly into CFO tech stacks, as previously reported by Decrypt and The Financial Times.
Shift from remittances to on-chain cash management
Ripple’s move comes as stablecoins and tokenized deposits are increasingly used for working capital and cross-border settlement, rather than purely speculative trading. In an earlier interview with Bloomberg, Ripple CEO Brad Garlinghouse argued that “on-chain cash management and real-time liquidity” would be the next major adoption wave for digital assets, as corporates look for faster settlement and programmability without taking on directional crypto risk. By offering a unified treasury view over fiat, RLUSD, XRP and other digital balances, Ripple is positioning its stack as a direct competitor to bank-led tokenization platforms and infrastructure from players like JPMorgan’s Onyx, which already processes trillions of dollars in tokenized intraday repo and payments flows, according to public filings reported by Bloomberg.finance.
In parallel, on-chain cash tools have been gaining traction across the broader market. A recent Forbes analysis of prediction and on-chain markets noted that institutional demand for programmable dollar exposure helped push real-world asset and stablecoin-related protocols to more than $13 billion in monthly volumes by late 2025. Against that backdrop, Ripple’s enterprise treasury product signals a deliberate shift: from being seen primarily as a remittances company tied to XRP price cycles, toward becoming a vendor of compliant, plug-in crypto infrastructure for corporate finance teams that increasingly treat tokenized dollars as part of their core liquidity stack.


eToro has secured a New York BitLicense and money transmission license, reopening crypto trading to New Yorkers and extending its US coverage to 48 states after a 2024 SEC settlement.
Summary
- eToro has secured both a New York BitLicense and a money transmission license, opening its crypto platform to residents of New York.
- The approvals mean eToro now offers cryptocurrency trading in 48 US states, following a $1.5 million settlement with the SEC in 2024.
- The company calls New York “the heart of the financial markets” and frames the move as a strategic milestone in its US expansion.
Online brokerage and social trading platform eToro has obtained a coveted New York BitLicense and a parallel money transmission license, clearing the way for residents of the state to trade cryptocurrencies on its platform for the first time. The twin approvals from the New York State Department of Financial Services (NYDFS) mean eToro’s crypto offering now reaches 48 US states, according to a report from Crowdfund Insider cited by ChainCatcher.
Announcing the launch, Andrew McCormick, head of eToro’s US division, said that “New York is the heart of the financial markets and a hub of innovation,” describing the expansion as “both a strategic milestone and a reflection of our commitment to responsibly advancing the next generation of financial market accessibility.” NYDFS’s BitLicense regime, introduced in 2015, remains one of the strictest state-level crypto frameworks in the US, with only a limited number of exchanges and custodians approved over the past decade, as repeatedly highlighted by outlets such as Bloomberg and the Financial Times.finance.
The New York green light comes roughly two years after eToro resolved an enforcement action with the US Securities and Exchange Commission. In 2024, the company agreed to pay a $1.5 million civil penalty to settle charges that it operated as an unregistered broker and clearing agency, and subsequently delisted most crypto assets from its US platform while it overhauled its compliance controls. That retrenchment mirrored a broader regulatory crackdown on offshore-style token menus, with major venues trimming their listings in response to SEC and CFTC pressure, as detailed in earlier reporting by Bloomberg and the Wall Street Journal on post-2022 enforcement trends.finance.
Since then, eToro has adopted a more conservative US stance, focusing on a narrower range of assets and building out its compliance and surveillance stack to meet NYDFS standards. By securing the BitLicense, the firm joins a small club of global exchanges able to serve New York retail customers, preserving a regulatory moat that rivals without state approval cannot easily cross. For US users, the expansion means a familiar social-trading interface will now sit alongside licensed incumbents in the country’s most tightly regulated crypto market, while for the industry it offers a template for how post-enforcement platforms can re-enter New York — provided they accept heavier oversight and a slimmer token set.
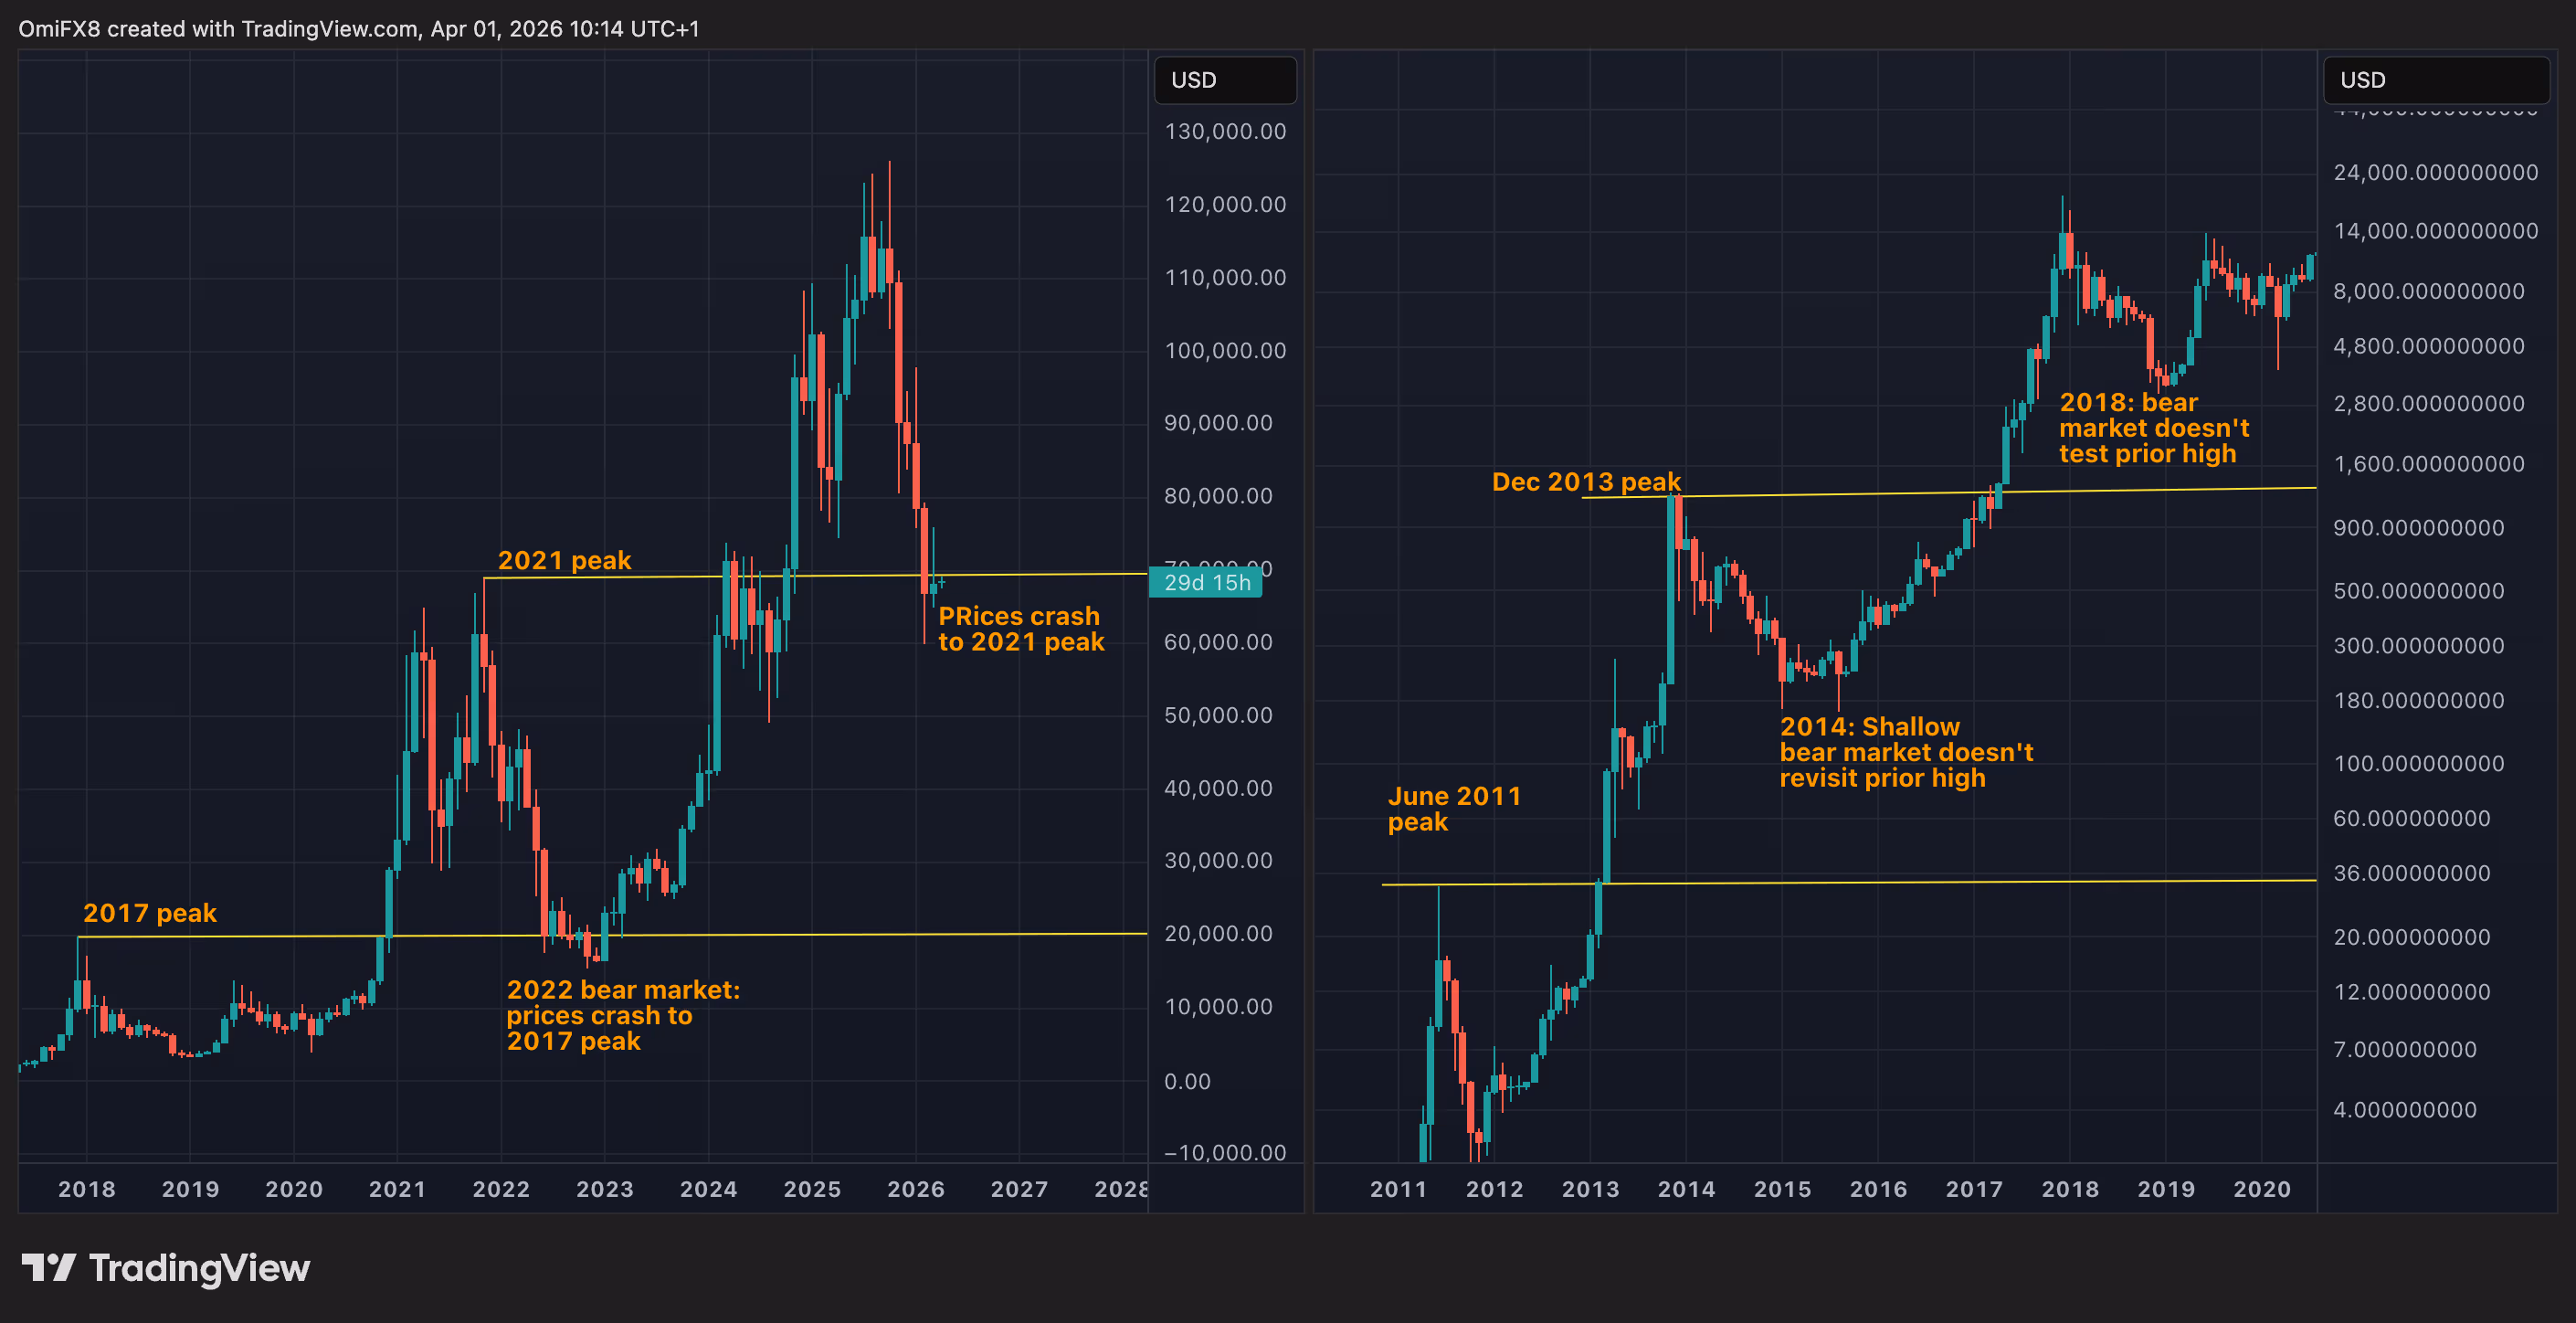
Since its inception, bitcoin has been like a daredevil climber scaling new heights, rarely looking back at the ledges it left behind. Its price seldom retraced to previous bull-market peaks, even during long, grueling bear markets.
But that pattern seems to have changed, suggesting that the market has matured, and the era of runaway, parabolic gains is behind us.
BTC trades near old peak
Bitcoin has been hovering around $70,000 since early February – well below the $126,000 peak of the 2023-2025 bull run.
That $70,000 mark is important because it was the record high in the 2019–2022 market cycle. In other words, this bear market has retraced all the way back to a previous summit.
This is unusual. In earlier bear markets, such as those in 2014 and 2018, bitcoin never returned to prior cycle highs. The exception was 2022, when prices dipped under the 2017 high of $20,000. At the time, analysts dismissed it as an anomaly, blaming crypto scams and massive deleveraging.
What makes the current retrace remarkable is that it’s happening without any extreme catalysts. The market has simply returned to a prior peak as part of the natural ebb of a bear cycle.

Slowing growth and the law of diminishing returns
Each new bull run isn’t generating the parabolic gains of the past. Pushing prices far beyond previous peaks is getting harder, which makes retraces to old highs more natural. In other words, previous peaks are no longer untouchable.
This is a clear example of the law of diminishing returns. As bitcoin becomes more expensive, moving prices higher requires ever-larger sums of capital. The days when modest inflows could trigger massive rallies are largely behind us, making price movements more measured and predictable.
Looking at historical growth highlights this trend:
- The 2013 peak was 38 times higher than 2011.
- The 2017 peak was 16 times higher than 2013.
- By 2021, the increase slowed to just 3 times the 2017 level.
- The 2025 peak of over $126K was less than twice the 2021 peak.
While prices are still rising, the pace of growth is steadily slowing.
Institutionalization and broader market participation
Part of this slowdown comes from the institutionalization of Bitcoin and the growth of the derivatives market. Traders now have structured ways to bet on volatility, timing, and market direction, not just price increases. This broader participation has tempered extreme swings.
This is very different from the pre-2020 era, when trading was largely limited to buying and selling on the spot market. Back then, only bullish believers of bitcoin actively participated, often jumping in at the first sign of a dip.
Behavioral patterns and what’s next
Old peaks often act as strong support levels due to a behavioral concept called anchoring bias, where traders fixate on previous highs as reference points.
Many who missed the initial breakout tend to buy when prices return to these familiar levels, fueling the next leg of a bull run. This behavioral tendency, combined with the self-reinforcing nature of support and resistance, helps explain why the recent downtrend has stalled around $70,000.
A strong bounce from this level could signal that the bear market has run its course, similar to late 2022, when the downtrend ended around $20,000.
However, if the law of diminishing returns is any guide, the next uptrend may be more measured and “tradfi-like,” rather than the frenzied rallies of the old speculative days.

Shiba Inu is trading at $0.00000597, up 0.93% in the last 24 hours, a modest price bounce that masks a bruising -4.4% seven-day slide, and the prediction is not looking good. The dog coin that minted actual millionaires in 2021 is now fighting to hold a six-zero price handle.
The 24-hour rebound followed a technical defense of the $0.0000056 support zone after six consecutive red sessions. Trading activity surged 70%, accompanied by a positive buy-sell delta of 27.4 billion SHIB.
On-chain data confirmed net exchange outflows of 112–125 billion SHIB, stripping near-term selling pressure from the order book. That confluence, volume spike, positive delta, and exchange drain are historically the setup SHIB needs before a short-term leg higher.
But can SHIB print more millionaires at this level? Are memecoins’ communities no longer able to catapult a coin?
Discover: The best pre-launch token sales
Shiba Inu Price Prediction: Reclaim $0.000007 Before April Ends, or Dream Shattered?
Shiba Inu is consolidating just below the $0.000006 price resistance level, a line that has flipped from support to resistance over multiple sessions, dragging down bullish sentiment.
Key levels to track: support clusters at $0.0000056–$0.0000059, with resistance stacked at $0.0000060–$0.0000065 and a more meaningful ceiling near the historical $0.000018–$0.000020 range.
Three scenarios are currently in play:
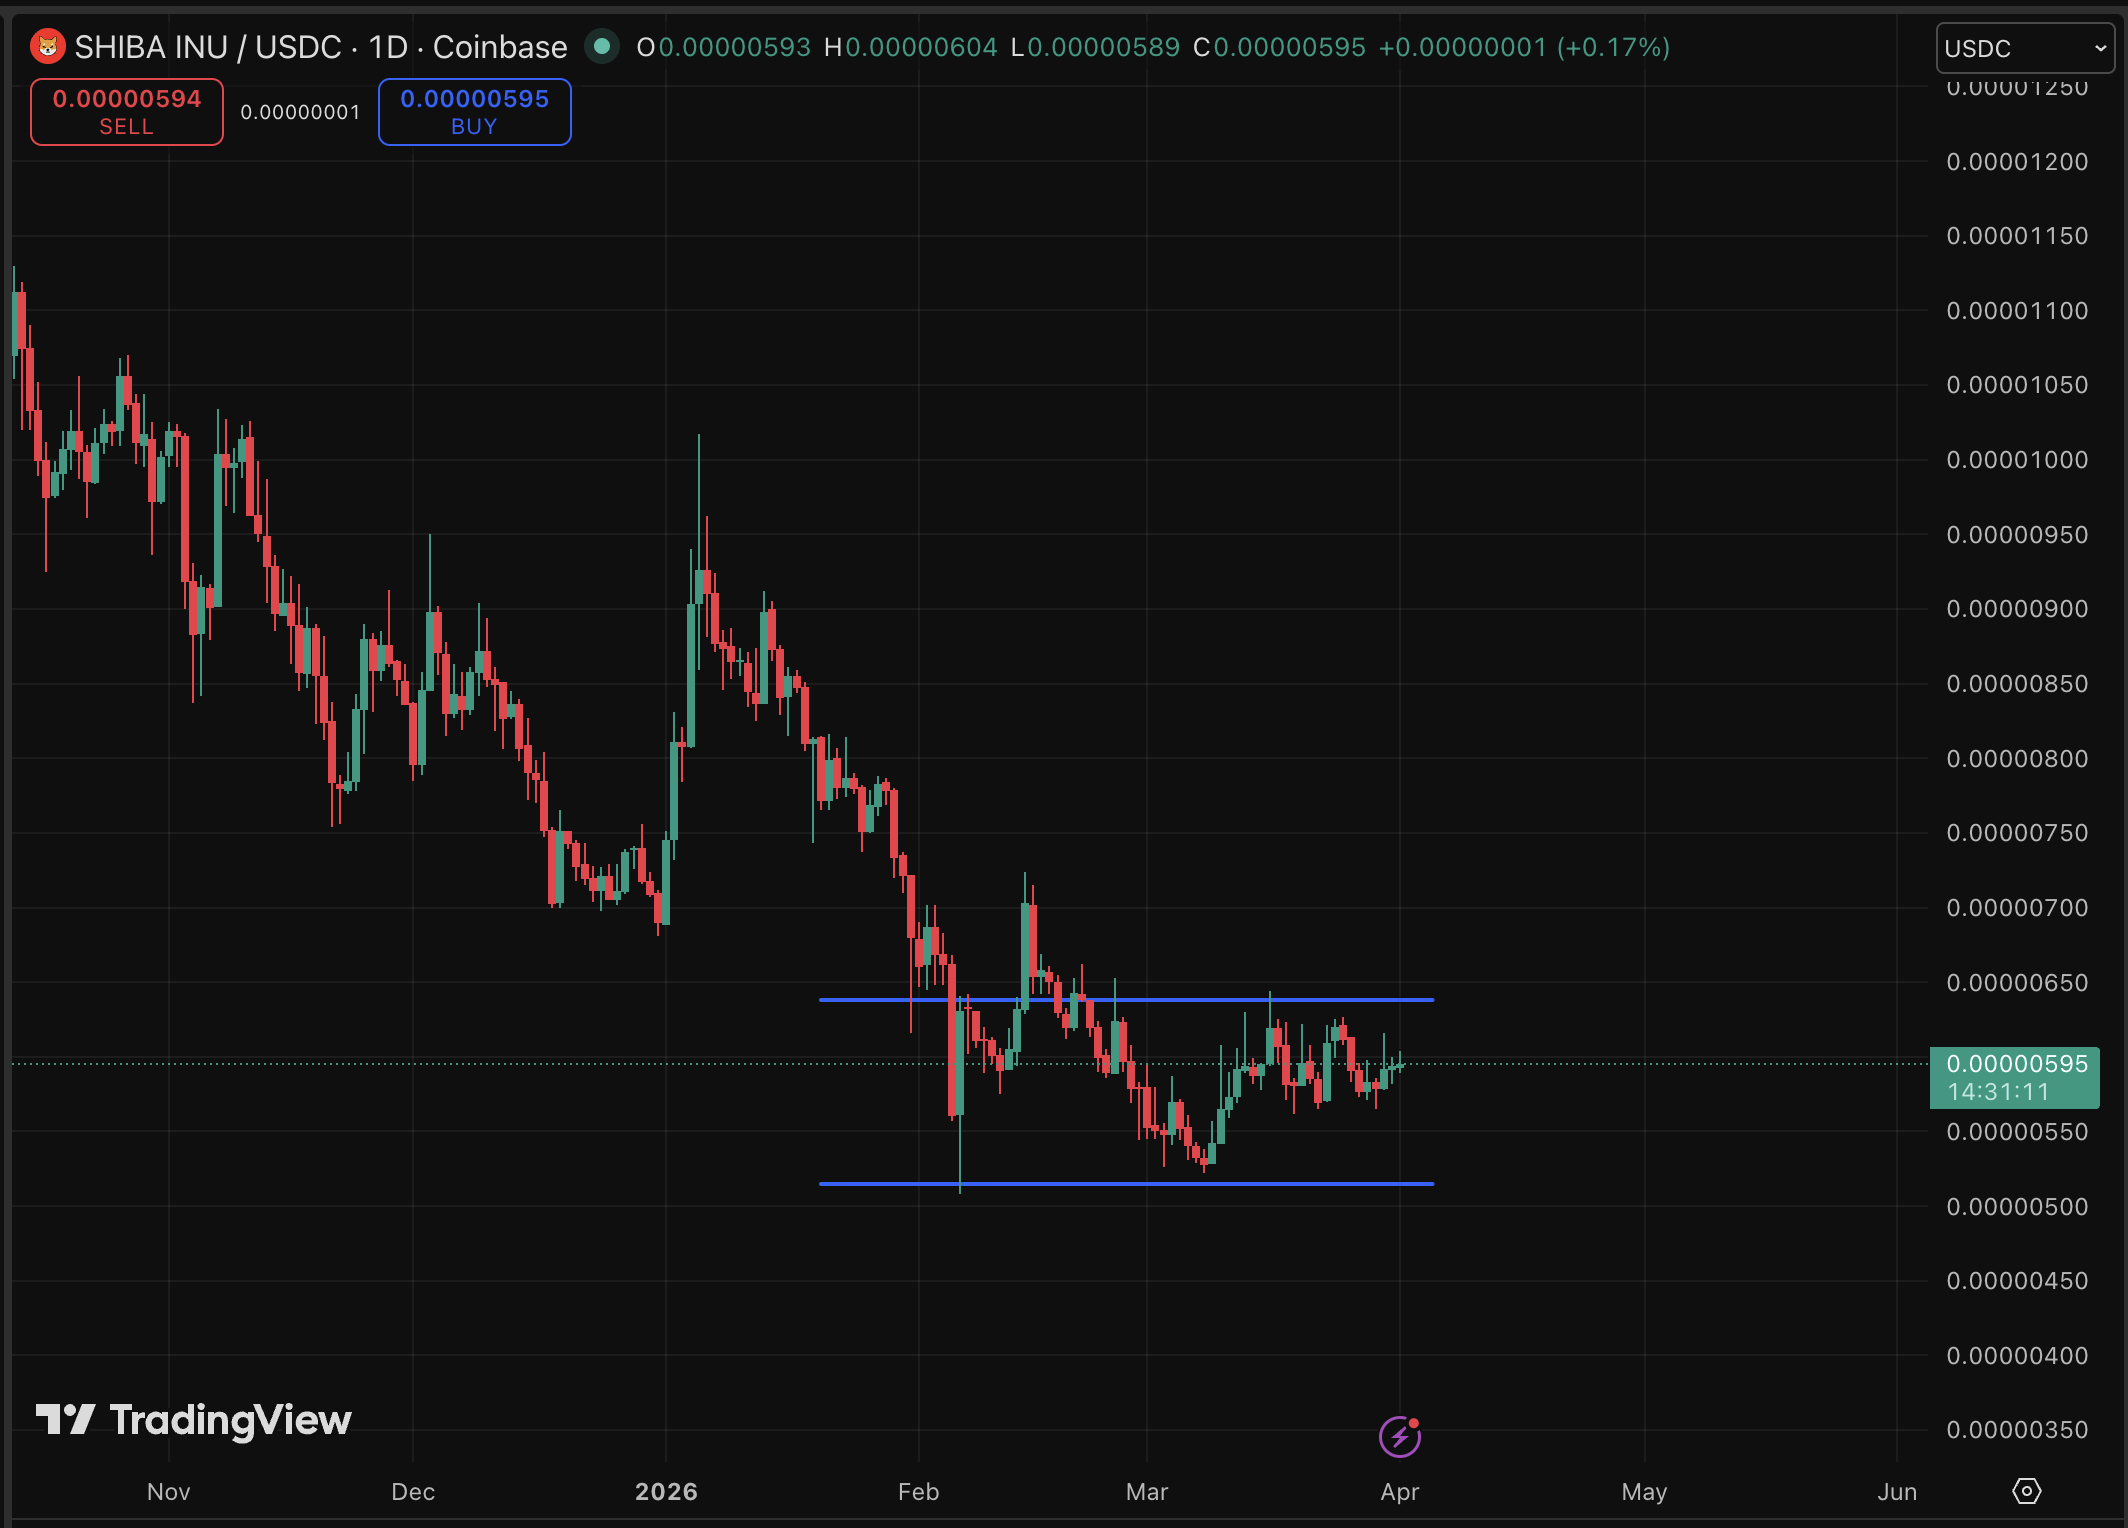
- Bull case: SHIB flips $0.000006 with sustained volume, targets $0.0000065–$0.000007 within days. Exchange outflows accelerating would confirm this path.
- Base case: Price consolidates between $0.0000057–$0.0000062, grinding sideways as macro uncertainty limits conviction.
- Bear case: Failure to hold $0.0000056 opens a drop toward $0.0000050, invalidating the current rebound thesis entirely.
The 589 trillion SHIB still in circulation remains the structural ceiling on any millionaire-making moon run. People have noted SHIB’s sensitivity to external catalysts. The October 2024 Elon Musk effect pushed volume to $145 million in 48 hours, but that event is, by definition, unpredictable.
SHIB could deliver decent returns. Delivering millionaire returns from this market cap? That math gets harder every cycle.
Discover: The best crypto to diversify your portfolio with
Maxi Doge Targets Early Mover Upside as Shiba Inu Tests Key Levels
Here’s the uncomfortable reality SHIB holders face: at today’s price, the multiplier required to turn a $1,000 stake into a million dollars simply doesn’t exist at current valuations without a market cap that would rival entire national economies. It’s arithmetic.
Traders chasing the next generational meme coin trade are increasingly looking at earlier-stage projects where the supply-to-price math still works in their favor.
Maxi Doge ($MAXI) is one presale capturing that rotation. The project has raised more than $4.7 million at a current price of just $0.0002811. The concept leans hard into gym-bro meme culture with holder-only trading competitions, leaderboard rewards, and a Maxi Fund treasury dedicated to liquidity and partnerships.
Recent capital flows into the presale have drawn comparisons to early-stage SHIB momentum. Staking is live with a 66% APY bonus. For traders weighing SHIB’s structural ceiling against earlier-stage upside, researching Maxi Doge is worth the ten minutes.
This article is not financial advice. Crypto investments are highly volatile and speculative. Always conduct your own research before investing.
The post Shiba Inu Price Prediction: Time to Say Goodbye To Millionaire Dreams? appeared first on Cryptonews.
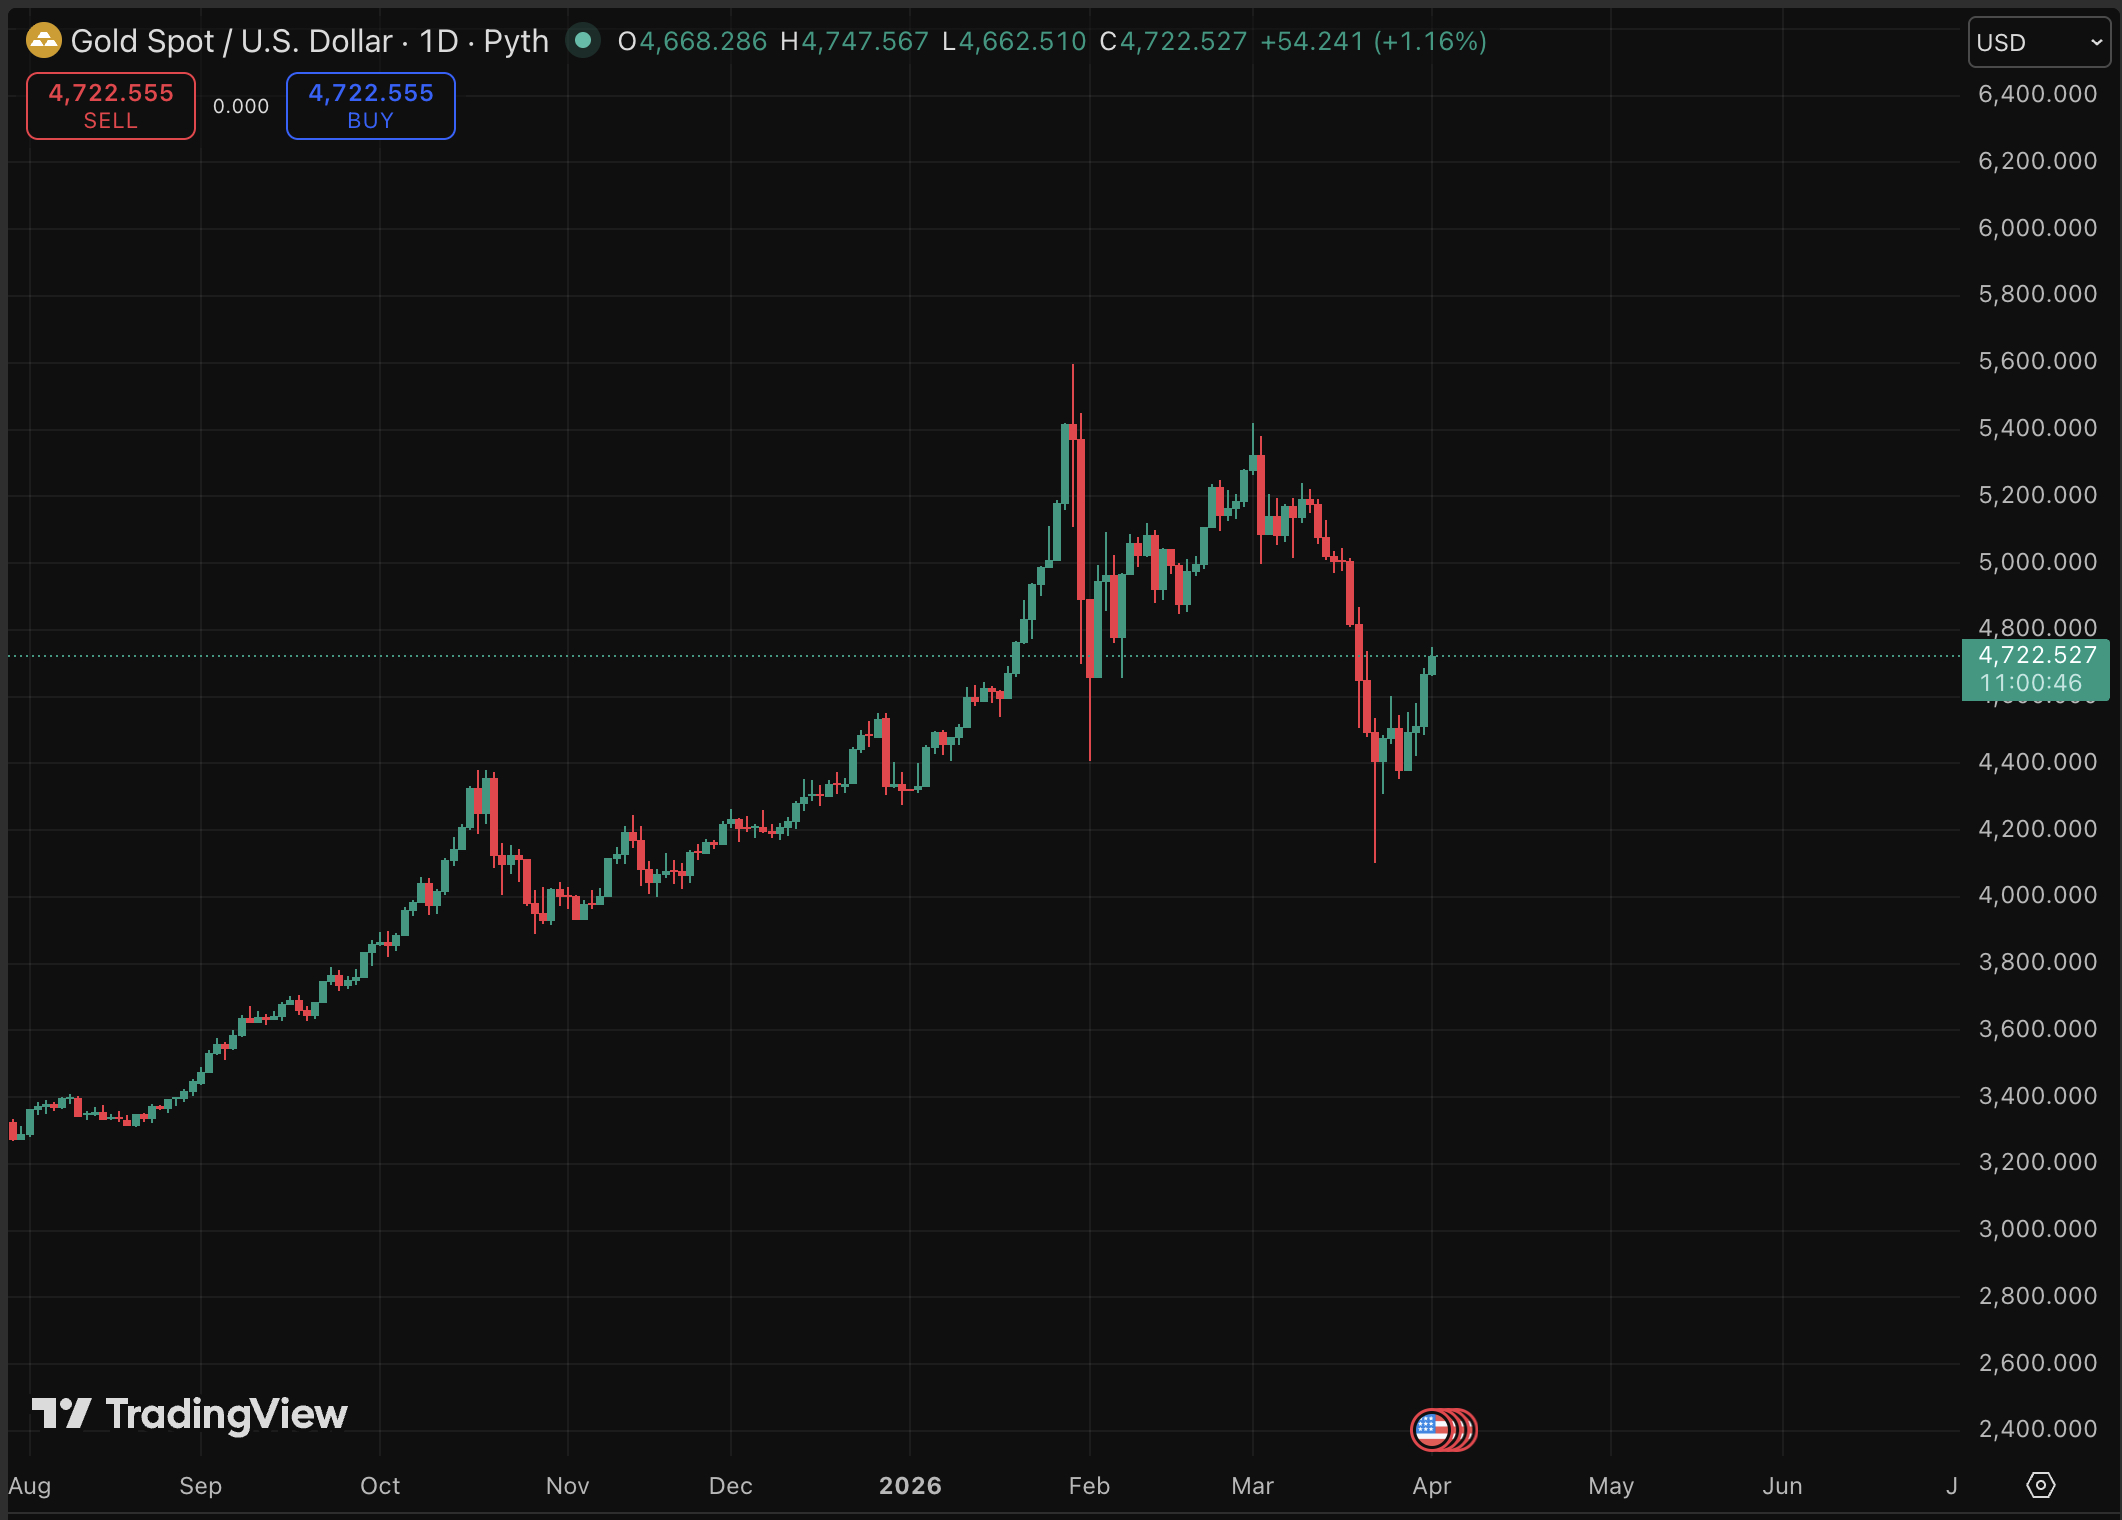
Gold is hemorrhaging value. Spot gold price climbed 2.2% to $4,687/oz, but that bounce barely registers against a 12% monthly collapse that has the metal on track for its worst monthly performance since October 2008, which resulted in a more grim-looking prediction.
The safe-haven narrative is cracking.
The catalyst yesterday was a Wall Street Journal report that President Donald Trump signaled willingness to end the U.S. military campaign against Iran, even if the Strait of Hormuz remains partially closed.
“Gold prices are bouncing in early Asia-Pacific trade after U.S. President Donald Trump told aides he is willing to end the U.S. military campaign against Iran… That triggered a risk-on response from financial markets,” said Ilya Spivak, head of global macro at Tastylive.
U.S. gold futures for April delivery gained 1.2% to $4,611.30 in tandem. The dollar eased, providing additional tailwind to greenback-denominated bullion.
Despite the daily reprieve, the macro structure driving gold’s rout remains intact, and Fed policy signals from Powell continue pointing toward a higher-for-longer rate environment that structurally penalizes non-yielding assets.
Discover: The best crypto to diversify your portfolio with
Gold Price Prediction: Can XAU Reclaim $5,000 Before the Fed Blinks?
Today’s relief rally puts spot gold close to $4,700, up 1.5% intraday. This figure looks strong in isolation against March’s 13% drawdown from prior highs above $5,000.
Spivak flagged a critical technical signal: “Gold has been stabilizing for about a week now, with a rally last Friday a particular standout. That came alongside a drop in Treasury yields that seems to suggest the markets are starting to see the Iran war as a recession risk.”
Falling yields reduce the opportunity cost of holding gold, that’s the bull mechanism. Quarterly gains still hold at approximately 5%, confirming the longer-term trend hasn’t broken.

For the gold price, if de-escalation holds, Treasury yields slide further, Fed language softens on inflation, gold can re-targets $4,800–$5,000 resistance recovery. Goldman Sachs maintains a $5,400/oz end-2026 target anchored by central bank accumulation and eventual easing.
However, if energy prices re-accelerate, the Fed signals no cuts through year-end, and Hormuz disruption deepens, a break below $4,300 opens the door to the low $4,000s.
Discover: The best pre-launch token sales
LiquidChain Targets Early Mover Upside as Gold Tests Key Resistance
Gold’s struggle to reclaim $5,000 raises an uncomfortable question for capital allocators: if the canonical safe haven is down 13% in a month, where does risk-adjusted opportunity actually live?
For us, watching macro dysfunction erode established stores of value, early-stage infrastructure plays with asymmetric upside are drawing renewed attention, particularly those solving real structural problems across fragmented liquidity markets.
A new layer emerges. Only a few see it first. — LiquidChain (@getliquidchain) March 24, 2026
The future is LiquidChain  ⟁https://t.co/vqvBcdSj94 pic.twitter.com/R7ZeZ0NPGl
LiquidChain ($LIQUID) is a Layer 3 infrastructure project positioning itself as the cross-chain liquidity layer — fusing Bitcoin, Ethereum, and Solana liquidity into a single execution environment. The architecture centers on four components: Unified Liquidity Layer, Single-Step Execution, Verifiable Settlement, and Deploy-Once Architecture, letting developers deploy once and access all three ecosystems simultaneously.
The presale is currently priced at $0.01445, with more than $630K raised to date, with more than 1700% APY in staking bonus.
For those looking for a gold alternative, research LiquidChain’s presale structure here.
This article is not financial advice. Conduct your own research before investing.
The post Gold Price Prediction: Worst Month in 17 Years fo Save Haven Rock appeared first on Cryptonews.

Jesse Spiro, the head of government affairs at stablecoin issuer Tether, will be chairing the organization of a crypto-backed Super political action committee (PAC) to “actively support candidates” in the 2026 US midterm elections and beyond.
In a Wednesday announcement, the Fellowship PAC, a committee that launched in August 2025 and later claimed to have raised “over $100 million” from undisclosed backers aligned with the crypto industry, said that Spiro would become chair ahead of its first political endorsements for the 2026 elections.
The PAC said that it would support candidates in favor of innovation, regulatory clarity for digital assets, and open markets.
”We have an opportunity to ensure the United States remains the global hub for builders, entrepreneurs, and technological progress,” said Spiro. “Fellowship PAC is committed to supporting leaders who understand what’s at stake and are willing to act.”

The addition of a crypto-aligned Super PAC with potentially hundreds of millions of dollars could be used to influence US elections. The Fairshake PAC, backed by Ripple Labs and Coinbase, spent more than $130 million on media buys in the 2024 elections, and reported having $193 million ahead of the 2026 midterms.
Related: Crypto awareness tops 80% among young people in UK: Coinbase survey
Fellowship filed a statement of organization with the US Federal Election Commission (FEC) on Aug. 7 and had reported no contributions or expenditures as of Dec. 31. Although the PAC has claimed to have more than $100 million in its war chest, it was unclear at the time of publication who may be responsible for funding the committee.
Cointelegraph did not receive an immediate response to requests for comment by the PAC.
Money from the crypto industry may already have been a factor in US state primaries, which kicked off in March. Although some of the industry-aligned candidates did not win their races in Illinois, there are more than seven months before the 2026 general election, giving PACs like Fairshake, Fellowship, and others the opportunity to sway voters.
A debate on stablecoin yield is still shadowing a congressional crypto bill
Tether, the issuer behind the largest stablecoin by market capitalization, USDt (USDT), is likely to be affected by legislation being considered by US lawmakers in the Senate.
The House of Representatives passed a digital asset market structure bill in July 2025 called the CLARITY Act, which has effectively been stalled in the Senate amid debate over stablecoin rewards, tokenized equities, ethics and other issues.
As of Wednesday, the Senate Banking Committee had not rescheduled a markup on the bill which it postponed in January. It’s unclear if or when the bill could head to the full chamber for a vote.

Crypto markets rose as oil prices retreated under $100 a barrel on growing expectations that the conflict could wind down within weeks.

Bitcoin 2026 Overview
Bitcoin traded near $68,000 as organizers confirmed a major addition to Bitcoin 2026. The event will host Afroman as a headline speaker and performer. The conference will take place April 27–29 in Las Vegas.
The announcement signals a growing overlap between culture and decentralized technology narratives. It also reflects Bitcoin’s expanding role beyond finance into expression and ownership debates. Organizers expect strong engagement from global attendees and industry participants.
The event will occur at The Venetian Resort and feature hundreds of speakers. More than 30,000 attendees are expected to participate across multiple stages. The program will combine education, entertainment, and industry networking.
Legal Victory Shapes Afroman’s Bitcoin 2026 Appearance
Afroman gained renewed attention after a legal battle tied to a police raid in 2022. Authorities searched his home but reportedly found no evidence of wrongdoing. He later used personal footage to create music and commentary about the incident.
The conflict grew when some of the officers took a defamation case against him asking for monetary damages. They asked, as well, to get rid of the artist’s content on public platforms. Despite that, the jury acquitted Afroman and put an end to the case. The result opened up more talk about the rights of creators and the need for public accountability. Afroman saw the verdict as a larger victory for freedom of speech. This viewpoint is in fact very similar to the core philosophy of Bitcoin. More and more, the culture around Bitcoin is making its way into art and expression. The supporters of Bitcoin, as a rule, underline the freedom, openness, and getting the full control over the personal content. Such principles have left their mark not only on the culture but also on the domain of arts. Consequently, in a bold step, the current events deliberately feature creators boldly confronting the authorities and institutions.
Afroman’s involvement reflects the shift in the ecosystem’s trajectory. His unique style is a fusion of music, humor, and insightful commentary on society. Such a message deeply resonates with an audience that supports decentralization of systems. Bitcoin event organizers keep identifying the events as technical gatherings only. They want to put the spotlight on real-life applications and cultural relevance. In this way, the appeal will be extended not only to the developers and financial players.
Exhibition and Global Conference Growth
The conference will feature Afroman’s American flag suit as part of a specially curated art exhibition. It is a protest and resistance symbol from his legal fight. It is also going to be auctioned on a special platform. The exhibition will present topics such as power, reaction, and artistic rebellion. It will feature works tied to Bitcoin’s short but impactful history. These elements aim to connect technology with human stories.
Bitcoin Conference continues to expand its global footprint. Earlier editions managed to draw tens of thousands of people from various regions. The next events are scheduled to cover Asia, Europe, and the Middle East. The Las Vegas meeting will act as a main center for the 2026 programs. It will unite developers, entrepreneurs, and artists. Such a blend further helps positioning Bitcoin as a financial and social movement.
BitMine Immersion Technologies (BMNR) stock jumped 12% on March 31 to close at $19.78, its strongest single-session gain in a while, as a sharp shift in options positioning coincided with B. Riley raising its price target to $33 from $30.
The move pushed BitMine stock close to the upper trendline of a descending channel that has contained the price since early December. However, the nature of the rally and the absence of institutional buying pressure raise the question of whether this attempt will succeed where prior ones failed.
A Short Squeeze Drove the 12% Move, Not Fresh Buying
The put-call ratio, which compares bearish put option volume to bullish call option volume, tells the story of what happened between Friday and Monday.
On March 27, the volume ratio spiked to 1.04, meaning put trading exceeded call trading for the first time in weeks. The open interest ratio sat at 0.47. That is aggressive bearish positioning heading into the weekend. By March 31, the volume ratio had collapsed to 0.52 while the open interest ratio remained flat at 0.47.
Want more insights like this? Sign up for Editor Harsh Notariya’s Daily Crypto Newsletter here.
The unchanged open interest means no significant new positions were opened. The volume ratio collapse means existing bearish bets were being closed. That combination points to a classic short squeeze where traders covering put positions drove the BMNR stock price higher rather than new buyers entering with fresh conviction.
If the put-call ratio now rises again alongside rising open interest, it would signal new bearish positions being opened against the rally, which could stall the move on sentiment. However, the squeeze coincided with a fundamental catalyst that could extend the bounce.
ETH Treasury Growth and B. Riley’s $33 Target Support the Bull Case
BitMine added 71,179 ETH last week, its largest weekly purchase of 2026. That five-week buying streak pushed total holdings to 4.73 million ETH, representing 3.92% of Ethereum’s circulating supply. The company’s total crypto and cash treasury now stands at $10.7 billion, with approximately $177 million in annualized staking revenue.
B. Riley raised its BitMine stock price target to $33 from $30 on March 26, maintaining a Buy rating. The firm cited the launch of MAVAN, BitMine’s institutional-grade Ethereum staking platform, and noted that approximately 67% of holdings are already staked with potential annualized rewards of roughly $285 million at full deployment.
With Ethereum up 3.6% over the past 24 hours, the BitMine stock price has an external tailwind. ETH strength directly benefits BitMine’s treasury valuation and staking revenue outlook.
Yet the Chaikin Money Flow (CMF), a volume-weighted indicator that tracks institutional buying and selling pressure, remains below the zero line on the daily chart. Between February 23 and March 30, CMF trended lower alongside price.
That pattern shows large money has not backed this rally with sustained buying. The bounce is running on short covering and Ethereum momentum rather than direct institutional accumulation into BMNR shares.
BitMine Stock Still Needs $21 to Confirm a Channel Breakout
Despite the short squeeze and fundamental tailwinds, the daily chart shows BitMine stock pressing against the same upper trendline of a descending channel that has rejected every breakout attempt since December. Early January and mid-March also saw a failed attempt out of this 4-month trap.
A bullish divergence on the Relative Strength Index (RSI), a momentum indicator, does support the case for a broader reversal now. Between November 21 and March 30, price trended lower while RSI printed a higher low. That divergence suggests selling momentum is weakening even as price continued to fall. Combined with the Ethereum tailwind and MAVAN catalyst, it gives bulls a technical reason to stay engaged.
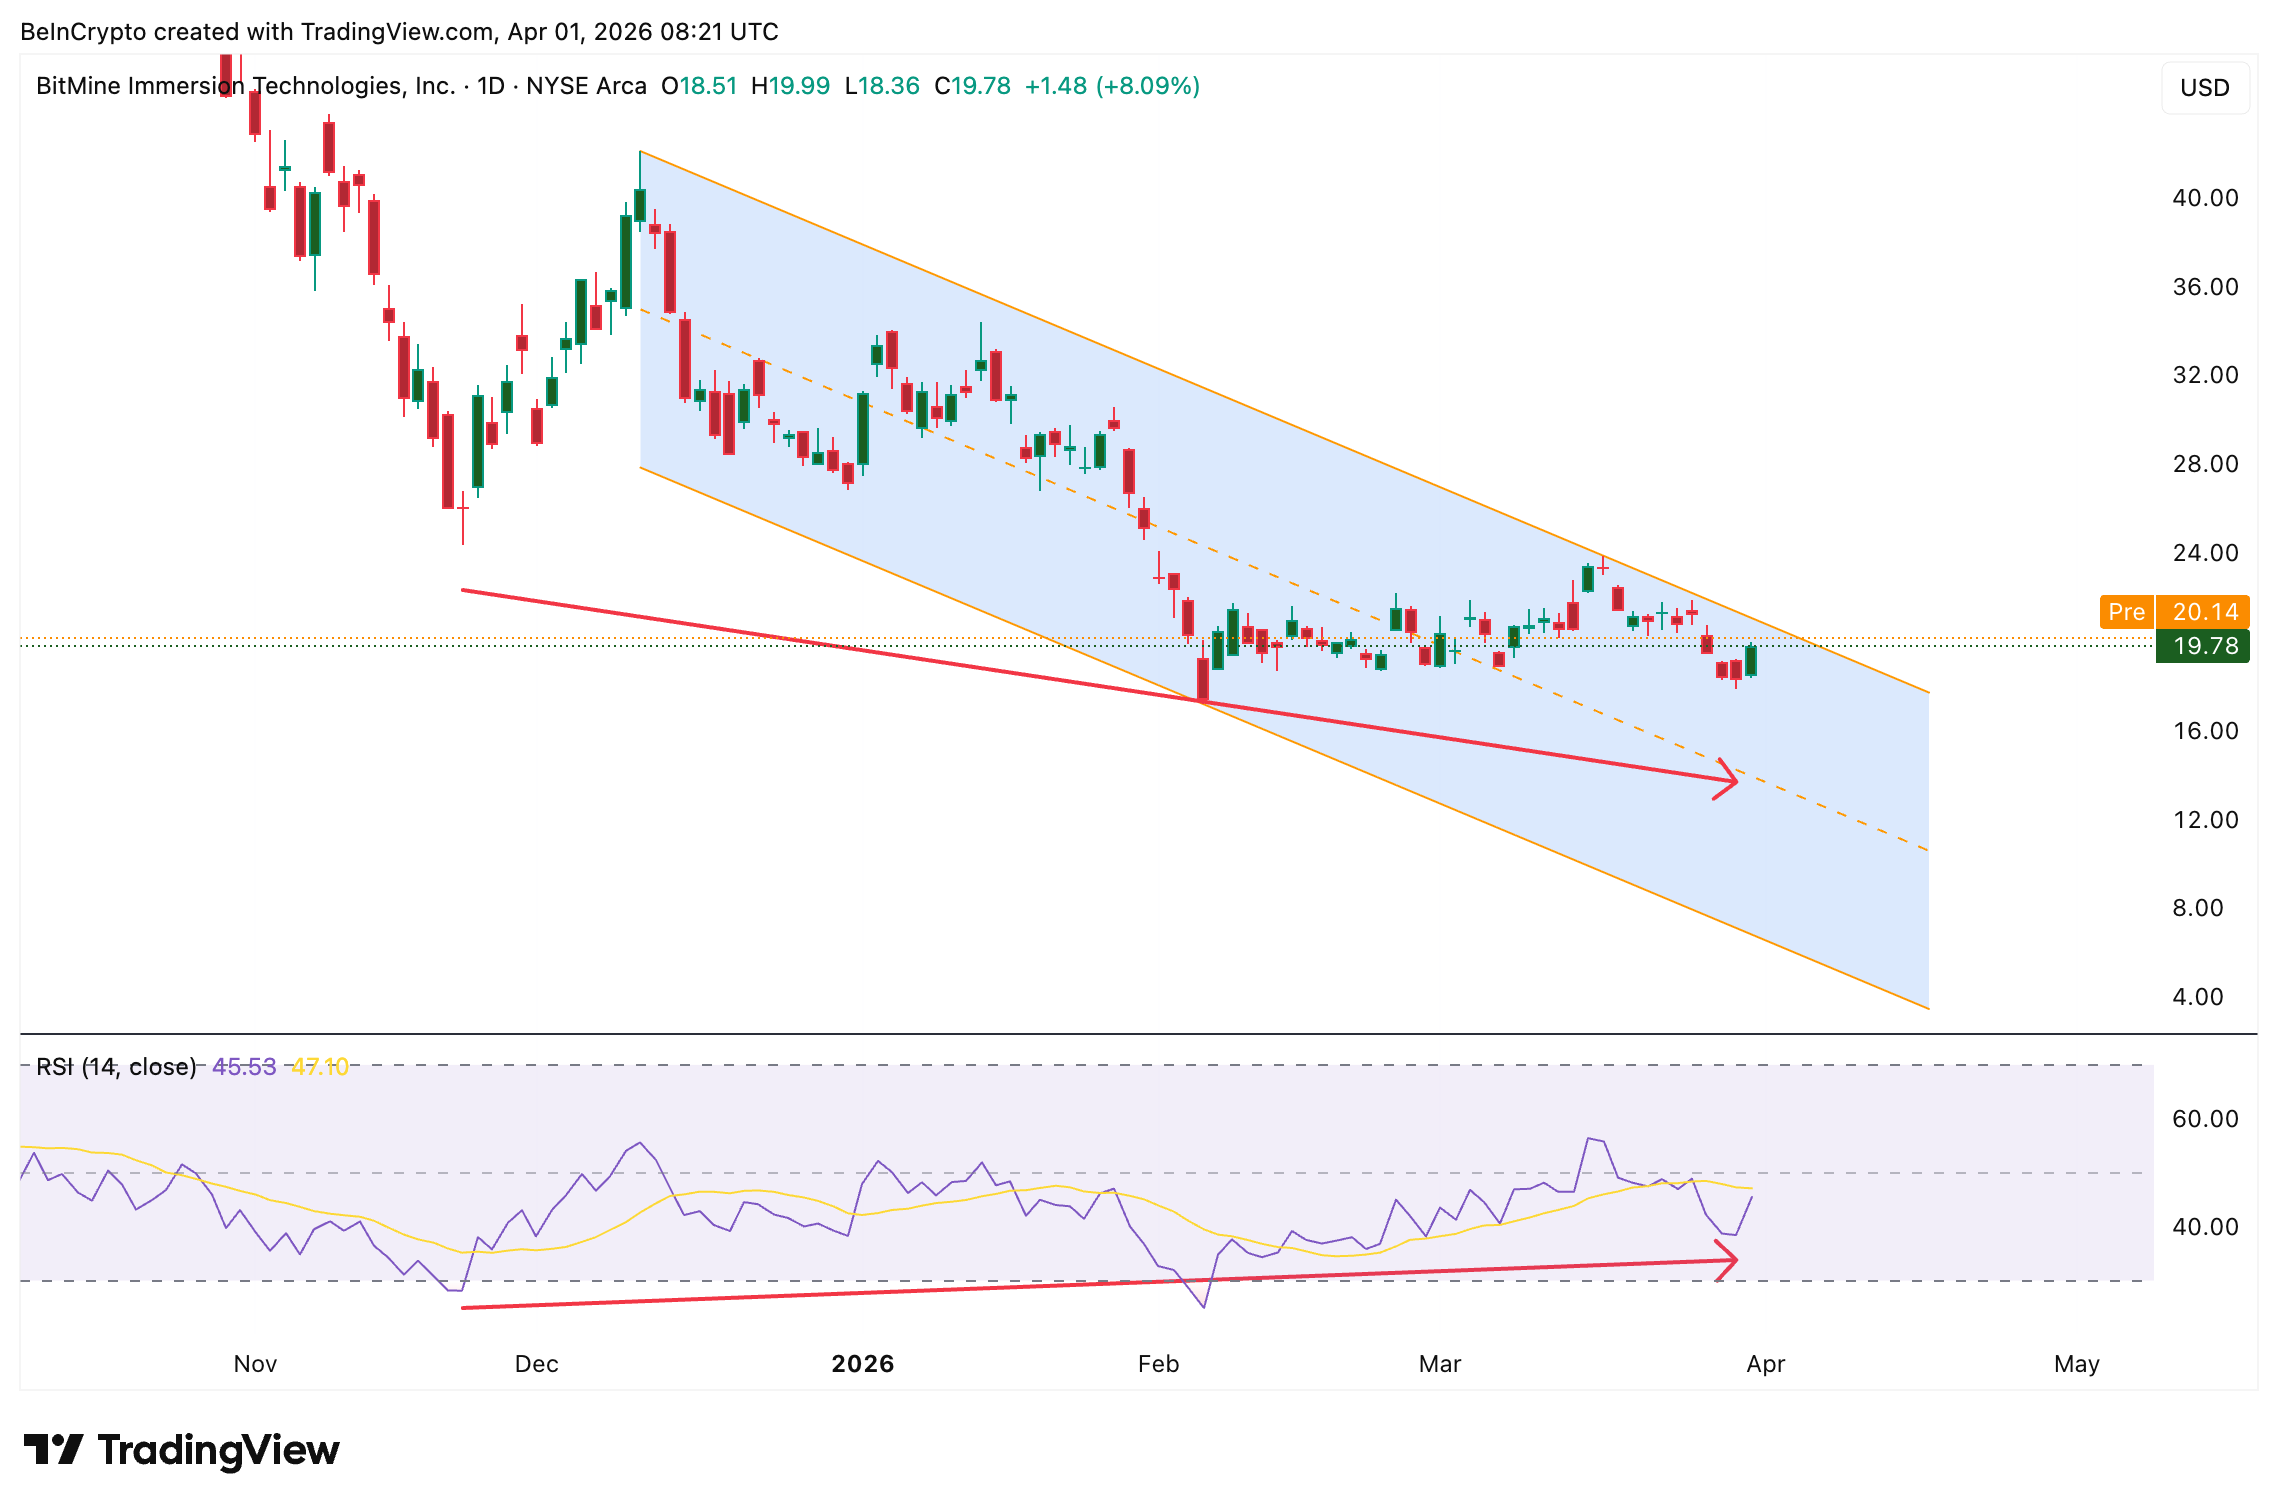
However, a daily close above $21.22 (the $21 zone) is needed to confirm that the upper trendline has broken. That level aligns with the 0.5 Fibonacci level and would represent a 7% move from the current close. A push above $22.01 would strengthen the breakout case and open a path toward $24.56 and potentially $28.69. Beyond that sits B. Riley’s upgraded target.
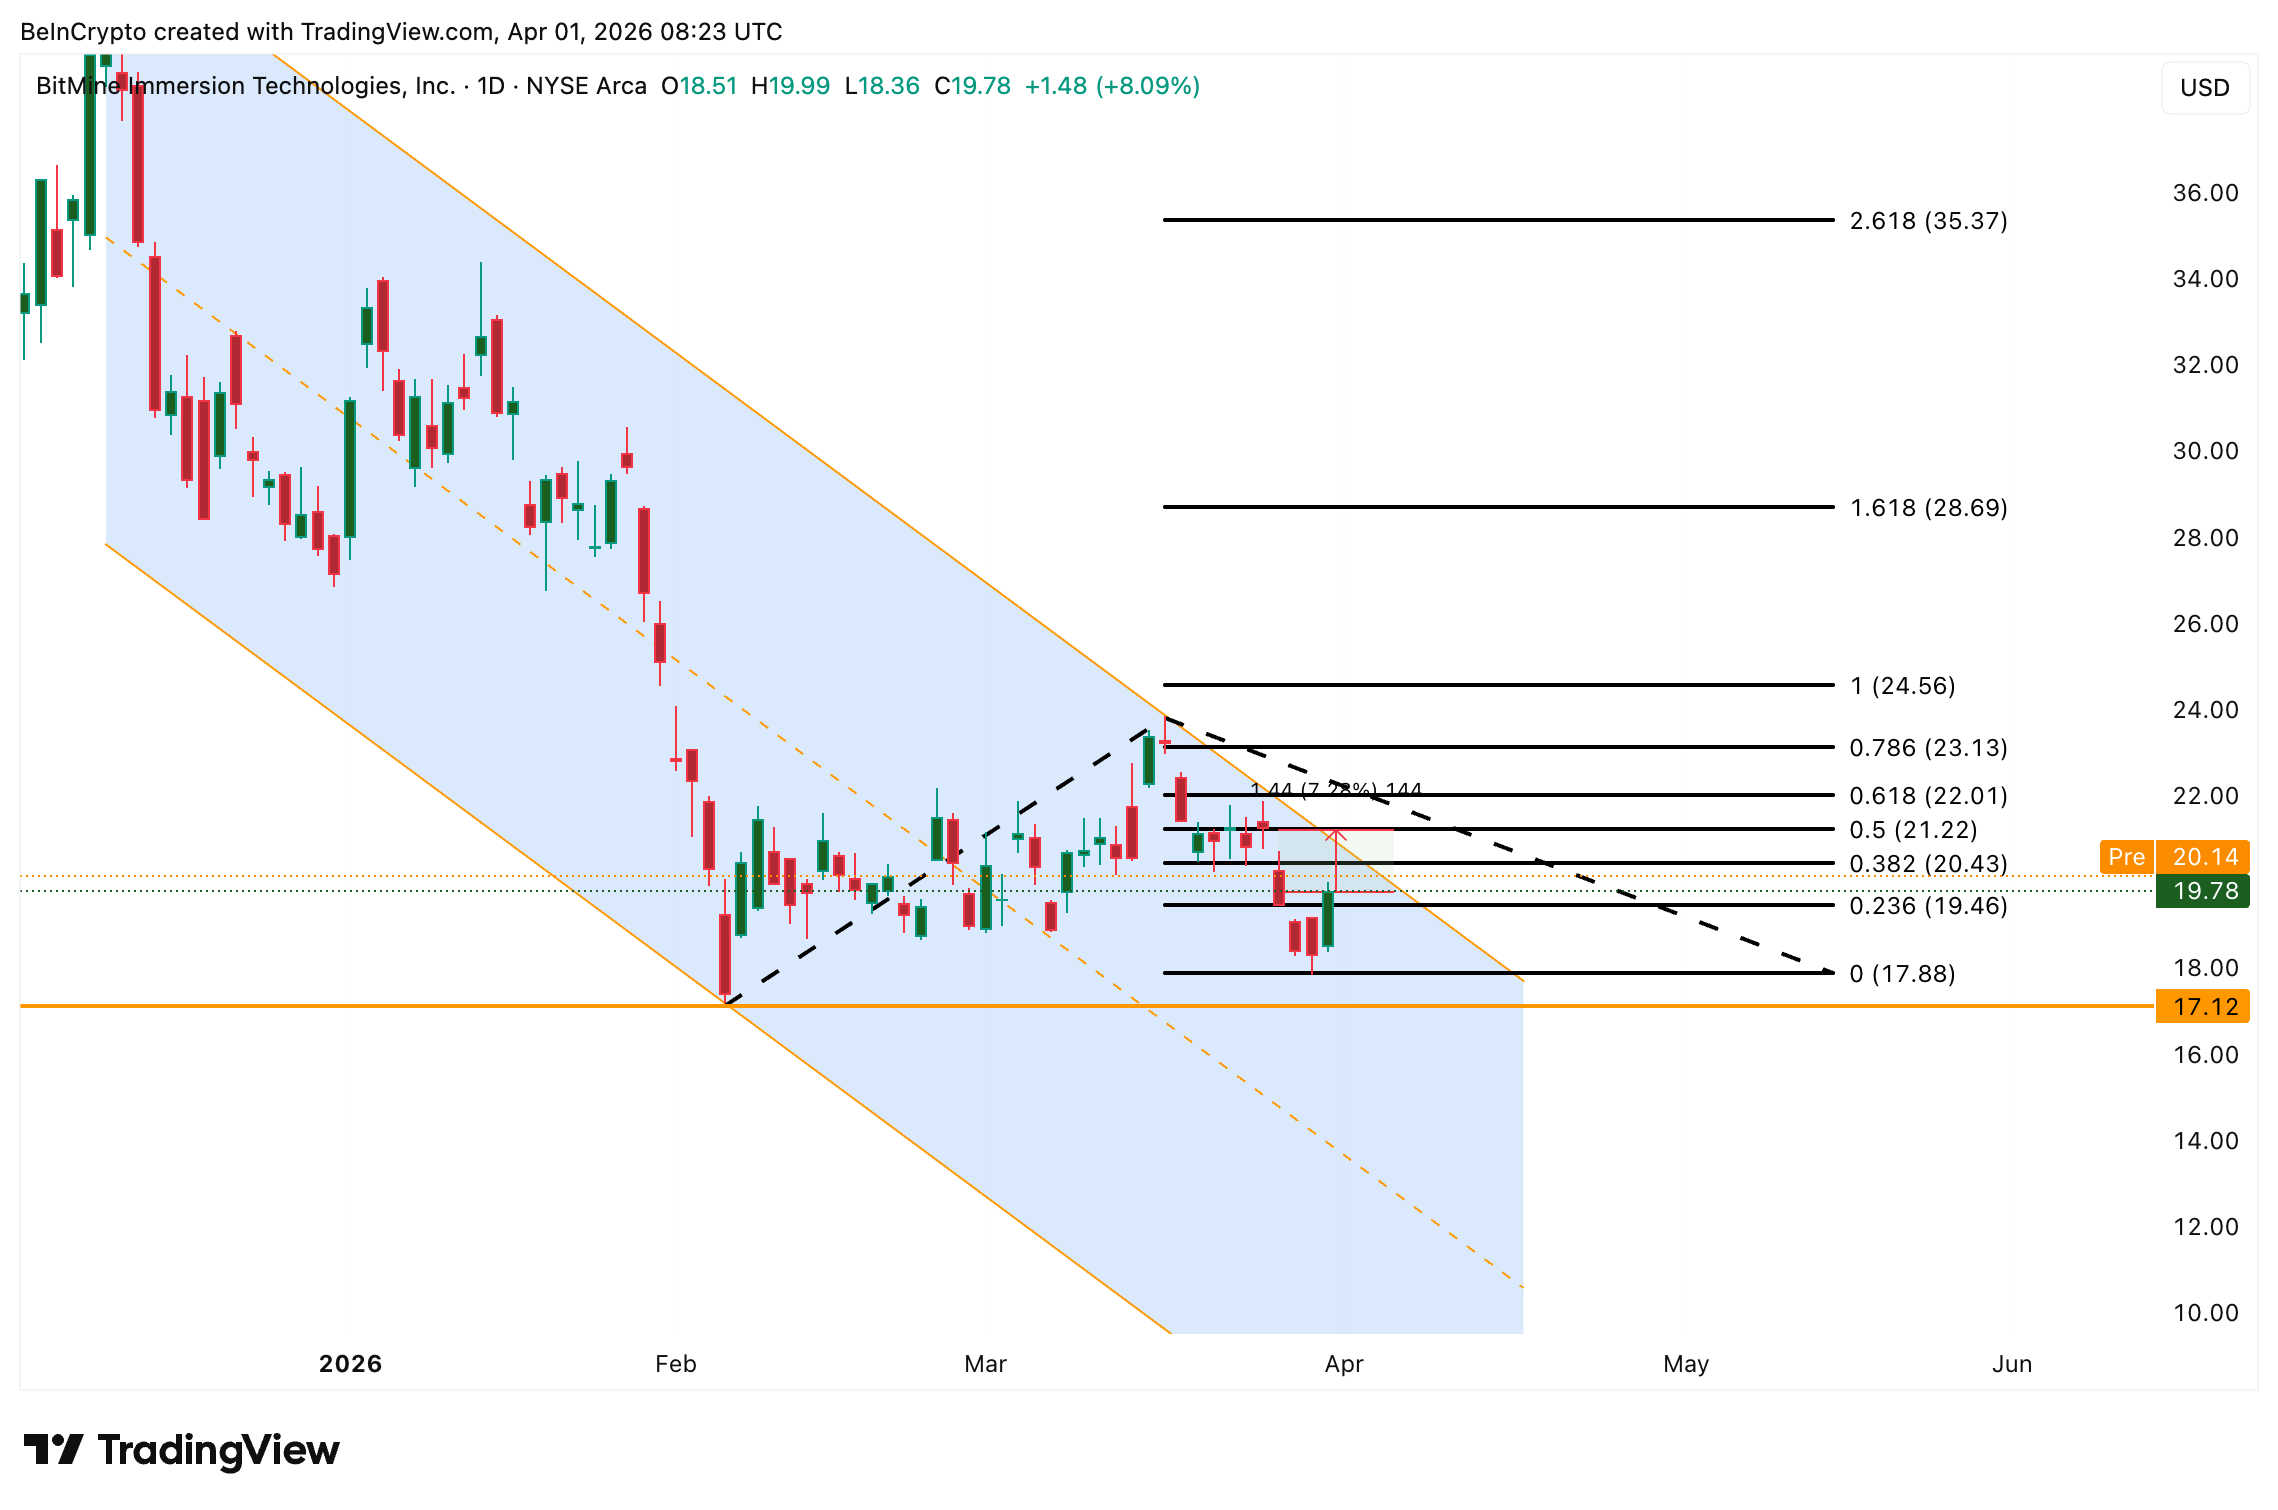
On the downside, failure to hold $19.46 would signal that the squeeze has exhausted itself. A close below $17.88 reopens the lower channel for BMNR stock and puts the $17.12 support at risk.
The $21 zone now separates a confirmed channel breakout fueled by ETH momentum and MAVAN staking revenue from another failed trendline rejection that sends BitMine stock price back toward $17.88.
The post BitMine Stock Gets a Bullish Upgrade, but a 4-Month Trap Still Holds appeared first on BeInCrypto.

Why Market Cap Won’t Matter For XRP

Chelsea ‘keeping close eye’ on Barcelona star after joining Liverpool in transfer race | Football
Black Hawk Acquisition receives Nasdaq notice for market value non-compliance


-

 News Videos7 days ago
Parliament publishes latest register of MPs’ financial interests
-

 Business6 days ago
Instagram, YouTube Found Responsible for Teen’s Mental Health Struggle in Historic Ruling
-
 Tech6 days ago
Intercom’s new post-trained Fin Apex 1.0 beats GPT-5.4 and Claude Sonnet 4.6 at customer service resolutions
-

 NewsBeat5 days ago
The Story hosts event on Durham’s historic registers
-

 Sports5 days ago
Sweet Sixteen Game Thread: Tide vs Michigan
-
Entertainment2 days ago
Fans slam 'heartbreaking' Barbie Dream Fest convention debacle with 'cardboard cutout' experience
-
 Entertainment4 days ago
Lana Del Rey Celebrates Her Husband’s 51st Birthday In New Post
-
Crypto World1 day ago
Dems press CFTC, ethics board on prediction-market insider trades
-

 Sports1 day ago
Tallest college basketball player ever, standing at 7-foot-9, entering transfer portal
-

 Crypto World42 minutes ago
Gold Price Prediction: Worst Month in 17 Years fo Save Haven Rock
-

 Tech3 days ago
The Pixel 10a doesn’t have a camera bump, and it’s great
-

 Entertainment7 days ago
HBO’s Harry Potter Series Will Definitely Fail For One Big Reason, And It’s Not J.K. Rowling Or Snape
-

 Tech2 days ago
EE TV is using AI to help you find something to watch
-

 Crypto World2 days ago
U.S. rule change may open trillions in 401(k) funds to crypto
-

 Tech1 day ago
How to back up your iPhone & iPad to your Mac before something goes wrong
-

 Fashion6 days ago
En Vogue in Brown Leather and Tailored Neutrals by Atelier Savoir, Styled by J Bolin
-

 Tech2 days ago
Apple will hide your email address from apps and websites, but not cops
-

 Politics2 days ago
Should Trump Be Scared Strait?
-

 Tech2 days ago
Flipsnack and the shift toward motion-first business content with living visuals
-

 Fashion6 days ago
What Are Your Favorite T-Shirts for the Weekend?
You must be logged in to post a comment Login