
Crypto World
Assets React As Fears of Weeks-Long Iran War Mount
Global markets are reacting sharply to rising geopolitical tensions in the Middle East, as reports suggest the US could be moving closer to a direct military confrontation with Iran.
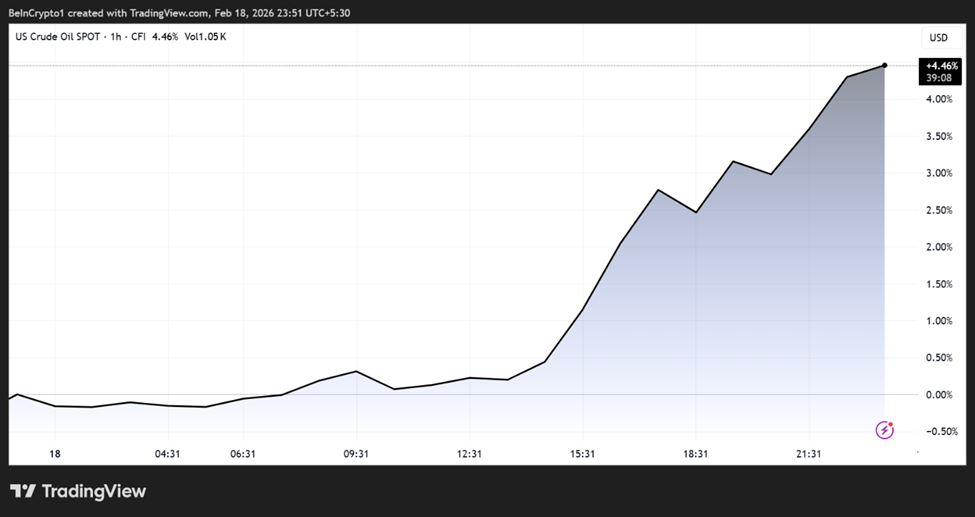
Safe-haven assets such as gold and silver are climbing, oil prices are rising on supply fears, and Bitcoin is slipping as traders rotate away from risk-sensitive assets.
Iran Military Buildup Fuels Market Anxiety
Recent intelligence and media reports indicate that any potential conflict would not be a limited strike. Rather, it would be a broader, weeks-long campaign if launched, raising concerns about prolonged volatility across commodities, equities, and crypto.
Sponsored
Sponsored
According to Axios analysis, evidence is mounting that a conflict could be imminent, with Israel reportedly preparing for a scenario of “war within days,” which could involve a “weeks-long ‘full-fledged’ war” and a joint US–Israeli campaign broader in scope than previous operations.
The same report noted that US forces in the region now include “2 aircraft carriers, 12 warships, hundreds of fighter jets, and multiple air defense systems.” This is in addition to more than 150 cargo flights transporting weapons and ammunition.
Oil prices reportedly surged above $64 per barrel following the news.

Separate commentary similarly described the US as being on the brink of a large-scale conflict, with stalled nuclear negotiations and a growing military presence increasing the risk of imminent action.
The assessment suggested that strikes could come within weeks if diplomacy collapses, with Donald Trump’s advisers continuing talks but failing to close key gaps.
Sponsored
Sponsored
Commodity markets have been the most immediate beneficiaries of the rising geopolitical risk premium.
Analysts tracking market moves reported that gold, silver, and oil all advanced as tensions escalated. Silver posted some of the strongest gains among major assets.
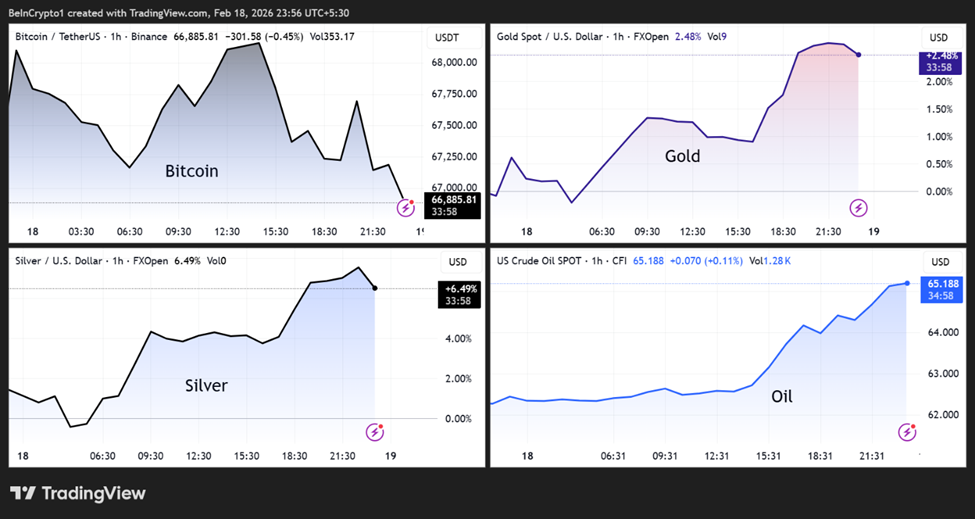
“The precious metals sector has so far been the primary beneficiary of heightened US attack concerns,” commented commodities strategist Ole Hansen, adding that gold is trading above $5,000 while silver and platinum have also recorded significant gains.
Oil markets are also reacting to the possibility of disruptions in the Strait of Hormuz, through which roughly one-fifth of global oil supply moves.
Even the perception of risk to this route tends to trigger sharp price swings, amplifying volatility across energy markets.
Sponsored
Sponsored
Bitcoin Slips as Risk Appetite Weakens
While traditional safe havens rallied, cryptocurrencies moved in the opposite direction. Bitcoin fell below the critical support of $67,014 and was trading for $66,384 as of this writing.
This divergence, where Bitcoin slumps while gold, silver, and oil advance, reflects a broader risk-off shift in investor sentiment.
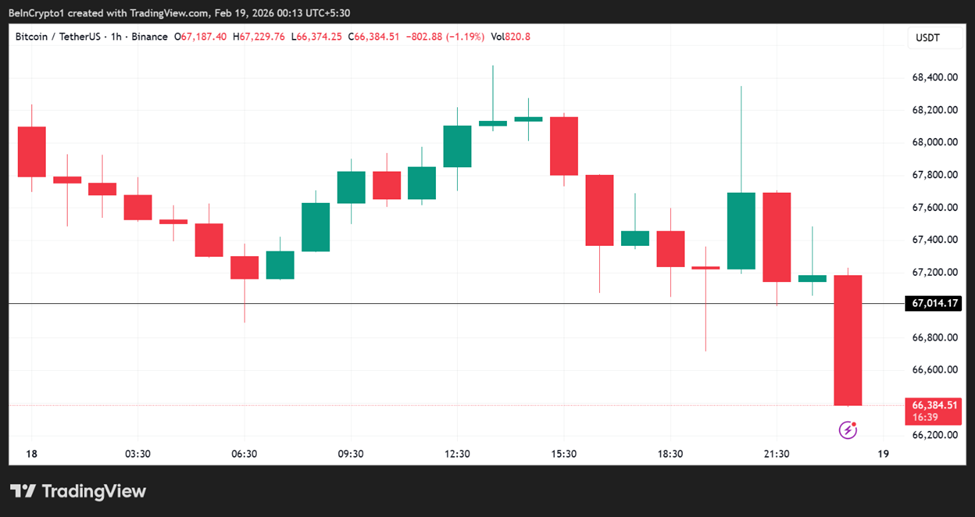
The divergence highlights a recurring pattern in periods of geopolitical stress: capital often flows first into commodities and cash-like instruments before returning to higher-beta assets such as crypto.
Debate Over the Likelihood and Consequences of War
Despite the buildup, some analysts remain skeptical that a full-scale war will materialize. Nigerian tech entrepreneur Mark Essien argued that a prolonged conflict would be far more complex than previous campaigns.
Sponsored
Sponsored
Based on this, Essien warns that Iran’s drone capabilities and potential insurgency could make the situation difficult to resolve quickly. Meanwhile, domestic opposition in the US is also visible.
“Americans do not want to go to war with Iran!!! They want to be able to afford their lives and get ahead,” wrote former congresswoman Marjorie Taylor Greene.
At the same time, geopolitical risks may be expanding beyond a bilateral confrontation. Reports cited by defense analysts suggest that China could be providing Iran with intelligence and navigation support, potentially complicating the regional strategic balance.
With peace talks continuing but showing little sign of a breakthrough, markets are preparing for prolonged uncertainty. Traders are increasingly pricing in the possibility that any military action would be larger, longer, and more disruptive than recent conflicts.
It explains why commodities are reflecting fear, cryptos are reflecting caution, and global investors are watching diplomatic developments closely.
Whether diplomacy prevails or tensions escalate further may determine the direction of oil and gold, as well as the next major trend across global financial markets.

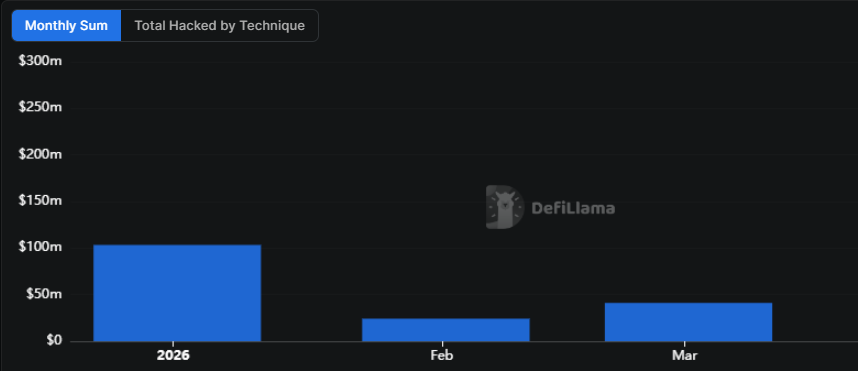
Crypto hackers stole over $168.6 million in cryptocurrency from 34 decentralized finance (DeFi) protocols in the first quarter of 2026, falling significantly from the same period last year, according to data from DefiLlama.
The $40 million private key compromise of Step Finance in January was the largest exploit of the quarter, the data shows, followed by a smart contract manipulation that drained $26.4 million in ether (ETH) from Truebit on Jan. 8. The third-largest was a private key compromise targeting stablecoin issuer Resolv Labs on March 21.
The quarterly figure is low given that the industry saw $1.58 billion stolen in the first quarter of 2025, with the bulk coming from the $1.4 billion Bybit exploit. However, experts warn that crypto hacks aren’t tied to specific periods within a year.

Hackers are more active when industry is booming
Nick Percoco, the chief security officer at crypto exchange Kraken, told Cointelegraph that cybercriminal activity in crypto tends to rise around market and event-driven cycles rather than fixed periods.
Threat actors are also drawn to areas where liquidity is concentrated, meaning attack spikes often follow wherever value is accumulating fastest, according to Percoco.
“Bull markets, major product launches and fast-moving growth phases all create more attractive conditions for attackers because more value is at stake and new infrastructure can introduce risk,” he said.
“That said, attacks are not confined to just these periods. Vulnerabilities can be exploited in any market environment, particularly in complex or rapidly evolving systems, underlining that security in crypto must be continuous.”
Crypto attackers are a “broad and evolving mix”
North Korea-linked actors have been a persistent threat to crypto investors and Web3-native companies alike.
Hackers affiliated with the organization have been suspected of numerous attacks, including the Wednesday attack on Drift Protocol, a decentralized cryptocurrency exchange that lost an estimated $285 million to a private key leak.
Related: Hacked crypto tokens drop 61% on average and rarely recover, Immunefi report says
Percoco said the threat landscape is a mix of actors with different levels of sophistication, highly coordinated groups targeting core infrastructure, organized cybercriminal networks and opportunistic hackers scanning for weaknesses in smart contracts and client-facing systems.
“It is a broad and evolving mix, but they are ultimately targeting the same thing: global, liquid and accessible value. Targeting is rarely purely random. In many cases, attackers are deliberate in how they assess infrastructure, code, access controls and even human behavior,” he said.
“At the same time, crypto’s transparency makes it easier for opportunistic actors to spot weaknesses as they emerge. The most attractive targets tend to be those combining large concentrations of value, technical complexity and gaps in operational security.”
Security experts previously told Cointelegraph that 2026 would likely see an increase in sophisticated credential theft, social engineering, and AI-powered attacks.
Magazine: All 21 million Bitcoin is at risk from quantum computers


Big Tech firms have come together to back a new industry body focused on standardizing how AI agents handle payments across crypto and traditional rails.
Summary
- Big Tech firms including Google, Microsoft and Amazon Web Services backed the launch of the x402 Foundation to standardize AI-driven payment infrastructure.
- The Linux Foundation introduced the initiative with Coinbase, placing the protocol under an open source and nonprofit structure.
The Linux Foundation on Thursday announced the launch of the x402 Foundation, a governance initiative built around the x402 protocol, with early support from companies including Google, Microsoft, and Amazon Web Services.
The project has been developed with input from Coinbase, which originally introduced the x402 protocol. A number of financial and blockchain firms have also signaled early backing, including American Express, Mastercard, Visa, Stripe, Circle, Solana Foundation, and Polygon Labs.
Support has also come from infrastructure and commerce platforms such as Cloudflare and Shopify, along with developer-focused firms like Thirdweb and regional payment provider KakaoPay.
According to Coinbase, placing the protocol under the Linux Foundation gives it a “neutral, nonprofit home,” that could eventually help attract support from tech firms and developers compared to a company banner.
Jim Zemlin, CEO of the Linux Foundation, pointed to the internet’s history of shared infrastructure, stating that “the internet was built on open protocols,” as he made the case for adopting a similar model for AI-driven payments.
The x402 protocol is designed as an open standard that allows AI agents and web services to execute payments on their own, covering use cases such as paying for APIs, accessing data, or purchasing digital services without human intervention.
Momentum around the concept has been building alongside expectations that machine-to-machine transactions could become a dominant force in crypto payment activity.
Brian Armstrong said recently that “there will be more AI agents transacting online than humans very soon,” aligning with earlier remarks from Jeremy Allaire, who projected that “literally billions of AI agents” could be active on-chain within three to five years.
Similarly, former Binance CEO Changpeng Zhao has argued that crypto is the “native currency for AI agents,” particularly for automated payments ranging from ticket purchases to recurring bills.
However, activity tied to the x402 protocol has yet to show steady growth. Data from Dune Analytics indicates that usage surged late last year before tapering off.
Weekly transaction counts climbed to about 13.7 million during the week of Nov. 4–10, followed by another 13.66 million the week after. Activity has since cooled, with weekly volumes ranging from roughly 29,000 to 1.1 million so far in 2026, pointing to uneven adoption despite strong backing from major industry players.
Crypto World
Cantor Equity Partners II (CEPT) Receives Bullish Analyst Rating Before Securitize Deal

Key Takeaways
- Investment firm Benchmark starts coverage on Cantor Equity Partners II (CEPT) with bullish Buy rating and sets $16 price objective.
- The SPAC is preparing to complete a merger with Securitize, a tokenization platform valued at $1.25 billion.
- Securitize commands approximately 70% market share in U.S. tokenization and manages BlackRock’s $2.2B BUIDL fund.
- Securitize and the New York Stock Exchange unveiled plans for a joint tokenized securities platform offering 24/7 trading capabilities.
- Analyst estimates the addressable market for real-world asset tokenization at $300 trillion globally.
CEPT was trading around $11 at the time of writing.
Cantor Equity Partners II, Inc. Class A Ordinary Share, CEPT
Investment banking firm Benchmark has launched coverage of Cantor Equity Partners II with a bullish outlook, highlighting the upcoming combination with Miami-headquartered tokenization specialist Securitize as a significant growth driver. Research analyst Mark Palmer established a $16 price objective, which assumes Securitize will achieve $178 million in annual revenue by late 2026.
Securitize provides a comprehensive platform for converting traditional real-world assets — including equities, fixed income securities, and investment funds — into blockchain-based digital tokens. Benchmark characterizes the company as an attractive “pure-play investment opportunity in the tokenization sector.”
The business combination between CEPT and Securitize was publicly disclosed in October 2024, establishing a $1.25 billion enterprise valuation for Securitize. Following transaction completion, the merged entity will trade on the Nasdaq exchange under the new ticker symbol SECZ.
Palmer highlighted robust revenue predictability for Securitize, noting that origination fees charged to companies tokenizing assets plus ongoing servicing income provide dependable cash flow. The analyst emphasized that Securitize’s platform-agnostic approach across multiple industries represents a strategic advantage.
“Securitize is really focused on providing the process behind tokenization, from origination through servicing, in a way that’s applicable to a breadth of industry verticals,” Palmer said.
Strategic Partnerships with BlackRock and NYSE Strengthen Market Position
Securitize currently operates BlackRock’s BUIDL fund, which stands as the industry’s largest tokenized money-market product at $2.2 billion in assets under management, deployed across eight blockchain networks including Ethereum and Solana. BlackRock previously spearheaded a $47 million strategic investment round in Securitize, creating what Benchmark identifies as a meaningful competitive moat.
Just last week, Securitize and the New York Stock Exchange revealed a strategic collaboration to develop a dedicated platform for tokenized securities that will enable continuous trading around the clock. This partnership positions Securitize as a central player in modernizing American capital markets infrastructure aligned with the SEC’s “Project Crypto” regulatory framework.
Benchmark analyst Palmer contends that Securitize’s technology stack offers distinct advantages over rivals by eliminating reliance on traditional clearing systems like the DTCC. This differentiates the company from competitors such as Figure Technologies, which completed its Nasdaq listing in September 2025 with a narrower focus on tokenized home equity credit products.
Massive $300 Trillion Market Opportunity
Benchmark calculates Securitize’s total addressable market at approximately $300 trillion — representing the aggregate value of real-world assets worldwide. Since the platform works across diverse asset classes and industries, Palmer noted the company faces no artificial ceiling from vertical-specific limitations.
“The concept here really is better and faster across the board,” Palmer told Decrypt. “It’s just a matter of time before the market begins to recognize the benefits both in terms of efficiency and settlement times.”
According to Benchmark’s research, Securitize maintains roughly 70% control of the tokenization market in the United States. This dominant market position, coupled with prestigious institutional partnerships, should enable the company to expand its competitive advantage as adoption accelerates.
CEPT shares were changing hands near $11 when Benchmark released its research report, representing significant discount to the analyst’s $16 price target.

US households now have a larger share of their net worth tied to the stock market than at any point in modern history.
The figure stands at 25.63% of total household net worth, eclipsing the Dot-Com Bubble high of 19.56% and the 1968 peak of 22.01%.
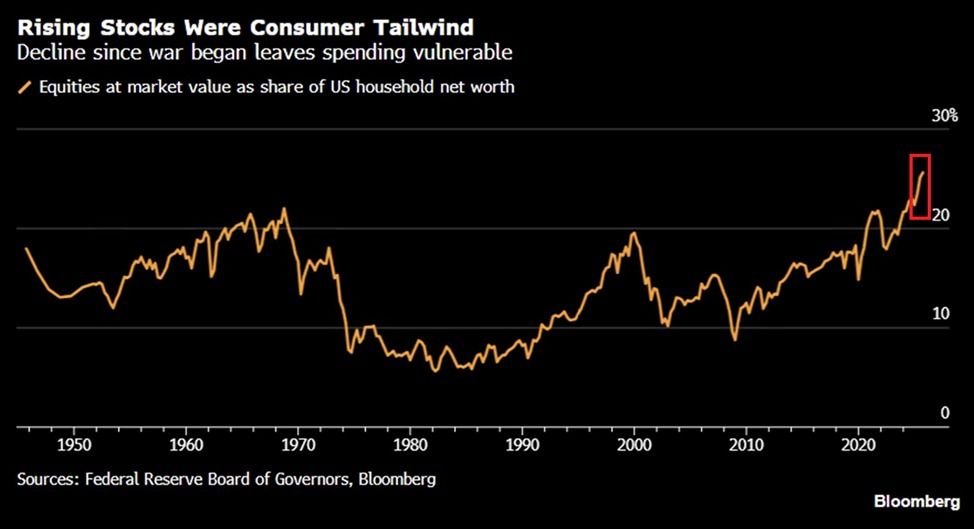
The share of equities in household wealth has nearly tripled since the 2008 Financial Crisis low of 8.77%. Measured as a share of financial assets, FRED’s Q4 2025 reading puts the figure at 47.1%.
But why is this concerning? All major US indices have trended lower in 2026. The Nasdaq Composite leads losses, declining 5.84% year to date.
Follow us on X to get the latest news as it happens
The S&P 500 is down 4.0%, the Russell 1000 has dropped 3.93%, and the Dow Jones Industrial Average has declined by 3.24%.
The sell-off is further fueled by the conflict between the US, Israel, and Iran, which has disrupted energy markets and shaken investor confidence.
With the record exposure, these declines aren’t just a portfolio problem. They’re an economic one. Consumer expenditures currently represent roughly 69% of US GDP.
“A significant correction in stocks could trigger a sharp pullback in spending, particularly among higher-income households who drive a significant part of consumption,” The Kobeissi Letter wrote.
Goldman Sachs also echoed this concern in a note, estimating that a 10% stock drop in equity prices sustained through the second quarter could shave 0.5 percentage points off GDP growth.
Thus, with equity exposure at a record, a correction would carry outsized consequences. Whether this cycle resolves through a soft landing or a harder repricing may depend on how long the geopolitical turmoil continues to weigh on markets.
Subscribe to our YouTube channel to watch leaders and journalists provide expert insights
The post US Households Have Never Been More Exposed to the Stock Market, And That’s a Problem appeared first on BeInCrypto.

Bitcoin price is bleeding, and, as neutral as it seems, many angles suggest the prediction is bearish. BTC trades just north of $66,000 Thursday, down almost 6% in a week, and on-chain data confirming a staggering $598.7 billion in unrealized losses across the holder base. The worst may not be over as Glassnode’s latest Week On-Chain report draws a structural parallel that no long-term holder wants to hear.
Around 8.8 million BTC are now held at a loss, a direct consequence of Bitcoin’s 47% drawdown from its October 2025 all-time high of $126,000. Glassnode explicitly flags a “structural resemblance to conditions observed in Q2 2022,” a period that preceded further capitulation before recovery.
Long-term holders (those holding more than 155 days) are realizing $200 million in daily losses, confirming active capitulation is underway. Meanwhile, Capriole Investments’ Apparent Demand metric sits at -1,623 BTC, deep in contraction territory, signaling that bears remain in control.
The macro picture also compounds the pressure. BTC is 24% below its 2026 yearly open of $87,500, the U.S. dollar is strengthening, and negative Coinbase Premium persists. These could only mean that U.S. institutional buyers have not returned at scale.
Discover: The best crypto to diversify your portfolio with
Bitcoin Price Prediction: Recover to $71,500 Is a Must, or a New Low Might Come?
At $66,000, Bitcoin sits at a technically fragile level. The ETF holder’s average cost basis of $83,408 looms as significant overhead resistance, a ceiling that any sustained rally must crack to confirm trend reversal.
U.S. spot Bitcoin ETFs did record $1.32 billion in inflows during March 2026, reversing four consecutive months of outflows, but that institutional re-entry hasn’t yet translated into price recovery. Encouraging signal, deeply inadequate follow-through.
Whale behavior adds another bearish data point: large holders reduced positions by 188,000 BTC over the past year, consistent with broader distribution-phase dynamics. And just today, Nakamoto Inc. sold 384 BTC, incurring a $20 million loss.
— DustyBC Crypto (@TheDustyBC) March 31, 2026
 JUST IN: Nakamoto Inc sells 284 BTC for $20M at a loss, originally bought near $118K per BTC pic.twitter.com/HGttRBjnEH
The invalidation level is simple: a close above $71,500 with sustained volume shifts the narrative. Below $64,000, the bear case accelerates.
Discover: The best pre-launch token sales
Bitcoin Hyper Eyes Early Positioning as BTC Tests Structural Support
When Bitcoin bleeds 47% from its high and $600 billion in unrealized losses pile up, the conversation naturally shifts: Where does the next asymmetric opportunity sit? Spot BTC at these levels carries overhead resistance all the way to $83,000. A long climb back to breakeven for top buyers.
Bitcoin Hyper ($HYPER) is positioning itself at the infrastructure layer where Bitcoin’s limitations have always lived: slow transactions, high fees, and zero programmability. The project will be the first Bitcoin Layer 2 with Solana Virtual Machine (SVM) integration, targeting faster smart contract execution than Solana, without abandoning Bitcoin’s security and trust model.
Its Decentralized Canonical Bridge enables native BTC transfers, while sub-second finality addresses the throughput bottleneck that has kept Bitcoin sidelined from DeFi at scale.
The presale has raised $32 million at a current price of $0.0136, with 36% APY staking rewards bonus for early participants.
For those researching the space, the Bitcoin Hyper presale details are available here.
This article is for informational purposes only and does not constitute financial advice. Cryptocurrency investments are highly volatile. Always conduct your own research before investing.
The post Bitcoin Price Prediction: Holders to Lose $600B as Value Slides to $66K appeared first on Cryptonews.

Key Takeaways
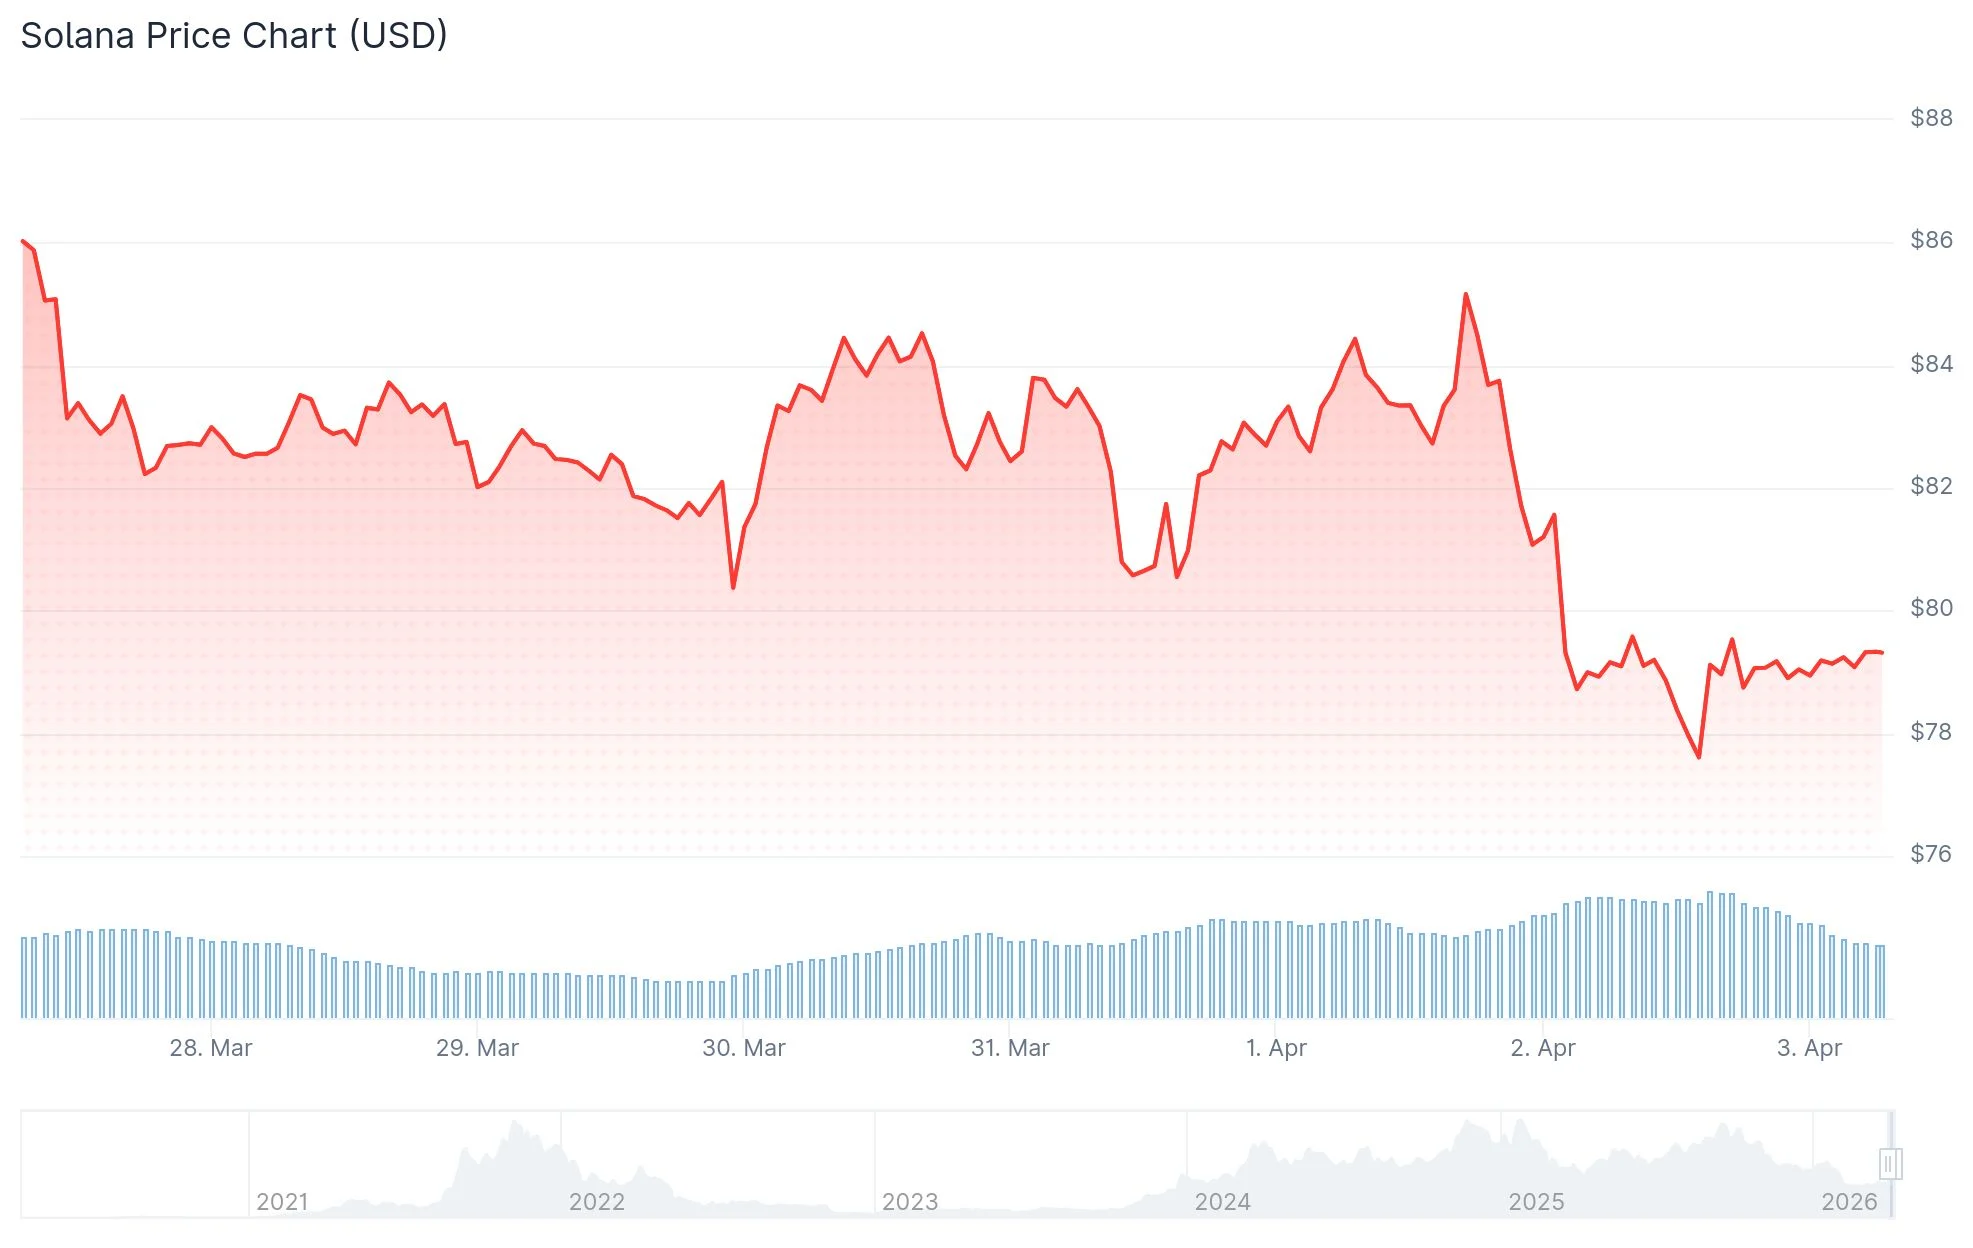
- SOL declined 5.4% and broke beneath the $80 threshold as geopolitical uncertainty surrounding Iran escalated following Trump’s warnings
- Critical overhead resistance lies in the $82.22–$85.94 range; losing $78 support could trigger a descent toward $67
- Over $20 million in long positions were liquidated within a 24-hour window, indicating intensifying downward pressure
- The daily Relative Strength Index has fallen under 40, signaling strengthening bearish sentiment
- Technical analysts identify the $50–$60 zone as the next significant demand area should present support crumble
Solana (SOL) experienced a significant downturn during the last 24 hours, declining 5.4% and slipping beneath the $80 level as wider market sentiment deteriorated. The price decline was primarily fueled by escalating geopolitical concerns, particularly President Donald Trump’s statement threatening to strike Iran “extremely hard” in the upcoming weeks.
Oil prices surged toward $110 in response to the announcement. This increase heightened worries about inflationary pressures and prompted market analysts to adjust their forecasts regarding Federal Reserve interest rate reductions in 2026. When expectations for rate cuts diminish, speculative assets such as cryptocurrencies typically face selling pressure.
Immediate overhead resistance is positioned between $82.22 and $85.94. This area encompasses multiple Fibonacci retracement levels including 23.6%, 38.2%, and 50.0%. Any attempt to rally into this zone may encounter renewed selling pressure without substantial buyer support.
Trading Volume Surge and Liquidation Data Point to Heavy Selling
Solana’s trading volume surged by 30% during the past 24 hours, climbing to approximately $6 billion, which represents roughly 13% of the token’s circulating market capitalization. This dramatic increase suggests substantial selling activity in the market.
Liquidations of long positions surpassed $20 million during this timeframe. Should this figure exceed $25 million, it would mark one of the most challenging sessions for Solana bulls since early February, when SOL tumbled from $100 down to $78.
The daily chart’s Relative Strength Index has dropped below the 40 threshold, a technical indicator that generally confirms strengthening bearish momentum. Additionally, three consecutive sell signals have emerged on the 4-hour timeframe, suggesting that institutional participants are actively reducing positions.
A breach of the $78 support threshold could pave the way for a move down to $67, which would represent approximately a 13% decline from present price levels.
Long-Term Technical Structure Suggests Further Downside
Examining the extended timeframe, analyst James Easton presented a 14-day chart illustrating SOL trading within a contracting descending channel. The technical pattern reveals a series of lower highs and lower lows since reaching its peak during late 2024 through early 2025.
Solana had maintained robust support within the $110 to $120 range. However, that zone has now converted into resistance territory. Market analysts indicate that inability to recapture the $100–$110 region maintains downside vulnerability, with $60 followed by $50 marked as the subsequent major accumulation zones.
Each rebound attempt has thus far been unable to disrupt the pattern of declining highs. With SOL long liquidations surpassing $20 million in just the past 24 hours, short sellers hold a tactical advantage should the $78 level fail to provide support.
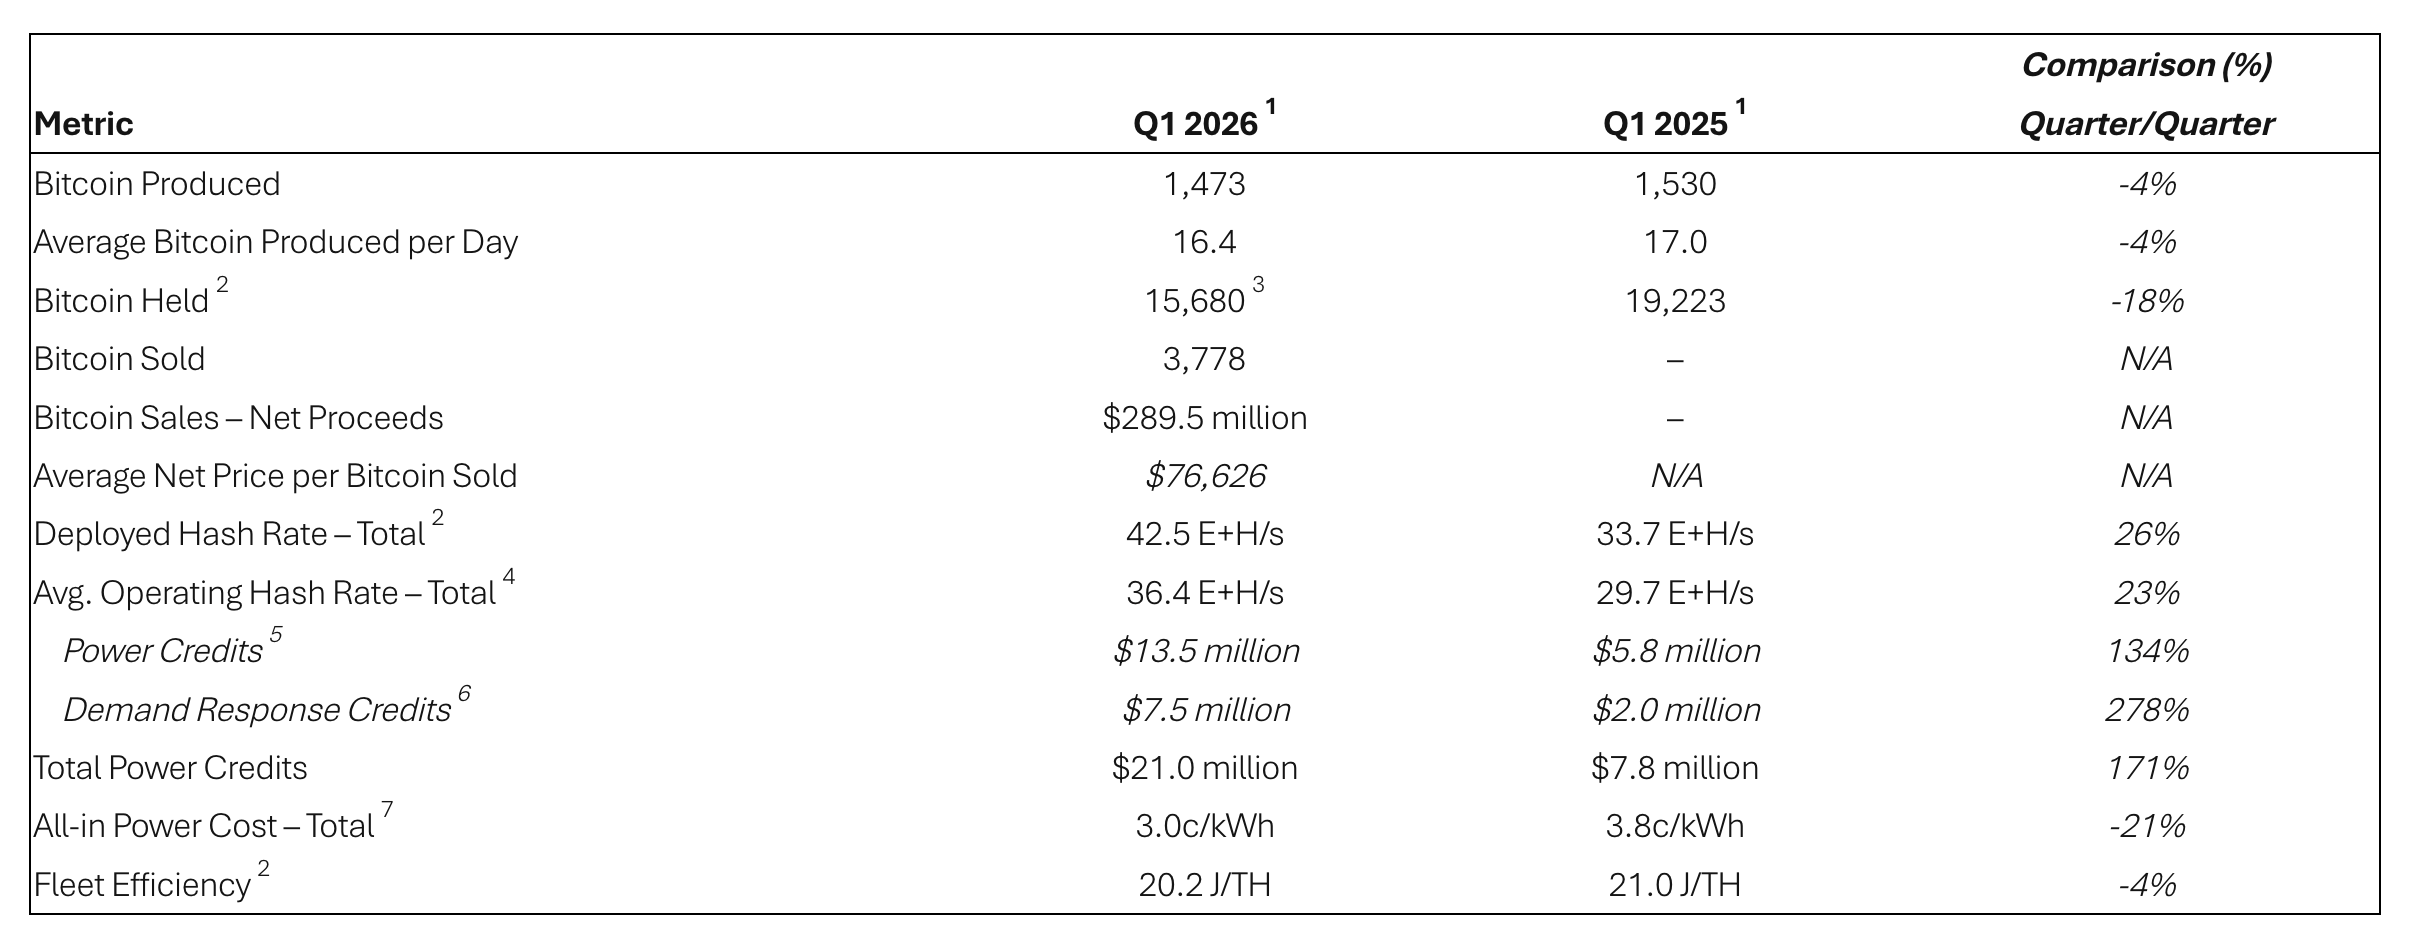
Riot Platforms (RIOT), a leading Bitcoin (BTC) mining and digital infrastructure company, revealed that it sold 3,778 Bitcoin during the first quarter of 2026.
According to the firm’s production and operations update, the move generated $289.5 million in net proceeds at an average price of $76,626 per coin.
Miners and Firms Dump Bitcoin Holdings
The sale reduced the miner’s total holdings to 15,680 BTC as of March 31, down 18% from 19,223 BTC a year earlier. Notably, according to the blockchain intelligence platform Arkham, Riot sold another 500 BTC in early April, further reducing its holdings.
Meanwhile, in Q1, the miner also produced 1,473 BTC. This represented a 4% decline from the same period in 2025.
Follow us on X to get the latest news as it happens
Riot’s liquidation is not an isolated event. MARA Holdings sold 15,133 BTC for around $1.1 billion.
Genius Group liquidated its entire 84.15 BTC treasury on April 1, while Nakamoto Holdings trimmed its reserves by approximately 284 BTC in March for about $20 million.
Bitcoin Demand Shrinks, But Buying Has Not Stopped
On-chain data reflects mounting pressure across the broader market. Analytics firm CryptoQuant reported that Bitcoin’s apparent demand fell to negative 63,000 coins as of late March.
However, buying has not disappeared entirely. Strategy (formerly MicroStrategy) purchased 44,377 BTC in March alone, representing 94% of all public-company acquisitions that month.
Meanwhile, Tokyo-listed Metaplanet acquired 5,075 BTC for approximately $398 million during Q1. The acquisition pushed its total holdings to 40,177 BTC.
The gap between aggressive institutional accumulators and firms liquidating under pressure highlights a market where demand is not absent but increasingly concentrated in fewer hands.
Subscribe to our YouTube channel to watch leaders and journalists provide expert insights
The post Riot Platforms Follows MARA to the Exit, Sells 3,778 BTC in Q1 2026 appeared first on BeInCrypto.


Japanese and South Korean equities advanced on Friday after a late rebound on Wall Street, as traders bet that tensions in the Iran war may be edging closer to a managed outcome.
Summary
- Nikkei 225 and Kospi rose 1.4% and 2.7% respectively after a late rebound in US stocks on hopes of easing tensions in the Iran war.
- Oil prices stayed elevated above $110 despite easing from highs, as fresh US strikes on Iranian infrastructure intensified geopolitical risks.
- Crypto equities were mixed, with mining stocks gaining while Coinbase, Robinhood, and Strategy shares declined.
Japan’s Nikkei 225 rose 1.4%, while South Korea’s Kospi climbed 2.7%, following a turnaround in the S&P 500, which erased a 1.5% intraday loss to finish 0.1% higher. The shift in sentiment came as oil prices pulled back from recent highs after reports that Iran is working with Oman on a protocol to monitor shipping through the Strait of Hormuz, which has remained effectively shut since the conflict began.
Currency markets reflected the improving tone, with the US dollar weakening against major peers as demand for safe-haven assets eased. Treasury futures in Asia traded largely flat, with the US cash market set to reopen later for a shortened trading session.
Several Asia-Pacific markets, including Australia, New Zealand, Hong Kong, Singapore, the Philippines, and Indonesia, remained closed for the Good Friday holiday. US equities will also be shut, though key economic releases, including the March nonfarm payrolls report, are still due.
Risk sentiment weakened earlier in the week after remarks from US President Donald Trump did little to ease concerns about a near-term resolution to the conflict. Although he had previously outlined a two-to-three-week timeline, Trump signaled that military operations would continue and warned of “extremely aggressive” action.
Subsequent strikes on Iranian infrastructure, including a century-old medical research centre in Tehran, steel facilities, and a bridge near the capital, have drawn criticism. Iranian officials and several analysts argue that these targets qualify as civilian infrastructure, raising concerns about further escalation and humanitarian consequences.
Oil markets reacted sharply to the heightened rhetoric. Prices surged above $110 per barrel on Thursday, with West Texas Intermediate jumping around 12% to $112 and Brent settling near $109. Europe’s diesel benchmark climbed past $200 per barrel for the first time since 2022, underscoring supply fears tied to disruptions in the Strait of Hormuz.
Despite the volatility in energy markets, traditional safe-haven assets such as gold showed limited movement on Friday, indicating a cautious, wait-and-watch stance among investors as the geopolitical situation remains fluid.
Crypto-linked equities delivered a mixed performance amid the escalating war in the Middle East. Coinbase shares fell 0.9% at the end of Thursday, while Robinhood declined 1.73%. Galaxy Digital bucked the trend, gaining 1.5% by the close.
Crypto mining stocks saw much better gains. Notably, Marathon Digital rose 8.3%, while Riot Platforms, Hut 8 Mining, and Bitfarms were up by 2.47%, 1.5%, and over 1%, respectively.
However, accumulation-focused firms did not follow the same trend. Strategy, the Bitcoin-focused treasury company led by Michael Saylor, dropped 2.4%, while Bitmine Immersion Technologies (BNMR) fell 1.2%.
The divergence suggests investors favoured mining firms, which tend to track Bitcoin price movements more closely, amid ongoing geopolitical uncertainty.
Disclosure: This article does not represent investment advice. The content and materials featured on this page are for educational purposes only.

A small group of collections has moved beyond crypto-native speculation and into consumer-facing brands. Pudgy Penguins has continued to present itself as a broader IP business, with recent CoinDesk Research describing more than $13 million in retail sales and over 2 million units sold, while Doodles now frames itself less as a pure collection and more as a creative platform built around content, AI, and brand expansion.
Indeed, the NFT sector has become more selective, with utility-led and gaming-linked activity holding up better than the broad speculative frenzy that defined the earlier cycle.
While a handful of projects are trying to build durable intellectual property, the long tail of profile-picture collections continues to fade.
BeInCrypto asked three industry experts how the NFT market is restructuring, and what will determine which projects survive.
Brand Equity vs. On-Chain Scarcity
The divide now sits at the center of the NFT market’s recovery: whether value can be sustained through real-world brand equity, or whether it still depends on on-chain scarcity.
Federico Variola, CEO of Phemex, is skeptical that most projects can successfully make that transition.
“There are still some difficulties in tying the value of NFTs to brand equity in the physical world when there isn’t a clear revenue or distribution funnel.”
In his view, the core issue is that many NFT brands have yet to prove they generate meaningful business outcomes outside of crypto.
“Because of that, I think the real value of NFTs has always been rooted in on-chain scarcity.”
As market sentiment around scarcity weakened, projects began searching for alternative narratives, from media expansion to merchandise, but often without a clear product-market fit.
“As a result, many of these brands are now stuck trying to pivot from on-chain scarcity toward real-world positioning without having a product-market fit.”
That helps explain why a large share of collections remain significantly below their peak valuations.
Fernando Lillo Aranda, Marketing Director at Zoomex, takes the opposite view. For him, the market has already moved past scarcity as a primary driver of value.
“Most NFTs won’t recover – and they probably shouldn’t. Scarcity alone was never a sustainable value proposition.”
He argues that verification on-chain does not create demand on its own.
“The market learned the hard way that being ‘on-chain’ doesn’t make something valuable – it just makes it verifiable. And verification without demand is irrelevant.”
Instead, he sees the surviving projects as those building real businesses around their IP.
“The only NFTs that have a real future are the ones evolving into actual businesses and IP engines.”
“If your project can’t live outside of crypto, in retail, media, gaming, or culture, then it’s not an asset, it’s a speculation artifact from the last cycle.”
The disagreement relates to execution. The move toward IP-driven value is already underway.
The open question is how many NFT projects can operate as real businesses rather than speculative assets.
Gaming’s Reset: From Play-to-Earn to Play-to-Own
The failure of early NFT gaming models made the speculation versus sustainability debate impossible to ignore.
Play-to-Earn was built to reward users with tokens for activity. In practice, it depended on constant inflows of new players to support token prices. Once growth slowed, the model began to break down. Rewards turned into emissions, emissions turned into sell pressure, and in-game economies collapsed under their own weight.
The recent migration is toward what many describe as Play-to-Own – a model that treats NFTs less as yield-generating assets and more as ownership layers within a game.
Anton Efimenko, co-founder at 8Blocks, sees this as a necessary correction in how value is structured.
“The core issue with Play-to-Earn was that it tried to financialize gameplay too early. When rewards are driven by token emissions rather than real demand, the system becomes inherently unstable.”
Instead of promising returns, newer models focus on utility and persistence. Assets are meant to retain relevance inside the game environment, rather than function as extractive instruments.
“Play-to-Own shifts the focus from extracting value to owning something that has utility within a functioning ecosystem. That reduces sell pressure and aligns players more closely with the long-term health of the game.”
This does not eliminate speculation, but it changes where it sits. Value is no longer tied to how quickly rewards can be realized, but to whether the underlying game can sustain engagement without relying on constant token incentives.
Gaming has become one of the clearest testing grounds for this transition. If NFT-based ownership can hold value without emissions-driven rewards, it may offer a path forward. If not, the same issues are likely to resurface under a different name.
Tokenizing IP: Liquidity vs. Loyalty
As projects search for new ways to unlock value, one emerging direction is the tokenization of NFT IP itself.
In theory, that can broaden access, increase liquidity, and give communities a more direct stake in the commercial upside of a brand. But it also raises harder questions about governance, alignment, and loyalty.
Efimenko says the structure can create opportunities, but it also changes the incentives around ownership.
“The moment NFT IP becomes more liquid, you invite a different class of participant. Some will care about the brand, but many will care mainly about price exposure and short-term upside.”
Of course, communities built around identity and culture do not function like ordinary token markets. The more tradable the asset becomes, the more likely decision-making is to shift toward actors with weaker long-term attachment to the project.
“Liquidity can help expand participation, but it can also fragment governance. If too much influence moves to holders who are financially motivated but not operationally aligned, brand direction becomes harder to manage.”
This leaves NFT projects in a difficult position. Broader financial access may strengthen the balance sheet, but it can also dilute the kind of committed holder base that many successful brands rely on.
Ultimately, a highly liquid community asset may be easier to trade, yet harder to build around over time.
Fixing Crypto-Native Gaming
Our analysis so far leaves one more question hanging: whether blockchain mechanics can restore trust in crypto-native gaming and gambling after years of broken incentives, opaque systems, and user fatigue.
This is potentially where blockchain still offers a real advantage. Game logic, reward flows, and outcomes can be made transparent in ways that traditional platforms often cannot match. Provably fair mechanics give users a way to verify that systems are functioning as claimed, rather than simply trusting the operator.
But transparency alone is not enough to rebuild confidence.
As Lillo Aranda puts it:
“The market learned the hard way that being ‘on-chain’ doesn’t make something valuable – it just makes it verifiable. And verification without demand is irrelevant.”
The same logic applies to gaming. Verifiable mechanics can help solve the trust problem, especially in areas like crypto gambling or reward distribution, but they do not solve the product problem. If the game is weak, the economy is extractive, or the user experience feels designed around monetization rather than entertainment, transparency will not save it.
The sector’s next phase may well be a test of whether crypto products can combine fair mechanics with actual player retention. In that sense, blockchain may help restore trust, but only if the game itself is worth trusting.
Final Thoughts
The NFT market is being forced into a more selective phase, where value has to come from something more durable than hype alone.
Variola’s comments point to the limits of the current pivot. Many projects are trying to move from scarcity-led speculation into real-world branding without a clear business model or product-market fit.
Lillo Aranda furthers the argument, suggesting that only the collections capable of operating as actual IP businesses are likely to retain relevance over time.
Efimenko, meanwhile, highlights the challenge underneath both views: ownership design, token incentives, and governance all shape whether a project can remain stable as it grows.
NFTs are not disappearing, but they are becoming harder to justify as pure collectibles. The projects that endure are more likely to be the ones that can build beyond the chain, sustain user demand, and give digital ownership a function that lasts longer than a speculative cycle.
The post NFTs After the Hype: IP, Utility and the Fight to Stay Relevant appeared first on BeInCrypto.
Crypto World
Circle’s cirBTC Takes Aim at Coinbase’s $6 Billion cbBTC Months Before Key Deal Renewal
Circle announced cirBTC on April 2, 2026, a wrapped Bitcoin (BTC) token backed 1:1 by native BTC with real-time onchain reserve verification, marking the firm’s first expansion beyond stablecoins into tokenized BTC infrastructure.
The announcement puts Circle in direct competition with its largest distribution partner at a commercially sensitive moment.
A Trust Problem Worth $1.7 Trillion
Circle, the issuer of USDC stablecoin, frames cirBTC as a neutral, institution-grade alternative to existing wrapped BTC products. It is built on the same compliance and issuance foundations that support USDC and EURC.
“Bitcoin is sitting on the sidelines of DeFi. Not because people don’t want yield or liquidity — it’s because they don’t trust the wrapper,” said Circle VP of Product Rachel Mayer, identifying the core market thesis behind cirBTC.
The wrapped BTC sector has faced sustained credibility issues. In August 2024, BitGo’s Wrapped Bitcoin (WBTC) drew criticism after its custodian partnered with BiT Global, a firm linked to Tron founder Justin Sun.
Coinbase launched cbBTC (Coinbase Wrapped BTC) shortly after, and currently holds roughly $6 billion in circulating supply according to CoinGecko data.
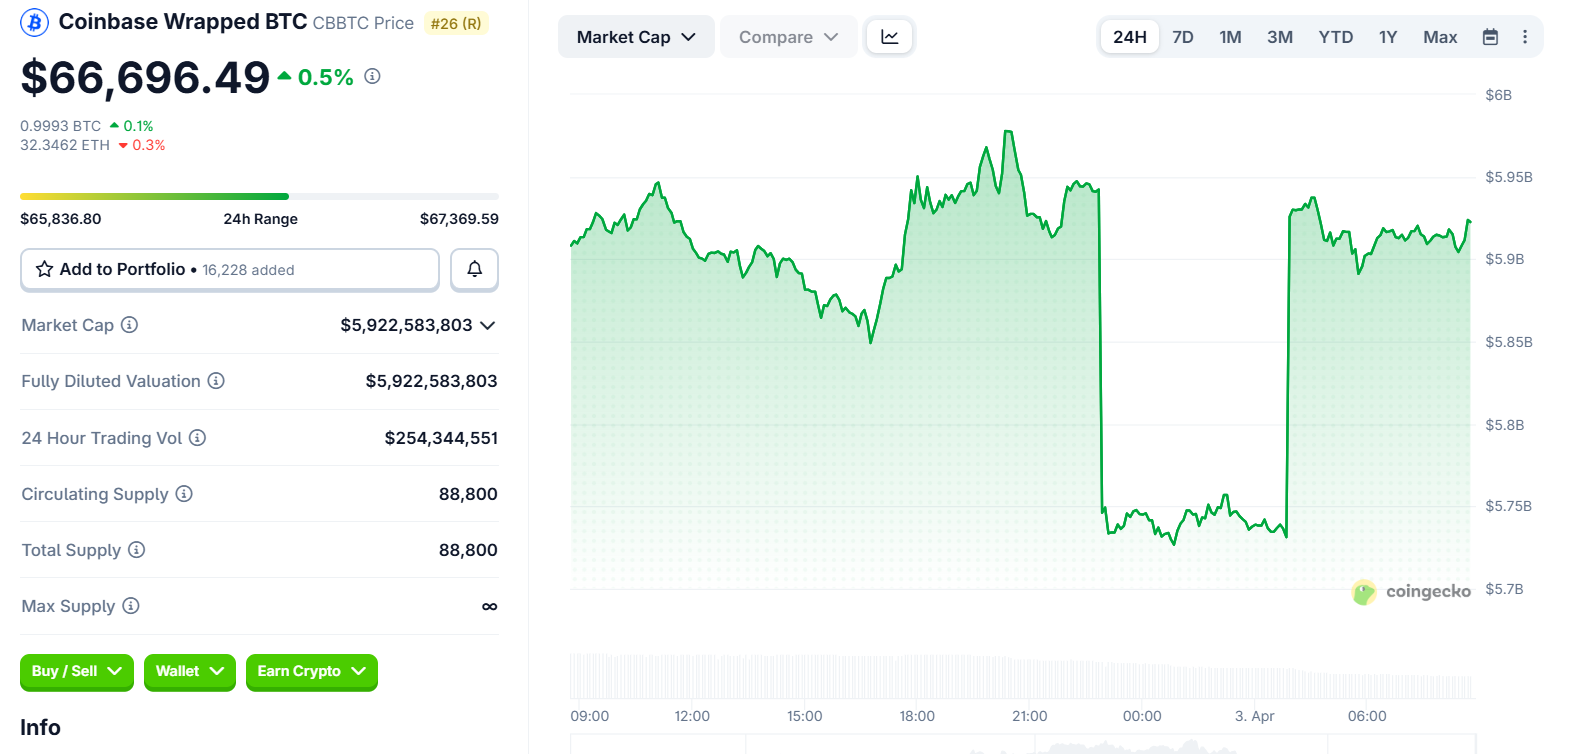
Circle is positioning cirBTC as a more transparent option. Reserves will be independently verifiable onchain in real time, with no reliance on third-party attestations.
The token launches first on Ethereum and Arc, Circle’s Layer-1 blockchain, with multichain support planned. Target users include OTC desks, market makers, lending protocols, and derivatives platforms.
Partnership Tension Ahead of August Renewal
The timing carries weight beyond product competition. Circle and Coinbase operate under a revenue-sharing agreement tied to USDC reserve income, up for renewal in August 2026.
Under the current deal, Coinbase receives 100% of interest on USDC held on its platform and a 50/50 split on off-platform holdings.
Analysts estimate that Coinbase collects over $900 million annually from this arrangement.
Crypto analyst Omar flagged the competitive signal directly, noting that Circle targeting cbBTC “feels like a direct shot” at Coinbase ahead of that renewal.
Circle CEO Jeremy Allaire described cirBTC as infrastructure rather than rivalry, saying the product extends the same foundations supporting USDC to “the largest digital asset.”
“cirBTC is coming. We are bringing the same infra that supports USDC, EURC, and USYC to the largest digital asset, creating a neutral infrastructure for new applications for onchain BTC,” wrote Allaire.
Still, no launch date has been confirmed, and the product page notes that availability depends on regulatory approvals.
Whether cirBTC gains institutional traction before cbBTC further entrenches its $6 billion lead may shape how much leverage Circle holds when the two companies return to the negotiating table in August.
The post Circle’s cirBTC Takes Aim at Coinbase’s $6 Billion cbBTC Months Before Key Deal Renewal appeared first on BeInCrypto.
7 Greatest Martial Arts Trilogies, Ranked

Who leads, surprising players to miss cut

Humanity returns to the Moon, but Outlook still doesn't work


-

 NewsBeat6 days ago
The Story hosts event on Durham’s historic registers
-

 NewsBeat13 hours ago
Steven Gerrard disagrees with Gary Neville over ‘shock’ Chelsea and Arsenal claim | Football
-

 Sports6 days ago
Sweet Sixteen Game Thread: Tide vs Michigan
-
Entertainment4 days ago
Fans slam 'heartbreaking' Barbie Dream Fest convention debacle with 'cardboard cutout' experience
-
 Entertainment5 days ago
Lana Del Rey Celebrates Her Husband’s 51st Birthday In New Post
-
Crypto World3 days ago
Dems press CFTC, ethics board on prediction-market insider trades
-

 Crypto World1 day ago
Gold Price Prediction: Worst Month in 17 Years fo Save Haven Rock
-

 Tech4 days ago
The Pixel 10a doesn’t have a camera bump, and it’s great
-

 Sports3 days ago
Tallest college basketball player ever, standing at 7-foot-9, entering transfer portal
-

 Tech3 days ago
EE TV is using AI to help you find something to watch
-

 Business8 hours ago
No Jackpot Winner and $194 Million Prize Rolls Over
-

 Fashion5 days ago
Amazon Sundays: Soft Spring Layers
-

 Business1 day ago
Login and Checkout Issues Spark Merchant Frustration
-

 Crypto World3 days ago
U.S. rule change may open trillions in 401(k) funds to crypto
-

 Tech3 days ago
How to back up your iPhone & iPad to your Mac before something goes wrong
-

 Tech4 days ago
Apple will hide your email address from apps and websites, but not cops
-

 Politics3 days ago
Should Trump Be Scared Strait?
-

 Tech4 days ago
Avatar Legends: The Fighting Game comes out in July and it looks pretty slick
-

 Tech3 days ago
Flipsnack and the shift toward motion-first business content with living visuals
-

 Fashion7 days ago
Weekly News Update, 3.27.26 – Corporette.com
You must be logged in to post a comment Login