
Crypto World
Binance price eyes $615 fibonacci support as oversold conditions build
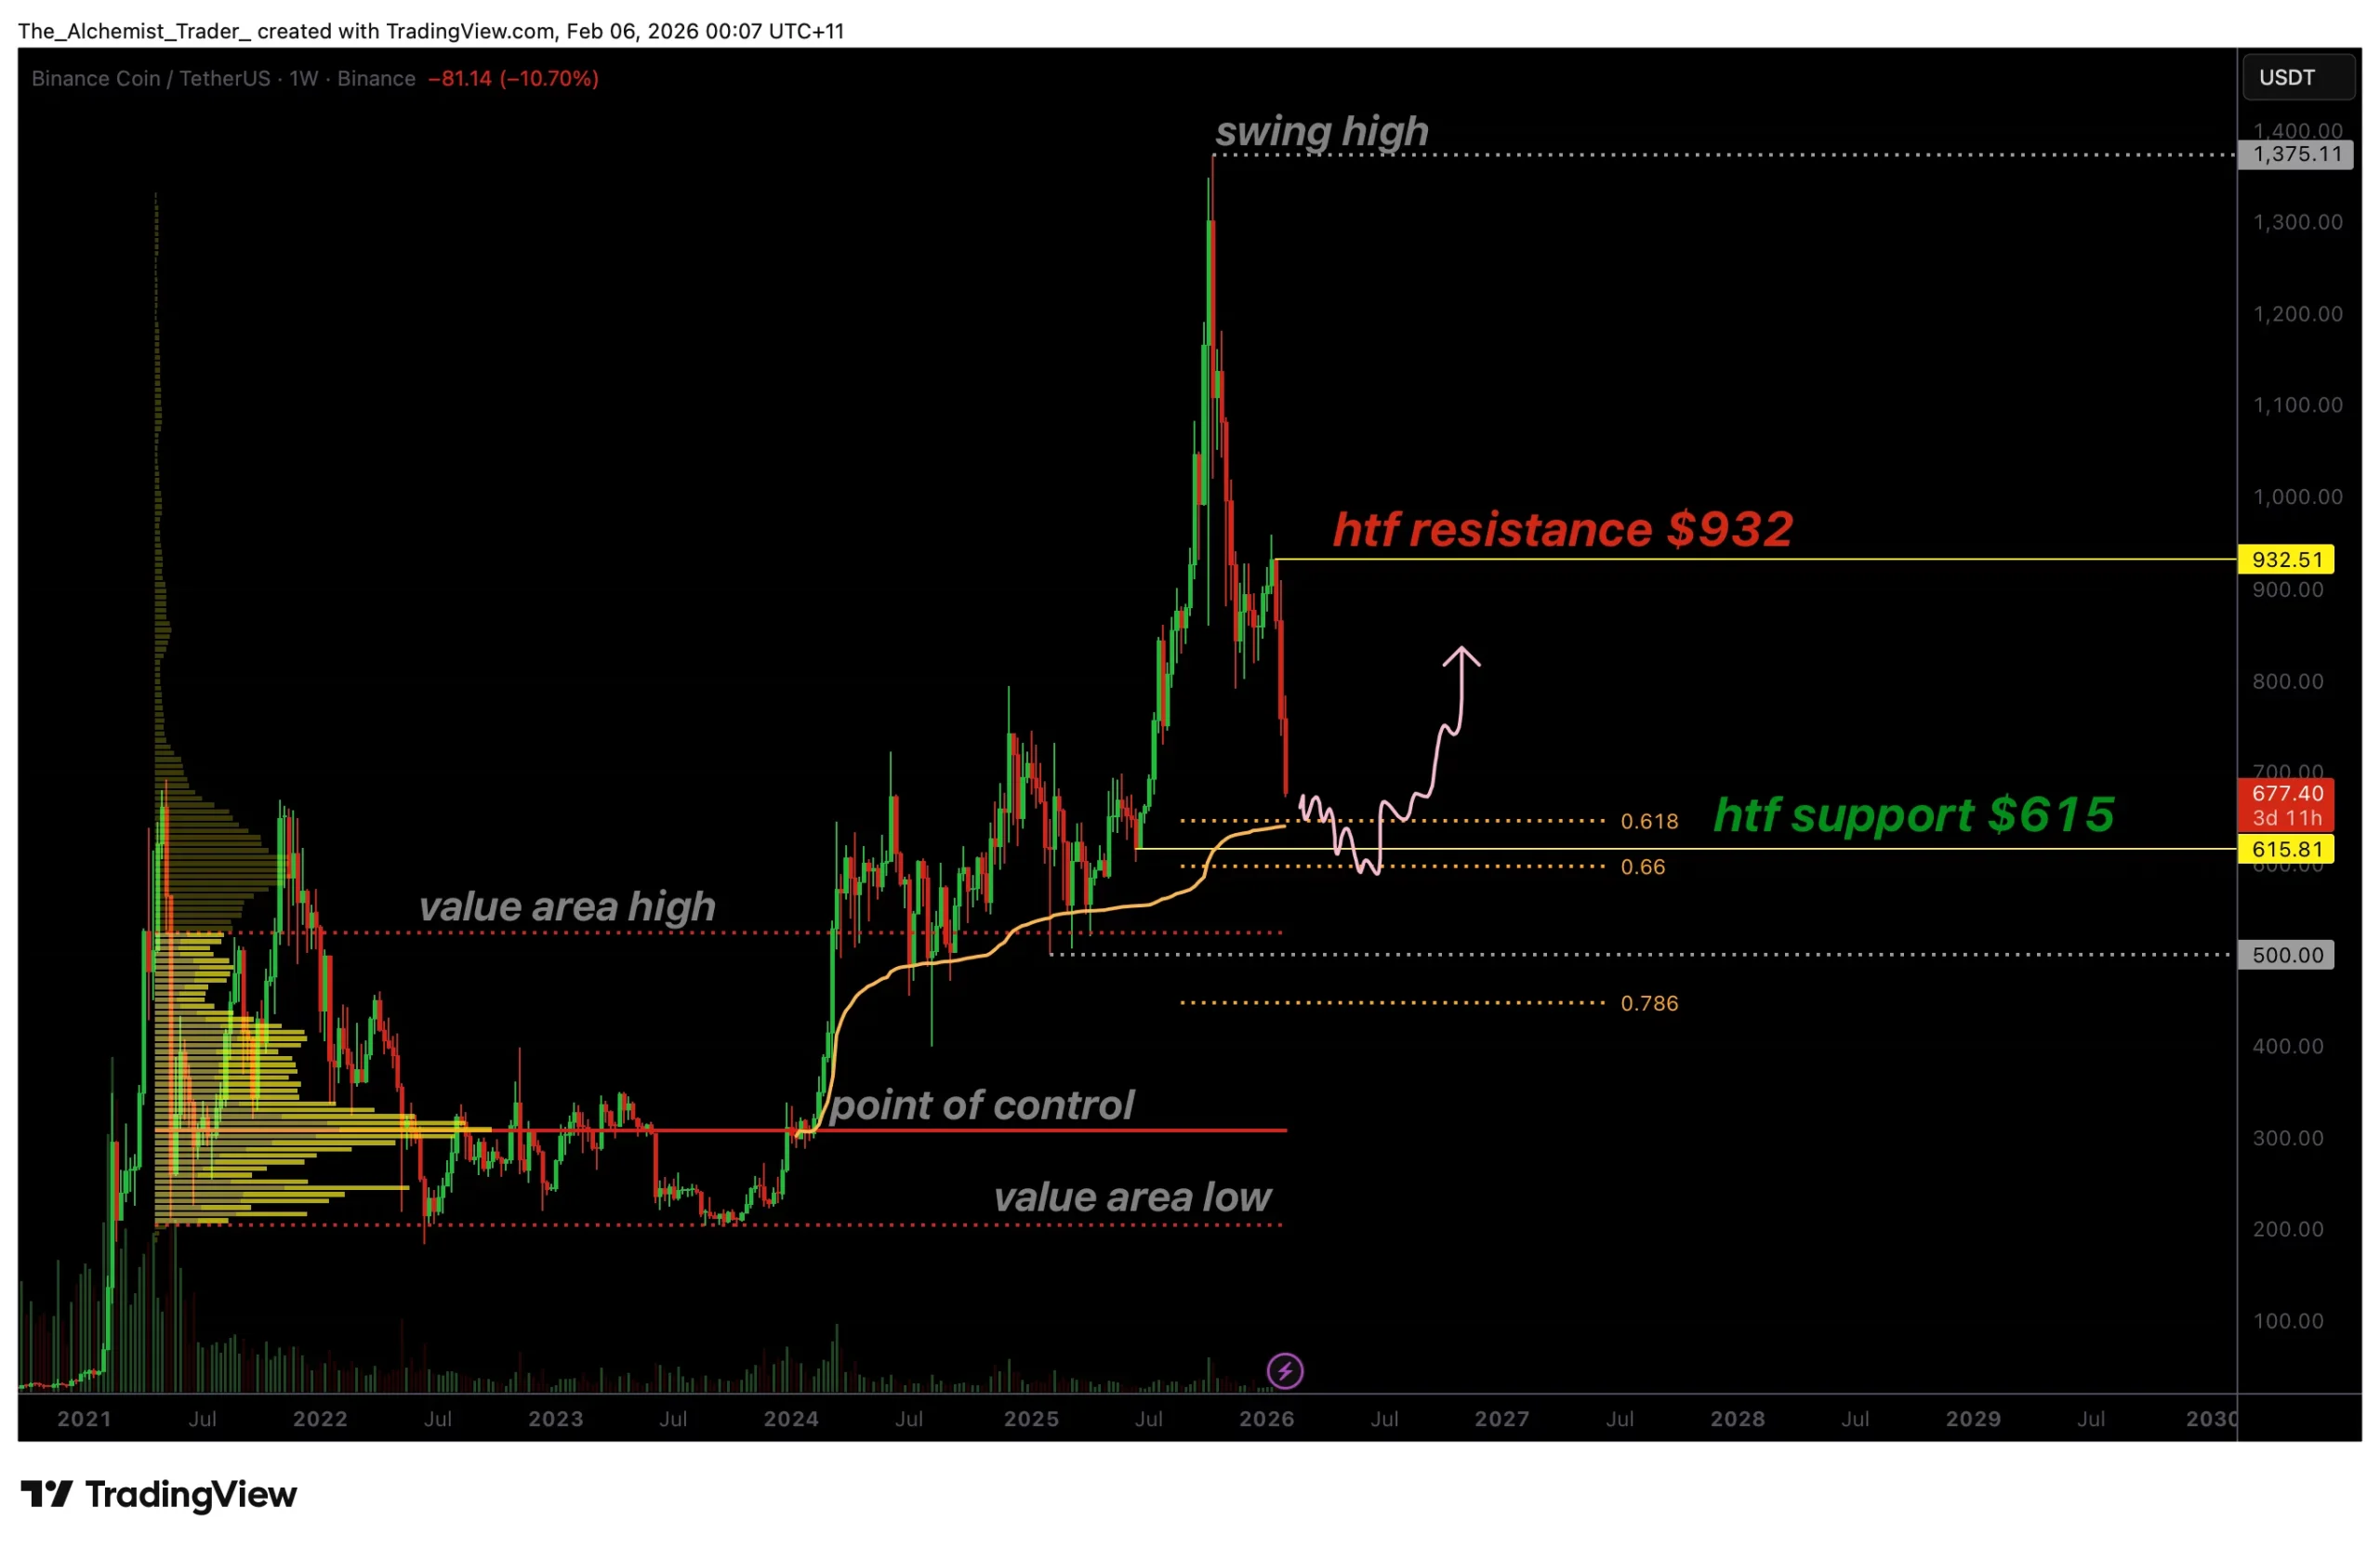
Binance’s price is approaching the $615 support zone as oversold conditions intensify, placing it at a critical technical inflection point.
Summary
- $615 is a major confluence support combining the 0.618 Fibonacci, VWAP, and prior value area high
- Rejection at $932 confirms bearish structure, keeping pressure on price in the short term
- Oversold conditions raise bounce probability, but confirmation is needed for reversal
Binance (BNB) price has entered a sharp corrective phase following its recent swing high, with bearish momentum accelerating across multiple timeframes. After failing to sustain upside continuation, price has rotated lower in an impulsive fashion, signaling a clear shift in short- to medium-term market structure.
As BNB continues to unwind recent gains, attention is now turning toward a key high-timeframe support region near $615, where technical confluence suggests this level may play a decisive role in determining the next directional move.
Binance price key technical points
- $615 marks a major confluence support zone, aligning with the 0.618 Fibonacci retracement and VWAP support
- High-timeframe resistance at $932 remains intact, reinforcing the broader corrective structure
- Oversold conditions increase the probability of a relief bounce, provided structural support holds
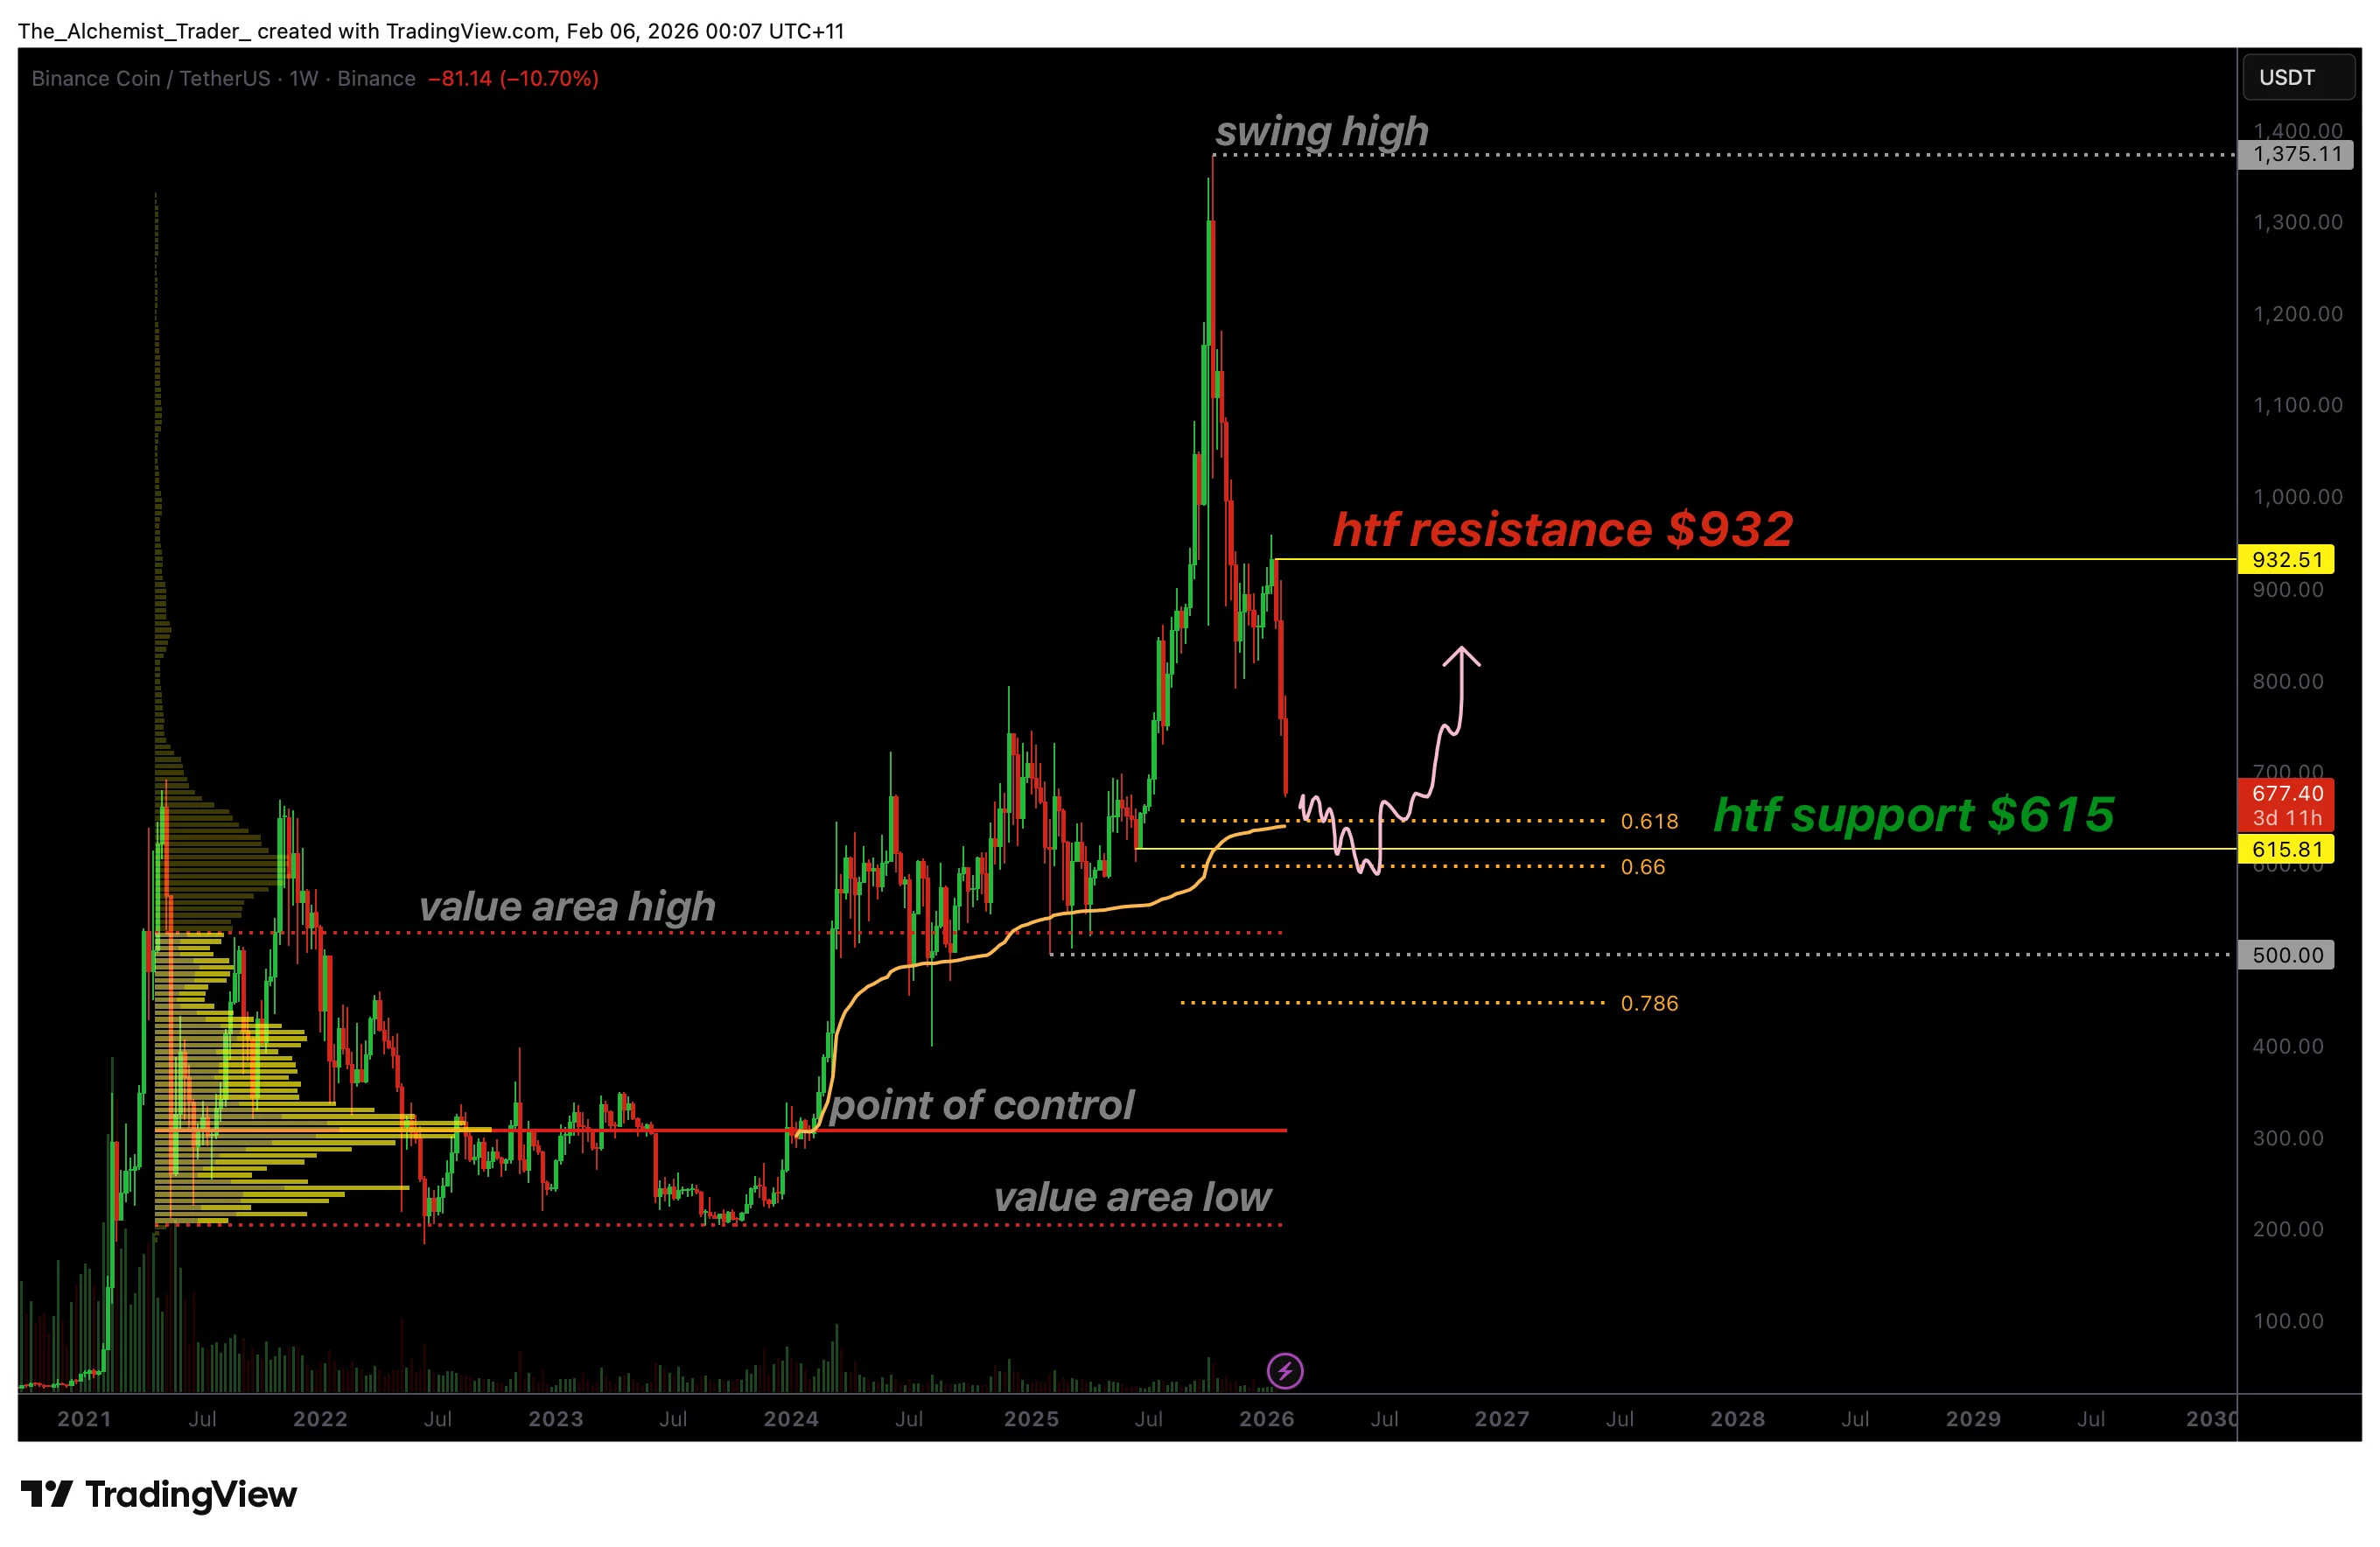
The current corrective move began after Binance Coin established a new high at a time-frame resistance near $932.
This level acted as a decisive rejection point, where bullish momentum stalled and sellers regained control.
The failure to reclaim acceptance above this resistance confirmed a structural low and initiated the current impulsive move to the downside.
Since that rejection, price action has remained consistently bearish, with lower highs and expanding downside candles reflecting aggressive selling pressure. This behavior suggests that the move lower is not merely a shallow pullback, but a broader corrective rotation within the prevailing market cycle.
$615 support zone comes into focus
As price continues to decline, the $615 region has emerged as the most important technical level in the near term.
This zone represents a high-confluence area where multiple technical factors align, including the 0.618 Fibonacci retracement of the broader move and VWAP-based support.
Additionally, this region sits above the previous range value area high, strengthening its relevance as a structural support level.
Historically, when price revisits such confluence zones after an impulsive move, the market often pauses to reassess value. If buyers step in to defend this area, it increases the likelihood that prices will stabilize and form a base for a corrective rebound.
Oversold conditions signal potential exhaustion
Momentum indicators are now beginning to reflect oversold conditions following the extensive selling seen over recent days and weeks. While bearish trends can persist longer than expected, oversold readings often signal that downside momentum may be nearing exhaustion, especially when price approaches major support.
Importantly, oversold conditions alone do not confirm a reversal. However, when combined with strong structural support, they increase the probability of at least a short-term relief bounce. Any such bounce would likely be corrective in nature unless accompanied by a clear reclaim of higher resistance levels.
What to expect in the coming price action
From a technical, price action, and market structure perspective, the $615 region represents a critical make-or-break level for Binance Coin. A successful defense of this support could allow BNB to establish a higher low and trigger a rotation back toward higher price targets. Conversely, failure to hold this zone would expose the market to deeper corrective levels and extend the bearish structure.
Until confirmation emerges, traders should closely monitor volume behavior and price reaction around support. A strong bullish response would signal improving demand, while continued weakness would reinforce downside risk. For now, all eyes remain on $615 as the market approaches a pivotal moment in Binance Coin’s corrective cycle.


There are blockchain projects… and then there are ecosystems trying to rebuild entire industries from scratch.
Nasun falls firmly into the second category—and it’s not being subtle about it.
Built as a Move-based Layer-1, Nasun isn’t chasing trends. It’s engineering a unified foundation where finance, artificial intelligence, and entertainment don’t just coexist—they reinforce each other.
And unlike the usual “coming soon” promises?
Nasun already has three live pillars advancing the vision: Pado, Baram, and Gen Sol.
The Big Idea: One Network, Three Power Engines
Nasun isn’t a single product—it’s a coordinated system:
-
💸 Pado → A unified DeFi super-platform
-
🧠 Baram → Auditable AI execution and settlement layer
-
🎬 Gen Sol → A cinematic sci-fi universe with games, films, and IP expansion
Together, they form something rare in Web3: a vertically integrated ecosystem with real usage across multiple industries.
The Strategic Edge: Why South Korea Matters
Nasun is building from a highly intentional launch point: South Korea.
-
Over 16 million crypto users
-
Around $70 billion in digital assets are held
-
Yet… no Korean-native decentralized trading venue
-
And no compliant self-custody infrastructure
That’s not a small gap—it’s a massive, underserved market.
Nasun isn’t just entering the space. It’s targeting a clear, high-value vacuum.
Let’s be honest—modern DeFi feels like juggling knives while blindfolded.
Multiple wallets. Scattered liquidity. Endless tab-switching.
It’s powerful… but inefficient.
Pado flips the entire experience on its head.
The Core Breakthrough: One Account, One Risk Engine
Instead of splitting your funds across protocols, Pado gives you:
-
One unified onchain account
-
Shared collateral across all positions
-
A single risk engine evaluating your entire portfolio
No more:
Everything lives in one place—and actually works together.
What Makes Pado Different?
🔹 Portfolio-Level Risk
Your entire financial state is evaluated holistically, not per app.
Translation: smarter capital usage, fewer nasty surprises.
🔹 Deterministic Risk Enforcement
No shady liquidations. No hidden rules.
Just transparent, onchain logic applied equally to everyone.
🔹 Yield on Collateral
Your funds don’t sit idle.
They earn yield while actively backing trades—a feature usually reserved for centralized exchanges.
Performance Meets Precision
Powered by Nasun’s parallel execution Layer-1, Pado delivers:
-
Sub-second finality
-
Cross-margin across spot, perps, and prediction markets
-
Protocol-native conditional orders (TP/SL, trailing stops)
And yes—no duct-taped off-chain systems.
AI + Social = Execution That Actually Moves Fast
Pado doesn’t stop at trading.
AI Intent Solvers
Instead of clicking through complexity, you just express intent:
“Open a hedged position with minimal risk”
AI agents handle the execution across markets.
Embedded Social Layer
It’s as if trading platforms and social media had a very productive child.
Everything in One Place
Inside Pado, you already get:
-
Spot Trading (CLOB orderbook + advanced charts)
-
Perpetual Futures (up to 20x leverage)
-
Prediction Markets (event-based trading)
-
Weekly Lottery (onchain randomness)
And coming soon:
Baram: AI You Can Actually Trust
Here’s the uncomfortable truth:
Most AI systems today are black boxes.
Baram changes that.
The Promise: Fully Auditable AI Execution
Every action in Baram is:
-
Authorized
-
Executed
-
Settled
-
Traced
No ambiguity. No hidden processes.
Built for Trust (Not Just Marketing)
Hardware-Level Privacy
Escrow-Based Payments
Stake-Based Accountability
-
Executors stake NSN
-
Misbehavior = slashing
Immutable Audit Trail
Every AI action creates a permanent, onchain record
Why This Matters
Baram isn’t just for devs—it’s for:
-
Enterprises needing compliance
-
Regulators demanding transparency
-
Builders who want provable AI execution
It’s AI that doesn’t say “trust me.”
It says: “verify everything.”
Gen Sol: Web3 Entertainment That Actually Feels Alive
Most Web3 entertainment projects feel like tech demos with lore taped on.
Gen Sol does the opposite.
It starts with a story first—and builds everything around it.
A Living Sci-Fi Universe
Gen Sol spans:
-
Feature films
-
Streaming series
-
Multiplayer games
-
Merchandise
All connected through one cohesive narrative universe.
At the center of it all?
Spectra—a powerful, dangerous resource that fuels the galaxy… and everyone’s obsession.
SPECTRA: The Game
A multiplayer PvP shooter built in Unreal Engine with a brutal core loop:
Crash. Compete. Escape… or die.
-
Teams fight to collect Spectra
-
The environment actively tries to kill everyone
-
More loot = higher rewards… but slower escape
It’s not just about winning fights.
It’s about managing risk under pressure—a theme that perfectly mirrors Pado.
Why Gen Sol Works
Because people don’t just invest in tokens.
They invest in:
Gen Sol creates emotional attachment, which fuels:
-
Engagement
-
Merchandising
-
Cross-platform expansion
This is how Web3 IP becomes mainstream IP.
The Real Take: Why Nasun Stands Out
Most projects pick a lane.
Nasun picked three and built bridges between them.
-
Finance feeds liquidity into the ecosystem
-
AI automates and secures execution
-
Entertainment drives user engagement and culture
It’s not just a stack.
It’s a flywheel.
Final Thought
Nasun isn’t trying to be another DeFi app, AI tool, or gaming platform.
It aims to become the infrastructure layer that integrates all three industries.
Ambitious? Absolutely.
But for once, the architecture actually backs the vision.
And if it works…
You’re not just looking at a new blockchain.
You’re looking at a new digital economy blueprint.
Nasun Network Official
Website | X(Twitter) | Telegram
REQUEST AN ARTICLE

Crypto markets have wiped out recent gains amid hawkish sentiment from the US central bank.
Total market capitalization has declined by almost $100 billion in less than 24 hours before and after the Federal Reserve’s meeting on Wednesday. The metric is now at around $2.52 trillion after falling from just below a six-week high of $2.61 trillion on Wednesday.
Over the past 24 hours, around 136,000 traders were wrecked, with total liquidations coming in at $452 million. The majority, or around 85% of them, were leveraged long positions in Bitcoin.
The big slump has sent markets back towards the middle of their six-week range-bound channel, wiping out most of the gains from the recent rally.
Hawkish Fed Rattles Traders
The dump began before the meeting but continued after Fed chair Jerome Powell’s comments that there may only be one rate cut this year. The US central bank kept rates the same at 3.5% to 3.75% in a widely expected move yesterday.
Fed policymakers maintained their forecast for an additional rate cut this year, but Powell suggested that the central bank remains concerned about stubbornly elevated inflation even before the conflict’s impact on fuel prices, reported the Associated Press.
“The rate forecast is conditional on the performance of the economy, so if we don’t see that progress, then you won’t see the rate cut,” Powell said.
“FOMC events act as volatility catalysts, but their impact depends on the underlying risk regime,” stated Swissblock on Thursday, adding, “In high-risk environments, FOMC days tend to trigger rejection or accelerate downside.”
Rate decisions tend to “amplify the existing regime,” they added, explaining that the current regime is “transitioning toward low risk, but it is not fully confirmed yet.”
“That means FOMC can still trigger volatility, but in the end, Bitcoin depends more on its own internal strength, flow, and momentum than on macro events alone.”
FOMC events act as volatility catalysts, but their impact depends on the underlying risk regime.
In high-risk environments, FOMC days tend to trigger rejection or accelerate downside.
In stabilizing regimes, they often mark local bottoms or continuation points.
The last three… pic.twitter.com/uWnVkjpHm4
— Swissblock (@swissblock__) March 18, 2026
You may also like:
President Donald Trump has repeatedly called for “too slow” Powell to reduce rates, but his own actions have had the opposite effect. Trump’s tariffs and now the war in Iran have caused prices to increase, which is likely to result in inflation figures going back up.
Inflation is one of the two Fed mandates for policy decisions on rates; the other is the labor market.
Crypto Market Outlook
Bitcoin is down 4.3% on the day, dropping below $71,000 on Wednesday, where it currently struggles.
Ether prices dumped 5.6% and fell below $2,200 while struggling to reclaim that level. Meanwhile, the altcoins were bleeding heavily with larger losses for Dogecoin, Cardano, Chainlink, and Zcash.
“For now, traders are expecting a bullish relief rally in spite of no changes being made,” reported Santiment. “This is likely due to the fact that the bearish price action related to the lack of cuts already occurred yesterday.”
Binance Free $600 (CryptoPotato Exclusive): Use this link to register a new account and receive $600 exclusive welcome offer on Binance (full details).
LIMITED OFFER for CryptoPotato readers at Bybit: Use this link to register and open a $500 FREE position on any coin!


The asset’s price exploded by almost 20% in minutes after the listing news went live.
The former CEO of the derivatives giant BitMEX has made several multi-million-dollar trades over the past six months or so, but his latest purchase raised some eyebrows in the cryptocurrency community.
This is because it preceded a major listing of the token he bought, which pushed its price up by double digits.
Did He Know?
Lookonchain data from earlier today shows that Hayes received over 132,000 ETHFI tokens from Anchorage Digital at $0.55 per one. Shortly after, news emerged on social media that one of the largest South Korean exchanges, Upbit, had listed the asset for trading against the local won.
Similar listings by the Asian giant have led to immediate price pumps for the underlying asset on almost all occasions. One of the latest examples involved ICP, whose price skyrocketed by over 16% last week.
Although ETHFI is a much smaller altcoin, its pump was essentially similar, going up by 18% from $0.54 before the announcement to $0.64 minutes after it. However, it was halted there and has lost almost all gains, perhaps driven by the overall market-wide correction today.
Even though some comments below the original post indeed questioned whether Hayes indeed had some insider knowledge, the amount of ETHFI he received seems rather negligible compared to what he sold a month ago – $72.8K now vs. $2.15 million back then.
Interesting — just 5 hours after Arthur Hayes(@CryptoHayes) bought $ETHFI, #Upbit announced its listing.https://t.co/QEgAyVQ4lz pic.twitter.com/9jorCuAHuX
— Lookonchain (@lookonchain) March 19, 2026
You may also like:
Previous Sell-Offs
CryptoPotato reported in February, shortly after the market tumbled, that Hayes had disposed of a large number of DeFi-linked tokens, including ETHFI. Aside from a $950,000 ETHFI selling spree, he also dumped $1 million worth of ENA and $1.1 million worth of PENDLE.
Hayes even sold ETH last August, suggesting at the time that the asset’s price is likely to tumble. However, the largest altcoins went on a run instead, jumping by double digits in weeks. As such, Hayes explained that he had to rebuy at higher prices and asked for forgiveness from the Ethereum community.
Binance Free $600 (CryptoPotato Exclusive): Use this link to register a new account and receive $600 exclusive welcome offer on Binance (full details).
LIMITED OFFER for CryptoPotato readers at Bybit: Use this link to register and open a $500 FREE position on any coin!


PI is among the few altcoins that has not plunged today.
After successfully implementing several consecutive protocol updates, the Core Team behind the controversial project noted earlier today that the next one is already in the works.
At the same time, the underlying token has posted a minor gain since yesterday. However, its broader performance continues to be quite underwhelming.
Next Update Coming Soon
The team announced the first protocol update of the year on February 20, which brought it to version 19.6. The next one, v19.9, followed suit on March 4, and the highly anticipated v20.2 was successfully migrated before the community’s Pi Day (March 14). This one was particularly important as it laid out the fundamentals for enabling smart contract capabilities.
This rollout will occur gradually, the team said, as they aim to prioritize categories that align with utility-based product innovation and operations. The specifics will depend on the needs arising from the utility creation process, they added.
Without providing a clear deadline this time, Pi Network’s official X channel indicated that the v21 upgrade is coming, and node operators must ensure their systems are “up to date.” They added that more instructions will be coming shortly.
The Pi Mainnet has successfully upgraded to Protocol 20, laying the foundation for supporting smart contracts. Node operators, please ensure your systems are up to date and stay tuned for instructions regarding the upcoming v21 upgrade.
— Pi Network (@PiCoreTeam) March 19, 2026
PI Resists Dropping Further
Aside from the aforementioned updates, all announced in the past month, the other big news in the Pi Network community came last week from Kraken. The veteran US exchange said it would list the underlying token for trading starting March 13.
You may also like:
The combined effects for PI were instant and rather mind-blowing. The token exploded by almost 100% in the span of just days, and tapped a five-month peak of around $0.30. However, once it indeed began trading on Kraken, it suffered the consequences of another classic buy-the-rumor, sell-the-news event.
It plummeted by over 30% at one point, and kept losing value to under $0.17 marked yesterday. Interestingly, it has rebounded slightly in the past day (3%), while most other altcoins have suffered 3-5% losses.
Binance Free $600 (CryptoPotato Exclusive): Use this link to register a new account and receive $600 exclusive welcome offer on Binance (full details).
LIMITED OFFER for CryptoPotato readers at Bybit: Use this link to register and open a $500 FREE position on any coin!
Disclaimer: Information found on CryptoPotato is those of writers quoted. It does not represent the opinions of CryptoPotato on whether to buy, sell, or hold any investments. You are advised to conduct your own research before making any investment decisions. Use provided information at your own risk. See Disclaimer for more information.


- FTX Token changed hands at around $0.28 amid broader crypto market volatility.
- The FTX Recovery Trust will commence a $2.2 billion distribution on March 31,2026.
- Potential impact on FTT’s price could see it fall to lows of $0.24.
FTX Token (FTT) is trading lower amid overall crypto weakness and as FTX Recovery Trust announces plans to distribute $2.2 billion to approved creditors by March 31, 2026.
The distribution will mark the fourth round of payouts from the collapsed exchange’s bankruptcy proceedings.
Could this influx of capital crash the FTT token? At the time of writing, FTT hovered near $0.28 and was down 2% in the past 24 hours.
FTX to distribute $2.2 billion to creditors
FTX’s ongoing creditor repayments follow the exchange’s Chapter 11 bankruptcy filed in late 2022 as the Sam Bankman-Fried empire imploded.
SBF was convicted of various charges related to the collapse and is serving a 25-year prison sentence, with FTX now the subject of a Netflix mini-series, ‘The Altruists’, that also features a depiction of Caroline Ellison.
The expectation is that the upcoming eight-episode show will highlight the dramatic implosion of one of the crypto sector’s biggest exchanges at the time, with key questions around governance and customer protection.
Bankman-Fried recently claimed the exchange was never insolvent.
FTX creditors have nonetheless already seen a series of successful payouts, and the company is eyeing another $2.2 billion to both convenience and non-convenience class claims.
The record date for this distribution was February 14, 2026, with payouts commencing March 31 for verified claim holders and distributed within 1-3 business days via designated providers.
(1/4) FTX announced it is set to distribute its Fourth Distribution of ~$2.2 billion on 3/31/26 to holders of allowed claims in the Plan’s Convenience and Non-Convenience Classes that have completed the pre-distribution requirements.
— FTX (@FTX_Official) March 18, 2026
FTT price outlook
FTT, the native token once central to the FTX ecosystem, remains sensitive to these events, despite falling to near zero from all-time highs above $85.
Holders could see the distribution as a fresh trigger to selling pressure, putting the token’s rebound from its all-time lows of $0.24 reached in October 2025 at risk.
Data shows that at least 38.3k wallet addresses hold the FTX Token.
With FTX nearing bankruptcy closure, recovery could include a bullish flip to $0.50 and likely the psychological $1.
This will also hinge on whether broader markets stabilize in the short term.
From a technical perspective, neutral oscillators and mixed moving averages signal caution ahead of the March 31 distribution.
The daily RSI hovers near 42 and signals potential downsloping towards oversold extremes.
Meanwhile, the MACD shows mild bullish momentum with a weakening histogram.

FTT is down 22% over the past month as altcoins suffer downward pressure amid current bearish crypto conditions.
If creditors liquidate holdings with prices in decline, a retest of the all-time lows around $0.24 could follow.

TLDR:
- SEC approved Nasdaq’s proposal to allow Russell 1000 stocks and major ETFs to trade in tokenized form.
- Tokenized trades on Nasdaq will still settle through the Depository Trust Company under existing securities laws.
- ICE, the parent of NYSE, is also developing an on-chain settlement platform and awaiting its own regulatory approval.
- First token-settled trades on Nasdaq are expected to take place before the close of the third quarter of 2026.
Tokenized securities are now moving closer to mainstream equity markets after a landmark U.S. SEC ruling. The Securities and Exchange Commission approved a Nasdaq proposal on Wednesday to allow stocks to trade in tokenized form.
Nasdaq, listed as NDAQ, had submitted the original proposal in September 2025. The decision marks a concrete step toward integrating blockchain-based settlements into traditional equity trading.
Exchange operators across the industry have been racing to capitalize on the growing tokenization boom under easing crypto regulations.
Nasdaq Sets the Framework for Eligible Tokenized Securities
The SEC approval covers a defined set of securities eligible for tokenized trading on Nasdaq’s main market. Initially, stocks within the Russell 1000 Index will qualify for tokenized trading under the newly approved rules.
Exchange-traded funds tracking key benchmarks, including the S&P 500 and Nasdaq 100, are also covered under the approval.
Journalist Eleanor Terrett captured the scope of the ruling clearly on X, writing that “the move will allow participants to opt to have trades in Russell 1000 stocks, as well as ETFs tracking the S&P 500 and Nasdaq 100, settled as tokenized securities rather than through traditional methods.”
NEW: The @SECGov has approved @Nasdaq’s plan to introduce tokenized trading for certain securities.
The move will allow participants to opt to have trades in Russell 1000 stocks, as well as ETFs tracking the S&P 500 and Nasdaq 100, settled as tokenized securities rather than… pic.twitter.com/NPVjcXJxup
— Eleanor Terrett (@EleanorTerrett) March 19, 2026
Furthermore, investors will be able to choose between trading stocks as conventional shares or as blockchain-based digital tokens.
Settlement for all tokenized trades will run through the Depository Trust Company, a familiar and established institution.
The original proposal, filed in September 2025, sought to amend Nasdaq’s existing rules to support both traditional and tokenized trading on its primary market.
The first token-settled trades are potentially expected to occur by the end of the third quarter of 2026. The SEC’s approval of that amendment now makes tokenized equity trading a functional option for a broad range of investors.
Rival Exchanges Are Also Pursuing Blockchain-Based Settlement
Intercontinental Exchange, the NYSE parent listed as ICE, has similarly moved into this space in 2025. Earlier this year, ICE announced it had developed a dedicated platform for trading and on-chain settlement of tokenized securities. The company is currently pursuing the necessary regulatory approvals to bring that platform to market.
The broader push toward tokenization is being driven in part by easing crypto regulations across the United States.
The Trump administration and SEC Chairman Paul Atkins have placed strong emphasis on strengthening American leadership in digital financial technology and making the country the leading hub for crypto globally.
SEC Commissioner Hester Peirce has also been vocal on the matter, stating that “tokenized securities are still securities” and that market participants must fully adhere to federal securities laws when trading these instruments.
The competition between Nasdaq and ICE reflects how aggressively traditional finance is embracing tokenized markets.
Nasdaq has also partnered with Kraken’s parent company, Payward, to develop an “equities transformation gateway,” further extending its blockchain reach beyond the SEC ruling.
This parallel development across rival exchanges points to on-chain equity settlement gaining genuine and lasting industry-wide traction.
The post Nasdaq Gets SEC Green Light to Trade and Settle Stocks as Tokenized Securities appeared first on Blockonomi.


Bitcoin’s biggest early holders, often called original gangsters, are hitting the sell button after the Federal Reserve rattled expectations for lower borrowing costs.
Blockchain data tracked by Lookonchain shows at least two long-term holders together dumped over 1,650 BTC worth more than $117.87 million early Thursday.
One veteran whale who previously sold an 11,000‑BTC stack, added another 650 BTC to his dump, while a separate early‑adopter OG with a 5,000‑BTC stash offloaded a full 1,000 BTC.
Bitcoin’s price dipped nearly 1% to $70,600 soon before press time, extending Wednesday’s 3.5% slide from $74,500, according to CoinDesk data. The broader market wilted, with the CoinDesk 20 Index 3% to 2,056 points. Ether (ETH), XRP (XRP), solana (SOL), and suffered similar losses.
The decline followed a hawkish Fed rate decision on Wednesday, when the central bank left the benchmark borrowing cost unchanged in the 3.5%–3.75% range but signaled a slower pace of rate cuts ahead, disappointing risk‑asset bulls.
The hawkish tone came through the so‑called interest‑rate “dot plot,” which shows where the Fed’s voting members expect interest rates to land in the months ahead. The median projection indicated only one rate cut this year, despite recent labour-market weakness. Moreover, only two committee members remained in the two‑cut camp, and Chair Powell’s own personal projection moved higher.
“The higher for longer narrative has been reinvigorated by sticky inflation and the inflationary shadow cast by rising energy costs, forcing investors to abandon their dreams of a rapid easing cycle,” Matt Mena, crypto research strategist at 21shares, said in an email.
Taken together, these developments pointed to a central bank still wary of inflation and this has led to a sharp repricing of bets on Fed rate cuts. Trading on the decentralized platform Polymarket and pricing in the CME Fed funds futures, now implies around an 80% probability of just one rate cut this year, versus a 62% probability of two to three rate cuts a month ago.
This outlook for tighter liquidity is not supportive of risk-taking in financial markets.


The global crypto market fell sharply on Thursday as new geopolitical and macroeconomic concerns threw cold water on investor appetite for risk assets.
Summary
- Crypto markets dropped sharply as escalating Middle East tensions and hotter U.S. PPI data weakened investor appetite, pushing Bitcoin down nearly 5% to around $70,600.
- Global markets declined alongside crypto, with stocks and precious metals falling while oil surged to record highs amid disruptions at key energy supply routes.
- Over $480 million in long positions were liquidated across crypto markets, amplifying downside pressure as rate cut expectations diminished following Powell’s remarks.
Bitcoin (BTC), the bellwether asset, dropped nearly 5% to $70,600 on Thursday, down from the $74,000 levels seen the previous day. Ethereum (ETH) fell 6% to $2,187, while XRP (XRP), BNB (BNB), Solana (SOL), and Dogecoin (DOGE) experienced losses ranging between 3% and 6%.
Zcash (ZEC), Worldcoin (WLD), and LayerZero (ZRO) bore some of the steepest losses amid the market-wide drop that brought the total crypto market capitalization down to $2.51 trillion.
Crypto prices fell sharply shortly after Israel launched an unprecedented cyber and drone attack on Iran’s largest gas facility, South Pars. According to reports, the massive complex powers nearly 70% of the nation’s domestic gas supply, the loss of which has threatened the country’s power grid.
The strike comes amid an escalating energy war between the U.S., Israel, and Iran, which has led to a blockade at the Strait of Hormuz, a key waterway for global oil transit, and sent crude oil and gas prices soaring to record highs. Iran had earlier vowed to push oil prices to as high as $200.
The latest attack has not only shaken the crypto market but has rippled across traditional finance as well. Notably, Gold has dropped 2.1% over the day, casting investors’ doubts over its safe haven status, while Silver fell 3.5%. Together, these precious metals erased nearly $150 billion from the market.
Traditional stock indices across the globe have also fallen in tandem with risk assets. Notably, Asian benchmarks like Japan’s Nikkei 225 and the Hang Seng have fallen over 2%. Even U.S. indices like the Dow Jones Industrial Average, Nasdaq 100, S&P 500, and Russell 2000 Index have all sharply fallen across the board.
However, oil prices took a different path, rising to new levels. Notably, Brent Crude has jumped 3% to a new record high of $112 on Thursday as traders price in a prolonged disruption in a region that remains a major source of global energy production.
Typically, when gold and cryptocurrency prices crash together, it means traders are fleeing to cash rather than rotating between alternative assets.
Hotter U.S. PPI data and Fed announcement deliver a double blow to bulls
Fears of sticky inflation also played a major role in the crypto market drop today. On Wednesday, the U.S. revealed that the PPI data came in much hotter than expected, with a record monthly gain in a year for wholesale costs. This came as the market was already cautious ahead of the Federal Reserve rate decision that was scheduled for later in the day.
In his speech, Fed Chair Jerome Powell echoed concerns surrounding elevated inflation levels. Powell clarified that the Federal Reserve is prepared to hold interest rates steady as it sticks to a data-driven strategy to combat rising inflation stemming from the oil shock. As such, market hopes for rate cuts this year have fallen slim.
The resulting crash from potential delays in rate cuts and the surging oil price as a result of Middle East tensions together triggered a liquidation cascade across leveraged crypto markets.
Data from CoinGlass shows that over $481 million in long positions were liquidated in the past 24 hours, with Bitcoin and Ethereum accounting for the majority of it, with $143 million and $127 million in long liquidations, respectively.
Long liquidations occur when investors bet on a price increase, and the asset price drops enough to hit their margin limits, forcing the exchange to automatically close their trades.
Disclosure: This article does not represent investment advice. The content and materials featured on this page are for educational purposes only.

TLDR:
- The PBOC added 30,000 ounces in February, pushing official gold reserves to a record 2,309 tonnes worth $387.6 billion.
- Analysts estimate China’s true gold holdings could be two to ten times its official figure due to undeclared accumulation channels.
- The Shanghai Gold Exchange processed 126 tonnes in physical withdrawals in January, with settled gold permanently leaving auditable systems.
- Gold now represents 10% of China’s foreign exchange reserves, a share that has doubled over the past twenty months amid global tension.
China gold reserves have reached a record 2,309 tonnes, valued at approximately $387.6 billion. The People’s Bank of China added 30,000 ounces in February, marking its 16th consecutive month of gold accumulation.
Analysts at Societe Generale, Goldman Sachs, and the World Gold Council estimate that undeclared holdings could be two to ten times the official figure.
Gold now makes up roughly 10 percent of China’s foreign exchange reserves, a share that has doubled in twenty months.
Multi-Channel System Keeps Chinese Gold Flows Out of Sight
The Shanghai Gold Exchange operates under mandatory physical settlement rules. Buyers receive bullion from one of 58 certified vaults spread across 56 Chinese cities.
Once gold exits a certified vault, it cannot re-enter the system. That rule renders the metal permanently invisible to outside auditors and flow-tracking mechanisms.
The SGE processed 126 tonnes of physical withdrawals in January alone. Hong Kong acts as the primary import gateway for routing bullion to the mainland.
London, Switzerland, and Dubai supply 400-ounce bars through over-the-counter channels that never surface in exchange records.
Russia settles bilateral gold deals in yuan, placing those flows outside both PBOC reserves and published trade statistics.
Analyst @shanaka86 described the operation plainly in a post this week. “This is not a central bank buying gold,” the post read. “This is a state operating a multi-channel physical accumulation system designed from the ground up for opacity.”
JUST IN: While the world watches missiles hit gas fields, China is buying gold. Quietly. Relentlessly. For the 16th consecutive month.
The PBOC added 30,000 ounces in February. Official reserves now stand at 2,309 tonnes, a record, valued at approximately $387.6 billion. Gold… pic.twitter.com/qihmdZQ9YS
— Shanaka Anslem Perera
(@shanaka86) March 19, 2026
The comment pointed to how far beyond conventional reserve management this activity extends.
These channels work together to keep the true total hidden from outside observers. China is also drawing commercial crude reserves at one million barrels per day and has suspended nitrogen and potassium fertiliser exports.
Each action appears aimed at building domestic supply buffers while reducing competitor access to key resources.
Gold’s Physical Market Diverges From Paper Pricing as Global Pressure Mounts
Gold is trading at $5,000 per ounce, with retail investors putting $70 billion into ETFs while institutions sell.
That split between physical demand and paper market behavior mirrors the pricing gap between Oman crude and WTI.
Both the retail buyer and the Chinese central bank appear to be reading the same underlying signals.
The Hormuz crisis has added fresh pressure across oil, fertiliser, and LNG supply chains. Physical chokepoints are repricing commodities at a pace that monetary policy cannot match. Gold, unlike oil or LNG, requires no strait, pipeline, or political approval to store value.
At its current pace, China could become the world’s largest sovereign gold holder within a decade. The PBOC’s official figure stands at 2,309 tonnes, while the undeclared total remains unknown.
The dollar still holds its position as the world’s reserve currency. Yet China is building a financial buffer that no sanctions regime can freeze.
That buffer has now been growing for sixteen consecutive months. Nitrogen is stuck behind Hormuz, and LNG faces disruption from burning refineries. Gold, meanwhile, continues flowing through every available channel into Chinese vaults.
The post China Gold Reserves Hit Record 2,309 Tonnes as PBOC Marks 16 Straight Months of Buying appeared first on Blockonomi.


Opinion by: Merav Ozair, PhD, blockchain and AI senior advisor.
Elon Musk and Peter Diamandis support the idea that “everything will be free.” They purport to believe that AI abundance will end poverty and provide a universal high income.
Others in the mega tech ecosystem mention the coming abundance. Demis Hassabis, for example, says AI could spark a “renaissance” of “radical abundance.”
Politicians at the World Economic Forum 2026 in Davos liked Musk’s vision. They were thrilled that their economic problems would soon be “set free.” This story is quite appealing. Who doesn’t like to get things for free?
What does it truly mean? Would all economic activities have no cost? Would all corporations become altruistic and seek no profit?
Let us unpack the narrative.
The cost of production can be cheap, but never zero
Let’s put things in perspective. In the age of AI abundance, products and services will not arrive out of “thin air.” They would still need labor, materials, energy and infrastructure.
The advances in AI and other emerging technologies may lead to very cheap energy and highly automated production. This evolution will result in the marginal cost of most digital and even physical goods approaching zero.
This is due to three main factors. First is the automation of labor, where machines and AI handle almost all production, logistics and many services. The second is advanced manufacturing and AI distribution, like 3D printing, robotics and AI logistics systems that drastically reduce waste and inventory, making “enough for everyone” technically feasible. Lastly, abundant energy — fusion or ultra‑cheap solar makes energy so affordable that it stops being the bottleneck.
Because energy underlies everything physical, all other costs fall.
Plans are already in place. Elon Musk is now prioritizing lunar manufacturing and AI, with a goal of over 1,000 gigawatts of solar power. Using solar energy instead of nuclear power will reduce energy cost to almost zero. The catch: the initial cost to establish the infrastructure on the moon is very high, and it would need to overcome major challenges.
Related: Energym AI dystopia goes viral as crypto projects tout user-owned AI agents
Under those conditions, it is plausible that education resources become somewhat free to the user because they are AI‑generated and infinitely replicable once the system is built. A large fraction of healthcare becomes extremely cheap, once the appropriate AI and robot infrastructure exists.
At the level of physics and engineering, if the real bottlenecks — energy and automation — are abundant, costs collapse, but they do not completely disappear.
Infrastructure is the missing layer that no one talks about
Robotics and energy need to run at scale and speed to create an “abundance” of everything for everyone. For this, it needs infrastructure.
Automation and robotics run on what Jensen Haung calls “AI factories.” This is AI infrastructure, representing a shift towards treating AI development as an industrial process, enabling organizations to continuously train and refine AI models for better safety and efficiency.
They are specialized, high-performance computing data centers designed to “manufacture” intelligence by converting raw data into trained AI models and tokens, rather than simply storing data. Using advanced GPUs and massive interconnected infrastructure, they are the engines of AI applications such as autonomous vehicles, robotics and generative AI.
AI factories are expensive. They need a lot of money to build and run. Companies that have already set up the infrastructure will keep growing and improving. For example, Nvidia is five times more profitable than IBM was in the 1980s, with only a tenth of the staff. Productivity and profits will increase, because AI greatly boosts efficiency. Investments will go to those who own AI models, platforms and especially the infrastructure.
This will lead to the biggest concentration of wealth in history.
Major players include tech giants like Nvidia, AWS and SpaceX. They will continue to dominate the market, making it tough for newcomers to compete.
Governments are also involved. China is using its huge solar energy capacity to boost the energy-heavy AI boom. This creates a unique “AI and energy” ecosystem. Here, artificial intelligence optimises renewable energy generation, while solar power supports data centres. China is seen as a leader in renewable energy use.
Cheap energy is not cheap
Energy is the fuel that runs AI factories, which are the engine of all robotics, automation and AI applications that will generate abundance. Energy fuels the infrastructure, and infrastructure runs the AI applications. Therefore, energy is the real bottleneck. Without cheap energy, this “free” theory fails.
Currently, electricity is the primary form of energy used to run the infrastructure. China is aggressively integrating renewable energy into its infrastructure and other regions are expanding renewable-powered energy into data centers as well. Electricity generation and grid capacity for AI-scale infrastructure is very costly and not scalable. To reach abundance at scale, energy must be very cheap and scalable.
What are the options?
Fission energy is a type of or nuclear energy. It is fully mature, providing stable power, but produces radioactive waste. It carries the risk of nuclear proliferation, and safety concerns regarding meltdowns. It is cheaper than current fossil-based electricity sources but still has a tangible cost, and, like the other electricity sources it is limited, and not scalable.
Fusion energy involves merging light atoms to create energy, mimicking the sun, while traditional nuclear energy splits heavy atoms. Fusion offers nearly limitless, cleaner energy without long-lived high-level waste.
Fusion is inherently safer with no risk of a runaway chain reaction.
The caveat, however, is that fission is what’s currently being used. Creating nuclear fusion for energy is extraordinarily expensive and requires upfront investments of hundreds of billions of dollars, and it is still experimental and likely decades away from large-scale commercial use.
Unlike nuclear fission, nuclear fusion is scalable. It is cheap but not does not cost zero. Someone has to pay the upfront costs to build the infrastructure, to create it and then maintain it.
Elon Musk is going to the moon
Lunar solar power provides ample energy without atmospheric issues. Yet, it has high costs for launching, building and maintaining in a vacuum. Musk’s plan is to move all production, including the AI factory, to the moon.
The moon has low gravity and plenty of resources, making it the cheapest place for AI infrastructure.
Robots will terraform and build infrastructure. Humans will come to oversee and expand, while AI data centres will fuel the space economy.
With Starlink, SpaceX, Optimus robots and xAI, Musk is in a strong position to make this happen.
However, machines for making advanced AI chips need to reach the moon. These bus-sized machines require very precise conditions.
The solution is a new method called Atomically Precise Manufacturing (APM). This builds atom by atom and aligns with Musk’s “first principle” thinking.
If successful, this could unlock unlimited solar energy and raw materials from the moon and asteroids. There would be no thermal limits or atmospheric interference.
This could lead to boundless AI at a low cost. Experts say that if lunar fabrication works, it could create a trillion-dollar, or even hundreds of trillions, opportunity.
Who will benefit most from this hundred-trillion-dollar chance? Will it be shared fairly?
The soft prison of “free”
When you have centralized infrastructures and systems, whoever owns the infrastructure sets the terms of engagement. Strongly centralized systems can provide extensive “free” services, but in exchange, they often demand high control over speech, movement, data and economic choices. Non‑authoritarian welfare states may trade some individual autonomy for security and guaranteed services. Many “free” digital services today are funded by surveillance, profiling and behavioral manipulation — your data and attention are the real price.
In a world of AI abundance, the infrastructure may be government owned. It may be owned by corporations. It could be owned through a public-private partnership. Either way, the infrastructure is centralized and the centralized power will dictate the distribution terms — how AI abundance is distributed, who gets what, under what conditions. If they wish to, they can abruptly “shut the valve” and nothing is distributed either to an individual or a group. Your dependency on their services becomes a “soft prison” stripped of your autonomy and self-sovereignty.
It might be a hundred-trillion-dollar opportunity, but the owner of the centralized infrastructure will get the lion’s share and will dictate what will trickle down to the masses.
They say if something is “free”, you are the product. This remains true in a world of sheer abundance. In that world, the product is your self-sovereignty.
Opinion by: Merav Ozair, PhD, blockchain and AI senior advisor.
This opinion article presents the author’s expert view, and it may not reflect the views of Cointelegraph.com. This content has undergone editorial review to ensure clarity and relevance. Cointelegraph remains committed to transparent reporting and upholding the highest standards of journalism. Readers are encouraged to conduct their own research before taking any actions related to the company.

Piers Morgan Claims Trump Is Losing Control Of Iran War

Today’s NYT Mini Crossword Answers for March 19

The Driscolls reel as Will sticks up for abuser Megan in Coronation Street | Soaps


-
 Crypto World5 days ago
HYPE Token Enters Net Deflation as HyperCore Buybacks Outpace Staking Rewards
-

 Tech4 days ago
Your Legally Registered ‘Motorcycle’ Might Not Count Under Proposed US Law
-

 Fashion6 days ago
Weekend Open Thread: Addict Lip Glow
-
 Tech2 days ago
Are Split Spacebars the Next Big Gaming Keyboard Trend?
-
Sports5 days ago
Why Duke and Michigan Are Dead Even Entering Selection Sunday
-

 Business4 days ago
Search for Savannah Guthrie’s Mother Enters Seventh Week with No Arrests
-

 Business5 days ago
US Airports Launch Donation Drives for Unpaid TSA Workers as Partial Government Shutdown Enters Fifth Week
-
Crypto World5 days ago
Coinbase and Bybit in Investment Talks: Could Bybit Finally Enter the US Crypto Market?
-

 Business3 days ago
Australian shares drop as Iran war enters third week
-

 Business5 days ago
Country star Brantley Gilbert enters growing non-alcoholic beer market
-

 Crypto World3 days ago
Crypto Lender BlockFills Enters Chapter 11 with Up to $500M in Liabilities
-

 Sports6 days ago
College Basketball Best Bets: Conference Tournament Semifinal Picks
-

 Politics23 hours ago
The House | The new register to protect children from their abusers shows Parliament at its best
-

 Business6 days ago
Trump demands Powell cut rates as Iran conflict raises energy prices
-

 Fashion3 days ago
25 Celebrities with Curly Hair That Are Naturally Beautiful
-

 News Videos16 hours ago
RBA board divided on rate cut, unusually buoyant share market | Finance Report | ABC NEWS
-

 Crypto World6 days ago
Senate Votes to Include CBDC Ban in Bipartisan Housing Bill
-

 NewsBeat6 days ago
Deane Road crash near Bolton colleges and university
-

 News Videos6 days ago
Tom Lee: The 100x Opportunity EVEN Bigger Than Bitcoin (New Ethereum Prediction 2026)
-

 Crypto World16 hours ago
Canada’s FINTRAC revokes registrations of 23 crypto MSBs in AML crackdown


You must be logged in to post a comment Login