
Crypto World
Binance to Convert $1 Billion SAFU Reserve From Stablecoins Into Bitcoin

Key Insights
- Binance is converting its $1 billion Secure Asset Fund for Users (SAFU) entirely into Bitcoin (BTC) within 30 days.
- The fund will be maintained at $1B, with top-ups if the value drops below $800 million.
- Although SAFU is an emergency reserve, the move signals growing confidence in Bitcoin.
Binance, the world’s largest crypto exchange by trading volume, has announced plans to convert its $1 billion SAFU reserve from stablecoins into Bitcoin. The conversion is planned to be completed within the next 30 days following the announcement made on Friday, 30th.
The announcement, which came in the form of an open letter to the community, noted that this move was influenced by the exchange’s belief that BTC serves as the core asset in the crypto ecosystem and represents long-term value.
Although this sounds like a bold move, it exposes the funds to the regular Bitcoin price swings, which could devalue the reserve. As a measure, the exchange noted that it will conduct regular rebalancing in case the funds’ market value falls below $800 million to restore them to $1 billion.
SAFU Origin and Previous Uses
SAFU was established in 2018 as an emergency fund to compensate users in extreme events like hacks or platform failures. The reserve is funded through a portion of Binance’s trading fees. Before this announcement, the reserve was primarily held in stablecoins, in particular USDC, following earlier transitions away from BUSD.
Since its introduction, the reserve has managed to come in for users on several occasions. For instance, in May 2019, when hackers stole over 7,000 BTC (about $40 million at the time) from Binance, affected users were compensated through SAFU. Also, the reserve was used to compensate clients for the COVER Finance minting hack that happened in December 2020.
Out of this, Binance has promoted SAFU as a core pillar of its trust and risk management, noting that it holds user assets fully backed on a 1:1 basis. Also, the exchange has always made the SAFU wallet address publicly available, allowing on-chain verification of the funds.
SAFU wallet address: 0x420ef1f25563593aF5FE3f9b9d3bC56a8bd8c104
What is the Market Impact?
At the current market price, the $1 billion SAFU conversion would represent roughly 12,000 BTC. Although these assets are for emergency user protection rather than corporate treasury strategy or shareholder value creation, market sentiment suggests the shift could introduce steady buying pressure.
Spreading the conversion over 30 days implies roughly $33 million in daily Bitcoin purchases. While prices have not reacted sharply to the announcement, this consistent demand could help stabilize the market and potentially support a rebound in the days ahead.

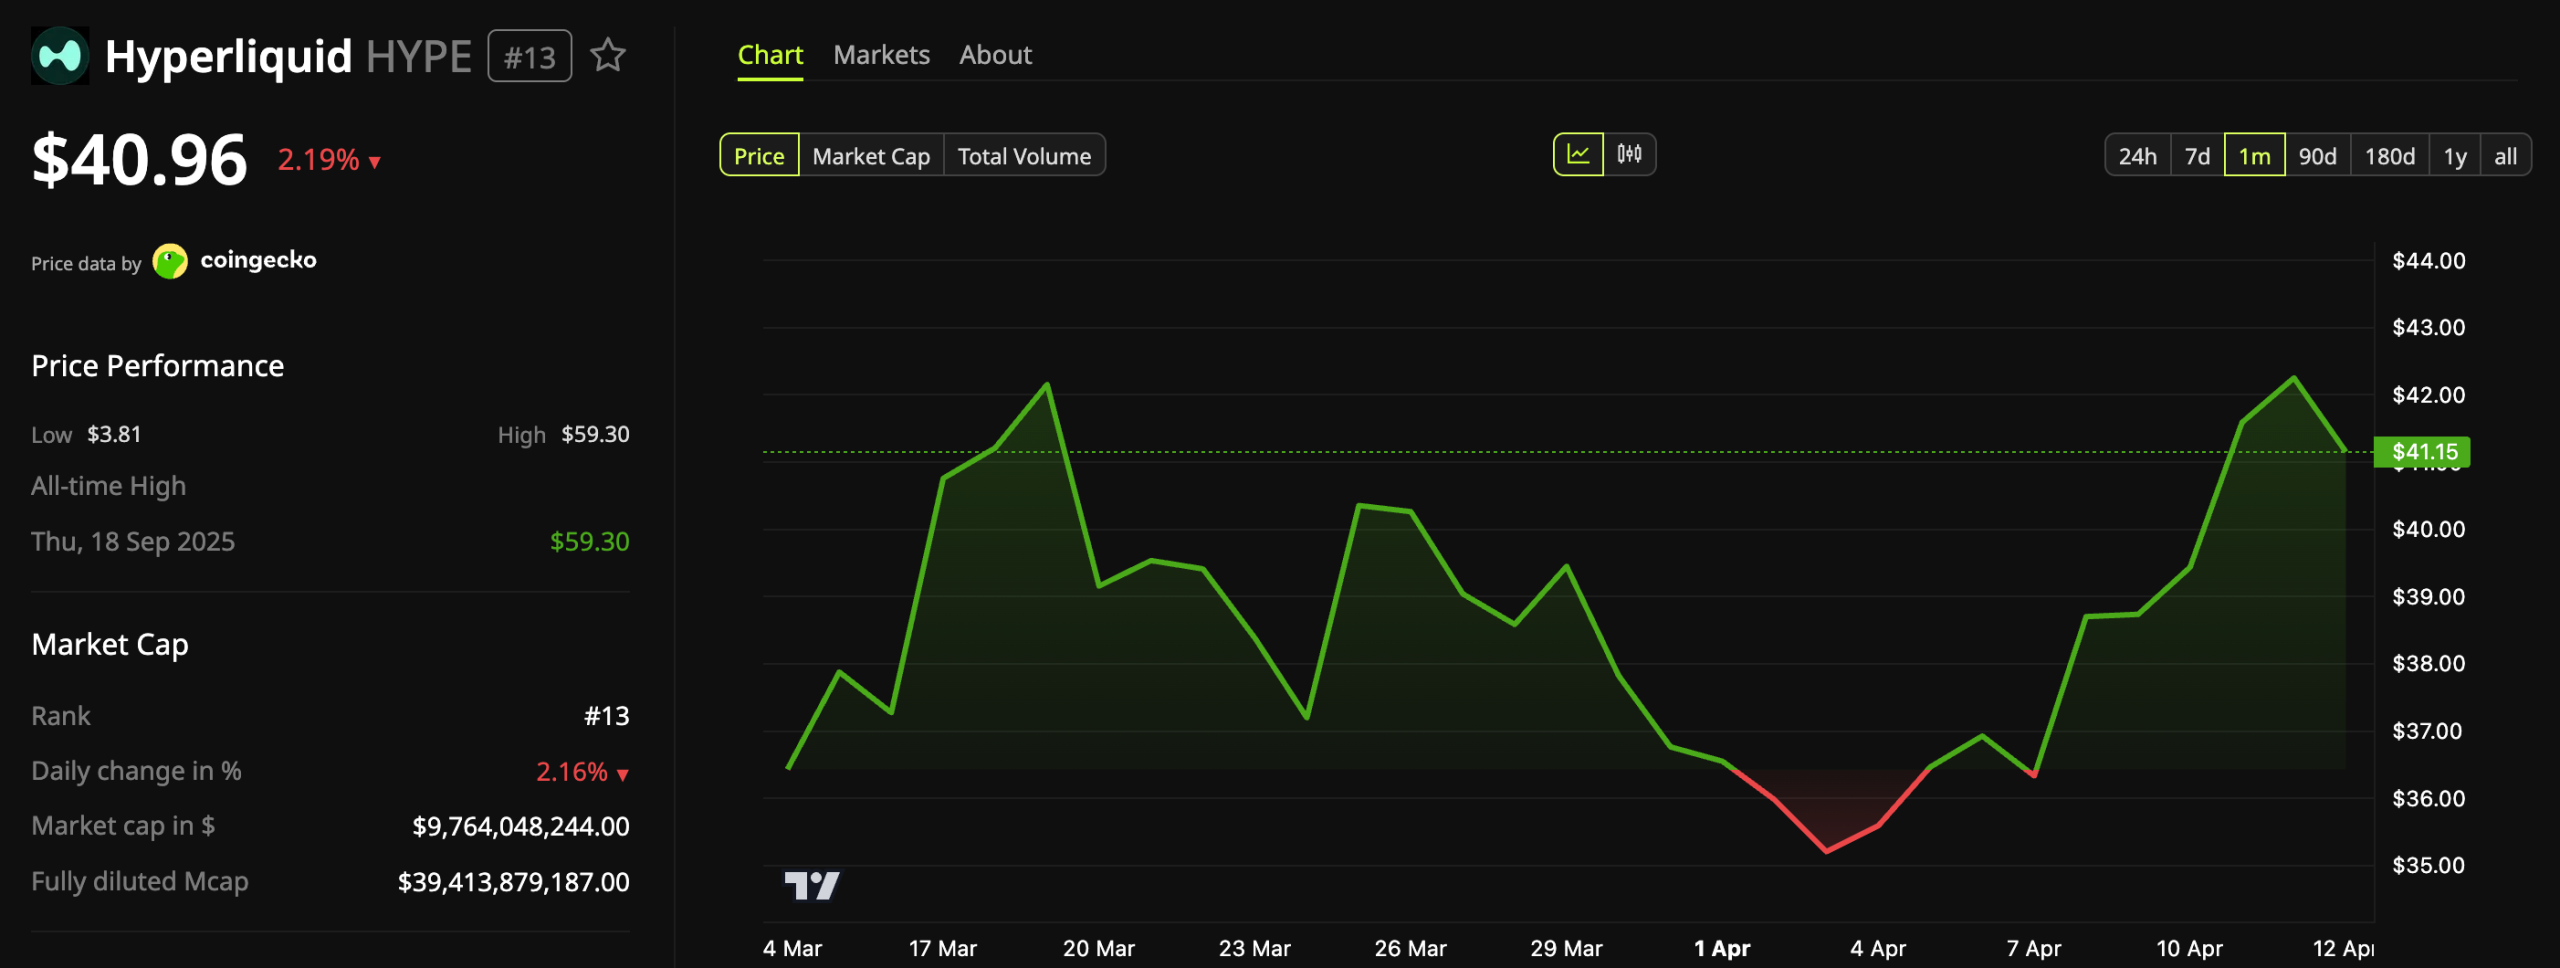
Arthur Hayes, co-founder of BitMEX, has added to his Hyperliquid (HYPE) position, purchasing 26,022 tokens worth approximately $1.1 million.
The buy, flagged by on-chain tracker Lookonchain, marks his first HYPE accumulation in roughly three months, signaling renewed confidence in the token.
Why Arthur Hayes Is Doubling Down on Hyperliquid
With this latest addition, his total holdings now stand at 247,334 HYPE, valued at approximately $10.44 million. The position is sitting on unrealized gains of 27.22%, equivalent to around $2.23 million in profit.
This reflects a strong return on his initial investment despite broader market volatility in the crypto space. The renewed accumulation follows Hayes’s public declaration on April 8.
Follow us on X to get the latest news as it happens
Hayes has maintained a $150 price target for the token by August 2026, roughly a 266% increase from current levels. The executive pointed to Hyperliquid’s revenue model as a key driver.
The platform returns 97% of its trading fees to buy back and burn HYPE from the open market, creating a deflationary loop that ties token value directly to platform usage.
Meanwhile, the acquisition comes as institutional interest in HYPE is also rising. Bitwise filed an amended registration statement with the SEC, adding the ticker BHYP and a 0.67% management fee.
Bloomberg analyst Eric Balchunas said such additions typically signal a fund may launch soon. Last month, Grayscale submitted its own S-1 application to list the Grayscale HYPE ETF on Nasdaq under the ticker GHYP.
A potential ETF approval could open the door to significant institutional capital inflows into HYPE, potentially driving broader adoption and renewed price momentum for the token.
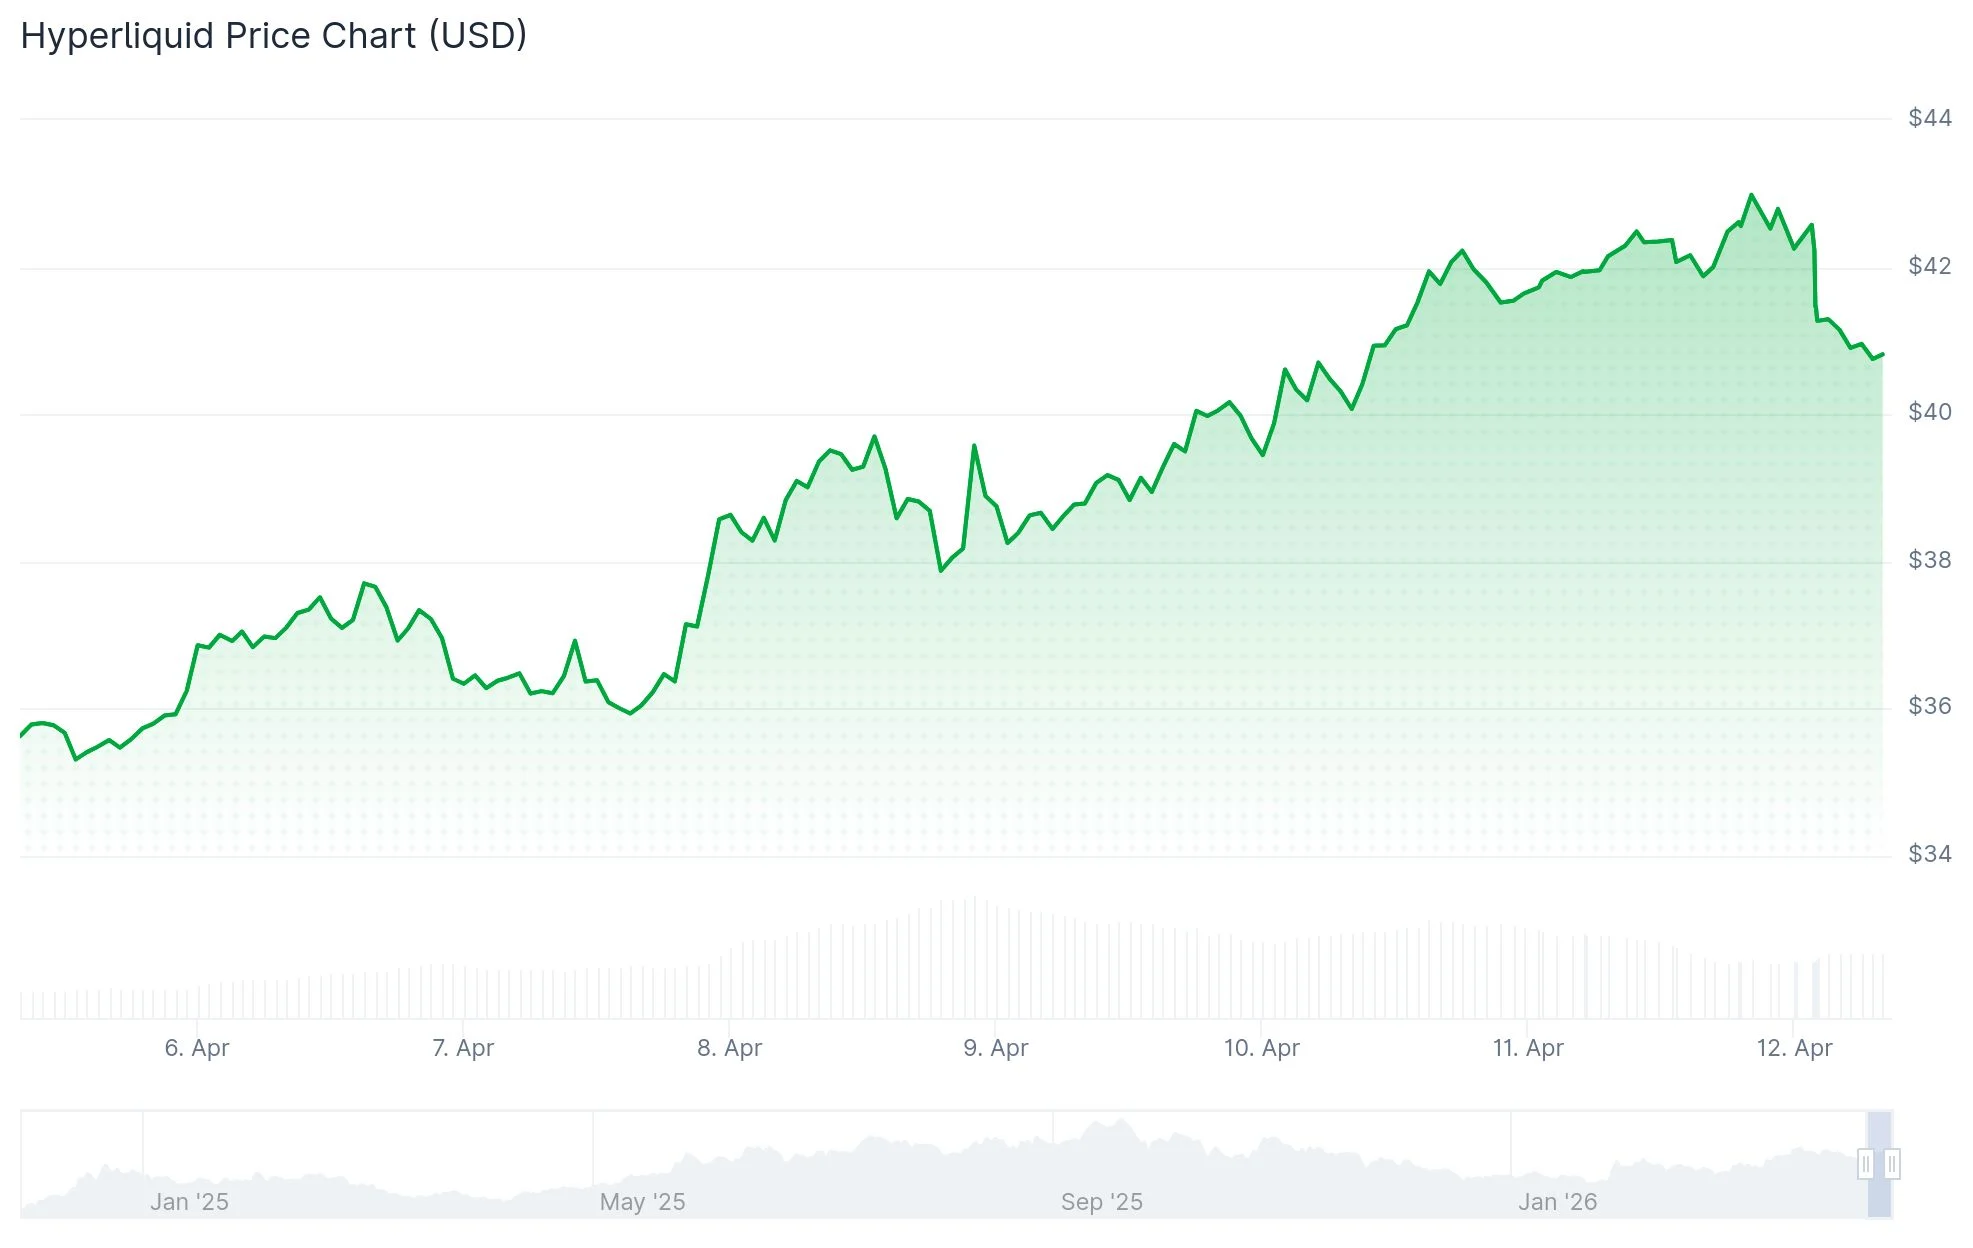
HYPE has been one of the strongest large-cap performers over the past year, gaining roughly 176% according to CoinGecko data. However, it has not escaped broader market pressure.
The token slipped approximately 2% in the past 24 hours to around $40.91 as the US and Iran failed to reach an agreement.
Meanwhile, decentralized exchange activity is contracting across the board. Total DEX spot volume fell 23.9% to $212 billion in March, the lowest monthly figure since October 2024.
Monthly perpetual DEX volumes dropped to $699 billion in March, down from a peak of $1.369 trillion in October 2025, according to DefiLlama data. Hyperliquid still leads the perp segment, but the five-month downtrend raises questions about whether fee-driven buybacks can sustain their pace if trading activity continues to cool.
Whether ETF approvals and sustained whale accumulation can offset that macro softening remains the key question for HYPE holders heading into Q2.
Subscribe to our YouTube channel to watch leaders and journalists provide expert insights
The post Arthur Hayes Buys $1.1 Million in HYPE After 3-Month Break appeared first on BeInCrypto.


Bitcoin gave up its late-week gains on April 12 after the United States and Iran failed to secure a permanent peace agreement.
Summary
- Bitcoin fell sharply after US-Iran peace talks failed to produce a permanent agreement over the weekend.
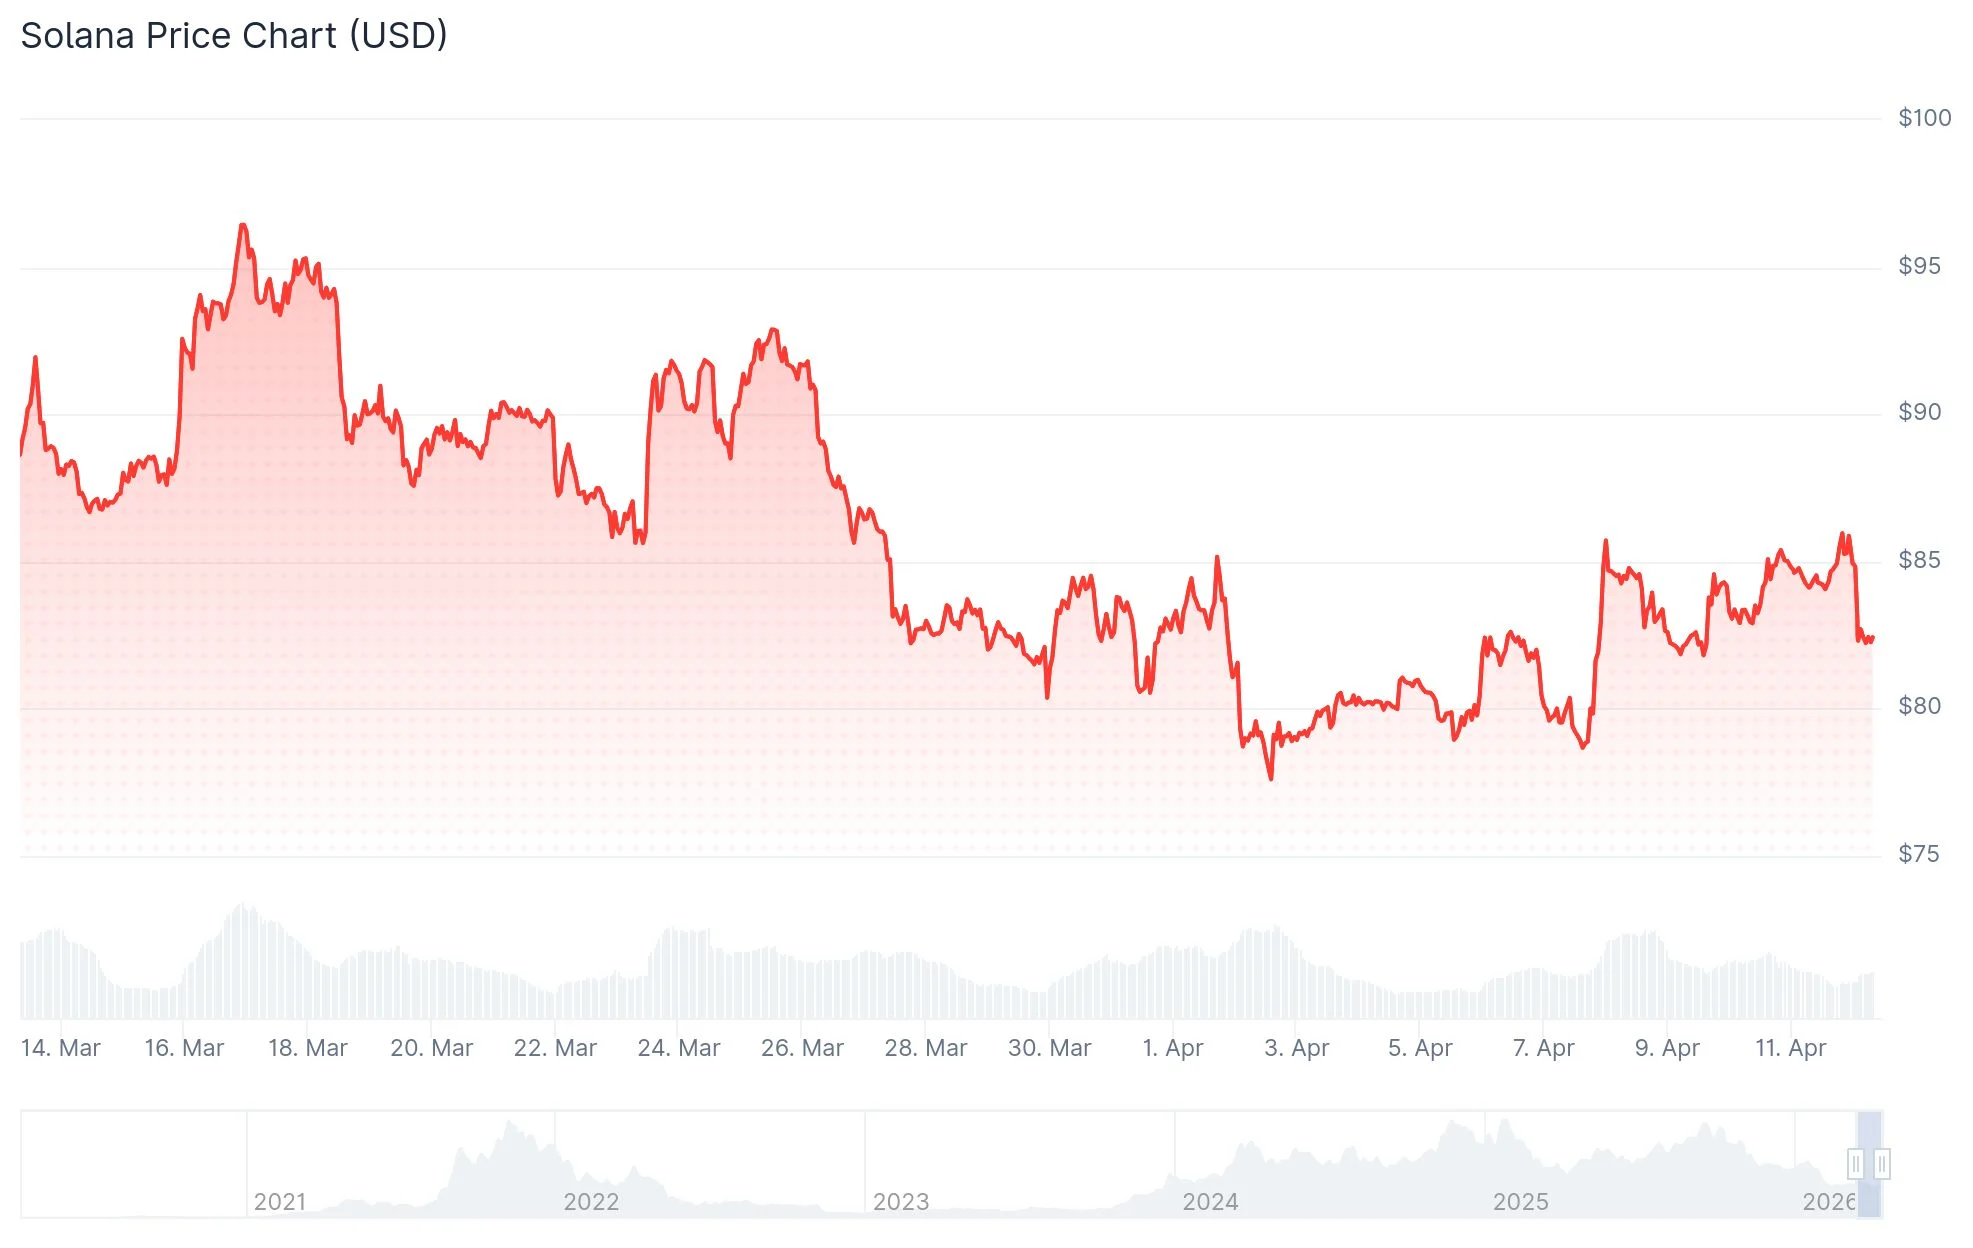
- Ethereum, XRP, BNB and Solana declined as the wider crypto market turned lower today.
- RAVE rose another 40% and extended gains above 1,000% despite the broader market pullback.
The pullback ended a steady rise that started after both sides announced a two-week ceasefire, and it pushed most major altcoins lower.
Bitcoin started the week with gains after reports said the United States and Iran had opened ceasefire talks. The asset moved from about $67,000 to $70,000 before fresh doubts around the talks brought back volatility.
The price then climbed again after President Donald Trump announced a ceasefire on Tuesday. Bitcoin rose above $72,000 and later moved close to $73,000 as traders responded to easing geopolitical stress and fresh market speculation around the Strait of Hormuz.
Bitcoin kept rising into the weekend as peace talks in Pakistan approached. The asset reached nearly $74,000 late on April 11, extending the recovery that followed the ceasefire news.
That move ended early on April 12. Bitcoin fell by more than $2,000 within minutes after Vice President JD Vance said both sides had failed to reach a lasting agreement. At the time of reporting, Bitcoin traded near $71,500, down 1.5% on the day.
Ethereum, XRP and Solana move lower
Most large-cap altcoins also posted losses after Bitcoin reversed. Ethereum fell about 1% but stayed above $2,200, while XRP slipped to $1.33 after a similar daily decline.
BNB dropped below the $600 level, and Solana lost more than 2%. HYPE, Cardano and Bitcoin Cash each fell by more than 3%, while Polkadot and RAIN posted deeper losses during the broader market pullback.
RaveDAO’s native token moved against the wider market trend and rose another 40% on the day. The token has gained more than 1,000% since last Sunday and has entered the top 100 altcoins by market value.
The total crypto market cap fell by more than $30 billion and dropped to $2.51 trillion. Bitcoin’s market cap stood at about $1.43 trillion, while its market dominance remained above 57%.
Disclosure: This article does not represent investment advice. The content and materials featured on this page are for educational purposes only.
Ether Machine has abruptly halted its planned public debut after announcing a mutual termination of its merger with Dynamix Corporation, a Nasdaq-listed SPAC. The move comes as market conditions deteriorate and investor appetite for complex crypto-finance deals remains tepid.
The companies disclosed the termination in a post on X on Saturday, saying the deal was ended by mutual consent and effective immediately. The arrangement would have seen Ether Machine combine with Dynamix, with The Ether Reserve LLC also involved, to pursue a Nasdaq listing under the ticker ETHM.
In its notice, Ether Machine cited unfavorable market conditions as the reason for calling off the deal. A separate filing with the U.S. Securities and Exchange Commission confirms an unnamed “Payor” — identified in Annex A of the merger agreement but not publicly disclosed — must pay $50 million to Dynamix within 15 days of the termination, signaling a substantial break fee amid the collapse of the transaction.
For readers following the story of Ethereum treasury strategies and SPAC-driven crypto listings, the termination marks a notable shift in a sector that had been trying to scale institutional-grade ether yield through public markets.
Earlier reporting around Ether Machine’s ambitions paints a broader backdrop: the firm, co-founded by former ConsenSys executives Andrew Keys and David Merin, announced last year its plan to launch what it described as the largest yield-bearing Ether fund targeted at institutional investors. The plan entailed listing on Nasdaq under the ETHM ticker and managing a substantial ether treasury.
Ether Machine’s path to the market gained momentum in September with a $654 million private financing round, including 150,000 ETH from Jeffrey Berns, a prominent Ethereum advocate who joined the company’s board. That fundraising was positioned as a runway to deploy a large ETH treasury ahead of a possible Nasdaq debut, but the public listing now appears off the table for the foreseeable future.
The termination also reshapes how market participants assess the feasibility of ambitious treasury strategies tied to public listings. SPAC-backed crypto ventures had offered a route to scale institutional access to yield-generation strategies using large ether holdings, but the deteriorating market environment has already put such plans under strain.
Key takeaways
- Ether Machine and Dynamix terminate their business combination agreement, effective immediately, citing unfavorable market conditions.
- A $50 million payment obligation from an unnamed Payor to Dynamix is due within 15 days of termination, per an SEC filing.
- The deal would have enabled Ether Machine to list on Nasdaq as ETHM and manage a treasury exceeding 400,000 ETH, valued at more than $1.5 billion at launch.
- Dynamix retains a limited window for a new deal, with a deadline of November 22, 2026 to complete another business combination; failure would trigger liquidation and fund returns to shareholders.
Deal dynamics and the optics of crypto SPACs
Ether Machine’s announced vision sought to construct a large, yield-bearing ether treasury designed to appeal to institutional investors seeking crypto exposure with income features. The company positioned the treasury as a strategic asset to be deployed through structured strategies and yield products that could be embedded in a Nasdaq-listed vehicle. The plan also reflected a broader push at the time to bring sophisticated crypto-finance products into traditional capital markets via SPAC mergers and public listings.
With the termination, observers are left to weigh what it means for the broader ecosystem. The immediate cash obligation signals a termination cost that could influence how aggressively similar ventures pursue public-market strategies in uncertain macro conditions. It also raises questions about the speed with which ether-treasury initiatives can transition from private fundraising to public market access, especially when market volatility or liquidity constraints complicate deal execution.
Ethereum treasury activity in context
The news arrives as Ethereum treasury strategies continue to evolve under pressure. Recent reporting highlights a wave of adjustments among major ether-holding funds. Trend Research has unwound a substantial portion of its Ethereum position, selling 651,757 ETH (roughly $1.34 billion at the time) and locking in an estimated $747 million loss. The move underscores the difficulty of sustaining large, public-market-backed ether holdings amid shifting risk appetites and capital costs.
Another notable development in the space is ETHZilla’s transformation into Forum Markets, signaling a broader pivot away from aggressive Ether accumulation toward evolved capital-market playbooks for blockchain treasuries. The shifting branding and strategy reflect a more cautious approach to building sizable ETH troves in an environment of heightened scrutiny and evolving regulatory and liquidity considerations.
Taken together, these dynamics illustrate a market where the allure of large ether treasuries and public-market access competes with practical constraints — volatile crypto markets, policy risk, and the inherent complexity of managing multi-hundred-thousand ETH positions within publicly traded vehicles.
What comes next for Ether treasuries and crypto finance?
As Ether Machine closes its public-listing chapter, investors and builders will be watching whether the market can sustain or rekindle appetite for SPAC-driven crypto ventures. The immediate question is whether Dynamix or Ether Machine will pivot to alternative financing routes or private negotiations, and how quickly a viable path to scale ether-backed yield strategies can reemerge in a climate that remains sensitive to liquidity and regulatory signals.
Meanwhile, the broader trend in Ethereum treasuries suggests ongoing experimentation with how to balance strategic accumulation with risk management, governance rights, and the costs of capital. Market participants may increasingly favor more flexible, privately negotiated structures or on-exchange vehicles that can adapt to rapid shifts in sentiment without exposing investors to outsized termination risk or forced liquidations.
As regulators continue to scrutinize crypto investment vehicles and as institutional tolerance for illiquidity and complexity evolves, observers should monitor whether new partnerships or alternative SPAC arrangements emerge that offer clearer economics or more robust investor protections than those contemplated in high-profile, headline-grabbing bets like ETHM.
What remains uncertain is how quickly the market environment will improve for such ambitious treasury plays and whether Ether Machine or similar entrants will re-enter the public market path with revised terms, different structures, or a fundamentally altered approach to building Ethereum-backed yields for institutions.
Readers should keep an eye on any follow-up disclosures from Dynamix and Ether Machine, including updates on potential new deals, revised capital plans, or shifts in the management and governance of ether treasuries that could signal a broader rethinking of how crypto assets are monetized through public-market vehicles.
Crypto World
Kenya Advances Virtual Asset Regulation as Draft VASP Regulations 2026 Conclude Public Participation

TLDR:
- Kenya’s VASP Regulations 2026 operationalize the Virtual Asset Service Providers Act, covering crypto licensing rules.
- Consumer protection rules mandate clear risk disclosures, transparent pricing, and strict segregation of customer assets.
- Market integrity measures enforce zero tolerance for manipulation, insider trading, and false trading on all platforms.
- The National Treasury, Central Bank of Kenya, and Capital Markets Authority will jointly oversee VASP compliance.
Virtual Asset Service Providers regulations in Kenya have moved closer to becoming law. The National Treasury recently concluded public participation on the Draft VASP Regulations, 2026.
The framework operationalizes the Virtual Asset Service Providers Act, 2025. It sets out clear rules for licensing, regulating, and supervising virtual asset businesses in and from Kenya. The regulations address cryptocurrencies, tokenized assets, and stablecoins.
A Framework Built on Safeguards and Consumer Protection
The VASP Regulations introduce several safeguards to maintain trust in the sector. These include fit and proper ownership requirements and adequate capital thresholds.
Strong governance frameworks and risk management standards are also required. Anti-money laundering and counter-terrorism financing compliance apply to all operators.
Consumer protection sits at the center of the draft regulations. Licensed businesses must give clients clear risk disclosures ahead of any engagement.
Transparent pricing and effective complaint-handling mechanisms are mandatory for all providers. Strict rules on segregation and protection of customer assets are also included.
The National Treasury shared the framework details through its official X channels. It noted that Kenya aims to harness innovation while safeguarding financial stability and protecting consumers.
The tweet came as public participation on the draft rules recently concluded. The Treasury described the framework as one that establishes a fair and transparent competitive market.
Beyond consumer protection, the regulations aim to strengthen investor confidence. The framework is expected to unlock new economic opportunities in Kenya’s digital asset space.
Kenya’s move aligns with global trends as more nations establish formal regulatory structures for virtual assets. A structured market tends to draw institutional participants and broader investor engagement over time.
Market Integrity, Oversight, and Coordinated Supervision
Market integrity measures form another key part of the draft VASP Regulations. Fair and orderly trading rules apply to all licensed virtual asset service providers.
Due diligence must be completed before any virtual asset is listed on a platform. Continuous market monitoring remains a standing requirement under the proposed framework.
The regulations carry a zero-tolerance stance on manipulation, insider trading, and false trading. This mirrors standards found in traditional securities markets globally.
Continuous reporting and disclosures are required from all licensed entities. Both onsite and offsite supervision will be employed by regulators to ensure compliance.
Cybersecurity and incident reporting frameworks are embedded in the regulations. Mandatory audits, insurance coverage, and prudential requirements further support operational resilience.
These measures address risks historically tied to unregulated digital asset markets. They also bring Kenya’s approach in line with international regulatory standards.
Implementation follows a whole-of-government approach. The National Treasury, Central Bank of Kenya, and Capital Markets Authority will provide coordinated oversight.
The next step involves reviewing and consolidating all stakeholder submissions before finalization. Stakeholders are encouraged to follow updates as Kenya advances this regulatory process.

Crypto World
Justin Sun Accuses World Liberty Financial of Blacklisting His Wallet After $75 Million Investment
TLDR:
- Justin Sun, WLFI’s largest private investor with $75M in, claims his wallet was blacklisted without prior notice or disclosure.
- A hidden smart contract function allegedly gave World Liberty Financial unilateral power to freeze any token holder’s assets.
- Sun challenged WLFI’s governance votes, arguing key information was withheld and the team predetermined outcomes.
- Sun demanded the immediate unlocking of his tokens and called on WLFI to rebuild trust through full transparency and integrity.
World Liberty Financial is under scrutiny after its largest private investor raised serious allegations of misconduct. Justin Sun, founder of the TRON blockchain, invested over $75 million in the platform.
He claims the project used a hidden backdoor in its smart contract to blacklist his wallet. Sun says no investor was informed about this feature beforehand.
The situation raises pressing questions about transparency and investor protections in the decentralized finance space.
Sun Exposes a Hidden Blacklist Function in WLFI’s Smart Contract
Justin Sun went public with his allegations through a post on his official social media account. He stated that World Liberty Financial embedded a blacklisting function inside the WLFI token smart contract.
This function gave the company unilateral power to freeze any token holder’s access without notice. According to Sun, investors were never told about this capability before committing their capital.
Sun described the mechanism as a direct contradiction of the project’s stated mission. World Liberty Financial had publicly positioned itself as a decentralized finance platform promoting financial freedom.
A hidden freeze function, he argued, runs counter to everything decentralization stands for. He called it “a trap door marketed as an open door.”
In his post, Sun wrote that the function allows the company to “freeze, restrict, and effectively confiscate the property rights of any token holder, without notice, without cause, and without recourse.”
He identified himself as the first and single largest victim of this practice. His wallet was reportedly blacklisted back in 2025. He stated this violated basic investor rights and core blockchain principles.
Sun also challenged the governance votes the project used to justify its decisions. He argued that key information was withheld from participants and meaningful involvement was restricted.
The results, he claimed, were predetermined rather than genuinely community-driven. These votes, in his view, served the interests of the team — not the broader investor base.
Sun Demands Token Unlock and a Return to Transparency
Beyond his personal dispute, Sun raised wider concerns about the WLFI team’s overall conduct. He accused the team of extracting fees from users without proper community authorization.
He further claimed they treated the crypto community as a personal revenue source. None of these actions, he said, were approved through any fair governance process.
Sun was careful to separate his dispute from his broader political support. He reiterated his backing for President Trump’s crypto-friendly policy direction.
His grievance, he stressed, lies specifically with bad actors operating within the WLFI team. He maintained that their conduct has nothing to do with him or fellow investors who believed the project’s promises.
Sun called the team directly to reverse the blacklisting of his wallet. He also urged the project to adopt genuine transparency going forward.
He wrote: “Unlock the tokens and uphold transparency for the community. Let’s build with integrity, not misconduct.” As of publishing, World Liberty Financial had not issued any public response to his allegations.
Quick Overview
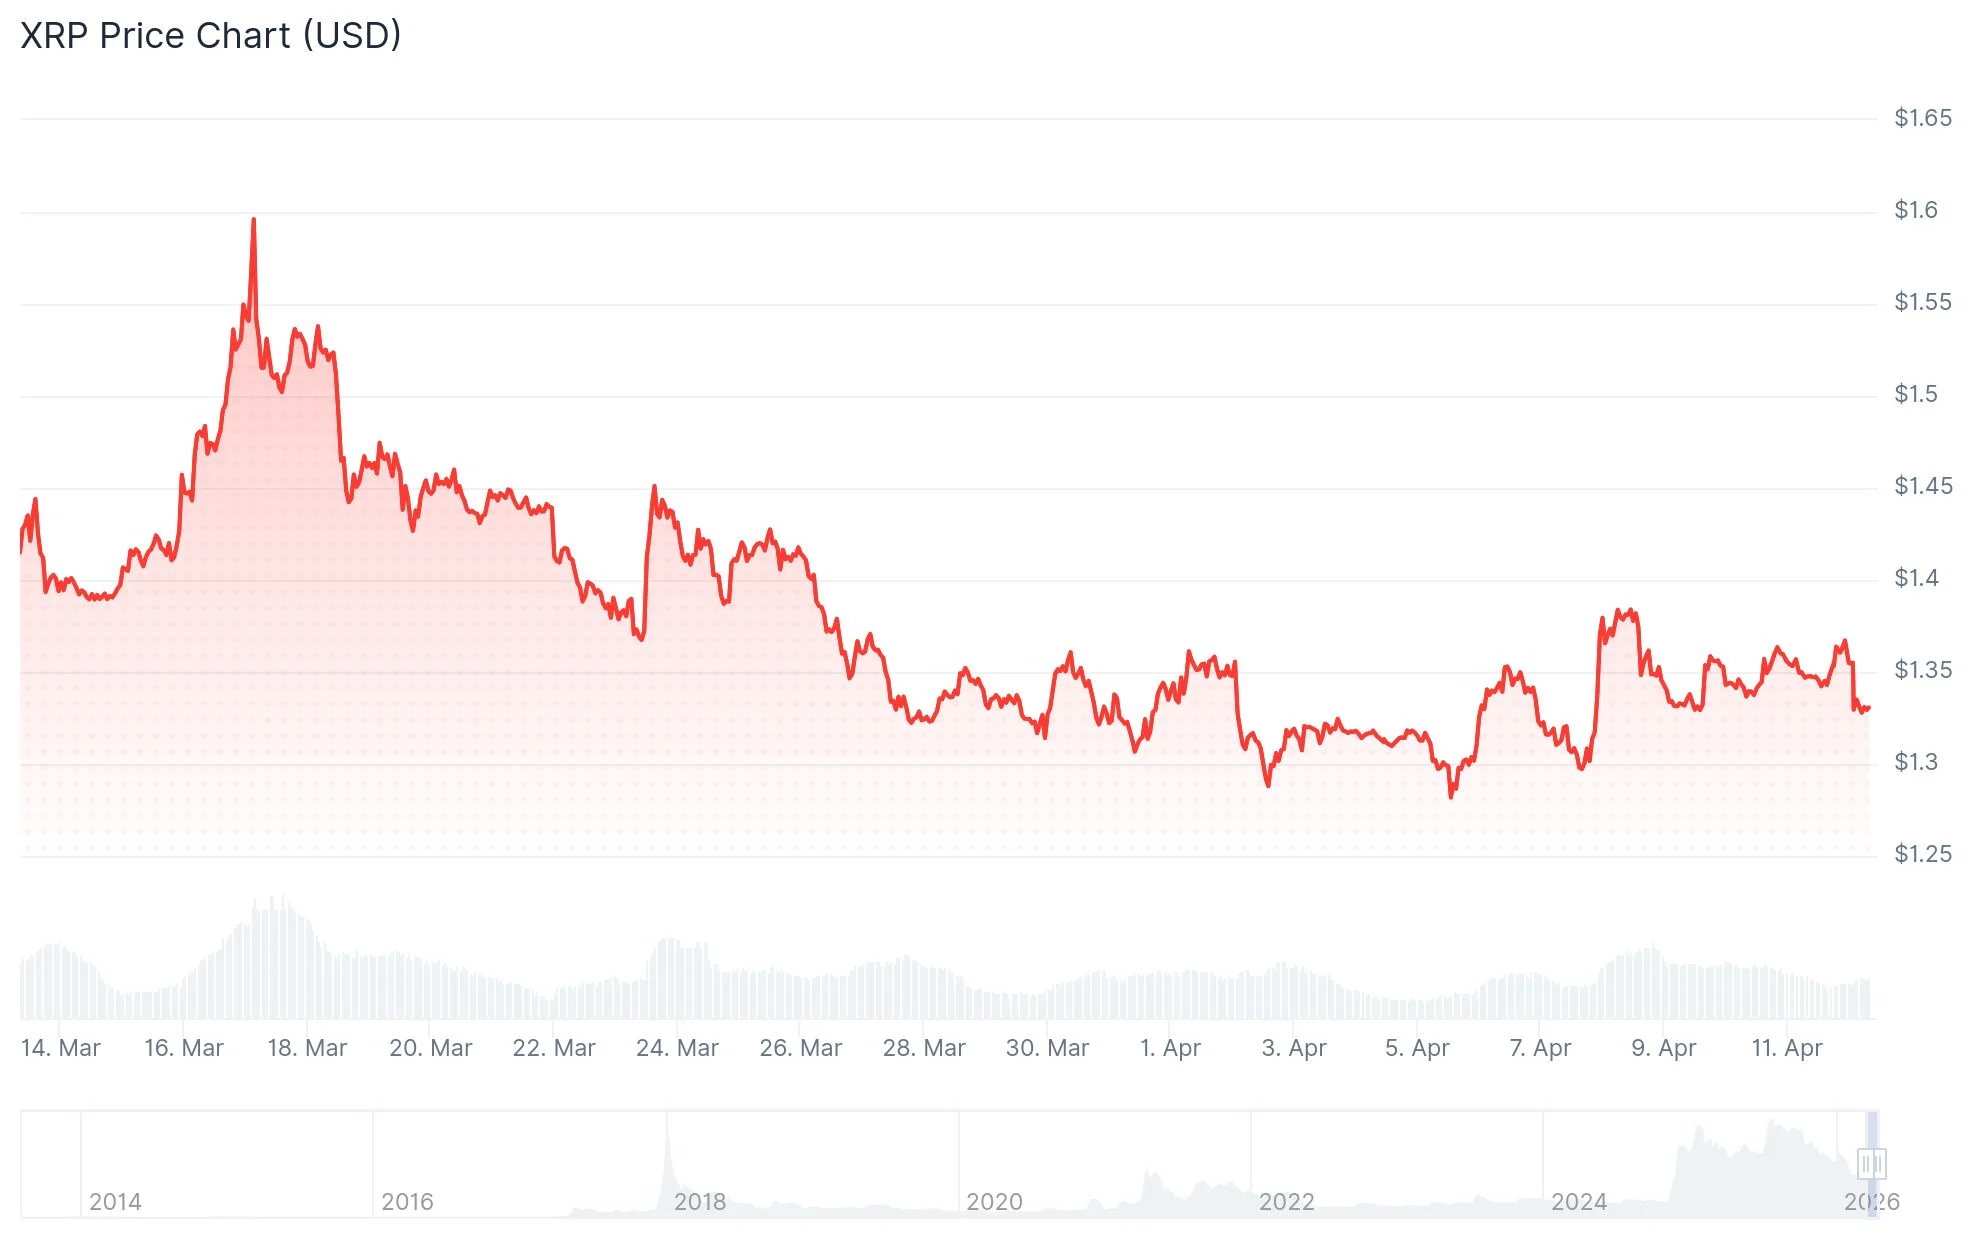
- XRP is currently valued at approximately $1.33 with an $81.6B market capitalization; Solana sits at roughly $82.29 with a $47.3B market cap
- While Ripple’s SEC legal battle has concluded, a $125M penalty and restrictions on institutional token sales persist
- Major corporations including Mastercard, Worldpay, and Western Union have already adopted Solana’s Developer Platform
- XRP concentrates on international payment solutions; Solana operates across payments, digital currencies, asset tokenization, and blockchain development infrastructure
- Solana’s token circulation nears its maximum supply, creating a more transparent valuation framework compared to XRP
Among major cryptocurrencies beyond Bitcoin and Ethereum, XRP and Solana stand out as two of the most closely monitored digital assets. While both command significant market attention, their investment narratives diverge considerably.
Data from CoinGecko shows XRP hovering around $1.33 with a market capitalization approaching $81.6 billion. Meanwhile, Solana trades near $82.29 with a market cap of approximately $47.3 billion. XRP currently maintains the larger market valuation between the two.

This substantial market cap difference carries investment implications. XRP’s larger valuation suggests Solana could have greater upside potential if network adoption continues accelerating.
XRP’s value proposition centers on facilitating international payments and Ripple’s expansion into financial infrastructure. According to Reuters, Ripple’s extended legal dispute with the SEC has essentially concluded.
Yet the matter isn’t entirely settled. A $125 million penalty stands, and Ripple continues operating under an injunction affecting institutional XRP transactions.
This creates a nuanced environment for XRP as we progress through the latter half of 2026. While regulatory headwinds have diminished compared to the lawsuit’s peak, the token’s price trajectory remains largely dependent on Ripple-driven adoption initiatives.
Solana’s Multi-Faceted Ecosystem Strategy
Solana distinguishes itself through diversification across numerous blockchain applications. The network operates in payment processing, stablecoin infrastructure, tokenized securities, blockchain development tools, and enterprise solutions.
Solana’s March 2026 ecosystem report unveiled the Solana Developer Platform launch. Among the platform’s inaugural corporate adopters are Mastercard, Worldpay, and Western Union.
This type of institutional engagement spanning diverse industries differs significantly from XRP’s payment-centric approach. Multi-vertical platforms typically attract investment capital from varied sources over extended periods.
Token Supply and Valuation Models
XRP operates with a predetermined ceiling of 100 billion tokens, though only approximately 61 billion are presently in circulation. This substantial difference between circulating and maximum supply remains a point of ongoing investor scrutiny.
Solana features roughly 570 million tokens circulating from a total supply approaching 574.5 million. This tight margin means its current market price more accurately represents its fully diluted valuation.
Solana does implement continuous token issuance through its staking mechanism, which investors should factor into their analysis. XRP doesn’t face similar ongoing token creation.
Solana also exhibits higher price volatility between the two assets. Conservative investors seeking stability may find this characteristic unappealing.
Investors prioritizing straightforward narratives will appreciate XRP’s focused approach, widespread exchange availability, and improved regulatory standing compared to previous years.
Conversely, investors targeting growth opportunities and ecosystem expansion will find Solana’s diversified adoption strategy and corporate partnerships more compelling as of mid-2026.
The addition of Mastercard, Worldpay, and Western Union to the Solana Developer Platform during its initial phase represents the most significant institutional development between these two assets in recent months.
Investment Takeaway
Both XRP and Solana have secured their positions among premier cryptocurrency assets. XRP benefits from reduced legal uncertainty and dedicated institutional backing. Solana offers broader platform capabilities, prominent corporate partnerships, and expanding ecosystem activity. The optimal choice depends on whether investors prefer a concentrated payment-focused position or a diversified blockchain platform approach.
TLDR:
- Covenant AI’s exit from Bittensor’s top subnets triggered a sharp $TAO price drop near $265.
- Co-founder Jacob Steeves denied centralization claims but apologized for losses suffered by holders.
- Community miners are reviving subnets 3, 39, and 81 using open-source code after Covenant’s departure.
- The Locked Stake upgrade would tie subnet ownership to time-locked $TAO to ensure team commitment.
Bittensor co-founder Jacob Steeves issued a public apology on April 11 after Covenant AI’s exit sent $TAO prices sharply lower.
Covenant AI had operated three of the network’s top-performing subnets, including Templar for large-model AI training.
The firm accused Steeves of centralizing control through emission suspensions and timed token sales. Steeves denied the claims but acknowledged the financial harm to $TAO holders. The token has since stabilized near $265 as community miners work to revive the affected subnets.
Covenant AI’s Departure and the Accusations That Followed
Covenant AI operated subnets 3, 39, and 81, which ranked among Bittensor’s most active and recognized nodes. The firm’s sudden exit left miners and investors without clear direction on those critical subnets. Its departure marked one of the most disruptive events in Bittensor’s recent history.
Samuel Dare, a central figure at Covenant AI, was identified by Steeves as the source of the conflict. Dare allegedly took deliberate steps to cause maximum harm to the protocol and its wider community. The accusations made against both parties quickly drew attention across the crypto space.
The specific claims against Steeves included suspending subnet emissions and conducting timed token sales. These actions, Covenant AI argued, contradicted Bittensor’s core permissionless and decentralized design. Steeves rejected all allegations and addressed them across multiple posts on X.
The exit triggered a sharp price drop in $TAO, rattling confidence among long-term holders and active miners. Community members quickly turned to the open-source codebase to assess how subnet operations could continue. The episode exposed real vulnerabilities in how subnet ownership and commitment are currently structured.
Steeves Issues Personal Apology to $TAO Holders
Steeves addressed $TAO holders directly, acknowledging the financial and emotional damage caused by the crisis. He described the events as deeply personal, calling Dare a former trusted colleague and friend. His statement was candid and notably free of corporate deflection.
Steeves wrote that those one helps most can sometimes inflict the greatest harm. He connected the betrayal to broader human failures that inevitably arise within open, permissionless systems. Despite that, he stated he could not regret building Bittensor on principles of radical openness.
Community miners moved quickly, organizing to restart the three suspended subnets using publicly available code.
Former Covenant AI team members were reportedly in discussions to help continue the original work. The open-source foundation of those subnets made a technical recovery genuinely possible.
Locked Stake Proposal Aims to Prevent Future Subnet Exits
Steeves proposed a protocol-level upgrade called Locked Stake to close accountability gaps in subnet ownership. The feature would tie subnet control to time-locked $TAO, making team commitment verifiable on-chain. Ironically, it was reportedly one of the last initiatives Dare worked on before leaving.
Under the proposal, subnet owners would signal long-term conviction through the duration of their token lock. Investors would gain greater predictability before committing capital to any team’s subnet. Teams with longer lock periods would effectively compete on commitment, not just technical performance.
Steeves acknowledged that failing to implement the upgrade sooner was a genuine error on his part. He suggested earlier adoption might have prevented the current breakdown entirely. A detailed community discussion is planned for the upcoming Thursday call on the Bittensor Discord.
The proposal targets one of crypto’s oldest unsolved problems: measuring team commitment in open systems without relying on legal contracts.
Steeves argued that legal accountability is too slow and too corruptible for the pace of modern AI development. A cryptographic solution, he maintained, is the only credible path forward for decentralized AI networks.
TLDR
- SpaceX maintains custody of 8,285 BTC valued at roughly $603 million through Coinbase Prime
- Financial performance reversed from $8 billion in gains to a $5 billion deficit in 2025
- Annual revenue reached $18.5 billion, though xAI integration expenses exceeded income
- The bitcoin treasury has stayed static since the middle of 2024
- SpaceX ranks as the fourth-biggest corporate entity holding bitcoin publicly
According to The Information’s Friday report, SpaceX recorded approximately $5 billion in losses for 2025. This represents a dramatic shift from the company’s roughly $8 billion in profits during the previous year.
https://x.com/blckchaindaily/status/2043174140723798502?s=20
The revenue picture tells a different story. SpaceX generated $18.5 billion in 2025, representing growth from the estimated $15 billion to $16 billion recorded in 2024. However, operational expenses related to absorbing xAI—Elon Musk’s AI venture purchased in February 2025—exceeded total income.
Yet throughout this financial turbulence, SpaceX left its bitcoin reserve completely untouched. Blockchain analytics platform Arkham Intelligence confirms the company maintains 8,285 BTC stored with Coinbase Prime, currently valued at approximately $603 million.
The most recent wallet activity occurred roughly four months ago during an internal reorganization. Two separate transactions—614 BTC and 1,021 BTC respectively—transferred between wallets controlled by SpaceX. Zero bitcoin entered the market.
The dollar value of SpaceX’s position exceeded $1.6 billion when Bitcoin reached its peak in October 2025. The actual BTC quantity has remained unchanged since mid-2024.
This positions SpaceX as the fourth-largest publicly known corporate bitcoin treasury, trailing only Strategy, Marathon Digital, and Riot Platforms.
A Big Asset on a Stressed Balance Sheet
For an organization gearing up for public markets while absorbing a $5 billion deficit, maintaining over $600 million in a high-volatility asset represents a deliberate strategic decision. SpaceX has shown no indication of liquidating this position to strengthen its financial position.
Reports from CoinDesk last month confirmed SpaceX submitted IPO documentation. Once these filings become accessible to the public, the bitcoin treasury will appear in official financial disclosures for the first time.
This timing coincides with updated FASB accounting standards implemented in late 2025. These regulations require companies to value cryptocurrency holdings at current market rates, meaning Bitcoin’s price fluctuations will directly impact SpaceX’s reported financial performance.
What the IPO Filing Could Mean for Bitcoin Disclosure
After SpaceX completes its public offering, the bitcoin position will face identical examination as every other asset on the balance sheet. Market participants and financial analysts will monitor this holding through regular quarterly reports.
Maintaining the position through a $5 billion loss indicates leadership considers bitcoin a strategic treasury reserve rather than a speculative investment.
SpaceX enters a selective but expanding group of corporations adopting this bitcoin treasury approach. While Strategy maintains the dominant position by substantial margin, SpaceX’s $603 million holding establishes it as a significant participant in this emerging category.
Arkham’s blockchain tracking reveals no recent withdrawals. Current on-chain verification confirms SpaceX’s complete 8,285 BTC position remains undisturbed.
Crypto World
Hyperliquid (HYPE) ETF Inches Closer as Bitwise Files Key Amendment and Hayes Adds to Position

Key Highlights
- Bitwise submitted its second amendment for a Hyperliquid ETF, revealing the ticker symbol $BHYP and a management fee of 0.67%.
- Eric Balchunas from Bloomberg ETF analysis indicated these additions usually precede an imminent product rollout.
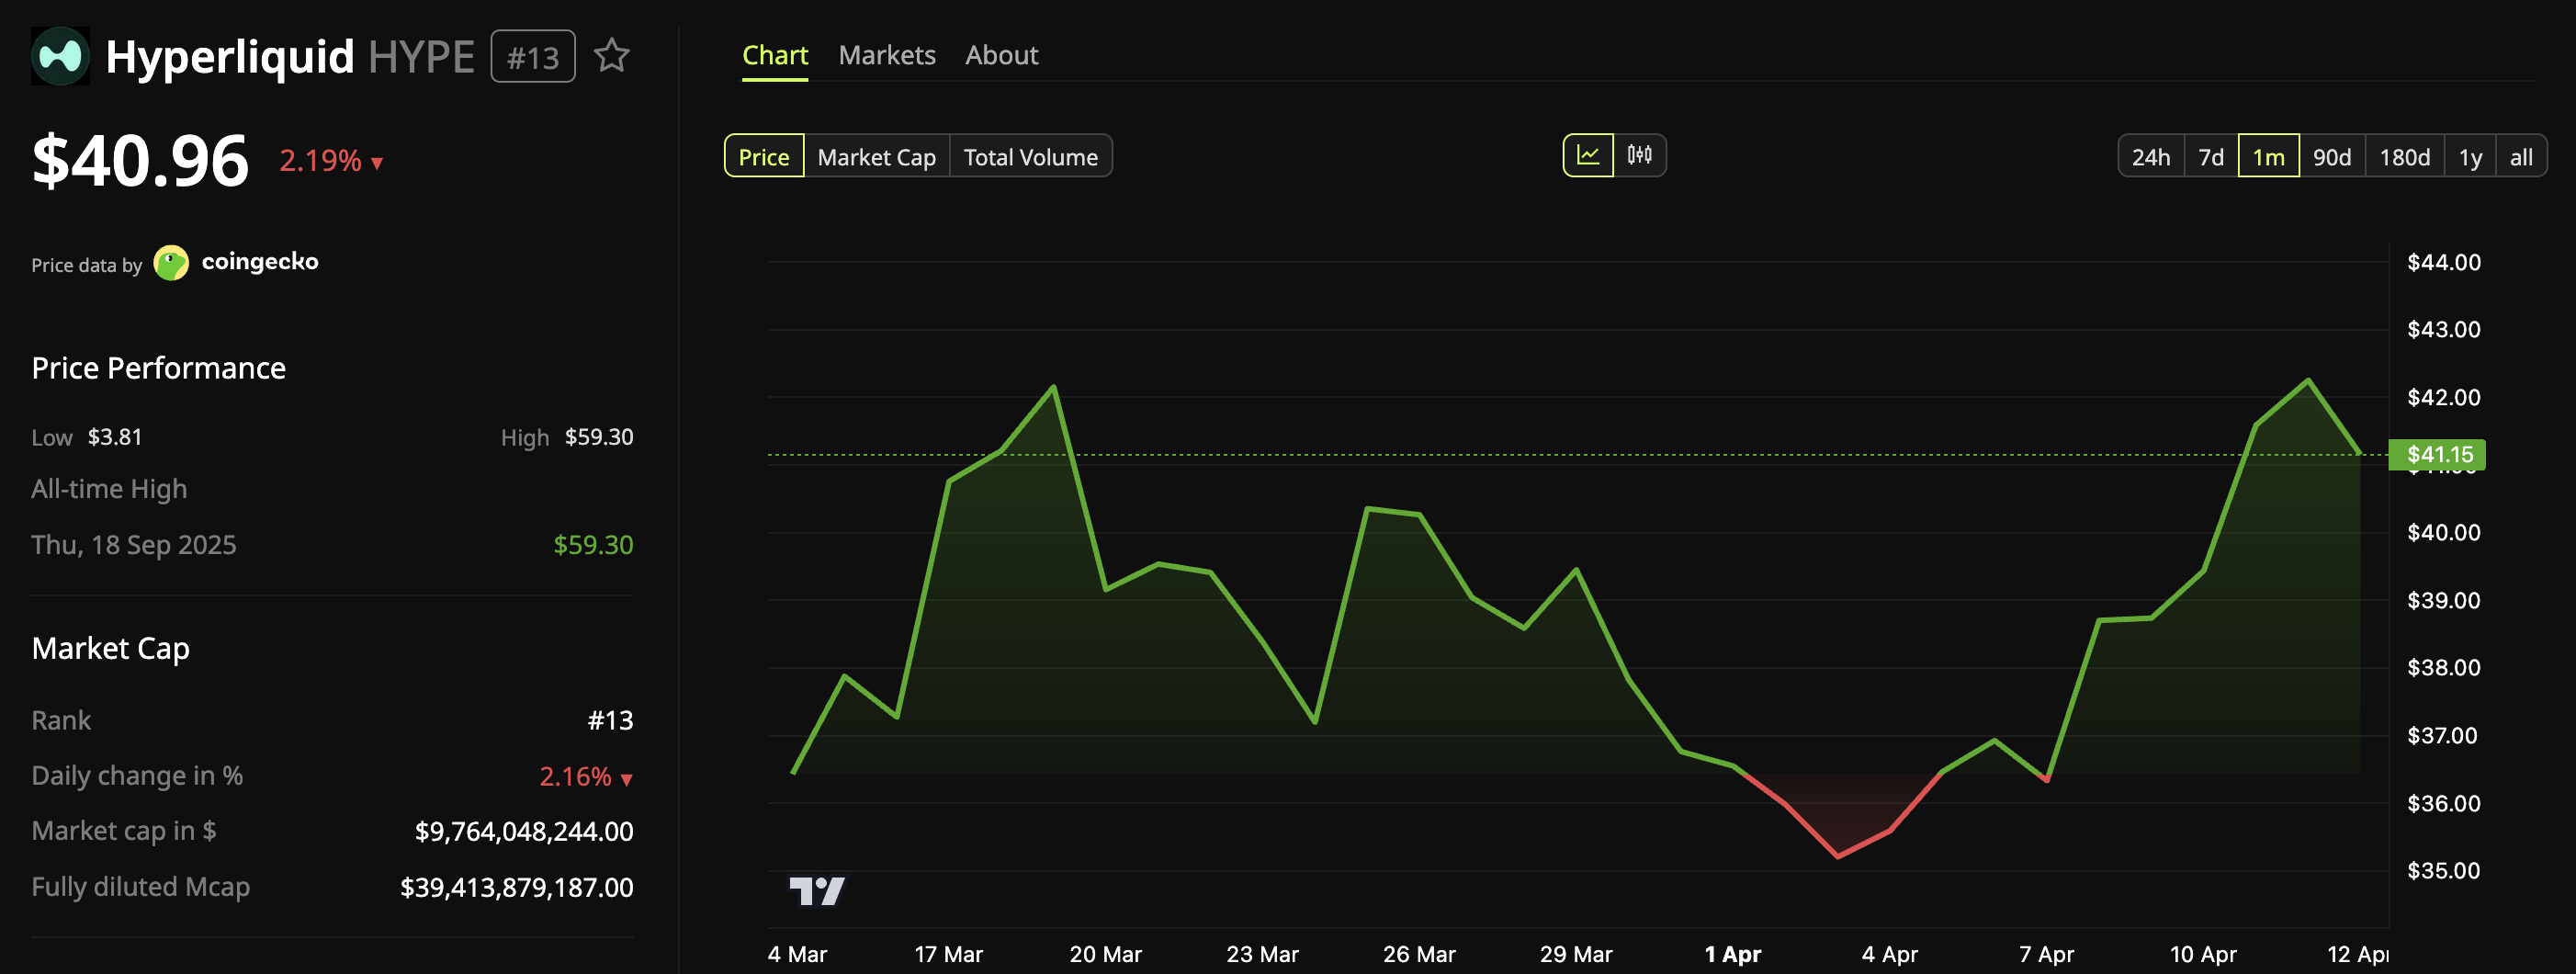
- HYPE has surged approximately 65% year-to-date in 2026, currently priced near $41.96, with a 12-month gain of about 182%.
- BitMEX co-founder Arthur Hayes acquired 26,022 HYPE tokens valued at over $1 million, marking his first buy in nearly three months.
- The Hyperliquid platform entered the top 10 derivatives exchanges by volume in early April, recording $492.7 billion in Q1 trading activity.
Bitwise Asset Management has submitted an updated amendment to the US Securities and Exchange Commission for its proposed Hyperliquid spot exchange-traded fund. The latest filing discloses the ticker symbol $BHYP alongside a management fee structure of 0.67%, equivalent to 67 basis points.
Eric Balchunas, a senior ETF analyst at Bloomberg, highlighted the amendment on X, explaining that including such specifics generally indicates an imminent product debut. He pointed out that HYPE has appreciated 200% annually and suggested Bitwise appears eager to capitalize on current market conditions.
Bitwise became the initial asset manager to file for a Hyperliquid ETF with the SEC back in September 2025. The firm now competes with Grayscale, which submitted its application in late March 2026, and 21Shares, which followed one month after Bitwise’s original filing.
Upon regulatory approval, the ETF would list on the NYSE Arca platform, offering investors direct exposure to HYPE’s spot market price. Bitwise has also suggested in a previous amendment that the fund could potentially enhance returns through HYPE staking mechanisms—a feature that neither Grayscale nor 21Shares has proposed.
Hayes Adds Over $1 Million to HYPE Holdings
Blockchain monitoring service Lookonchain revealed that Arthur Hayes, BitMEX’s co-founder and former chief executive, purchased 26,022 HYPE tokens worth just above $1 million on April 11. This transaction marked his first acquisition of the token in almost three months.
Hayes’ total holdings now stand at 247,344 HYPE, valued at roughly $10.44 million, reflecting an unrealized profit of approximately $2.5 million.
The purchase occurred as HYPE regained ground above the $40 threshold. The token had declined below $27 toward the end of February following geopolitical tensions in Iran, subsequently rallied to $44 in mid-March, retreated to $34, and rebounded to approximately $42 when Hayes executed his buy.
In a post on X, Bloomberg’s Balchunas stated: “Bitwise w another update to Hyperliquid ETF includes ticker $BHYP and fee 67bps. Typically that means launch soon. HYPE is up 200% in past yr so they prob trying to strike while iron hot.”
Token Performance and Exchange Metrics
Data from CoinGecko indicates that HYPE is currently trading near $41.96, representing an approximate 65% increase since the beginning of 2026 and a gain of roughly 182% over the trailing 12-month period.
CoinGlass, a blockchain analytics service, reported in early April that Hyperliquid had secured a position among the top 10 cryptocurrency derivatives exchanges by trading volume. Throughout the first quarter of 2026, Hyperliquid facilitated $492.7 billion in trading volume, positioning it in ninth place, trailing Coinbase by approximately $90 billion.
As of April 11, 2026, HYPE was valued at approximately $41.96 based on CoinGecko pricing data.
Key Highlights
- Chainalysis estimates stablecoin transaction volumes may reach $719 trillion by 2035 based on organic expansion alone
- Under favorable macroeconomic conditions, transaction volumes could soar to $1.5 quadrillion — a dramatic increase from 2024’s $28 trillion
- Treasury Secretary Scott Bessent is pressing Congress to advance the Clarity Act, legislation designed to establish crypto market structure
- An intergenerational transfer of wealth totaling up to $100 trillion toward younger, crypto-savvy demographics could generate $508 trillion in yearly stablecoin activity
- Expanding retail merchant acceptance for stablecoin payments could contribute an additional $232 trillion to annual transaction volumes
A groundbreaking analysis from Chainalysis suggests stablecoin transaction activity could skyrocket from last year’s $28 trillion to an astonishing $1.5 quadrillion within the next decade. This forecast has captured the attention of senior U.S. government officials and financial policymakers.
Treasury Secretary Scott Bessent published a compelling opinion piece in the Wall Street Journal, directly challenging Congress to take immediate action. His message centered on the urgent need to approve the Clarity Act, legislation currently under review by the Senate banking committee.
“The U.S. didn’t become the world’s financial center by hesitating in moments of technological change,” Bessent emphasized. He stressed that enacting this legislation would guarantee “the next generation of financial innovation is built on American rails.”
According to reports, the Senate banking committee intends to schedule a hearing and vote on the Clarity Act by the close of April. Bessent characterized Senate floor availability as “scarce” and emphasized the critical nature of immediate legislative movement.
The comprehensive Chainalysis analysis, entitled “The New Rails: How Digital Assets Are Reshaping the Foundations of Finance,” received its initial preview on April 8. The research positions stablecoins as transformative settlement infrastructure capable of revolutionizing international payments, cross-border remittances, and enterprise treasury management.
According to Chainalysis projections, natural market evolution alone will push stablecoin volumes to $719 trillion by 2035. Should broader economic catalysts materialize, the total could climb toward $1.5 quadrillion.
Even the conservative baseline figure represents an extraordinary expansion from present-day metrics. The $28 trillion in stablecoin volume recorded last year pales in comparison to what industry researchers now consider achievable.
Wealth Migration Across Generations
A primary catalyst identified in the research involves a historic redistribution of wealth across age demographics. As much as $100 trillion in assets are anticipated to transition from Baby Boomers and older generations to Millennials and Gen Z cohorts — populations characterized as inherently comfortable with cryptocurrency.
Chainalysis calculates this demographic shift could independently contribute $508 trillion to yearly stablecoin transaction activity by 2035. Younger capital holders demonstrate significantly higher propensity to utilize blockchain-powered financial infrastructure instead of conventional banking channels.
As this wealth migration unfolds, financial liquidity may increasingly flow toward decentralized, on-chain platforms rather than traditional financial intermediaries.
Retail Integration Drives Mainstream Adoption
The second critical growth engine involves widespread merchant integration. Chainalysis forecasts that stablecoin acceptance at retail checkout systems could inject $232 trillion into annual transaction volumes by 2035.
As stablecoins penetrate everyday commerce, established payment processors may encounter intensifying competitive pressure. When deployed at scale, blockchain-based payment systems have potential to compress profit margins for traditional payment intermediaries.
Chainalysis also notes that Bitcoin and the wider cryptocurrency ecosystem stand to gain substantial benefits from expanded stablecoin utilization.
The Clarity Act builds upon groundwork established by the previously enacted Genius Act, which Bessent referenced as demonstration that meaningful regulatory advancement remains achievable.
The Senate is expected to conduct its vote on the Clarity Act before April 2026 concludes.

Polanski confirms Labour’s ‘Green apocalypse’ is the plan

Indiana Fever sign players to surround Caitlin Clark for 2026 title run

ASUS ZenBook A16, AirPods Max 2, Sonos Play and LG Sound Suite

Why Israel is blocking foreign journalists from entering

Bitcoin: We’re Entering The Most Dangerous Phase

Alan Cumming Brands Baftas Ceremony A ‘Triggering S**tshow’

Moneyview Personal Loan App | How To Apply Money View Loan | Moneyview Personal Loan Telugu 2026

How Small Actions Change Financial Struggles | A Simple Economics Story

GOLD AND CRYPTO LIVE TRADING || 10 APRIL || Bitcoin Live Trading | Crypto Market Analysis |
-

 Business6 days ago
Three Gulf funds agree to back Paramount’s $81 billion takeover of Warner, WSJ reports
-

 Politics2 days ago
US brings back mandatory military draft registration
-

 Fashion2 days ago
Weekend Open Thread: Veronica Beard
-

 Tech5 days ago
How Long Can You Drive With Expired Registration? What Florida Law Says
-

 Business7 days ago
No Jackpot Winner, Prize to Climb to $231 Million
-

 Fashion6 days ago
Massimo Dutti Offers Inspiration for Your Summer Mood Board
-
 Sports2 days ago
Man United discover Nico Schlotterbeck transfer fee as defender reaches Dortmund agreement
-

 Crypto World3 days ago
Canary Capital Files SEC Registration for PEPE ETF
-

 Fashion5 days ago
Let’s Discuss: DEI in 2026
-

 Business2 days ago
Tesla Model Y Tops China Auto Sales in March 2026 With 39,827 Registrations, Beating Cheaper EVs and Gas Cars
-

 Crypto World4 days ago
Bitcoin recovers as US and Iran Agree a Ceasefire Deal
-

 Politics2 days ago
Malcolm In The Middle OG Turned Down ‘Buckets Of Money’ To Appear In Reboot
-

 Business2 days ago
OpenAI Halts Stargate UK Data Centre Project Over Energy Costs and Copyright Row
-

 Business17 hours ago
Ireland Fuel Protests Enter Day 5 as Blockades Spark Shortages and Government Prepares Support Package
-

 Tech6 days ago
Italian court says Netflix must refund customers up to $576 over price hikes
-

 Tech6 days ago
Gamer Restores the Original PlayStation Portal From Two Decades Ago
-

 Tech6 days ago
Samsung just gave up on its own Messages app
-

 Tech6 days ago
Haier is betting big that your next TV purchase will be one of these
-

 Tech6 days ago
The Xiaomi 17 Ultra has some impressive add-ons that make snapping photos really fun
-

 Politics2 days ago
LBC Presenter Mocks Trump Over Iran War Failures
You must be logged in to post a comment Login