
Crypto World
Bitcoin (BTC) mining stocks rallied in January despite softer BTC prices: JPMorgan


Bitcoin mining stocks kicked off 2026 on a strong note, buoyed by falling network competition and fresh enthusiasm around high-performance computing (HPC), Wall Street bank JPMorgan said in the Monday report.
The bank noted that the 14 U.S.-listed bitcoin miners and data center operators it tracks ended last month with a combined market capitalization of $60 billion, up 23% month over month, far outpacing the S&P 500’s 1% gain.
The rally was helped in part by news that Riot Platforms signed a HPC agreement with AMD at its 700-megawatt Rockdale facility, underscoring miners’ push to diversify beyond bitcoin.
Facing record-low margins after the 2024 halving, bitcoin miners are repositioning as digital infrastructure providers, repurposing power-dense mining sites into AI-ready data centers in search of steadier, long-term revenue.
At the same time, valuations continued to stretch. Analysts Reginald Smith and Charles Pearce said mining stocks were trading at roughly 150% of the four-year block reward opportunity at year-end, about three times the post-2022 average, highlighting a growing disconnect between miner valuations and bitcoin’s price.
Operationally, January brought relief. Winter storms across the U.S. forced widespread curtailments, dragging the average network hashrate down 6% month over month to 981 exahashes per second (EH/s), JPMorgan said. The hashrate briefly dipped as low as 700 EH/s during the month, while mining difficulty fell 5% from December and sat 10% below November’s all-time high.
The hashrate refers to the total combined computational power used to mine and process transactions on a proof-of-work blockchain, and is a proxy for competition in the industry and mining difficulty. It is measured in exahashes per second.
That drop in competition helped offset weaker bitcoin prices. The analysts estimated miners earned about $42,350 per EH/s in daily block reward revenue in January, up slightly from December, while gross profit jumped 24% to roughly $21,200 per EH/s as network efficiency improved. Still, profitability remains well below pre-halving levels, the bank noted.
Stock performance was broadly positive. Twelve of the 14 miners tracked by the bank outperformed bitcoin’s 4% decline in January, with IREN (IREN) rising 42% and Cango (CANG) falling 18%. Even after the rally, the group’s combined valuation remains about 15% below October 2025 highs.
Read more: Bitcoin miners HIVE, Bitfarm and Bitdeer downgraded as analyst warns on AI shift


The SEC just gave crypto its biggest regulatory green light in years.
Chair Paul Atkins floated a safe harbor exemption on March 18 that lets crypto projects operate without immediate securities registration. It is a direct reversal of the regulation by enforcement era that suffocated US-based development for years.
Token projects now have a compliant runway to decentralize without the threat of an SEC lawsuit hanging over them. For altcoin valuations, that changes the math entirely.x
- Atkins identified four asset categories—digital commodities, collectibles, tools, and payment stablecoins—that are not subject to securities laws.
- The safe harbor proposal offers a specific grace period for projects to reach decentralization without facing enforcement actions.
- Formal rulemaking is expected within weeks to replace temporary staff guidance and solidify these protections.
The Safe Harbor Framework Explained
Atkins is cutting through a decade of deliberate ambiguity.
Speaking at a Digital Chamber event, he laid out a framework that separates capital raising from the underlying asset. Four categories are now explicitly excluded from securities jurisdiction. Digital commodities, digital collectibles, digital tools, and payment stablecoins.
— BSCN (@BSCNews) March 18, 2026
 UPDATE: SEC CHAIR PROPOSES CRYPTO SAFE HARBOR FRAMEWORK
USE SEC Chair, Paul Atkins, has proposed a new regulatory safe harbor for crypto firms in the US.
The framework aims to ease pressure on early-stage projects. It would allow firms to raise capital with fewer… pic.twitter.com/NRTHMyAv0J
For everything that does not fit cleanly into those boxes yet, the safe harbor buys time. Instead of Wells Notices for technically failing the Howey Test during development, projects face purpose-fit disclosures and a transparent path toward decentralization. Build first. Comply as you go.
Custody rules are also getting overhauled. Broker-dealers will be able to hold both crypto assets and traditional securities simultaneously. The special purpose broker-dealer model that no compliant firm could actually use is effectively dead.
Atkins is trying to bring crypto trading back to national securities exchanges and stabilize a market that has been hammered by legal uncertainty for years. Assets like XRP have historically exploded the moment regulatory clouds clear.
Those clouds are clearing fast.
Market Implications for Issuers and Exchanges
The immediate winners are US-based token issuers and exchanges.
Coinbase has operated for years under the threat that any listing could trigger a lawsuit. A formal safe harbor removes that existential risk entirely. That clarity is the missing piece institutional product approvals have been waiting for.
The ETF race is the most direct beneficiary. Solana’s push for a spot ETF has faced headwinds specifically because the SEC previously labeled SOL a security. If SOL lands in the digital commodity or digital tool bucket under Atkins’ new classification, the path to approval gets significantly shorter overnight.
The broader impact is a sector-wide repricing. Token prices have been trading at a discount for years to account for enforcement risk. Remove that discount and valuations adjust upward across the board.
The cost of capital just dropped for the entire industry.
Discover: The best new crypto in the world
The post SEC Chair Paul Atkins Floats ‘Safe Harbor’ Exemptions for Crypto appeared first on Cryptonews.


Opinion by: Vikram Arun, co-founder and CEO of Superform
Crypto cards aren’t the future of payments. They’re a temporary interface for a world that hasn’t fully accepted cryptocurrencies.
They rely on banks as issuers, Visa or Mastercard as gatekeepers, and compliance rules that look exactly like TradFi.
In most cases, crypto is sold into idle USD, the assets stop earning and every swipe creates a taxable event.
That’s not innovation. That’s a debit card with extra steps.
As digital banks built with blockchain rails scale, crypto cards that behave like debit cards will become obsolete, replaced by systems that treat cards as a thin interface on top of robust onchain credit.
The problem with current crypto cards
To understand why this shift is necessary, consider what happens with current crypto cards. When systems force users to liquidate holdings to spend, they reinforce the paradigm crypto was meant to escape: the false choice between liquidity and ownership.
Debit-style crypto cards recreate this same trade-off because they require assets to become spendable balances, which halts yield and makes the system structurally negative-sum without subsidies.
The IRS treats converting cryptocurrency to fiat currency as a taxable disposal, meaning each coffee purchase triggers capital gains reporting and permanently removes assets from productive use. Card issuers typically earn 1% to 3%, plus a flat fee per transaction, from interchange fees. The infrastructure looks decentralized on the surface, but the dependencies run deep.
Onchain credit fixes these issues
Instead of selling assets to spend, onchain credit enables people to deposit yield-bearing assets, open a credit line and spend against it. When people swipe the card, their debt increases, but their assets keep earning. Nothing is sold unless the person fails to repay. If the position falls below governance-defined parameters, liquidation is deterministic and transparent. This shift toward wallet-native credit shows onchain credit moving from concept to practice.
In this model, spending doesn’t reduce ownership; it increases debt. Collateral continues to compound until the credit line is repaid or liquidated. There are no forced conversions and no idle balances. Yield-bearing stablecoins currently offer about 5% yield, and DeFi protocols range from 5% to 12%, depending on demand and token incentives.
Users holding these assets in credit accounts keep earning while maintaining spending power.
Any earning asset can be collateral
This shift from debit to credit fundamentally changes what’s possible. Once credit becomes the primary primitive, the question stops being “what can I spend?” and becomes “what can safely secure my credit?” Eligibility is no longer about whether an asset can be instantly liquidated into cash. It’s about whether it can be priced continuously, risk bounded and unwound deterministically.
This allows productive assets to compete for inclusion. Vault shares, yield-bearing dollars, US Treasury-backed assets and strategy positions are first-class collateral that don’t need to be converted into idle balances. These assets remain productive until liquidation becomes required. When assets keep earning, users don’t have to choose between liquidity and yield, credit lines become cheaper to maintain and protocols earn from management and performance, not interest spreads.
The card is just an interface
The card is not the product. A card is simply a consumer-facing compatibility layer, a thin authorization surface, and not the source of truth. What actually matters is the credit line itself: the ability to price a user’s onchain balance sheet and decide, in real time, whether a spend should be allowed.
Related: Visa crypto card spending soars 525 percent in 2025
Cards serve merchants and consumers. Once credit is the primitive, however, interfaces become interchangeable. Software and autonomous agents can already request payment programmatically. Whether through cards or APIs, the underlying question is the same: Is this spend authorized against the user’s credit?
If credit logic lives within the card, people remain locked into interchange fee structures, closed payment rails and rigid KYC requirements. If credit lives onchain, cards become optional. Collateral stays in user-controlled accounts, spending is authorized in real time and liquidation is deterministic.
Managing risk through transparency
Of course, this system raises questions about safety. The most immediate objection is volatility. If collateral can fluctuate in value, what protects people from being liquidated while they are buying groceries?
Governance sets conservative loan-to-value ratios in advance, ensuring users can only borrow against a fraction of their collateral. As collateral earns yield, this buffer grows automatically. Pricing happens continuously, not at arbitrary intervals, and liquidation triggers are transparent from the beginning.
Traditional credit obscures risk through adjustable interest rates, surprise fees and terms buried in legal documents. Onchain credit makes risk explicit. Governance-set parameters mean the community decides what’s acceptable, not a bank’s risk committee behind closed doors.
The path forward
The answer to managing this risk lies in how the system is governed. Governance controls which assets can be used as collateral, how they’re priced, acceptable risk levels and when liquidations occur. People opt in by depositing collateral, and from that point on, the protocol enforces the rules without blanket access to funds or quietly changed parameters.
Crypto cards will not disappear because they failed. They will disappear because they succeeded by bridging crypto into a world that still runs on legacy rails. As wallets improve and crypto-native payments become standard, spending won’t require banks, issuers or card networks at all. Interfaces will change. Payment rails will evolve. But onchain credit will remain: the ability to spend without selling, to keep assets productive and to enforce risk transparently.
Cards are an interface. Credit is the system.
Opinion by: Vikram Arun, co-founder and CEO of Superform.
This opinion article presents the author’s expert view, and it may not reflect the views of Cointelegraph.com. This content has undergone editorial review to ensure clarity and relevance. Cointelegraph remains committed to transparent reporting and upholding the highest standards of journalism. Readers are encouraged to conduct their own research before taking any actions related to the company.
Crypto World
Executive turnover clouds crypto payments firm RedotPay’s $4 billion U.S. IPO ambitions


RedotPay, a Hong Kong-based stablecoin payments startup, is facing internal strain and executive turnover as it seeks up to $150 million in fresh funding and works toward a U.S. IPO that could value the company at more than $4 billion.
Those ambitions are being clouded by executive turnover. At least five senior hires left within 12 months, and the company is pursuing its listing plans without a chief financial officer. Staff, according to a Bloomberg report, have often been asked to work late for extended periods.
The fundraising talks come only months after RedotPay raised more than $150 million across two rounds in September and December. It remains open to strategic investors, but does not face pressure to raise funds because of strong cash flow, Bloomberg said.
The company has grown fast. Investor materials show annualized payment volume passed $10 billion in December, while revenue doubled to $158 million. RedotPay says it now serves more than 6 million users in over 100 countries.
Its main product is a stablecoin payments app linked to a Visa card. Users can store stablecoins in the app and spend them at merchants or online, while the platform also offers remittance services and yield on some holdings.
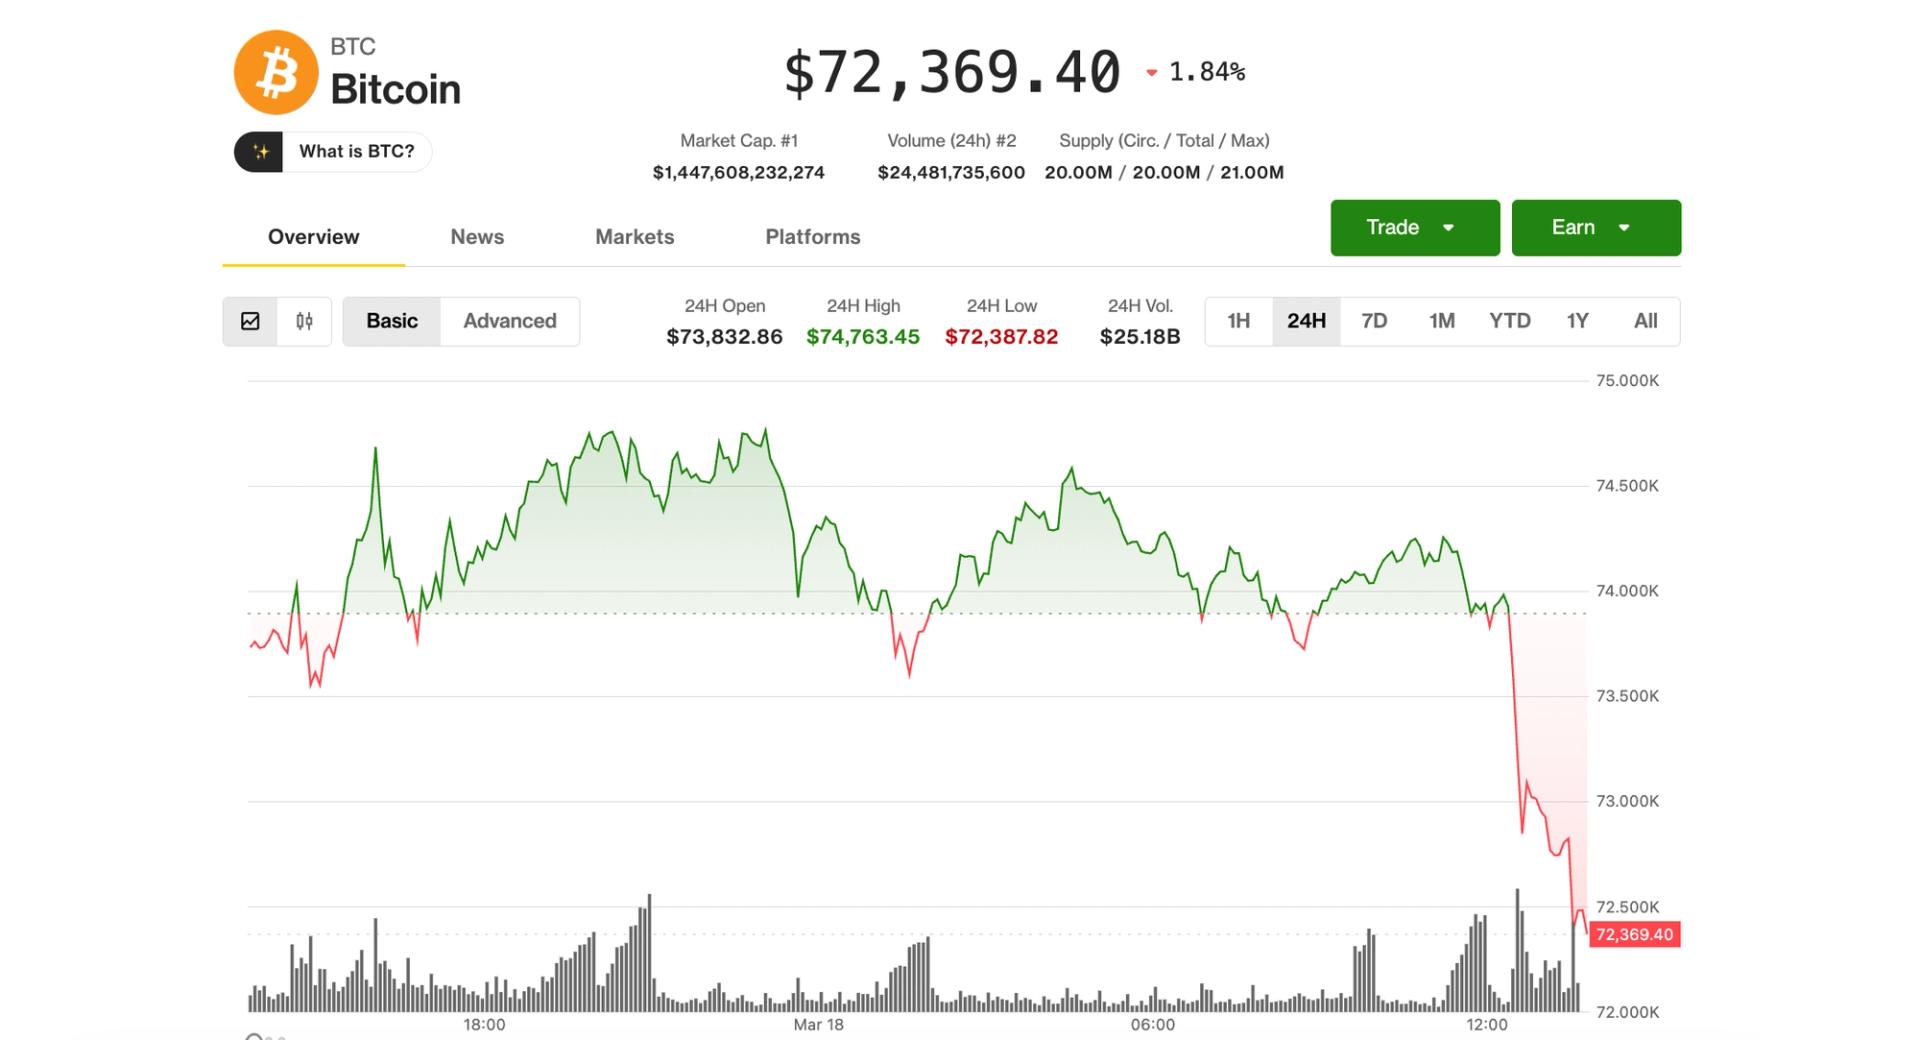

Quiet bitcoin price action in the $74,000 area was shattered Wednesday morning on reports of military escalation in Iran and then February inflation data that came in far stronger than expected.
The declines started as U.S. President Donald Trump struck a more aggressive tone on Iran, suggesting further escalation in a series of Truth Social posts and calling the country the “NUMBER ONE STATE SPONSOR OF TERROR.”
Alongside, Iran’s state TV reported that part of that country’s South Pars gas field was attacked.
This followed reports that Israel killed Iran’s Intelligence Minister Esmail Khatib, while the U.S. deployed 5,000-pound bunker-buster bombs targeting missile sites near the Strait of Hormuz, a key route for global oil flows.
That news combined to send the price of WTI crude oil from as low as $92 per barrel overnight to nearly $96.
Minutes later, the U.S. Producer Price Index for February rose 0.7% versus just 0.3% expected and up from January’s 0.5%. The core PPI rose 0.5% versus 0.3% expected, though down from January’s 0.8%. Importantly, the disturbing inflation data is from prior to the attacks against Iran and the subsequent sharp rise in the price of oil.
The data complicates the outlook for rate cuts, especially with oil prices still elevated, and is weighing on risk assets ahead of the U.S. stock market open.
Bitcoin has now fallen to $72,300, down 2% over the past 24 hours. Declines for ether (ETH), solana (SOL) and XRP (XRP) are closer to 3%. U.S. stock index futures have swung from solid gains to declines of about 0.4% across the board.
Fed comes later
Later in the day, the U.S. Federal Reserve is widely expected to hold rates steady, shifting the focus to Chair Jerome Powell’s messaging and how policymakers interpret the recent mix of growth risks and inflation pressures. Trump once again renewed calls for rate cuts in a Wednesday post, adding a political dimension to the meeting.
The effort involves eight cryptocurrencies and will take place at the start of April.
Binance revealed it will terminate all trading services for certain cryptocurrencies.
Somewhat expected, the tokens included in the effort nosedived by double digits immediately after the disclosure.
The Latest Announcement
Even though Binance supports a wide range of cryptocurrencies, their presence on the platform isn’t guaranteed forever and depends on factors such as trading volume, liquidity, network security, public communication, team commitment, and more.
Following its most recent review, the exchange decided to delist the altcoins Arena-Z (A2Z), Ampleforth Governance Token (FORTH), Hooked Protocol (HOOK), Loopring (LRC), IDEX (IDEX), Neutron (NTRN), Solar (SXP), and Radiant Capital (RDNT). The effort will take place on April 1 and will lead to the removal of spot trading pairs involving the aforementioned tokens. Meanwhile, Binance Spot Copy Trading will delist those assets on March 25.
“After this time, any outstanding assets will be force-sold at market price or moved to the Spot Account if the amount is unsellable. Users are strongly advised to update or cancel their Spot Copy Trading portfolios prior to Binance Spot Copy Trading delisting time to avoid potential losses,” the company warned.
Deposits of these tokens will not be credited to users’ accounts after April 2, while withdrawals won’t be supported after June 1. Delisted cryptocurrencies may be converted into stablecoins on behalf of customers after June 2, Binance clarified.
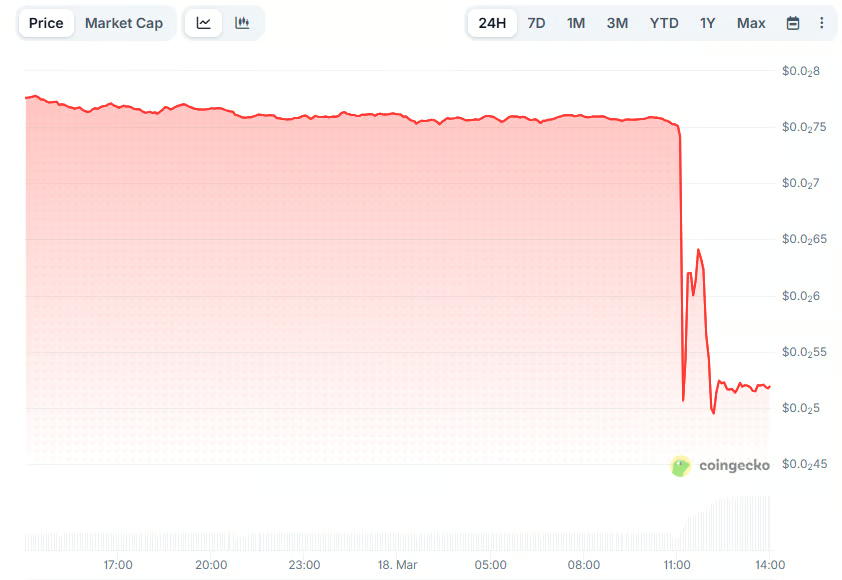
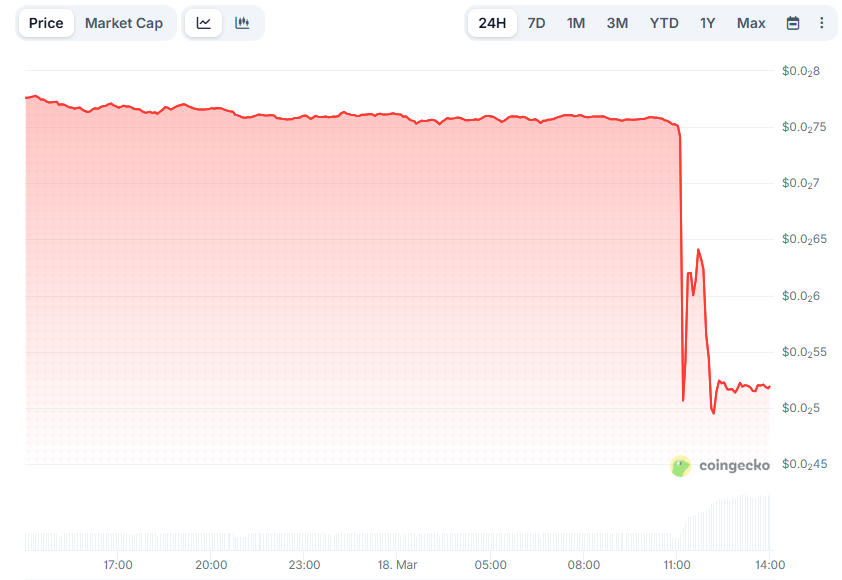
Such announcements usually trigger negative price reactions for the affected assets. After all, losing Binance support damages a coin’s reputation, reduces its liquidity, and limits its accessibility. Such was the case here as all of the involved altcoins headed south by double digits. IDEX was the biggest loser, with its valuation collapsing by 33% on a daily scale.
- IDEX Price, Source: CoinGecko
A similar thing was observed last week when Binance removed 21 cryptocurrencies, including WorldShards (SHARD), Alliance Games (COA), BNB Card (BNB Card), MilkyWay (MILK), Hyperbot (BOT), and others. Some of the assets saw their prices crash by an astonishing 70-80% shortly after the news broke.
You may also like:
The Opposite Effect
On the contrary, backing from Binance typically has quite a positive price effect on the involved cryptocurrencies. Earlier this week, the exchange introduced the trading pairs CFG/USDT, CFG/USDC, and CFG/TRY, causing CFG’s valuation to surge 60% within minutes.
At the start of 2026, the lesser-known digital assets Moonbirbs (BIRB) and ETHGas (GWEI) also posted substantial gains after Binance launched the BIRB/USDT and GWEI/USDT perpetual contracts with up to 50x leverage.
Binance Free $600 (CryptoPotato Exclusive): Use this link to register a new account and receive $600 exclusive welcome offer on Binance (full details).
LIMITED OFFER for CryptoPotato readers at Bybit: Use this link to register and open a $500 FREE position on any coin!


Australians are increasingly using cryptocurrency for day-to-day payments, even as banking restrictions continue to hamper access to the ecosystem.
Summary
- Crypto payments in Australia doubled to 12% in 2026 as more users turn to digital assets for everyday spending, led by online shopping and service payments.
- Nearly 30% of investors reported bank delays or blocks when transferring funds to crypto exchanges, up from 19.3% in 2025.
A recent survey by crypto exchange Independent Reserve, which polled 2,000 “everyday Australians” between Jan. 12 and Jan. 30, found that the share of users paying with crypto has doubled from 6% to 12% compared to the previous year.
According to the report, one in three Australians now own cryptocurrencies in 2026 and are viewing digital assets as more than just a speculative investment, with growing interest in real-world utility.
Nearly 21% of respondents reported using crypto for online shopping, making it the leading use case. It was followed by other applications such as freelancing payments and video game purchases, which accounted for 16%.
However, even as demand continues to build, banking-related issues remain a persistent challenge for users trying to access crypto services.
Among the respondents, nearly 30% said their bank had blocked or delayed a payment to a crypto exchange at least once. That figure marks a notable increase from 19.3% reported in 2025.
Such delays stem from tighter banking controls introduced in recent years, when several major institutions such as Commonwealth Bank and National Australia Bank rolled out measures including payment delays, transfer caps, and additional identity checks for crypto-related transactions.
“For many Australians, the lack of regulation hits home when a payment to a crypto exchange is delayed or blocked, an issue that has continued to rise for another year,” the report said, adding that “clear licensing and regulation can help fix this.”
Australian regulators are still undecided
Australia is still lagging behind other major economies in establishing formal legislation to effectively regulate the crypto sector.
So far, the federal government has primarily focused on a token mapping exercise and public consultations, while the Treasury continues to refine its proposed framework for digital asset service providers.
Earlier this week, Australia’s Senate Economics Legislation Committee said it was considering a new bill that would require crypto exchanges and tokenization platforms to operate under the country’s existing financial services framework.


Ethereum client teams are testing an opt-in mechanism that could cut the time some layer-2 networks and exchanges wait to recognize mainnet deposits, allowing them to process transactions much faster.
Summary
- Ethereum client teams are testing a Fast Confirmation Rule that could reduce deposit recognition times for layer 2 networks and exchanges to about 13 seconds.
- The proposal suggests replacing block counting with validator attestations, offering faster confirmation than canonical bridges while avoiding the need for a hard fork.
Dubbed the Fast Confirmation Rule (FCR), the proposal is expected to bring confirmation times down to around 13 seconds, according to Ethereum researcher Julian Ma.
By using this approach, platforms can move away from systems that rely on canonical bridges, where transfers typically take up to 13 minutes to reach full confirmation. However, many already rely on “k-deep” confirmation rules, which offer no formal guarantees. A transaction in such models is only treated as confirmed once a predefined number of blocks have been added on top of it.
Developers say the rule can be introduced without hard-forking, though client and API integration is still required.
Client teams are already working on implementations, with deployment expected to allow nodes to adopt the rule without network-wide coordination.
When using FCR, rather than counting blocks, the system evaluates validator attestations to determine whether a block is safe to treat as confirmed. This can solve the issue of slow bridging between Ethereum L1 and downstream platforms.
It does this by relying on two assumptions: that validator messages propagate quickly across the network and that no single entity controls more than 25% of staked Ether. While these thresholds fall short of Ethereum’s stricter finality guarantees, they are considered sufficient for most real-world use cases.
In cases where more security is needed, the system waits longer before confirming a block, Ma explained, adding that “it’s a feature, not a bug.”
Mixed community reaction
Ethereum co-founder Vitalik Buterin said the mechanism can provide a “hard guarantee” that a transaction will not be reverted after a single slot under the right network conditions.
But other community members remained skeptical about the proposal. Some argued that the model leans heavily on trust assumptions and may face challenges under stressed network conditions.


A U.K. parliamentary committee urged the government to impose “an immediate moratorium on crypto donations” until Parliament approves Electoral Commission statutory guidance.
In a report, the Joint Committee on the National Security Strategy said crypto poses an avoidable risk to political finance and public trust. The committee said rules should be ready before the next general election.
The reportnoted that the same traits that make crypto useful for fast payments also make it harder to monitor. It points to mixers, tumblers, privacy coins and chain hopping as tools that can blur the source of funds and warns that artificial intelligence tools could help split a large payment into many sub-500-pound ($668) donations, keeping each below the normal reporting threshold.
Crypto donations remain legal in the country, even though cryptoassets are treated as property rather than legal tender, the report adds. Reform UK, the party led by Nigel Farage that leads in national polls, is the first European political party to say it will accept crypto donations.
The total value of crypto donations Reform UK has received so far is unclear. Crypto investor Christopher Harbone has donated around $12 million in cash to the party.
Natasha Powell, crypto exchange Kraken’s chief compliance officer, told lawmakers that regulated exchanges can manage much of the danger. Still, the committee wasn’t convinced and said the current framework lacks the tools and staff needed to verify donors, trace funds and avoid abuse. As such, it wants the moratorium written into the Representation of the People Bill.
The report adds that a ban on direct crypto gifts would not close every gap. A donor could still cash out cryptocurrencies into sterling before sending money through the banking system.
The committee also wants the Electoral Commission to gain powers to compel information from banks, the tax authority and crypto platforms when it suspects impermissible activity, the report adds.
Senior Labour members of parliament earlier this year called on Prime Minister Keir Starmer to ban cryptocurrency donations to political parties, over concerns these could be used by hostile foreign entities to influence elections.

Today, the focus for FX traders is on the Federal Reserve: at 21:00 GMT+3, the FOMC will announce its interest rate decision (rates are expected to remain unchanged), followed by a press conference with Fed Chair Jerome Powell half an hour later.
In addition:
→ the Bank of Canada will announce its rate decision today;
→ similar events are scheduled tomorrow for the Bank of Japan, the Swiss National Bank, and the Bank of England.
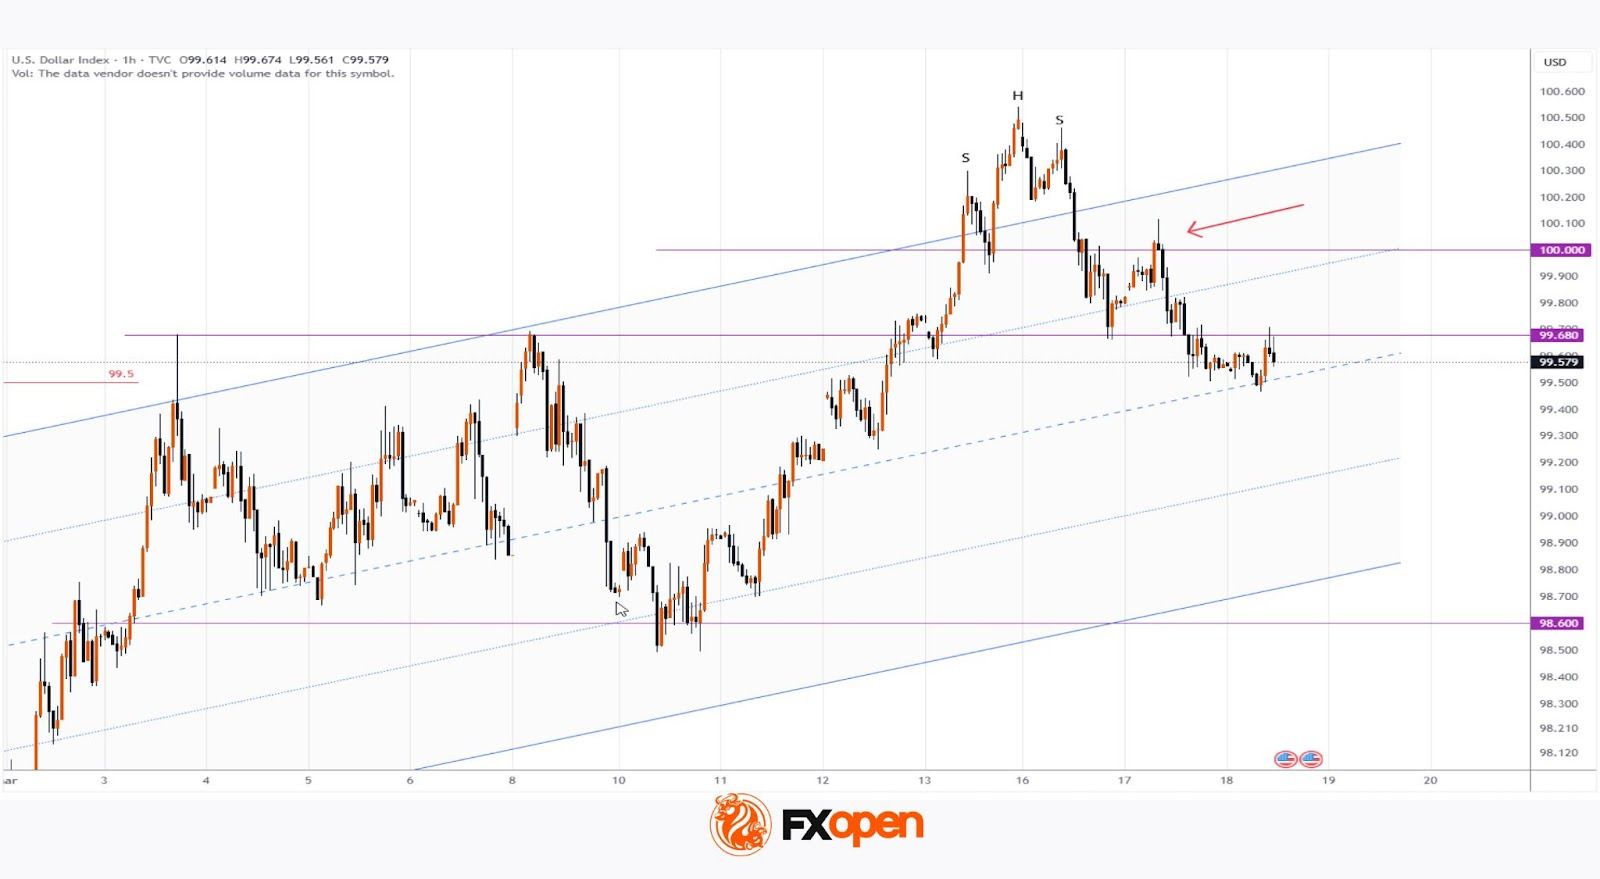
As the DXY chart shows, the index is currently trading near the median of an upward channel that has remained in place since early February — a zone where supply and demand typically balance each other. However, incoming central bank announcements are likely to disrupt this equilibrium.
Technical Analysis of DXY
On the morning of 13 March, when analysing the DXY chart, we:
→ noted that the market appeared overbought, with price trading above the upper boundary of the channel;
→ suggested that a pullback could develop.
Indeed, subsequent price action showed signs of bearish pressure:
→ the formation of a “head and shoulders” (H&S) reversal pattern;
→ a bull trap above the psychological 100-point level.
It is reasonable to assume that the FX market is currently awaiting a crucial wave of fundamental information from central banks, which is particularly significant given ongoing geopolitical uncertainty. Traders should be prepared for increased volatility in the near term — the dollar index may move towards one of the channel boundaries depending on how the market reacts to upcoming news.
Trade global index CFDs with zero commission and tight spreads (additional fees may apply). Open your FXOpen account now or learn more about trading index CFDs with FXOpen.
This article represents the opinion of the Companies operating under the FXOpen brand only. It is not to be construed as an offer, solicitation, or recommendation with respect to products and services provided by the Companies operating under the FXOpen brand, nor is it to be considered financial advice.
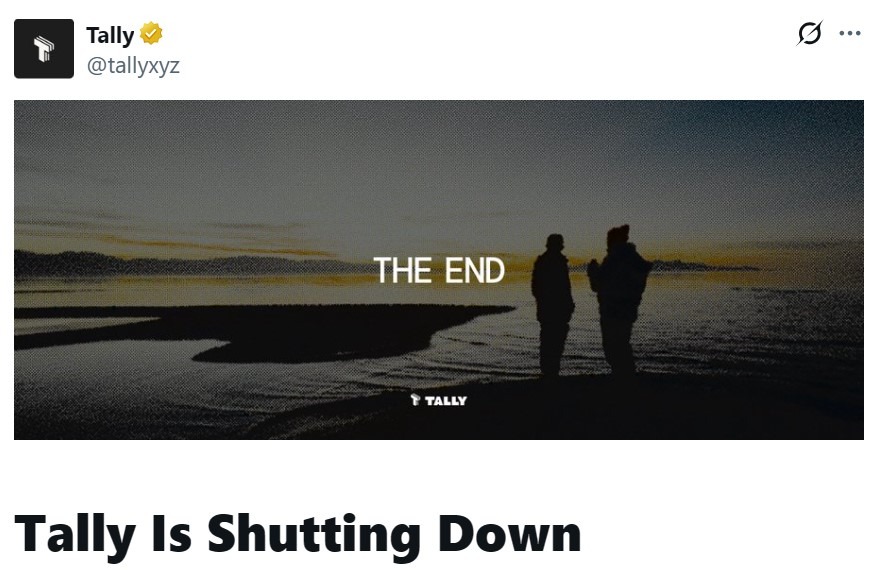
Decentralized autonomous organization (DAO) governance platform Tally is shutting down after five years of operations, citing a lack of sustainable business models for governance tooling in the crypto market.
Tally co-founder and CEO Dennison Bertram said the company will begin winding down at the end of March. He added that the company is not moving forward with a planned initial coin offering (ICO), concluding that it could not confidently deliver on the expectations that would come with selling tokens to investors.
Tally’s closure comes despite years of activity on its platform, which supported governance for hundreds of organizations and processed more than $1 billion in payments, according to Bertram. At its peak, the company said it helped secure up to $80 billion in value and served more than 1 million users.
Tally launched in 2021 as a software platform for on-chain organizations. According to startup intelligence platform Tracxn, the company raised a total of $15.5 million across three funding rounds.
Related: Vitalik Buterin proposes using AI to strengthen DAO governance
The shutdown reflects the challenges facing DAO-focused platforms after years of development and adoption. It highlights the pace of change in the industry, where even substantial achievements may prove insufficient to support a venture-backed business in DAO governance tooling.

Industry reflects on DAO challenges amid Tally shutdown
Following the announcement, builders and operators across the ecosystem pointed to a broader reassessment of DAO governance, with some describing Tally’s closure as part of a wider shift in how coordination tools are being developed and monetized.
Oku Trade CEO Getty Hill said DAO development has not met the expectations set during earlier growth phases.
Related: DAOs may need to ditch decentralization to court institutions
“While stablecoins have achieved the greatest product-market fit in crypto, I still believe DAOs will ultimately get there, though maybe not for another 3-10 years,” he wrote.
Meanwhile, Oasis Onchain founder Stefen Deleveaux described the shutdown as “the end of an era,” reflecting on a wave of early DAO tooling projects that emerged during the 2020–2021 cycle but struggled to sustain themselves over time.
Realms DAO chief technology officer Adrian Brzeziński pointed to the stats highlighted by Bertram, saying that the “hardest truth” in crypto infrastructure is that usage does not equate to revenue. “The next wave of governance won’t look like voting portals. It’ll look like capital coordination,” Brzeziński wrote.
DAOs are “difficult” to operate
On March 11, Aave founder Stani Kulechov said DAOs, in their current form, are “extraordinarily difficult” to operate. He pointed to internal conflicts and proposals that can take weeks of forum posts, temperature checks and multiple votes to pass.
Magazine: What’s a ‘Network State’ and are there real-life examples? Big Questions

#trending #money #lifeisbutadream #beautiful #motivation #automobile

Beef tallow is trending
SEC Chair Paul Atkins Floats ‘Safe Harbor’ Exemptions for Crypto


-
 Crypto World4 days ago
HYPE Token Enters Net Deflation as HyperCore Buybacks Outpace Staking Rewards
-

 Fashion5 days ago
Weekend Open Thread: Addict Lip Glow
-

 Tech3 days ago
Your Legally Registered ‘Motorcycle’ Might Not Count Under Proposed US Law
-
Sports4 days ago
Why Duke and Michigan Are Dead Even Entering Selection Sunday
-

 Sports7 days ago
PWHL, Senators discussing plan to keep Charge in Ottawa
-

 NewsBeat7 days ago
Residents reaction as Shildon murder probe enters second day
-

 Business3 days ago
Search for Savannah Guthrie’s Mother Enters Seventh Week with No Arrests
-

 Business4 days ago
US Airports Launch Donation Drives for Unpaid TSA Workers as Partial Government Shutdown Enters Fifth Week
-
 Tech20 hours ago
Are Split Spacebars the Next Big Gaming Keyboard Trend?
-
Crypto World4 days ago
Coinbase and Bybit in Investment Talks: Could Bybit Finally Enter the US Crypto Market?
-

 NewsBeat7 days ago
I Entered The Manosphere. Nothing Could Prepare Me For What I Found.
-

 Business4 days ago
Country star Brantley Gilbert enters growing non-alcoholic beer market
-

 Business2 days ago
Australian shares drop as Iran war enters third week
-

 Crypto World2 days ago
Crypto Lender BlockFills Enters Chapter 11 with Up to $500M in Liabilities
-

 Sports5 days ago
College Basketball Best Bets: Conference Tournament Semifinal Picks
-

 Crypto World6 days ago
Three Binance Charts May Be Hinting at Bitcoin’s Next Move
-

 Politics4 hours ago
The House | The new register to protect children from their abusers shows Parliament at its best
-

 Business6 days ago
Trump demands Powell cut rates as Iran conflict raises energy prices
-

 Crypto World6 days ago
Senate Votes to Include CBDC Ban in Bipartisan Housing Bill
-

 Fashion2 days ago
25 Celebrities with Curly Hair That Are Naturally Beautiful


You must be logged in to post a comment Login