
Crypto World
Bitcoin erases 15 months of gains, falls below $70K amid $840M liquidations


- Bitcoin temporarily fell below $70,000, erasing gains built over the past 15 months.
- Over $840 million in leveraged long positions were liquidated during the sell-off.
- Traders now watch $65,000 support and $72,000 resistance for direction.
Bitcoin has suffered one of its sharpest corrections in recent years, wiping out roughly 15 months of bull market gains in a swift and brutal sell-off.
The world’s largest cryptocurrency temporarily plunged below the psychologically important $70,000 level, shocking traders who had grown accustomed to sustained upside momentum.
The move did not happen in isolation, as it was accompanied by heavy liquidations, weakening sentiment, and visible stress across centralised exchanges.
What initially appeared to be a routine pullback quickly evolved into a deeper reset for the broader crypto market.
Bitcoin price crash wipes out 15 months’ gains
Bitcoin’s drop to the $69,000–$70,000 range marked its lowest level in around 15 months, effectively erasing much of the progress made during the previous bull cycle.
This decline pushed BTC back toward price zones last seen before institutional inflows and ETF-driven optimism reshaped market expectations.
As the price broke below the key support level at $70,000, selling pressure intensified, and confidence among short-term traders deteriorated rapidly.
The correction also dragged down major altcoins, reinforcing the idea that this was a market-wide deleveraging event rather than a Bitcoin-only move.
From a market structure perspective, the fall represented a decisive break from the higher-highs and higher-lows pattern that had defined Bitcoin’s uptrend.
Liquidations accelerate the sell-off
One of the most significant drivers behind the crash was a massive wave of forced liquidations across crypto derivatives markets.
CoinGlass data shows that more than $840 million worth of leveraged positions were wiped out in a short period, with long positions accounting for the majority of losses.
As Bitcoin slipped below critical price thresholds, automated liquidation engines kicked in, amplifying downside momentum.
This cascade effect turned a controlled decline into a sharp flush, catching overleveraged traders off guard.
The liquidation-heavy nature of the drop suggests the move was driven more by market positioning than by a single fundamental catalyst.
After months of elevated leverage and crowded long trades, the market finally reached a breaking point.
Massive Bitcoin outflows from exchanges
At the same time, on-chain data from CryptoQuant shows notable Bitcoin outflows from major exchanges, particularly Binance.

A community-driven withdrawal campaign contributed to a sharp net outflow of BTC, briefly reducing exchange reserves.
In a recent press release, Binance publicly addressed speculation about these movements, denying claims of financial instability and emphasising that withdrawals were proceeding normally.
The exchange also encouraged users to practice self-custody if they felt uncertain, which further highlighted shifting trust dynamics within the market.
Despite the price crash, some analysts view sustained exchange outflows as a sign that long-term holders are not panic-selling.
This divergence between short-term trader behaviour and longer-term investor positioning adds complexity to the current market narrative.
Bitcoin price forecast – what to look at in the coming days
Looking ahead, traders should closely watch several key levels as Bitcoin attempts to stabilise after the sell-off.
The $70,000 zone now acts as immediate support, and a break below this level could push the price towards the $65,000 area, which stands out as a major support zone, as it aligns with previous consolidation ranges.

A deeper breakdown could expose Bitcoin to a move toward the $60,000 psychological level, where buyers may attempt a stronger defence.
On the upside, a sustained recovery above $72,000 would be an early sign that selling pressure is easing.
For now, volatility remains elevated, and traders are likely to stay cautious until Bitcoin establishes a clearer direction.


- Hedera (HBAR) gains on ecosystem token listings and growing exchange support.
- Google, IBM, and Deutsche Telekom back Hedera Hashgraph, boosting credibility.
- Breaking above the resistance at $0.1051 could target $0.15 in coming months.
Hedera is showing renewed momentum as its price hovers around $0.10, signaling potential for a near-term breakout.
The cryptocurrency has outperformed Bitcoin (BTC) over the past 24 hours, gaining 1.5% despite low overall market activity.
Much of this movement is being driven by growing visibility and adoption of the Hedera ecosystem on major exchanges.
Kraken’s recent listings of Hedera-native tokens, including lending protocol BONZO and community tokens like $SAUCE, have brought attention to the network.
These listings are more than just symbolic. They represent deeper integration and access for investors to the broader Hedera ecosystem.
Volume trends suggest that this price uptick is sentiment-driven rather than a surge of large capital inflows.
This highlights that investor interest is increasingly tied to the network’s fundamental growth.
Enterprise adoption fuels confidence
One of Hedera’s strongest advantages is its backing by major global enterprises.
Companies like Google, IBM, and Deutsche Telekom are active participants in the Hedera Council, giving the Hedera Hashgraph network both governance oversight and credibility.
Council members operate nodes, vote on protocol updates, and guide the technical direction of Hedera.
This governance model appeals to institutional investors who value transparency and accountability in enterprise blockchain solutions.
The involvement of these companies also signals that Hedera is moving beyond speculative trading into real-world enterprise applications.
Analysts point to projects like supply chain tracking and tokenized services as examples where Hedera is already proving its practical value.
This fundamental adoption could be a critical driver for HBAR price growth in the months ahead.
Technical analysis suggests near-term upside
On the technical side, HBAR is testing important support and resistance zones.
Short-term support has held around $0.0942, while immediate resistance is near $0.1051.
Breaking above this level could open the way for further gains toward $0.1174 and possibly $0.1293 according to CoinLore.
Additional near-term resistance exists at around $0.104, marking Fibonacci retracement targets that traders are watching closely.

A daily close above $0.1014 would signal stronger bullish momentum, while a break below $0.0979 could trigger a pullback toward the 20-day exponential moving average near $0.097.
Analysts suggest that if current support levels hold and momentum continues, HBAR could test the $0.15 level in the medium term.
Upcoming events like the HederaCon 2026, scheduled for early May, could also provide catalysts.
Positive news from the conference could add momentum to HBAR’s price, particularly if it coincides with increased trading activity for ecosystem tokens.
An Australian survey signals growing everyday crypto use despite lingering banking frictions. Independent Reserve’s annual poll of 2,000 Australians, conducted between January 12 and January 30, 2026, shows a meaningful uptick in practical crypto payments, with households increasingly treating digital assets as a usable payment method rather than solely a speculative bet. The report reveals a notable expansion in real-world use cases, even as banks continue to scrutinize and constrain crypto-enabled transactions. These dynamics highlight a country that is embracing crypto for everyday commerce while navigating a still unsettled regulatory and banking landscape.
Key takeaways
- Crypto as a payment method has doubled, rising from 6% to 12% of respondents who used crypto to pay for goods or services in 2026.
- Online shopping emerged as the leading use case, with 21% of respondents paying for online purchases using crypto.
- Paying for services, including freelancing and video game purchases, accounted for 16% of respondents’ crypto usage for goods and services.
- Banking friction remains a major barrier, with about 30% reporting delays or rejections when buying crypto or transferring funds to exchanges, up from 19.3% in 2025.
- Regulatory clarity is widely seen as the key to unlocking smoother bank-crypto interactions and broader adoption.
Tickers mentioned:
Sentiment: Neutral
Market context: The findings come amid ongoing global debates over crypto regulation and the role of banks in digital-asset ecosystems. In Australia, the push for clearer licensing and standards is framed as a path to reduce friction while protecting consumers and institutions.
Why it matters
The Independent Reserve survey underscores a shift in consumer behavior: crypto is crossing from the fringes of finance into everyday checkout lanes. The fact that more Australians view crypto as a practical payment tool rather than a mere investment signals a potential shift in demand for crypto-enabled products and services. Yet the journey is uneven. The same research shows that a substantial portion of the population still encounters roadblocks when attempting to transact with crypto, particularly through traditional banking rails.
The banking environment in Australia has grown more cautious since 2023, when several large banks introduced constraints on crypto-related transactions. This cautious stance manifests as payment delays, caps on transfers to exchanges, and additional identity checks. The report notes that around 30% of investors faced delays or rejections at least once, a notable rise from the prior year. The friction is not merely transactional; it influences consumer confidence and business planning for exchanges, wallets, and merchants who accept crypto as a form of payment.
“For many Australians, the lack of regulation hits home when a payment to a crypto exchange is delayed or blocked, an issue that has continued to rise for another year,” the report authors said. “These interruptions affect both consumers and businesses, showing how cautious banks are with crypto when the rules aren’t clear.”
The authors argue that the core issue is not simply the size of a transaction but the behavior and patterns associated with crypto activity. Banks may be tailoring their risk assessments to perceived patterns rather than merely to transaction value, a shift that underscores the urgent call for regulatory clarity. In their view, clear licensing would enable banks to differentiate legitimate, compliant operators from opaque or high-risk actors, reducing unnecessary friction while protecting consumers.
Beyond the regulatory question, the report also notes a broader sentiment within the sector: the Australian crypto market has seen population-wide growth and regulatory dialogue, but a spectrum of issues remains. Crypto executives who spoke to Cointelegraph last month pointed to ongoing progress—especially in terms of user growth and constructive regulatory reforms—while acknowledging gaps that still hinder seamless integration with traditional financial services. The conversation around licensing, consumer protections, and operator standards continues to shape how the sector can scale without compromising safety or prudence.
To illustrate the complexity of the landscape, the report and related coverage highlight several intertwined factors: a pragmatic upscaling of crypto payments among consumers, persistent friction within banking channels, and a clear demand for a robust, authority-backed framework. The calls for regulatory clarity are not merely aspirational; they are being framed as practical enablers that could foster greater interoperability between exchanges, wallets, and banks. The net takeaway is a cautious optimism: adoption is rising, but a well-defined regulatory regime is viewed as essential to preserving consumer protection while unlocking broader access to crypto-enabled commerce.
Related coverage and prior reporting emphasize that the Australian market has long wrestled with banking barriers, a situation that policymakers and industry participants alike view as solvable through consistent licensing standards and transparent governance. In that sense, the present survey adds empirical weight to the argument that regulated, auditable operations will bolster banks’ confidence in crypto transactions, ultimately supporting a healthier, more reliable payment ecosystem for ordinary Australians.
What to watch next
- Regulatory milestones in Australia: pending licensing standards and clarity around crypto-operator oversight.
- Banking policy evolution: how major lenders adapt their risk models and customer onboarding rules in response to new regulations.
- Industry partnerships: how exchanges, wallets, and merchants align with regulatory expectations to reduce friction for end users.
- Further research: follow-up surveys to track whether banking changes translate into improved accessibility and reduced delays for crypto transactions.
Sources & verification
- Independent Reserve’s 2026 Australian crypto adoption survey of 2,000 adults, conducted January 12–30, focusing on real-world payments and use cases.
- Binance survey noting persistent banking barriers for crypto exchange users in Australia.
- National Australia Bank and Commonwealth Bank regulatory changes in crypto transaction processing in 2023, including delays and identity checks.
- Cointelegraph reporting on Australian crypto adoption, regulation, and SMSF growth in 2026.
- Crypto regulation discussions and legal commentary on regulatory clarity to bridge gaps between exchanges and banks.
Transforming payments in a cautious environment
Banking friction and practical use reshape Australia’s crypto payments
Independent Reserve’s study paints a nuanced portrait of a market on the cusp of broader adoption. The 2026 survey of 2,000 Australians indicates a clear uptick in crypto payment activity, with 12% using crypto to purchase goods or services—double the 2025 level of 6%. The shift reflects a growing belief that crypto can function as a consumer payment option, particularly for everyday online purchases where speed and convenience matter. In a country with robust digital commerce, the ability to settle online orders with crypto appears to be appealing to a subset of shoppers who value control over their transaction experiences and seek alternatives to traditional card rails.
The data show notable segmentation in use cases. Online shopping was the most common scenario among those who used crypto for goods and services, with 21% selecting it as their primary real-world application. Another 16% indicated they used crypto to pay for services, including freelancing and digital entertainment purchases. These figures suggest that the technology is becoming part of the fabric of everyday commerce rather than merely a speculative asset held in portfolios. Yet the path to broader acceptance remains colored by friction at the interface between crypto services and mainstream banking.
Frictions at banks’ doors are repeatedly highlighted as a major hurdle. The survey notes that around 30% of investors encountered delays or outright rejections when attempting to buy cryptocurrency or transfer funds to a crypto exchange at least once, up from 19.3% in 2025. This widening gap underscores a banking sector that remains wary of crypto activity in the absence of clear and consistent regulatory guardrails. In practical terms, delays can mean missed opportunities and increased costs for users who rely on timely access to digital assets for commerce, payroll, or freelance payments.
Regulatory clarity emerges as a central remedy in the conversation. The report argues that clear licensing and robust standards would give banks the confidence to process crypto-related transactions while maintaining appropriate risk checks. As one excerpt from the analysis notes, “Clear licensing and regulation can help fix this. By setting high standards for crypto operators, banks would have more confidence that transactions are legitimate.” The implication is straightforward: a well-defined framework could bridge the gap between exchanges and banks, reducing the friction that currently dampens consumer confidence and business activity in the crypto space.
“For Australia’s blockchain industry, which has faced banking hurdles for over a decade, effective regulation could finally bridge the gap between exchanges and banks, giving investors and businesses more certainty and reliability.”
While the sentiment is cautiously optimistic, the authors stress that progress hinges on policy clarity. In interviews and industry briefings cited by the piece, executives emphasized that the country’s crypto market shows momentum in user growth and regulatory reform, yet still requires a cohesive approach to licensing, consumer protection, and operator accountability. The takeaway is not merely about increasing volumes; it is about cultivating a trusted environment in which ordinary Australians can access and use crypto as a legitimate, compliant means of payment.
As regulators, banks, and industry participants navigate this transitional phase, the survey’s findings offer a evidence-backed pulse check on how far the ecosystem has come—and how far it still has to travel. If the regulatory regime establishes credible guardrails and operational standards, a broader segment of the population could begin to treat crypto as a regular, reliable payment option, with banks offering smoother onboarding and fewer interruptions. The next steps for policymakers will involve balancing consumer protection with innovation, ensuring that the gains in adoption are not undermined by a lack of clarity or insufficient oversight.
Crypto World
BNB Chain Extends Zero-Fee Stablecoin Transfers for USDC, USD1, and U Until March 31, 2026

TLDR:
- BNB Chain has extended its 0 Fee Carnival through March 31, 2026, covering USDC, USD1, and U gas fees.
- Over $4.5 million in stablecoin gas fees have been covered since the program launched on BNB Chain.
- Thirteen wallets sponsor free BSC transfers, with USD1 and U unlimited and USDC capped at two per day.
- Celer cBridge and Meson.fi offer zero-cost bridging into BNB Chain from Ethereum, Arbitrum, and more.
BNB Chain’s 0 Fee Carnival has been extended through March 31, 2026, at 23:59 UTC. The program now covers gas fees for three stablecoins: USDC, USD1, and U.
This applies across CEX withdrawals, wallet transfers, and cross-chain bridging on BSC and opBNB. Since launch, BNB Chain has covered more than $4.5 million in user gas fees.
The network also handles approximately 40% of all global stablecoin transactions to date.
Zero-Fee Withdrawals and Wallet Transfers Now Available Across Platforms
Multiple major centralized exchanges are part of the zero-fee withdrawal program. Binance, Bitget, MEXC, Bitmart, Ourbit, BingX, LBank, and HTX are all enrolled.
Each exchange sets its own minimum withdrawal threshold for the supported assets. For example, Binance covers USD1 withdrawals on BSC with a minimum of $10.
BNB Chain confirmed the extension through an official post on X. The network stated it had already covered $4.5 million in gas fees across the program. The post also pointed to its 40% share of global stablecoin activity. Zero fees continue to apply to all three supported stablecoin assets.
The 0 Fee Carnival continues.
We’ve already covered $4.5M+ in stablecoin gas fees and power ~40% of all stablecoin transactions.
Now zero-fee transfers for USDC, USD1 & U are extended to March 31, 2026.
Read more
https://t.co/gNxRWzN4zS pic.twitter.com/fTYMkDxyr6
— BNB Chain (@BNBCHAIN) March 17, 2026
Wallet-to-wallet transfers on BSC also remain gas-free under the extension. Thirteen wallets sponsor these transfers, including Trust Wallet, Bitget Wallet, SafePal, and TokenPocket.
USD1 and U have unlimited daily transfers, while USDC is capped at two per day. The minimum eligible transfer amount is $0.10.
Only direct wallet-to-wallet transfers on BSC qualify for the gas sponsorship. Transactions routed through DApps or swap protocols are not covered.
This keeps the program focused on standard peer-to-peer stablecoin movement. Users sending directly between wallets stand to benefit the most.
Cross-Chain Bridging Into BNB Chain Now Comes at Zero Cost
Celer cBridge and Meson.fi both support gas-free stablecoin bridging into BNB Chain. Eligible source chains include Ethereum, Arbitrum, Polygon, Avalanche, and Optimism.
Meson.fi also includes Tron as a supported source network. Together, these two bridges cover the most widely used cross-chain routes.
Celer cBridge charges no bridge fee for USDC transfers onto BNB Chain. Meson.fi takes a different approach, offering users a full 100% rebate on completed transfers.
In both cases, users pay nothing to complete a cross-chain move. This removes a common barrier for users active across multiple blockchain ecosystems.
Before this program, moving stablecoins across chains involved gas fees on both ends. The zero-fee setup now eliminates that cost for users bridging into BNB Chain.
This makes it easier for users coming from Ethereum, Arbitrum, or Optimism to join. Those users can now explore DeFi on BNB Chain without paying to get started.
HTX has gone further by committing to zero-fee USD1 support on a permanent basis. Other wallets, exchanges, and bridges are invited to participate as the program grows.
BNB Chain positions this as a long-term effort to reduce friction in stablecoin movement. The current extension gives all users until March 31, 2026, at 23:59 UTC.
The post BNB Chain Extends Zero-Fee Stablecoin Transfers for USDC, USD1, and U Until March 31, 2026 appeared first on Blockonomi.

After gaining more than 100% since its all-time low, PI has now dumped by almost 50% from its local peak.
Although it was completed several days ago, the Core Team behind the controversial project announced the migration earlier today, solidifying the successful upgrade to version 20.2.
They reasserted that the new protocol version should be groundbreaking for the project as it provides the foundations to eventually enable smart contract capabilities. However, even this big news couldn’t halt PI’s free-fall.
V20.2 Arrived
The past month has been quite eventful for Pioneers as the Core Team made several key protocol upgrades even before the aforementioned one. At first, they announced the successful migration to v19.6 on February 20, followed by v19.9 on March 4.
All eyes turned to March 12, which was the new deadline for the implementation of v20.2. It was the most important one from this year. In a post on X from hours ago, the team said: “All major Pi nodes have now been upgraded to version 20.2 and are supporting protocol 20.”
It’s worth noting that the team actually completed the migration within the original timeframe, as hinted in their Pi Day celebratory post from the weekend. However, the post now provides more information on what Pioneers can expect, especially since Pi Network has upgraded its Mainnet blockchain to protocol 20. The latest version is a major step toward the network’s goal to have smart contract capabilities, as explained in the post:
“Protocol 20 provides the foundation to enable smart contract capabilities, and the rollout of smart contracts will occur gradually, prioritizing categories that align with utility-based product innovation and operations. The specific types of smart contracts featured will depend heavily on the needs arising from the utility creation process.”
PI Drops Yet Again
Perhaps driven by the initial updates, PI’s price went on a roll in late February/early March. This rally received a major boost when the major US crypto exchange Kraken announced that it would list it for trading on March 13. The effects were immediate as PI skyrocketed by double digits from around $0.20 to almost $0.30.
After hitting a five-month peak, though, the reality set in as it turned out to be another classic sell-the-news event. PI nosedived on the next day toward the $0.20 support, which gave in yesterday. The situation has only worsened in the past 12 hours, as the token has dumped to under $0.175, thus dropping by almost 50% in just a few days.
You may also like:
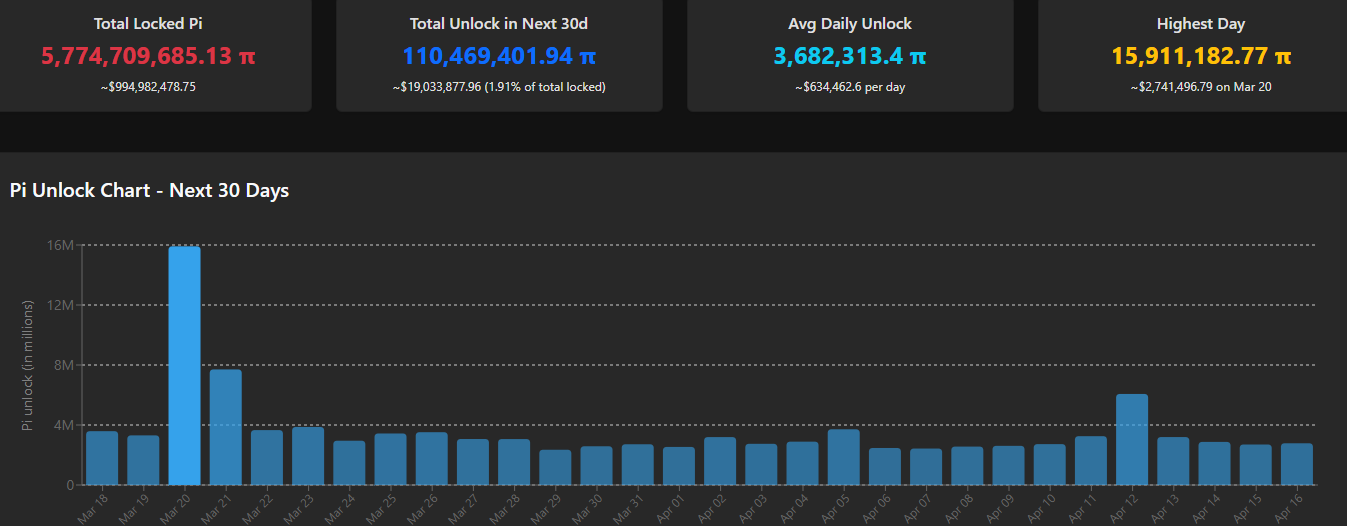
PiScan data shows that the number of tokens to be released in the next month would be rather negligible compared to what it was in February and early March. Aside from March 20, when almost 16 million coins will be unlocked, the rest of the month will see numbers below 4 million.
Binance Free $600 (CryptoPotato Exclusive): Use this link to register a new account and receive $600 exclusive welcome offer on Binance (full details).
LIMITED OFFER for CryptoPotato readers at Bybit: Use this link to register and open a $500 FREE position on any coin!
Disclaimer: Information found on CryptoPotato is those of writers quoted. It does not represent the opinions of CryptoPotato on whether to buy, sell, or hold any investments. You are advised to conduct your own research before making any investment decisions. Use provided information at your own risk. See Disclaimer for more information.


This week banks and crypto lobbyists may reach a compromise on stablecoin yield payments, according to U.S. Senator Tim Scott. Currently, the Senate’s crypto market structure bill progress remains stalled.
Summary
- Senator Tim Scott says a proposal to resolve the stablecoin yield dispute could arrive this week, raising hopes for movement on the stalled Senate crypto market structure bill.
- Talks have slowed over a provision targeting stablecoin yield payments, with banks warning of deposit outflows while crypto firms argue the restriction would limit competition
Speaking at a crypto lobby event in Washington, Scott, who chairs the Senate Banking Committee, said he expects to “have the first proposal in my hands to take a look at.”
“If that actually happens before the end of this week, and I think that it will […] I think we’re going to be in much better shape,” he said.
Regulation has been stalled
The bill in question is the Senate’s crypto market structure legislation, formally known as the Digital Asset Market Clarity Act (or the CLARITY Act), which was introduced to outline how regulators will oversee digital assets and define the roles of different agencies.
However, progress around the legislation came to a standstill after disagreements emerged over a provision that would ban third parties from offering stablecoin yield payments.
Bankers argue that such yield offerings create a loophole that could drive deposits away from traditional banks, while crypto proponents say the restriction is anti-competitive and limits user incentives.
The bill concerns both the Securities and Exchange Commission and the Commodity Futures Trading Commission.
Senate Banking, which oversees the SEC, indefinitely postponed a markup of the bill in January. Subsequently, the Senate Agriculture Committee, which oversees the CFTC, advanced its version to the Senate floor.
Over the past weeks, bankers and crypto lobbyists have met for multiple closed-door meetings to negotiate a middle ground, but the Senate Banking Committee has not yet scheduled any formal updates to the legislative calendar.
In recent comments, House Financial Services Committee chair French Hill said the CLARITY Act can help address some of the unresolved issues tied to stablecoin regulation and broader market structure concerns.
Other issues being addressed
According to Scott, the negotiations extend beyond just stablecoin yield, and other provisions around ethics, decentralized finance, and “who is carved in and who is carved out” are also being worked through.
“We have made a lot of progress over the last probably 30 days or so,” he said, adding that regulators and lawmakers are continuing to narrow differences as momentum builds behind the bill.
The US dollar is trading mixed against its major counterparts following a sustained rally last week. The market is now entering a phase of moderate correction, as investors adopt a wait-and-see approach ahead of key macroeconomic releases and central bank decisions that could determine the next direction in the FX market.
Market participants are focused on the upcoming Federal Reserve decision, updated FOMC economic projections, and the Bank of Canada meeting. Additional influence is coming from US inflation and producer price data, as well as statistics on industrial orders and commodity markets.
Geopolitical tensions remain another source of uncertainty, continuing to impact commodity markets and demand for safe-haven assets. Reports of renewed escalation in the Middle East and risks to energy supply routes are increasing volatility in the oil market, which in turn directly affects the Canadian dollar.
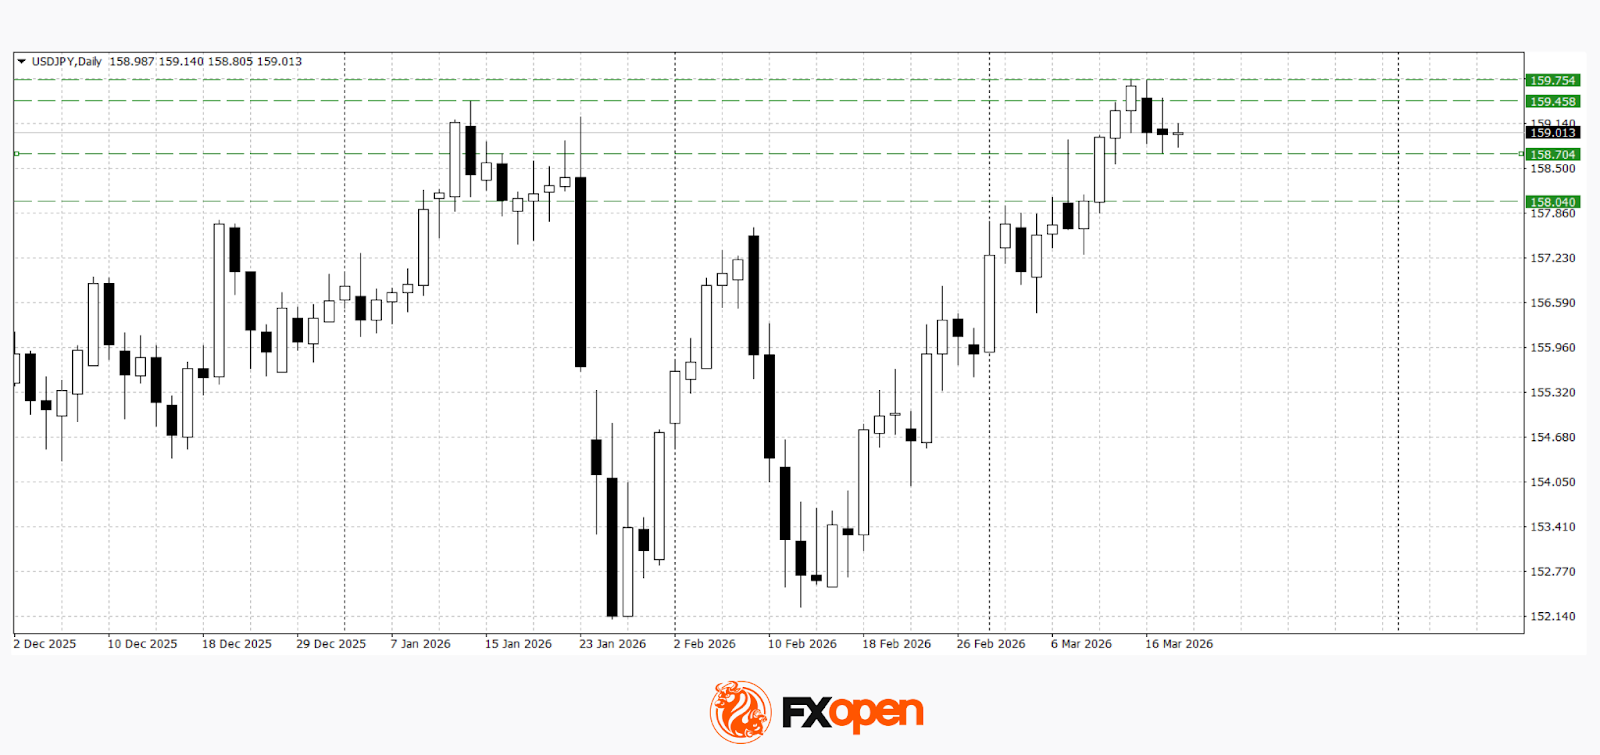
USD/JPY
The USD/JPY pair, after an extended rally, has approached key resistance levels and shifted into a corrective decline. The downside move remains limited so far and is largely driven by profit-taking ahead of major fundamental events.
Technical analysis suggests the potential for a deeper pullback if the price firmly settles below 158.70. However, a break above the recent high at 159.70 would signal a possible continuation of the primary upward trend.
Key events for USD/JPY:
- Today at 14:30 (GMT+2): US Producer Price Index (PPI);
- Today at 20:00 (GMT+2): Federal Reserve interest rate decision;
- Today at 20:30 (GMT+2): FOMC press conference.

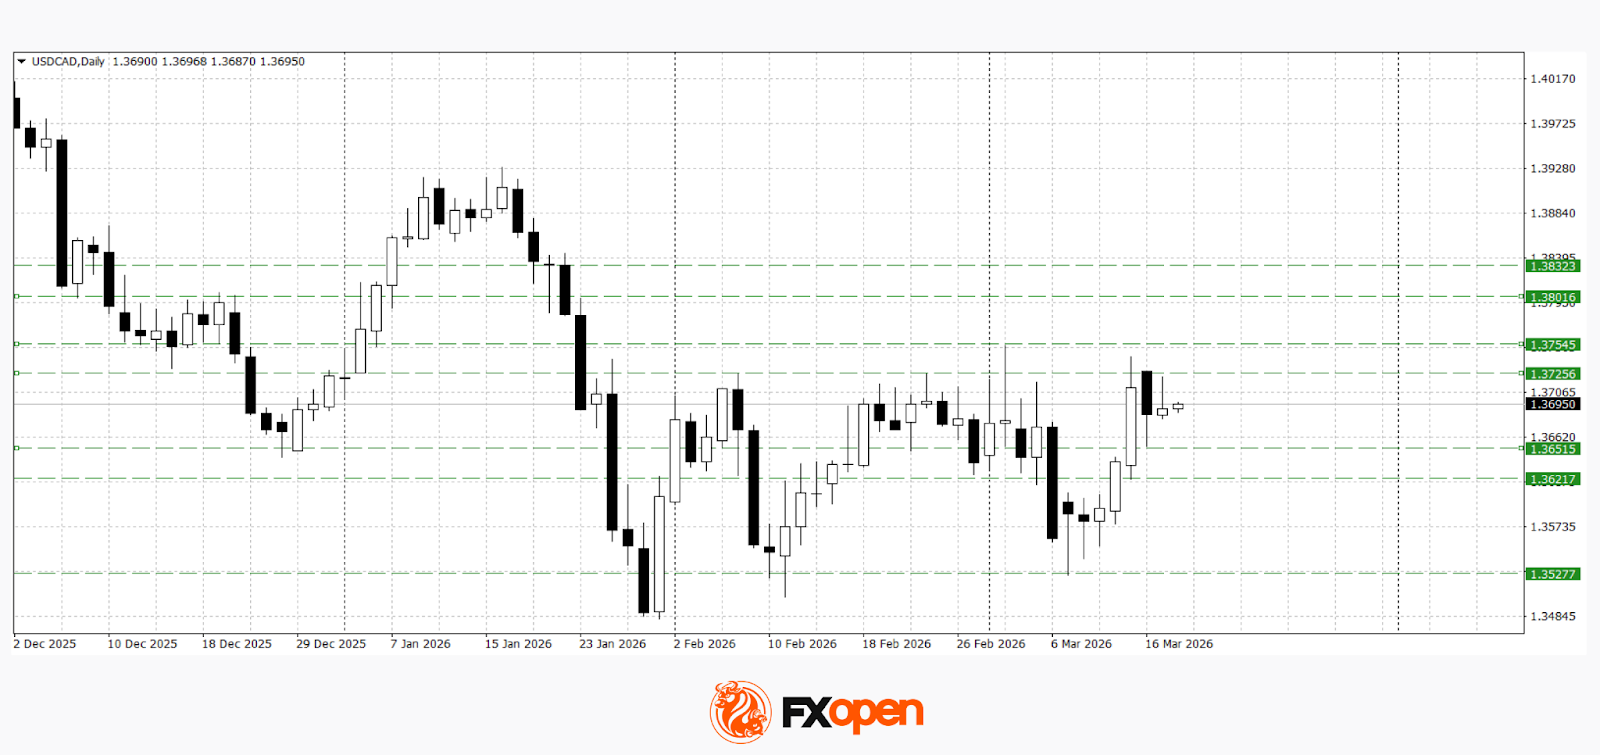
USD/CAD
The USD/CAD pair has reached the upper boundary of the medium-term range at 1.3530–1.3750. Buyers have so far failed to hold above this level and extend the upward move, resulting in a pullback below 1.3700.
If US dollar-positive news emerges, a break above 1.3730 could open the way for further gains towards 1.3800–1.3820. Conversely, a rejection from current levels may lead to a retest of key support in the 1.3620–1.3650 zone.
Key events for USD/CAD:
- Today at 15:45 (GMT+2): Bank of Canada interest rate decision;
- Today at 16:30 (GMT+2): US crude oil inventories;
- Today at 16:30 (GMT+2): Bank of Canada press conference.
Trade over 50 forex markets 24 hours a day with FXOpen. Take advantage of low commissions, deep liquidity, and spreads from 0.0 pips (additional fees may apply). Open your FXOpen account now or learn more about trading forex with FXOpen.
This article represents the opinion of the Companies operating under the FXOpen brand only. It is not to be construed as an offer, solicitation, or recommendation with respect to products and services provided by the Companies operating under the FXOpen brand, nor is it to be considered financial advice.
Crypto World
Can the crypto market rebound as SEC clarifies that most cryptocurrencies are non securities?


The crypto market remained unfazed on Wednesday shortly after the U.S. Securities and Exchange Commission clarified that most of the cryptocurrencies in the market would not be considered a security under federal law.
Summary
- The crypto market remained largely muted after the SEC clarified its framework for determining whether tokens qualify as securities.
- Bitcoin held near the $74,000 level while major altcoins showed limited movement, keeping total market capitalization around $2.61 trillion.
- Investor focus shifted to macro catalysts, with traders positioning cautiously ahead of the Federal Reserve’s rate decision and expectations for delayed rate cuts.
Bitcoin (BTC), the world’s largest crypto asset, traded at $73,909 with no net movement over the daily period after it gave up most of its gains from the past day when it surged past the $75,000 resistance.
Ethereum (ETH), Solana (SOL), Dogecoin (DOGE), and Chainlink (LINK) were some of the major crypto assets that also showed relative calmness with minor gains on Wednesday. Together, these assets provided little volatility for the broader market, with the total crypto market cap stalling at $2.61 trillion.
On Tuesday night, the U.S. SEC issued a notice that clarifies how the securities watchdog would determine if a token would be deemed securities or not and how a non-security asset can be part of an investment contract under the Howey Test.
While the SEC did not broadly classify most cryptocurrencies as non-securities, the updated framework suggests that many tokens may fall outside securities laws depending on their structure, distribution, and use case.
Previously, the agency’s stance on which cryptocurrencies could be deemed securities remained unclear, creating significant uncertainty for market participants navigating the regulatory landscape.
The new crypto asset taxonomy provides much-needed clarity, but the SEC also classified 16 major crypto assets as digital commodities, outside the jurisdiction of securities law. These include prominent tokens like Litecoin and Cardano.
Other key developments supporting market sentiment include SEC Chair Paul Atkins’ recent proposal for a crypto safe harbor framework.
While such a development is a major win for the crypto industry, which has faced years of legal uncertainty, the market’s relatively muted reaction comes from a cautious atmosphere as investors await the outcome of Fed rate cut decisions later today at 2:30 P.M. ET.
Markets expect that the Fed will keep rates steady in the current range of 3.50% to 3.75%. The CME FedWatch Tool currently shows a 96% to 99% odds that the Fed will hold interest rates, with only a marginal 1% to 4% chance of a cut.
Traders also seemed to have pushed back their expectations for the next rate cut, with many now anticipating the first reduction of 2026 to occur no earlier than September or October.
Typically, when investors expect a delay in Fed rate cuts, risk assets such as cryptocurrencies tend to lose momentum as investors step back, often awaiting clearer macroeconomic catalysts before reengaging with the market.
Total crypto market open interest dipped slightly over the past day, signaling traders are closing positions ahead of potential volatility.
Disclosure: This article does not represent investment advice. The content and materials featured on this page are for educational purposes only.
Crypto World
Bitrefill blames North Korea-linked Lazarus hacker group for compromising 18,500 purchase records


Cryptocurrency payments and gift card platform Bitrefill has blamed the North Korea-linked hacking group Lazarus for a cyberattack on March 1, 2026, that compromised parts of its infrastructure and cryptocurrency wallets.
The attackers gained access to production keys, transferred funds from hot wallets, and exposed 18,500 purchase records containing emails, payment addresses, and IP addresses.
Approximately 1,000 records included encrypted usernames. Affected users were notified. Operations have resumed, with the company announcing to cover losses from operational capital. The incident underscores the importance of vigilance regarding crypto and on-chain security.
The modus operandi included malware, on-chain tracing and reused IP and email addresses and was similar to previous attacks attributed to North Korea’s Lazarus Group, also known as Bluenoroff, the company said in a detailed report on X.
The Lazarus Group has previously targeted crypto projects including Ronin Network, Harmony’s Horizon Bridge, WazirX, and Atomic Wallet.
How the attack unfolded
It all began with with a compromised employee laptop, which exposed legacy credentials and allowed attackers to access Bitrefill’s broader infrastructure, including parts of its database and cryptocurrency wallets.
The breach quickly became apparent when the company noticed unusual purchasing patterns among certain suppliers, signaling that attackers were exploiting its gift card inventory and supply chains. The firm also noted that attackers were draining some hot wallets and moving funds to their own addresses, following which, the system was taken offline to contain the damage.
“Bitrefill operates a global e-commerce business with dozens of suppliers, thousands of products, and multiple payment methods across many countries. Safely switching all these things off and bringing them back online is not trivial,” the company said in a statement.
Since the incident, Bitrefill has been working with security researchers, incident response teams, on-chain analysts, and law enforcement to investigate the breach.
Customer data impact
Hackers accessed a small set of purchase records, approximately 18,500, containing
Bitrefill said there is no evidence that customer data was a primary target. Its logs indicate that attackers ran a limited number of queries aimed at cryptocurrency holdings and gift card inventory rather than extracting the entire database.
The platform stores minimal personal data and does not require mandatory KYC. A small subset of purchase records, approximately 18,500, was accessed, containing information such as email addresses, crypto payment addresses, and metadata including IP addresses. About 1,000 records contained encrypted names for specific products; the company is treating this data as potentially compromised and has notified affected customers directly by email.
At present, Bitrefill does not believe customers need to take any additional action, though it advises caution regarding unexpected communications related to Bitrefill or cryptocurrency.
Steps to strengthen security
In response to the breach, Bitrefill said it has already strengthened its cybersecurity practices and is working to draw lessons from the incident.
The company outlined several measures, including conducting comprehensive penetration tests with external experts, tightening internal access controls, enhancing logging and monitoring for faster threat detection, and refining incident response procedures and automated shutdown protocols.
Looking forward
Bitrefill acknowledged that this was its first major attack in more than a decade of operation but stressed that it remains well-funded and profitable, capable of absorbing operational losses. Most systems, including payments, stock, and accounts, are back online, with sales volumes returning to normal.
“Getting hit by a sophisticated attack sucks (a lot),” the company said. “But we survived. We will continue to do our best to continue deserving our customers’ trust.”


The notorious Lazarus Group may have been behind a cyberattack on crypto e-commerce store Bitrefill, the firm estimates.
Summary
- Bitrefill linked a March 1 cyberattack to tactics associated with the Lazarus and BlueNoroff groups, after attackers compromised an employee laptop and drained funds from hot wallets.
- Around 18,500 purchase records were accessed, though the company said only limited customer information was exposed and there was no evidence of a full database breach.
Detailing the March 1 incident in a Tuesday X post, the firm said the attackers used malware, on-chain tracing, and reused IP and email infrastructure to drain funds from its hot wallets after compromising an employee’s laptop. Attackers also allegedly accessed around 18,500 purchase records, although this involved only “limited customer information.”
“We find many similarities between this attack and past cyberattacks by the DPRK Lazarus / Bluenoroff group against other companies in the crypto industries,” the firm wrote.
Bitrefill is a crypto e-commerce platform that allows customers to spend digital assets on real-world products and gift cards. It added that the attackers were primarily financially motivated, as there was “no evidence that they extracted our entire database.”
“The attackers ran a limited number of queries consistent with probing to understand what there was to steal, including cryptocurrency and Bitrefill gift card inventory,” it added.
Bitrefill did not disclose how much crypto was stolen but said it would absorb the losses from its operational capital.
“We have already significantly improved our cybersecurity practices, but vow to continue to draw learnings from this experience to make sure user and company balances and data remain maximally safe,” Bitrefill said, adding that all operations were back to normal.
The company has since strengthened its security posture and has contacted law enforcement while working with security firms to investigate and respond to the incident.
Lazarus group remains a major threat
Over the years, the Lazarus Group has been credited with some of the crypto industry’s largest hacks.
One of the biggest attacks involved crypto exchange Bybit, which lost around $1.4 billion last year. The group was also a suspected actor behind the hack of South Korean crypto exchange Upbit and UK-registered trading platform Lykke.


- XRP shows rare bottom signals and strong rebound potential.
- The key support at $1.44–$1.48 will guide near-term price action.
- A break above $1.60 with volume needed to sustain the rally.
XRP has grabbed the spotlight after overtaking BNB in market cap ranking following its recent price rebound.
Analysts point to technical signals that suggest XRP may have recently formed a long-term bottom.
These signals include an oversold RSI on the weekly chart and a stretch of negative funding rates that historically appear before significant rebounds.
XRP rebounded after hitting a rare bottom
After a period of sideways trading, XRP surged to a weekly high near $1.60.
This move followed a modest beta-driven pullback alongside Bitcoin, reflecting that broader market trends still influence XRP.
Despite the rally, the cryptocurrency faced technical resistance, with momentum indicators suggesting it had been overbought.
Trading volumes have cooled after the rally, which is typical when an asset approaches a key resistance area.
The current support zone around $1.44–$1.48 has become crucial.
Holding above this area could allow XRP to test $1.60 again and potentially reach new resistance levels beyond that.
Conversely, a breach below this support may see a decline toward $1.34, highlighting the importance of technical positioning.
What is fueling XRP’s rally?
XRP’s recent gains were fueled by multiple factors. First, its short-term correlation with Bitcoin helped it catch a wave as the broader market dipped slightly.
Second, technical patterns are now aligning in a way that traders rarely see, suggesting the bottom may hold.
Third, market inflows from institutional investors remain a key driver, especially in the form of spot XRP ETF activity.
Outflows from these ETFs in recent weeks have restrained buying pressure, but a reversal could reignite momentum.
But despite these positives, risks remain.
Volume remains lower than during the peak of the rally, signaling that conviction is not yet at its highest. Moreover, the current resistance at $1.60 is a significant hurdle.
A breakout above it, supported by rising trading activity, would confirm that the uptrend can continue.
However, caution is warranted, as the cryptocurrency is still navigating critical resistance and depends on continued support from market flows.
Traders should closely watch to see if XRP can hold its gains and build on this rare bottom.
If the support around $1.44-$1.48 remains firm and institutional demand resumes, the path toward higher levels may be within reach.
At the same time, failing to hold this support could quickly undo the recent gains.
For now, XRP sits at a critical juncture, with potential for both continuation and retracement depending on the next wave of market activity.
‘I tried Charlotte Tilbury’s 20% off face mist and it gave me glass skin in one hour’

At Close of Business podcast March 18 2026

Dune: Part Three Trailer Unveils Robert Pattinson’s Unbelievable Transformation


-
 Crypto World4 days ago
HYPE Token Enters Net Deflation as HyperCore Buybacks Outpace Staking Rewards
-

 Fashion5 days ago
Weekend Open Thread: Addict Lip Glow
-

 Tech2 days ago
Your Legally Registered ‘Motorcycle’ Might Not Count Under Proposed US Law
-
Sports4 days ago
Why Duke and Michigan Are Dead Even Entering Selection Sunday
-

 NewsBeat7 days ago
Residents reaction as Shildon murder probe enters second day
-

 Sports7 days ago
PWHL, Senators discussing plan to keep Charge in Ottawa
-

 Business3 days ago
Search for Savannah Guthrie’s Mother Enters Seventh Week with No Arrests
-

 Business4 days ago
US Airports Launch Donation Drives for Unpaid TSA Workers as Partial Government Shutdown Enters Fifth Week
-
 Tech15 hours ago
Are Split Spacebars the Next Big Gaming Keyboard Trend?
-
Crypto World4 days ago
Coinbase and Bybit in Investment Talks: Could Bybit Finally Enter the US Crypto Market?
-

 NewsBeat7 days ago
I Entered The Manosphere. Nothing Could Prepare Me For What I Found.
-

 Business4 days ago
Country star Brantley Gilbert enters growing non-alcoholic beer market
-

 Business2 days ago
Australian shares drop as Iran war enters third week
-

 Crypto World2 days ago
Crypto Lender BlockFills Enters Chapter 11 with Up to $500M in Liabilities
-

 Sports5 days ago
College Basketball Best Bets: Conference Tournament Semifinal Picks
-

 Crypto World6 days ago
Three Binance Charts May Be Hinting at Bitcoin’s Next Move
-

 Business5 days ago
Trump demands Powell cut rates as Iran conflict raises energy prices
-

 Fashion2 days ago
25 Celebrities with Curly Hair That Are Naturally Beautiful
-

 Crypto World5 days ago
Senate Votes to Include CBDC Ban in Bipartisan Housing Bill
-

 NewsBeat7 days ago
What to know about Erika Kirk after her Air Force board appointment | News US


You must be logged in to post a comment Login