
Crypto World
Bitcoin Miners are Facing a Profit Crisis as Economics Tighten
Bitcoin mining crossed a historic threshold in late 2025. According to a recent report from GoMining, the network entered the zetahash era, surpassing 1 zetahash per second of computing power.
But while hashrate surged to record levels, miner profitability moved in the opposite direction. The result is a mining industry that is larger, more industrialized — and more exposed to price risk than at any point this cycle.
Sponsored
Sponsored
Hashrate Reaches Record Highs as Mining Scales Up
The report shows Bitcoin’s network sustained over 1 ZH/s on a seven-day average, marking a structural shift rather than a temporary spike.
This growth reflects aggressive hardware upgrades, new data centers, and expanding industrial operations. Mining is no longer dominated by marginal players. It now resembles energy infrastructure.
As a result, competition for block rewards has intensified sharply.

Revenue Per Miner Falls Despite Network Growth
While hashrate expanded, revenue per unit of compute fell into one of its tightest ranges on record.
The report highlights that miner earnings increasingly depend on Bitcoin’s price and difficulty alone. Other buffers have faded, including transaction fee spikes and the higher block subsidies that once softened margin pressure
This compression means miners now operate with thinner margins, even as they deploy more capital and power.
According to GoMining, the impact was visible in the mempool. For the first time since April 2023, the Bitcoin mempool fully cleared multiple times in 2025.
Sponsored
Sponsored
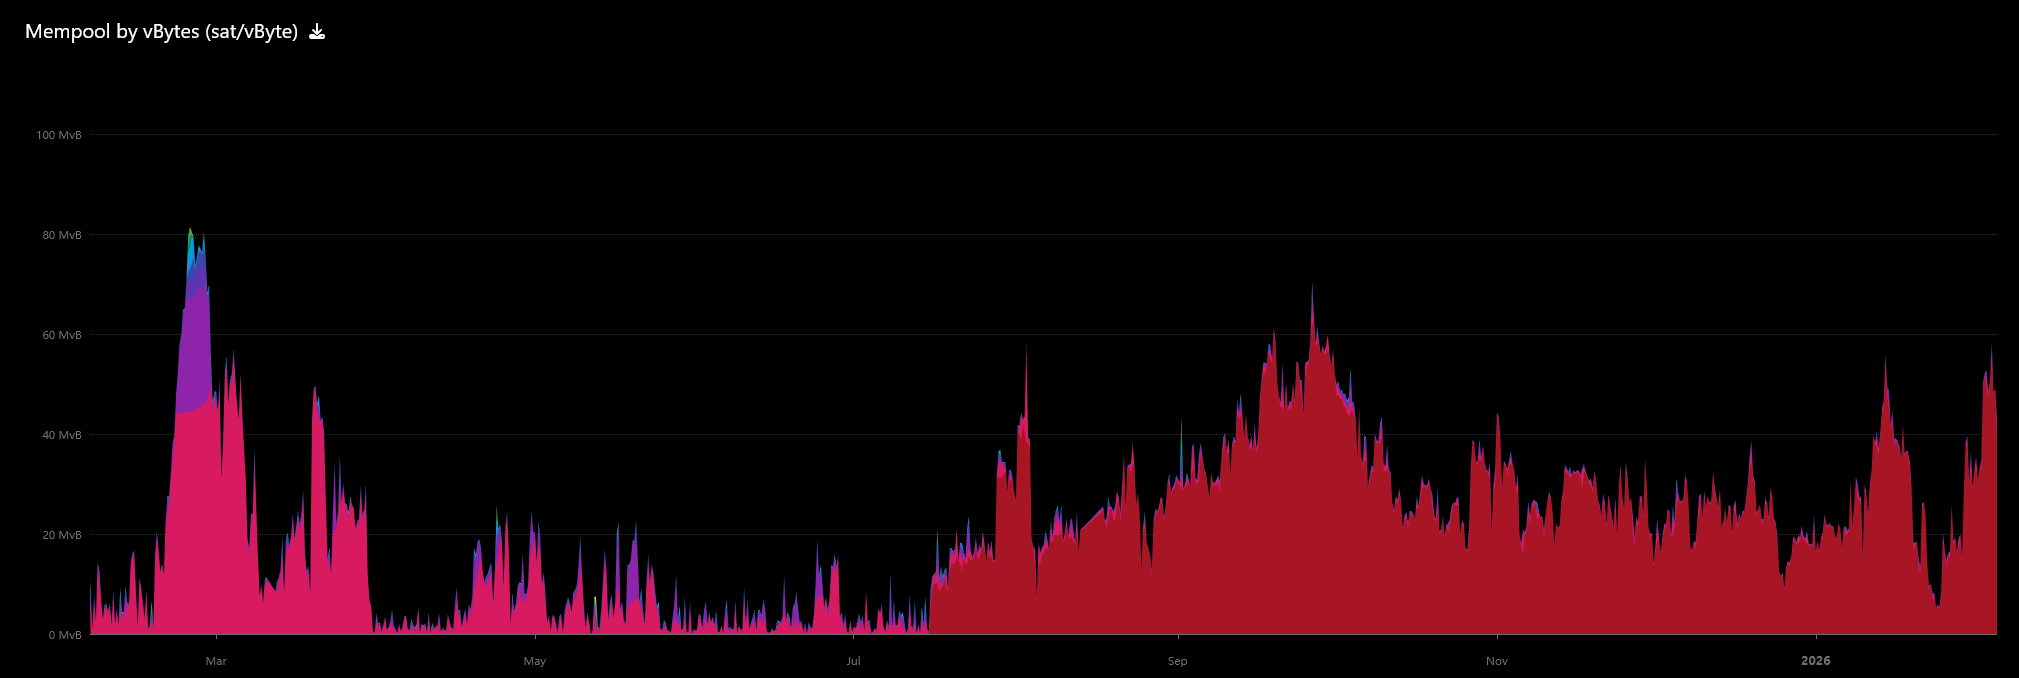
It means the Bitcoin network was so quiet that transactions cleared immediately, even at the lowest possible fees.
As a result, miners earned almost nothing from fees and had to rely almost entirely on Bitcoin’s price and block subsidy for revenue.
Transaction Fees Offer Little Relief After the Halving
Post-halving dynamics worsened the pressure.
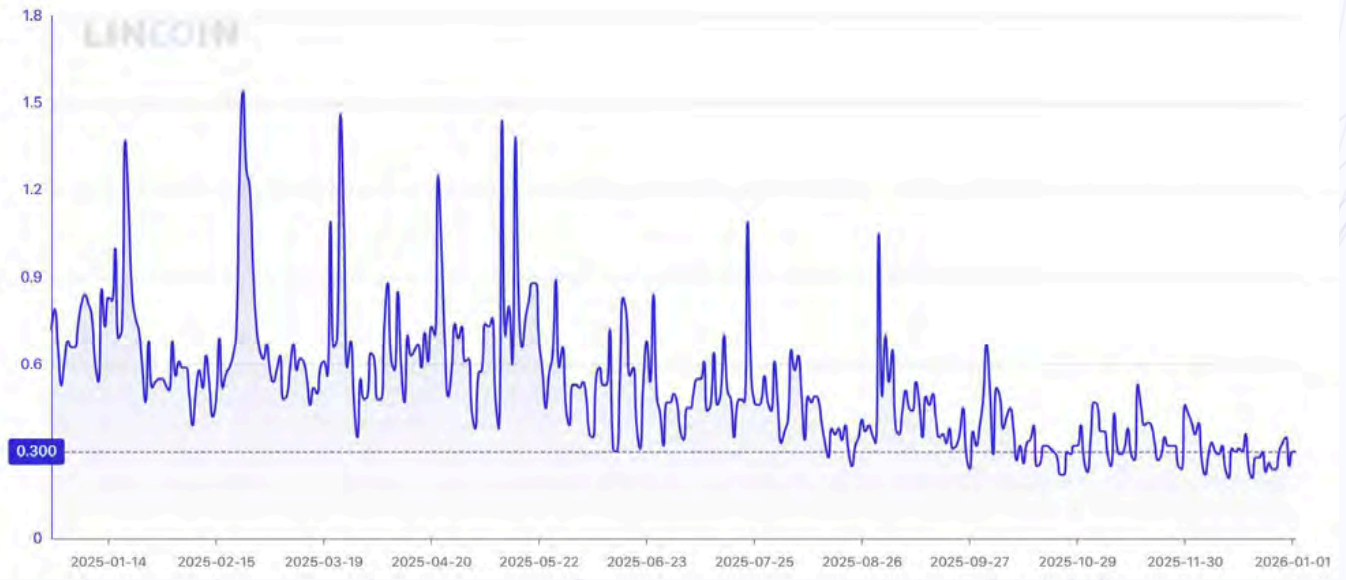
With the block subsidy reduced to 3.125 BTC, transaction fees failed to offset lost revenue. The report notes that fees made up less than 1% of total block rewards for most of 2025.
As a result, miner economics became directly exposed to Bitcoin price swings, with fewer internal stabilizers.
Sponsored
Sponsored
Hashprice Hits Lows as Margins Stay Under Pressure
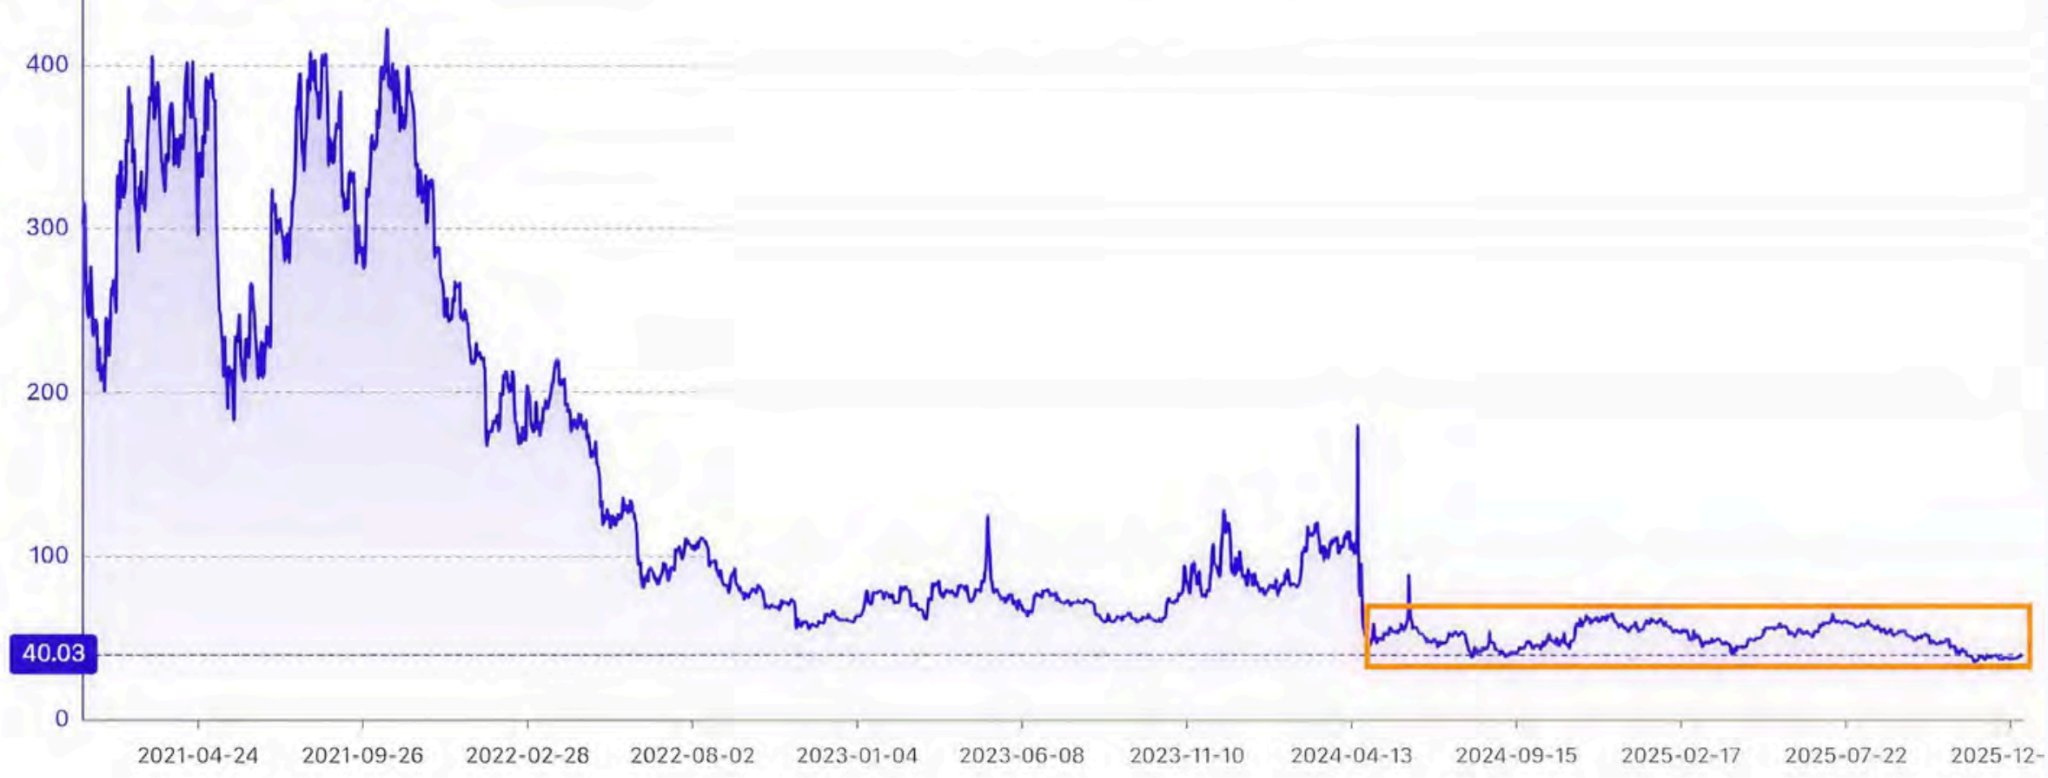
The squeeze showed up clearly in hashprice — the daily revenue earned per unit of hashrate.
According to the report, hashprice fell to an all-time low near $35 per PH per day in November and remained weak into year-end. It finished the quarter near $38, well below historical averages.
This left little room for operational error.
Shutdown Prices Turn Price Levels Into Economic Triggers
These findings align closely with recent data on miner shutdown prices.
Sponsored
Sponsored
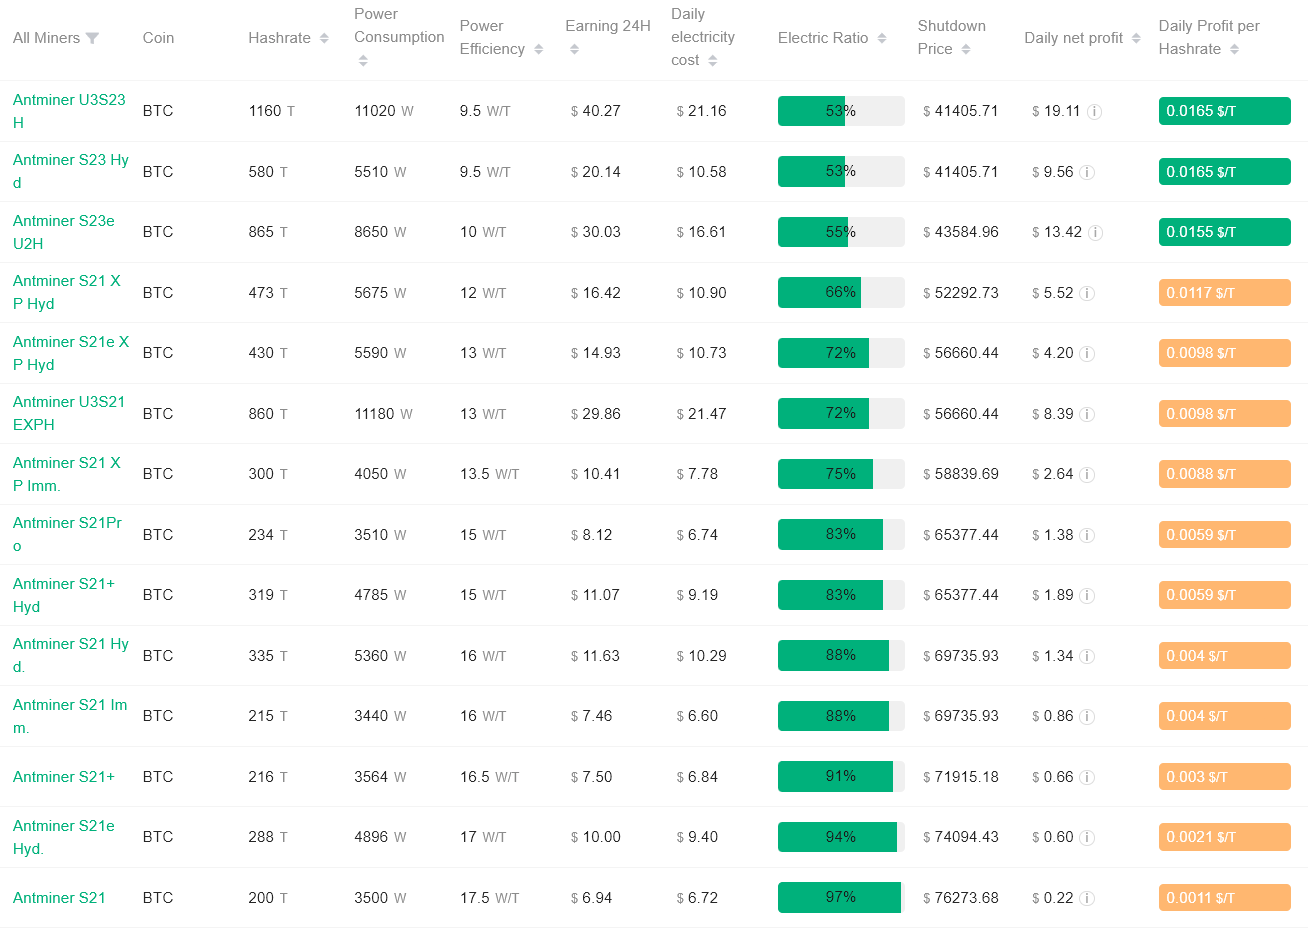
At current difficulty and electricity costs near $0.08 per kWh, widely used S21-series miners approach breakeven between $69,000 and $74,000 per BTC. Below that range, many operations stop generating operational profit.
More efficient, high-end machines remain viable at much lower prices. But mid-tier miners face immediate pressure.
Why This Matters for Bitcoin Price Now
This does not create a price floor. Markets can trade below mining breakeven.
However, it creates a behavioral threshold. If Bitcoin stays below key shutdown levels, weaker miners may sell reserves, shut down equipment, or reduce exposure.
In a market already strained by tight liquidity, those actions can amplify volatility.
Bitcoin mining is stronger and more industrial than ever. But that scale comes with sensitivity. As hashrate grows and fees fade, price matters more, not less, for miner stability.
That makes levels like $70,000 economically meaningful — not because charts say so, but because the network’s cost structure does.

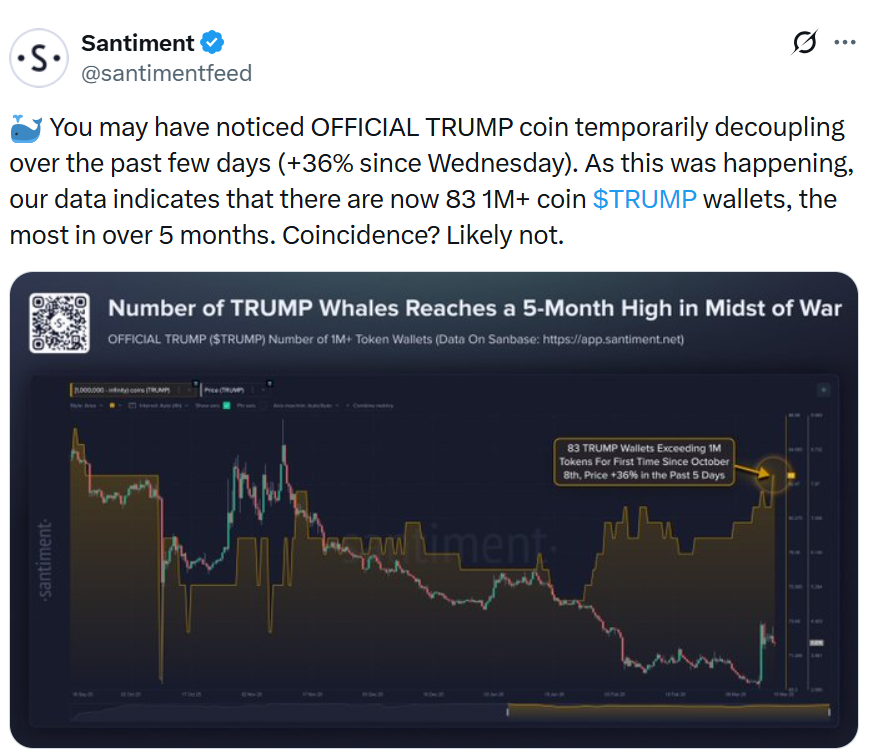
The number of whale wallets holding more than one million of US President Donald Trump’s memecoin has surged to a five-month high after announcing a luncheon at his Florida home for top holders last week.
There are now 83 wallets holding more than 1 million TRUMP (TRUMP) (equating to $3.7 million), making it the highest showing for the memecoin since Oct. 8 last year, Santiment said in an X post on Monday.
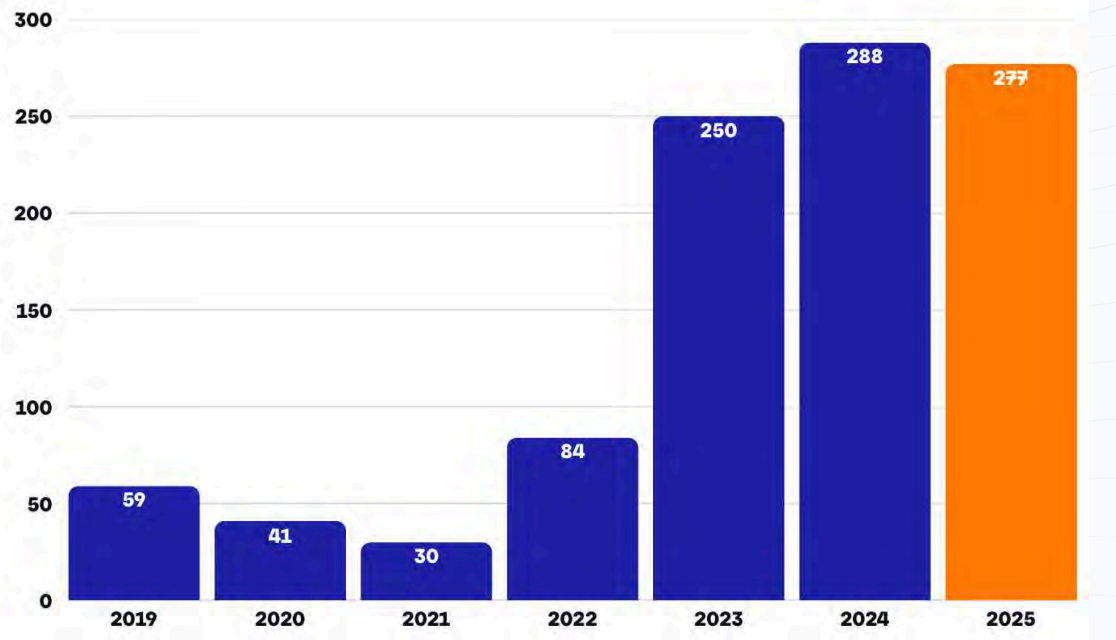
The luncheon with Trump is set for April 25 at his Mar-a-Lago residence in Florida, according to the Trump team. The top 297 token holders are invited, with the top 29 eligible for a private reception with the president, subject to passing background checks.
In the days following the luncheon announcement, TRUMP rose by more than 50% to hit a peak of $4.35. As of Wednesday, TRUMP is up 27% over the last seven days and trading at $3.71.

Dominick John, an analyst with Zeus Research, told Cointelegraph the Mar-a-Lago event, which offers access to the US president, is acting as a powerful catalyst for accumulation.
Crypto data analytics platform CoinCarp lists 642,882 TRUMP holders, with over 91% of the supply concentrated among the top 10 and over 97% among the top 100. At the first event for TRUMP token holders last year, Tron founder Justin Sun was the largest tokenholder.

John also points to other guests, such as Tether CEO Paolo Ardoino, who is scheduled to speak and attend the luncheon, as potential drivers of user interest.
“Momentum is driven by narrative-led flows and whale positioning,” he said.
“The presence of Paolo Ardoino from Tether at this event hints at potential ecosystem announcements, providing a real catalyst. His appearance could transform the gala into a progress showcase for the TRUMP token,” John added.
TRUMP spiked in lead up to last year’s gala
Trump held his first “crypto gala” dinner last year in May 2025, a few months after his Jan. 20 inauguration as US president.
It was limited to the top 220 TRUMP token holders and included crypto executives such as Hyperithm CEO Sangrok Oh, as well as anonymous and pseudonymous crypto traders like Cryptoo Bear, and sports stars like NBA champion Lamar Odom.
The event’s announcement a month earlier, on April 23, saw the token peak at $15.59 on April 25. However, the token began to gradually fall from that point. It fell to $14.51 on May 22, the day of the dinner, then gradually dropped to $12.46 a week later and $8.90 a month later.
John said it’s likely the coin would follow a similar trajectory after the upcoming luncheon concludes in April.
“Historically, Trump events show an announcement-driven hype phase followed by a gradual post-event downtrend. This event will follow a similar trajectory, unless new developments are unveiled around this event.”
US lawmakers look to limit memecoin profits by politicians
US senators and former staffers protested outside the event last year, while Democratic lawmakers have also introduced bills to limit political influence and profits from memecoins.
Related: SEC will consider most crypto assets not securities under federal law
The Modern Emoluments and Malfeasance Enforcement (MEME) Act was introduced in February 2025 to prevent federal officials from using their positions to profit from memecoins. It’s currently in the Committee stage and hasn’t progressed to a vote in either the House or Senate.
Meanwhile, the Stop Presidential Profiteering from Digital Assets Act aims to make it illegal for federal officials to issue, promote, or sell digital assets, such as memecoins. The similar Curbing Officials’ Income and Nondisclosure (COIN) Act has also failed to advance since its introduction last year.
Magazine: Clarity Act risks repeat of Europe’s mistakes, crypto lawyer warns

For years, decentralized finance has promised a future where anyone can access powerful financial tools without intermediaries. But let’s be honest—actually using DeFi still feels like piloting a spaceship with a blindfold on.
Multiple tabs. Endless approvals. Slippage anxiety. Gas fees lurking like jump scares.
Now imagine this instead:
“Swap my ETH for the best possible yield strategy with low risk.”
And… that’s it.
No charts. No routing decisions. No manual execution.
Welcome to the world of Intent-Based DeFi—where you define what you want, and the protocol figures out how to get it done.
What Is Intent-Based DeFi?
Intent-Based DeFi flips the traditional model on its head.
Instead of manually executing transactions step-by-step, users simply declare their intent—a desired outcome. Behind the scenes, a network of solvers, bots, or protocols competes to fulfill that intent in the most efficient way possible.
Think of it like this:
-
Old DeFi: You drive the car (and probably crash a few times)
-
Intent-Based DeFi: You set the destination, and an expert driver handles the route
How It Works (Without the Headache)
At its core, intent-based systems rely on three key components:
1. User Intent
You specify a goal:
-
“Swap 1 ETH to USDC at the best rate.”
-
“Earn yield with minimal impermanent loss.”
-
“Bridge funds to another chain cheaply and fast.”
2. Solvers (Execution Engines)
These are sophisticated actors—bots, market makers, or protocols—that compete to fulfill your request.
They:
-
Search across liquidity sources
-
Optimize routing
-
Minimize fees and slippage
-
Bundle transactions efficiently
3. Settlement Layer
Once the best solution is found, the transaction is executed trustlessly on-chain.
You get the result. No micromanagement required.
Why This Is a Big Deal
Let’s not sugarcoat it—manual DeFi is inefficient.
Intent-based systems fix some of the biggest pain points:
🧠 Less Complexity
No more juggling between DEXs, bridges, and yield farms.
⚡ Better Execution
Solvers optimize trades better than most humans ever could.
💸 Lower Costs
Bundled execution reduces gas fees and slippage.
🔒 Reduced Risk
Fewer manual steps = fewer chances to mess up (we’ve all been there).
Real-World Use Cases
This isn’t just theory—it’s already happening.
🔄 Smart Swaps
Instead of choosing between Uniswap, Curve, or aggregators, you simply request the best swap—and let the system handle routing.
🌉 Cross-Chain Transactions
Say goodbye to manually bridging assets. Just specify where you want your funds, and the protocol handles the journey.
📈 Automated Yield Strategies
Users can express goals like:
“Maximize yield on stablecoins with low volatility”
The system allocates funds dynamically across strategies.
The Hidden Power: MEV Optimization
Intent-based DeFi also has a surprising advantage—it can reduce the damage from MEV (Maximal Extractable Value).
Instead of exposing your transaction to bots that exploit it, solvers compete to give you the best outcome. That flips MEV from a tax into a potential benefit.
In other words:
The predators become service providers.
Challenges (Because Nothing Is Perfect)
Before we declare the death of manual trading, there are still hurdles:
⚠️ Trust in Solvers
Even with decentralized systems, users rely on third parties to execute intents correctly.
🔍 Transparency
Complex routing and execution can feel like a black box.
🧩 Standardization
Different protocols are building their own intent systems—interoperability is still evolving.
So… Is Manual Trading Dead?
Not quite.
Power users, arbitrageurs, and degens who love tweaking every parameter will still want full control.
But for the vast majority?
Manual trading is starting to look like:
-
Dial-up internet
-
Flip phones
-
Or sending faxes in 2026
Intent-based DeFi isn’t just an upgrade—it’s a paradigm shift.
Final Thoughts
The real promise of DeFi was never about complexity—it was about access.
Intent-based systems bring us closer to that vision by abstracting away the technical friction and letting users focus on outcomes, not processes.
Soon, interacting with DeFi might feel less like coding…
and more like making a request.
“Grow my portfolio safely.”
And the system simply replies:
“Done.”
REQUEST AN ARTICLE

Meta Platforms will shut down its Horizon Worlds metaverse for virtual reality users in June, pivoting to a mobile-only experience as it retreats from the aggressive metaverse push it championed just five years ago.
Consumers will no longer be able to build, publish, or update virtual reality worlds, or access the Horizon Worlds metaverse on Meta Quest headsets, from June 15, the company said in a Tuesday blog post.
Horizon Worlds launched in late 2021 as a VR-only, online multiplayer platform where users can build and publish virtual environments and games, and interact with others as avatars.

However, Meta reportedly started to experiment with Horizon Worlds as a mobile platform in 2025, according to Samantha Ryan, the VP of content at Reality Labs, who said in February it would be “shifting the focus of Worlds to be almost exclusively mobile.”
Horizon Worlds’ competitors, such as Fortnite and Roblox, which attract 1.3 million and 144 million daily active users, respectively, operate on PC, console, and mobile platforms. Fortnite has never officially developed its game for VR, while Roblox has offered a VR app since July 2023, though not all worlds are VR-compatible.
Meta’s decision to refocus Horizon Worlds comes just five years after Meta CEO Mark Zuckerberg pivoted the company towards the metaverse, even changing its name from Facebook to Meta. Those ambitions, however, have not translated into profits for the firm.
Reality Labs racks up $80 billion in losses since 2020
Meta’s Reality Labs division racked up a record $6 billion in losses for the fourth quarter of 2025, and cumulative losses for its metaverse division total almost $80 billion since 2020.
In January, Meta eliminated 1,000 jobs from Reality Labs while shuttering some of its virtual-reality game and content studios.
At the time, Reality Labs chief technology officer Andrew Bosworth said the company would primarily focus on mobile experiences instead of fully immersive virtual worlds accessed via headsets.
Related: Big Tech signs Trump pledge to cover their own AI energy costs
Meanwhile, Meta stock jumped 3% on Monday following a speculative Reuters report on Friday claiming that the company is “planning sweeping layoffs” that could affect 20% or more of its workforce. The move would reportedly offset spending on AI infrastructure and augmented-reality wearables.
A Meta spokesperson told CNBC that this was a “speculative report about theoretical approaches.”
It would, however, play into a broader trend of tech firms axing staff to focus on AI.
Metaverse tokens have melted
The blockchain-based metaverse was once also a talking point in the crypto industry in 2021, but has since faded into obscurity along with many other trends that have been eclipsed by the latest AI hype.
Major blockchain-based players such as Axie Infinity (AXS), The Sandbox (SAND), and Decentraland (MANA) have all seen their respective tokens tank between 98% and 99% from their all-time highs in November 2021, according to CoinGecko.
Magazine: Human brain cell wetware plays Doom, fly’s mind uploaded: AI Eye

Crypto lobby group Coin Center has urged the US Securities and Exchange Commission to stop addressing individual crypto cases reactively and instead start setting clear rules.
“Individualized relief can provide short-term clarity, but it risks fragmentation, implicit merit regulation, and uneven treatment across projects,” Coin Center said in a letter to the SEC, urging the regulator to “prioritize rulemaking wherever possible.”
“The true value of crypto networks lies in their character as utility-like public goods rather than as services operated by private corporations or associations,” the letter read.
The letter, which was made public on Tuesday, was dated March 5.

Since then, the SEC has released a notice that interprets how “non-security crypto assets” fall under federal securities laws and provides a “coherent token taxonomy for digital commodities, digital collectibles, digital tools, stablecoins, and digital securities.”
The SEC and CFTC also signed a memorandum of understanding on Mar. 12 to better coordinate oversight of the financial markets, ending decades of “regulatory turf wars” between them.
Selective relief creates an unfair environment: Coin Center
Crypto-focused no-action letters have continued to trickle in, with the latest being a no-action letter addressed to crypto wallet provider Phantom Technologies by the Commodity Futures and Trading Commission’s Market Participants Division.
The CFTC notice, which was shared on Tuesday, said that the no-action letter would, under certain circumstances, stop the division from recommending that the regulator take an enforcement action against Phantom or its staff for failure to register as a broker.
The past few months have also seen the SEC hand out two no-action letters to decentralized physical infrastructure network (DePIN) crypto projects.
In late September, the SEC also issued a no-action letter that cleared the way for investment advisers to use state trust companies as crypto custodians.
However, Coin Center argued that relying on these case-by-case rulings creates uncertainty for the wider crypto market.
“If relief is granted selectively, the regulator inevitably puts its thumb on the scale in favor of networks or intermediaries that have the resources and incentives to pursue it,” it said.
Related: SEC will consider most crypto assets not securities under federal law
Meanwhile, US lawmakers are approaching the problem their own way.
The CLARITY Act, which aims to provide clearer regulatory oversight for the crypto industry, is moving through Congress.
The bill, if passed, would give the SEC and CFTC clearer guidance on which digital assets fall under their jurisdiction, helping reduce ambiguity and ensure more consistent treatment across the crypto industry.
Magazine: All 21 million Bitcoin is at risk from quantum computers

Washington, DC — The regulatory landscape for digital assets continues to evolve as policymakers explore a regulatory runway intended to unlock capital for crypto ventures while preserving investor protections. In remarks at a crypto lobby event, SEC Chair Paul Atkins laid out a concrete concept: a safe harbor framework built around three pillars designed to give crypto issuers a bespoke path through the U.S. regulatory maze. The agenda arrives as the agency and the Commodity Futures Trading Commission simultaneously issued interpretive guidance aimed at clarifying when crypto assets are securities and how non-security tokens could fall under securities laws. The moment underscores a shift from diagnostic debates to concrete regulatory mechanisms that could shape how projects fund themselves in the near term.
Our interpretation on crypto assets—grounded in existing law and informed by extensive public input—acknowledges what the former administration refused to recognize…
Most crypto assets are not themselves securities.
— Paul Atkins (@SECPaulSAtkins) March 17, 2026
Key takeaways
- The core proposal centers on a “safe harbor” that comprises a startup exemption, a fundraising exemption, and an investment contract safe harbor, aiming to provide a tailored regulatory runway for crypto projects to mature without surrendering investor protections.
- A startup exemption would permit crypto firms to raise a defined amount or operate for a set period, granting regulatory latitude to reach maturity while maintaining guardrails.
- The fundraising exemption would allow investment contracts involving crypto to raise capital up to a defined threshold within a 12-month window while remaining exempt from certain registration requirements under securities laws.
- The investment contract safe harbor would offer issuers and buyers clarity about when a given asset falls under securities laws, with conditions tied to the issuer’s ongoing commitments and the asset’s lifecycle.
- The idea relies on a trigger related to “permanently ceased all essential managerial efforts” behind an asset, signaling when protections and securities obligations would apply or end.
Market context: The discussion comes amid broader regulatory debates about how to harmonize investor protection with crypto innovation, all while lawmakers weigh market-structure legislation. As talks on a comprehensive framework progress, the industry watches how these proposed exemptions could interact with enforcement policies and evolving guidance on token classifications.
Why it matters
The proposal signals a potential shift toward regulatory clarity that could reduce ambiguity for issuers and investors alike. By outlining concrete exemptions, the plan aims to supply a predictable pathway for raising capital in the United States, which could encourage domestic projects to scale without provoking unintended securities-law exposure. For crypto builders, a defined startup timeline or a capped fundraising window could translate into more confident planning and strategic fundraising rounds, potentially accelerating product development and deployment.
However, the approach also raises questions about what constitutes sufficient “managerial effort” and how the safeguards would be enforced as projects evolve. Critics may worry that a patchwork of exemptions could create inconsistent standards across token types or trigger uneven treatment for similar offerings. The balance hinges on careful calibration of thresholds and sunset provisions that preserve investor protections while preventing regulatory uncertainty from stifling innovation.
From a broader perspective, the move illustrates regulators’ intent to move beyond abstract classification toward actionable scaffolding. The adoption of a safe harbor framework could influence how other jurisdictions view crypto fundraising, potentially shaping international comparability and cross-border fundraising strategies. As the public comment process unfolds, market participants will be watching for details on eligibility, disclosure requirements, and how the exemptions would interface with existing exemptions or exemptions under state law.
What to watch next
- Proposed rules for the exemptions are expected to be released for public comment in the coming weeks, providing a concrete blueprint to assess implementation challenges.
- Congress continues negotiations around market-structure legislation; observers will monitor whether the Clarity Act or related bills advance, given the current stall in the Senate.
- Regulators may issue additional guidance clarifying the boundaries between securities and non-securities in practice, potentially refining the scope of the safe harbor framework as real-world applications emerge.
- Industry groups and lawmakers will assess how the safe harbor interacts with enforcement actions, investor protections, and international regulatory developments that could affect competitiveness and innovation.
Sources & verification
- Paul Atkins, remarks at a Washington, DC crypto lobby event and the proposed three-part safe harbor framework: https://www.sec.gov/newsroom/speeches-statements/atkins-remarks-regulation-crypto-assets-031726
- Joint SEC-CFTC interpretation on crypto assets not securities: https://cointelegraph.com/news/sec-interpretation-crypto-assets-not-securities
- Clarity Act and related legislative context referenced by industry coverage: https://cointelegraph.com/news/clarity-act-crypto-united-states-congress-galaxy-digital
- Industry context on evolving crypto regulation and 2025 changes: https://magazine.cointelegraph.com/how-crypto-laws-changed-2025-further-2026/
- Public stance and timing noted in the accompanying tweet: https://twitter.com/SECPaulSAtkins/status/2034012012460556526?ref_src=twsrc%5Etfw
Regulatory safe harbors and the path forward for crypto exemptions
The conversations surrounding a safe harbor framework crystallize a broader theme in U.S. regulatory policy: the desire to foster a constructive environment where startups can raise capital without facing indefinite regulatory ambiguity, while ensuring that investors are adequately protected from risk. Atkins framed the proposed exemptions as a way to tailor regulation to the realities of crypto markets, acknowledging the need for bespoke pathways in an industry with unique funding dynamics and rapid product lifecycles.
The startup exemption envisions a defined early phase during which projects can attract capital or operate with a clear regulatory runway, offering a predictable timeline as teams build products, recruit communities, and develop governance mechanisms. The fundraising exemption would target investment contracts that involve crypto—allowing issuers to raise up to a specified amount within a year without triggering full securities registration. The investment contract safe harbor, meanwhile, would articulate a threshold beyond which token issuers and buyers would be subject to securities laws, potentially offering certainty about when protections apply as the asset matures or as project commitments change.
Crucially, Atkins emphasized that the safe harbor would be triggered by a specific condition: when an issuer has “permanently ceased all essential managerial efforts” promised for the asset. This condition is intended to prevent perpetual ambiguity around the status of a token and to provide a clear point at which securities obligations become applicable. The approach seeks to balance entrepreneurial flexibility with the safeguards designed to protect investors in complex, evolving markets.
In parallel, regulators clarified that most crypto assets are not themselves securities, while still outlining circumstances under which securities rules may apply to non-security assets. The interpretive action reflects an attempt to harmonize traditional securities law with the realities of a diverse digital-asset landscape, where token models range from payments rails to governance tokens and beyond. Industry observers note that the framework could affect fundraising strategies, disclosure practices, and how projects structure token distributions. The designation of a safe harbor would be a practical step toward reducing regulatory friction for compliant offerings, even as broader questions about market structure, transparency, and enforcement persist.
As the public comment period looms, the crypto sector will be watching for precise definitions, numerical thresholds, and procedural steps that will determine how readily these exemptions can be deployed. While the regulatory impulse is to create a more navigable route for compliant issuances, the ultimate success of such a framework will hinge on its ability to scale with innovation, deter fraud or misrepresentation, and mesh with international standards. The interplay between this proposed framework and ongoing legislative efforts—such as the stalled Clarity Act—will matter for how quickly and comprehensively the U.S. market can align with evolving global norms.


Opinion by: Leo Fan, founder of Cysic
Decentralized compute has failed. Not because it can’t find you a cheap GPU; it’s actually quite good at that. The problem is that every major network today still forces you to trust the node operator with your data and results.
We have replaced Amazon’s login page with a wallet connection and called it Web3.
A staggering $2 billion to $3 billion was poured into “decentralized cloud” tokens from 2023 to 2025. Yet none of the top players can give a smart contract mathematical certainty that the work was done correctly. Zero-knowledge rollups, onchain AI agents and fully trustless apps remain impossible at scale.
The entire sector has decentralized supply and payments. Trust is still centralized. Until verification is cryptographic, “decentralized compute” is just Airbnb for GPUs.
The marketplace mirage
Current leaders are sophisticated spot markets, nothing more. Akash pulled in about $11 million in Q3 2025 revenue. Render managed about $18 million. Impressive for coordination layers, sure, but trivial next to AWS’s $100 billion-plus annual run rate.
These networks solved the easy part, idle GPU discovery and crypto payments, and declared victory. Their proof-of-work done? Usually, just “the node streamed the result plus some reputation score.”
That’s not verification. That’s a pinky promise with extra steps.
Real-world failures are already happening. In 2025, bad actors returned corrupted Blender renders through Render’s network. No onchain way to detect it. Io.net caught a Sybil cluster gaming reputation scores in May and further failures in November with aPriori’s mysterious Sybil cluster that claimed 60% of the airdrop across 14,000 wallets. Gensyn’s own whitepaper admits their “learning game” tolerates less than 49% malicious tolerance in practice.
These are the predictable outcomes when you replace mathematical proofs with social enforcement.
Think about what this means for actual use cases. A Layer 2 rollup outsourcing STARK proofs to any current decloud still needs a trusted multisig or single honest prover. The centralization risk remains unchanged. An autonomous agent doing inference on io.net? The on-chain contract can’t tell if the LLM output was correct or backdoored. We’ve recreated the oracle problem with more steps.
Breaking Web3’s core promise
Bitcoin never asked you to trust miners. Ethereum doesn’t require faith in validators. They gave you ways to verify. Today’s compute networks do the opposite:
“Here’s your result. Trust me, bro, and we’ll slash if someone complains.”
This philosophical mismatch kills the entire value proposition. The Total Addressable Market (TAM) for “decentralized GPU” gets capped at rendering and basic training because nobody will run sensitive workloads on networks where nodes see your plaintext data, such as DeFi bots, medical inference, and proprietary models.
Vitalik nailed it at Devcon 2024:
“If your scaling solution reintroduces trusted parties, you haven’t scaled. You’ve just outsourced.”
That’s exactly what we’ve done. We outsourced AWS to a thousand smaller AWS nodes and patted ourselves on the back.
The market size illusion becomes clear when you do the math. Without verifiable execution, you can’t serve. Financial institutions need provable compliance. Healthcare systems require an auditable inference. Rollups demand trustless proof generation. AI agents must execute high-value transactions.
Related: Institutions must stake Ether on decentralized infrastructure
You’re left competing for Stable Diffusion hobbyists and Blender farms. Good luck building a trillion-dollar market on that.
The only path forward
Real decentralized compute requires cryptographic proof accompanying every result, including zkSNARKs, STARKs or optimistic fraud proofs, that are verifiable in under a second by any smart contract.
This isn’t theoretical anymore. Hardware-accelerated proving stacks using FPGAs and custom ASICs make this economically viable at GPU-scale bandwidth. The 2024-2025 ZPrize winners showed STARKs over cycle-accurate circuits running in under eight seconds on the latest FPGA clusters, heading toward sub-second on next-gen silicon.
When this verification layer exists, everything changes. A $10,000 DeFi agent can run private AlphaTensor-level reasoning onchain. Rollups can outsource proofs to 10,000 untrusted nodes with zero risk. Inference becomes as trustless as checking an Ethereum balance.
Open, permissionless networks of specialized provers will compete on latency and cost. But the key difference is that dishonesty becomes mathematically impossible, not just expensive. No reputation systems. No slashing games. Just math.
The real revolution
We didn’t decentralize compute by turning GPUs into an open market. That’s like saying we decentralized money by letting people trade dollars on DEXs.
We’ll deserve the name when computational results become as unforgeable as Bitcoin transactions are unspendable without the private key. It’s impossible to fake, trivial to check.
The breakthrough Web3 needs isn’t another 5% cheaper GPU hour. It’s the first network that can attach an unbreakable proof of correctness to every teraflop. That’s the infrastructure we were promised. Everything else is just a centralized cloud with extra steps.
Opinion by: Leo Fan, founder of Cysic
This opinion article presents the author’s expert view, and it may not reflect the views of Cointelegraph.com. This content has undergone editorial review to ensure clarity and relevance. Cointelegraph remains committed to transparent reporting and upholding the highest standards of journalism. Readers are encouraged to conduct their own research before taking any actions related to the company.

Five Vietnamese companies are reportedly competing to launch the country’s first licensed crypto exchanges as authorities move to bring trading onshore and ban overseas platforms.
Five companies have passed an initial qualification round, Reuters reported on Tuesday, citing a March 12 finance ministry document. The group reportedly includes affiliates of private banks Techcombank, VPBank and LPBank, alongside stockbroker VIX Securities and conglomerate Sun Group. VPBank and Sun Group reportedly confirmed their licence applications to Reuters.
Vietnam opened applications for licenses to operate crypto exchanges in January. The move came after new procedures issued by the finance ministry and a law that, for the first time, defines crypto assets as property while still banning their use as legal tender or for payments.
Vietnam has emerged as a major hub for crypto trading, ranking fourth globally in Chainalysis’ latest Global Crypto Adoption Index with $200 billion in estimated transactions over the 12 months to June. However, despite the significant activity, most traders still rely on offshore exchanges such as Binance, OKX and Bybit to access the market.
Related: Crypto’s real boom is happening in Argentina, Nigeria, and the Philippines
Vietnam to ban overseas crypto platforms
Authorities are also reportedly drafting rules that could prohibit Vietnamese nationals from using overseas platforms. According to Reuters, officials have raised concerns about the growing use of crypto and stablecoins, particularly in relation to capital moving out of the country.
In September 2025, Vietnam launched a five-year crypto pilot with strict rules requiring all transactions to be conducted in Vietnamese dong and limiting issuance to locally registered companies. The framework also bans fiat-backed assets like stablecoins, allowing only crypto backed by real, non-financial assets.

As a result of the strict entry conditions, including high capital requirements of around $379 million, the country’s Ministry of Finance said no companies had applied for its digital asset trading pilot by October.
Cointelegraph reached out to Techcombank, VPBank and LPBank, VIX Securities and Sun Group for comment, but had not received a response by publication.
Related: Vietnam central bank expects credit growth amid rapid crypto adoption
Vietnam to tax crypto similar to stocks
In February, Vietnam drafted a tax framework for crypto transactions that would treat digital assets similarly to securities trading. Under the proposal, individuals would pay a 0.1% tax on each crypto transaction processed through licensed providers, while such transfers would remain exempt from value-added tax.
For companies, the rules would differ, with institutional investors facing a 20% corporate income tax on profits from crypto trading after costs and expenses.
Magazine: Bitcoin may take 7 years to upgrade to post-quantum — BIP-360 co-author
Decentralized autonomous organizations (DAOs) were built on an ideological premise that is now running up against the realities of running a business, where decentralization collides with the need for legal ownership and control.
On March 11, DAO Across Protocol made a controversial proposal to transition to a private company through a token-to-equity exchange buyout. Risk Labs, the team behind Across (ACX), said that the token and DAO structure “materially” impacted its ability to close deals with enterprises and institutions.
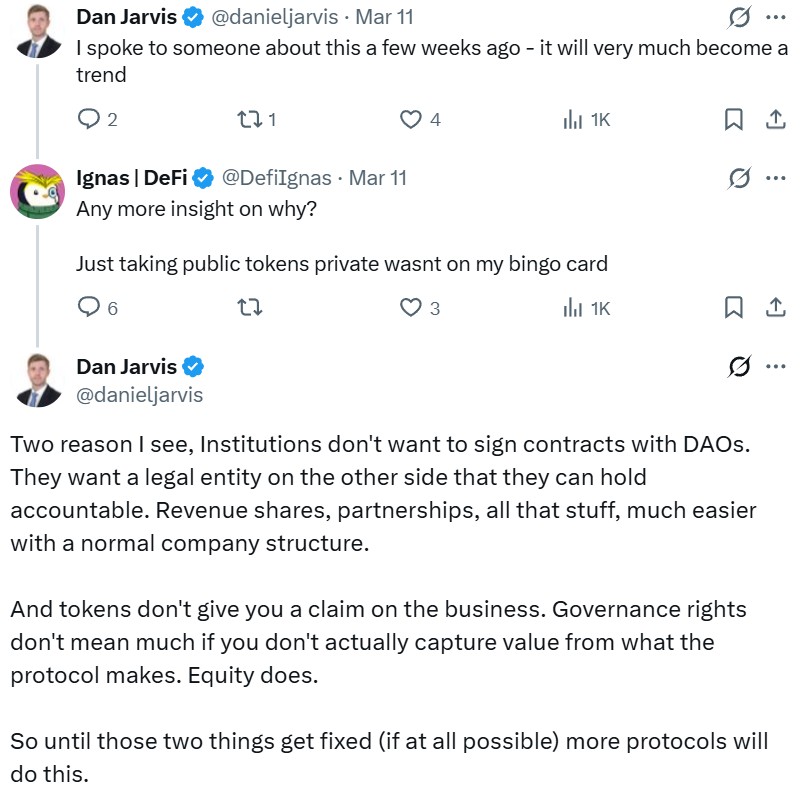
The industry reaction has been split. Decentralized finance (DeFi) researcher Ignas called it a “huge failure of crypto.”
“It feels like a betrayal of the crypto spirit: investment access for everyone, anywhere, globally,” Ignas said on X. “I hope other DAOs don’t follow them.”

The DAO structure is holding back Across’ stablecoin business
Crosschain Bridge Across Protocol currently operates under a token and DAO structure, with Risk Labs overseeing development through a foundation model.
Risk Labs’ proposal outlines a transition to a newly formed US C-corporation that would take over protocol development and commercialization. ACX holders could exchange their tokens for equity in the new entity or opt into a buyout.
“[DAOs] were supposed to replace the archaic organizational infrastructure that is marked by greed and a lack of trust,” Matthew Pinnock, founder of DeFi project Altura, told Cointelegraph.
“However, as the industry increasingly moves toward real-world assets and institutional capital, protocols are running into structural limitations. Institutions typically need a clear legal counterparty that can sign contracts and undergo due diligence, something a decentralized collective cannot easily provide,” Pinnock added.
Related: Perp DEXs become the latest battleground for blockchains
Across co-founder Hart Lambur said that in Across’ case, having a token “generally hurts more than it helps.”
“We launched the Across token very early, at a very low valuation, and with a very broad airdrop. We picked this strategy so that we could build value in public with our community,” Lambur said on X. “Today, the macro environment has changed. Tokens are undervalued and underappreciated.”

Across is positioned around stablecoin infrastructure, which partly explains its transition. The goal is to enable fund movements across stablecoins at parity, with fees absorbed by issuers or partners rather than end users. Lambur said that securing related agreements requires contracts and offchain payment arrangements that are not well suited to DAO structures.
ShapeShift dissolved its corporate entity to become a DAO
As protocols rethink DAO structures, ShapeShift offers a counterpoint. The crypto trading platform transitioned into a DAO in 2021, dissolving its corporate entity in favor of tokenholder governance.
Tim Black, product lead at ShapeShift DAO, said many teams adopted DAO structures during the last cycle as part of a broader narrative, without fully accounting for the operational complexity involved.
Related: Banks will run RWAs on two blockchain rails, says RedStone co-founder
“What Across is proposing is essentially admitting that. They’re saying the DAO experiment helped bootstrap the network, but a company structure is better suited to the next phase,” Black told Cointelegraph.
“Many teams quietly operate like companies already,” he added. “Shapeshift was innovative in using workstreams, mirroring departments, but they still create more friction than collaboration over time.”

Social media debates shifted toward tokenized equity as the way to go over the traditional corporate structure, with Ignas claiming that it would be progress for the industry. But Black thinks that says more about token designs than the concept, as many governance tokens already function as pseudo equity.
“The original idea behind governance tokens was coordination, not ownership… If they just become equity substitutes, then the experiment has basically collapsed back into the corporate model it was supposed to challenge,” he said.
Across’ corporate structure isn’t finalized
If transitions like Across’ become more common, the outcome may not be a single direction for DeFi, but a split in how protocols are structured and operated.
“One side becomes corporate crypto, protocols run like fintech companies with tokens functioning more like shares. The other side stays genuinely decentralized and accepts the operational friction that comes with that,” said Black.
That shift is already being shaped by the influx of institutional capital and RWAs, which impose requirements that DAO structures often struggle to meet.
“That is why we are seeing DAOs taking the regulatory black pill and dropping the D that made them decentralized autonomous organisations,” Pinnock said.
As protocols adapt, some are moving toward clearer legal frameworks and centralized execution layers, while others continue to prioritize open participation and community governance.
Though Across is eyeing a corporate structure, it still operates as a DAO today. It framed its proposal as a “temperature check” to signal that no final decision has been made. It still needs to pass a governance vote and get the blessing of its token holders.

Magazine: Metaplanet’s Japan Bitcoin bet, Bithumb ordered suspension: Asia Express
Key takeaways
-
Bitcoin’s price reflects short-term marginal buying and selling, while adoption reflects long-term structural shifts. Ownership expansion, institutional integration and merchant growth can accelerate even when the market price remains flat or declines.
-
In 2025, Bitcoin expanded significantly across institutions, banks, corporations, merchants and sovereign entities. These shifts represent deeper entrenchment within global financial systems, even as headline price performance appeared underwhelming.
-
Institutions accumulated substantial amounts of Bitcoin, but much of this demand was offset by distribution from long-term holders. As supply changes hands between cohorts, price may consolidate instead of surge.
-
Merchant adoption and Lightning Network expansion improve Bitcoin’s real-world functionality. However, widespread instant conversion to fiat limits sustained net buying pressure unless merchants retain the Bitcoin they receive.
The contrast between Bitcoin’s (BTC) market price and its network adoption has never been more stark. While the price chart has spent much of the past year well below its peak, the underlying data reveals a different reality. In 2025, Bitcoin witnessed a massive, quiet expansion across banks, corporations and sovereign states.
This paradox exists because short-term marginal price formation is often driven by speculative noise, whereas structural adoption is driven by long-term institutional entrenchment. Bitcoin’s fundamentals are compounding at record speed even when the ticker remains stagnant.
This article explores why Bitcoin’s structural adoption across institutions, advisors, corporations and merchants has accelerated even as price action underperforms. It explains how ownership transfer, small allocation sizes and macro liquidity can delay adoption’s impact on short-term price movements.
Bitcoin adoption and price track fundamentally distinct phenomena
When people refer to Bitcoin adoption, they are typically describing gradual, long-term structural shifts:
-
Who is accumulating and holding Bitcoin?
-
Which companies or platforms are launching Bitcoin-related products and services?
-
Who is beginning to accept it as payment?
-
Which institutions, corporations or even governments are incorporating it into their balance sheets or reserves?
These underlying changes evolve slowly, building incrementally over many months or years.
Price, by contrast, is determined at the margin in real time. It responds primarily to:
-
Immediate buyers and sellers in the market
-
Current liquidity dynamics
-
Leverage, futures and derivatives positioning
-
Broader macroeconomic sentiment and risk appetite
-
Supply being released or withheld by long-term holders
Strong adoption can steadily broaden the ownership base without necessarily driving prices higher. It can even coincide with flat or declining prices if distribution from seasoned holders matches incoming demand from newcomers. Ownership can shift between cohorts without triggering sharp repricing.
Did you know? As of March 15, 2026, more than 20 million Bitcoin had been mined out of a maximum total supply of 21 million, representing more than 95% of all BTC that will ever exist. The final Bitcoin is not expected to be mined until around 2140.
How expansion dynamics seem to be unfolding
While Bitcoin’s price action had been relatively weak as of March 2, 2026, adoption trends continued to show strength:
Institutions are accumulating at scale
In 2025, institutions reportedly accumulated roughly 829,000 Bitcoin across businesses, governments, funds and exchange-traded funds (ETFs). This was not a marginal change but a meaningful shift in ownership structure.
Importantly, institutional exposure represents millions of underlying individuals gaining access through brokerage accounts, retirement plans, sovereign wealth funds and corporate balance sheets.
Much of this demand was absorbed by distribution from long-term holders and early adopters. When early whales sell into deeper liquidity, the price does not necessarily surge. Instead, supply shifts from one cohort to another.
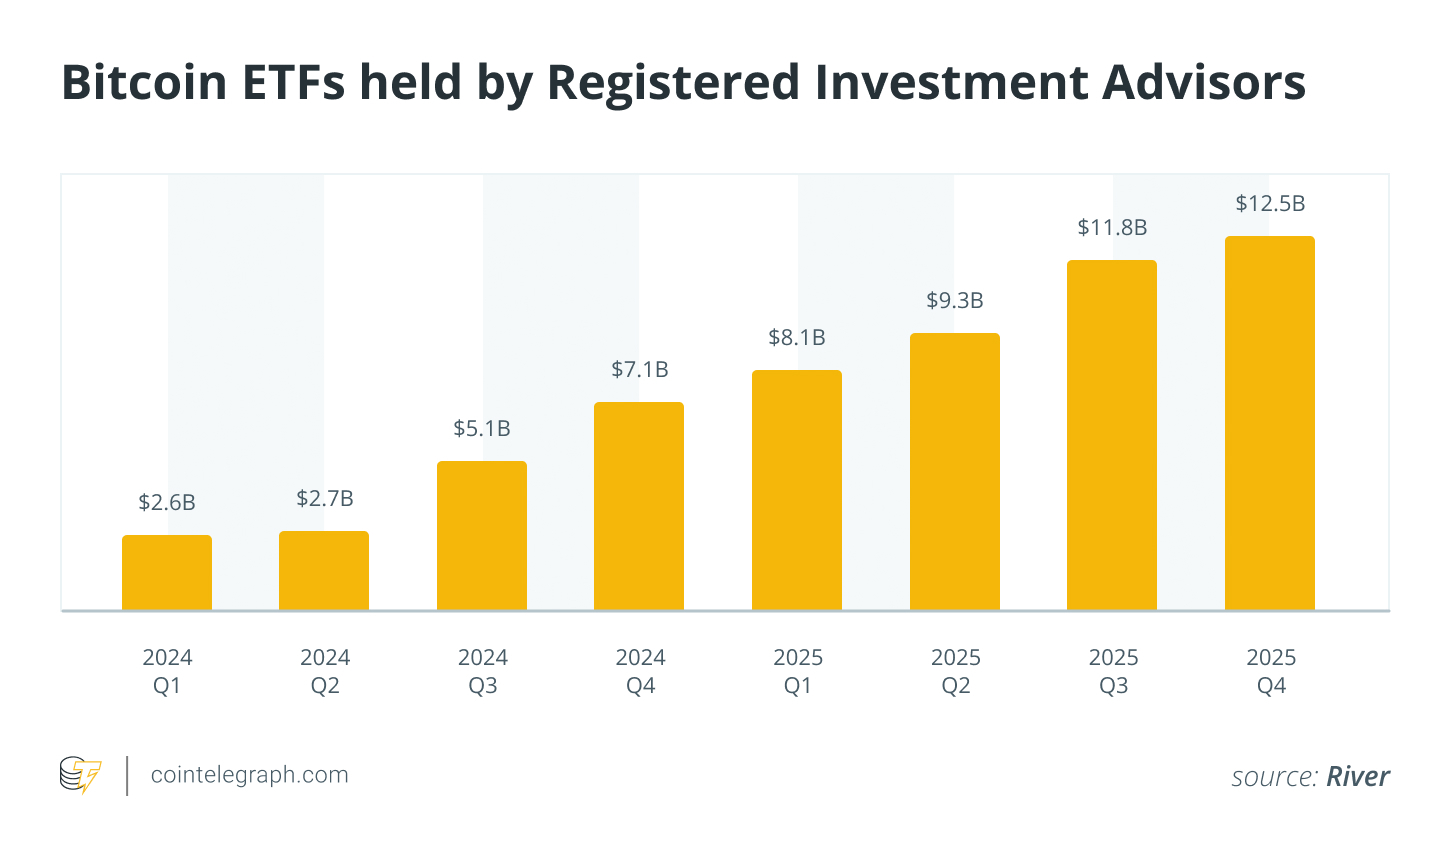
Investment advisors have been net buyers for eight consecutive quarters
Registered investment advisors (RIAs) oversee roughly $146 trillion in client assets globally. Since Bitcoin ETFs launched, RIAs have steadily allocated capital, reportedly around $1.5 billion per quarter, without a single net-selling quarter.
That consistency matters.
However, average allocations remain extremely small. Many advisors hold Bitcoin at just basis-point levels in diversified portfolios. Until allocations move from fractions of a percent toward 1% to 2% model weights, the price impact may remain gradual.
In other words, the pipeline is open, but the flow rate is still increasing.

Banks are once again developing Bitcoin-related products
A growing share of major US banks are actively developing Bitcoin custody, trading, advisory and related services. Improved regulatory clarity compared with previous years has reduced institutional reluctance and opened the door to broader participation.
This growing involvement from traditional banks marks a key step toward normalization. Bitcoin is evolving from a speculative, peripheral asset into one that is increasingly embedded within mainstream financial systems and infrastructure.
That said, building products is not the same as achieving widespread availability. Initial launches often target ultra-high-net-worth individuals, institutional clients or remain in limited pilot phases. Rolling out full retail access requires significant time, compliance and operational scaling.
Ultimately, this infrastructure serves as a foundational enabler of future adoption rather than an immediate trigger for rapid market shifts.
Corporate Bitcoin adoption and the weight it brings
Corporate accumulation of Bitcoin can influence the market in several ways:
-
It steadily removes Bitcoin from liquid, circulating supply.
-
It demonstrates high-conviction, treasury-level endorsement from established businesses.
-
It fosters peer benchmarking, encouraging more companies to follow suit.
However, a large portion of these purchases occurs over-the-counter (OTC) or through carefully structured, gradual accumulation programs designed to avoid disrupting spot markets. This measured approach means corporate buying often reshapes long-term ownership patterns far more than it drives short-term explosive price action.
In short, corporate buying may influence long-term ownership patterns more than short-term price action.
Did you know? Bitcoin mining now consumes less energy than many traditional industries, including gold mining and the global banking system, according to several comparative energy studies.
Surge in merchant adoption of Bitcoin
Merchant acceptance of Bitcoin expanded rapidly in 2025. In November 2025, the Bitcoin Lightning Network reached a record $1.17 billion in volume. This suggests that the network is no longer used only for experimental “coffee” payments, but has also become a layer for high-value institutional settlements.
For merchants, Bitcoin offers clear operational advantages, including:
-
Drastically lower processing fees compared with traditional card networks
-
Elimination or near-elimination of chargeback risk
-
Smoother, cheaper cross-border settlements
A large majority of merchants still opt for instant conversion of received Bitcoin payments into fiat currency through payment processors. As a result, incoming transaction volume does not reliably translate into sustained net buying pressure on Bitcoin itself.
Payments adoption meaningfully enhances Bitcoin’s real-world utility. However, utility alone does not generate lasting scarcity or upward price pressure unless merchants choose to hold the BTC they receive.
Bitcoin adoption by countries continues to grow
Throughout 2025, Bitcoin’s role as a strategic reserve asset expanded significantly as five more countries added it to their reserves. This wave of adoption spanned diverse regions and financial structures, including sovereign wealth funds in Saudi Arabia and Luxembourg, the Czech Republic’s central bank and direct acquisitions by Taiwan and Brazil.
Government involvement in Bitcoin adoption carries significance for several reasons. Countries operate on multidecade time horizons rather than quarterly earnings cycles. They typically adopt strategic, long-term holding policies rather than short-term trading. Adoption by sovereign entities confers powerful legitimacy on any asset class, signaling to markets, institutions and the public that Bitcoin is becoming part of mainstream financial frameworks.
Did you know? Lost Bitcoin is estimated to total several million coins, permanently reducing the effective circulating supply and increasing long-term scarcity.
Bitcoin’s volatility continues to decline
One of the most underappreciated indicators of maturing adoption is Bitcoin’s steadily declining volatility. Over the past decade, Bitcoin’s annualized volatility has fallen. Successive market cycles have produced progressively narrower percentage drawdowns and rallies compared with the extreme swings seen in earlier bull and bear phases.
This structural decline in volatility reflects several reinforcing developments:
-
Markedly deeper and more resilient market liquidity
-
More diversified distribution of ownership across holder cohorts
-
Growing institutional and professional participation
-
More sophisticated, liquid derivatives markets (futures, options and perpetuals) that help absorb shocks
Bitcoin’s volatility profile now increasingly resembles that of established asset classes such as stocks, commodities and foreign exchange. This aligns with the preferences of conservative capital allocators, including pension funds, endowments and risk-averse institutions.

Why hasn’t Bitcoin price reacted more aggressively?
While institutional and sovereign adoption increased in 2025, the market’s immediate price action remained muted. This quiet accumulation phase suggests that the true impact of large capital inflows was masked by macroeconomic headwinds.
-
Ownership transfer absorbs demand: When long-term Bitcoin holders distribute into institutional demand, the market can absorb large volumes without sharp upward price moves. Supply simply changes hands as adoption grows and price consolidates.
-
Adoption widens the base, not the margin: Marginal buyers and sellers play a key role in setting the price of cryptocurrencies. Structural adoption broadens the ownership base but does not always shift the aggressive marginal bid right away. Until fresh demand exceeds available supply, price can remain range-bound.
-
Allocation sizes remain small: Many institutions and advisors now allocate to Bitcoin, but at very modest weights. If that changes, marginal demand could increase.
-
Macro liquidity matters: Bitcoin exists within a broader macro environment. Factors shaping capital flows include liquidity conditions, interest rate expectations and global risk appetite. Greater Bitcoin adoption does not mean it is insulated from macro cycles.
Cointelegraph maintains full editorial independence. The selection, commissioning and publication of Features and Magazine content are not influenced by advertisers, partners or commercial relationships.
Bitcoin mining firm Cango Inc. reported a net loss of $285 million in the fourth quarter of 2025, as impairment charges, fair-value losses and higher mining costs outweighed revenue from its expanding Bitcoin mining business.
In its earnings report published Monday, Cango said fourth-quarter revenue reached $179.5 million, including $172.4 million from Bitcoin mining, while total operating costs and expenses rose to $456.0 million.
The losses were driven in part by an $81.4 million impairment on mining machines and a $171.4 million loss tied to changes in the fair value of Bitcoin (BTC)-collateralized receivables. The company also reported higher production costs, with all-in mining expenses rising to $106,251 per BTC in the quarter.
The results show how revenue growth from mining was offset by impairment charges, mark-to-market adjustments and higher production costs as the company scaled the business.

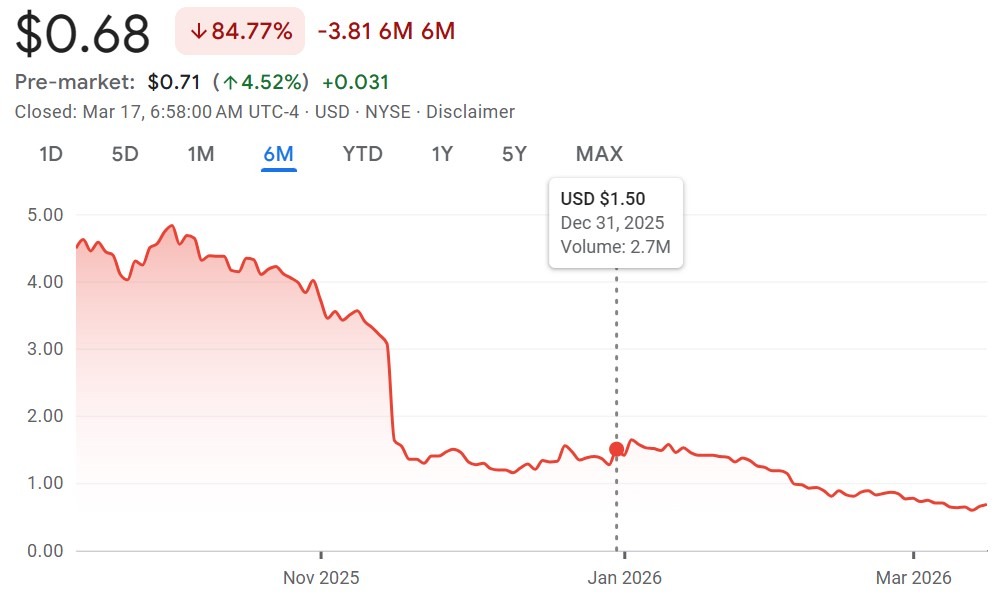
Google Finance data shows that Cango’s shares fell from around $4.50 on Oct. 1 to about $1.50 by Dec. 31. At the time of writing, it trades at $0.68, marking a decline of more than 84% over the past six months.
Cango posted a net loss of $452.8 million for full-year 2025
For the full year, Cango reported total revenue of $688.1 million, including $675.5 million from Bitcoin mining. The company mined 6,594.6 Bitcoin in 2025, or about 18.07 Bitcoin per day, in its first full year operating at scale in the sector.
Cango reported total operating costs and expenses of $1.1 billion for 2025, including $338.3 million in impairment losses on mining machines and $96.5 million in fair-value losses on Bitcoin-collateralized receivables, highlighting the cost pressures associated with scaling its mining operations.
Related: Bitcoin miners saw the AI power crunch coming — and the nuclear revival
In total, Cango posted a net loss of $452.8 million for the year. Chief financial officer Michael Zhang said the loss was driven largely by non-recurring transformation costs and market-driven fair-value adjustments.
Cango’s Bitcoin mining pivot
Cango’s results come amid a broader strategic shift that has reshaped the company’s business over the past year.
In April 2025, Cango agreed to sell its legacy China auto financing operations for $352 million to Ursalpha Digital Limited, an entity linked to Bitmain.
The deal also included the transfer of 32 exahashes per second (EH/s) of mining capacity to the company, effectively repositioning Cango as a publicly traded Bitcoin mining firm.
In February, Cango raised $75.5 million in equity financing after selling 4,451 Bitcoin for about $305 million to reduce leverage.
The company said this supports its pivot toward artificial intelligence infrastructure, with plans to repurpose its mining operations into distributed compute capacity for AI workloads.
Magazine: All 21 million Bitcoin is at risk from quantum computers

Why CAF stripped Senegal of AFCON 2025 title despite final win over Morocco | Football News

MSI Prestige 14 AI+ business laptop review
Samsung considers longer memory chip contracts to address supply concerns- Bloomberg

Smart energy pays enters the US market, targeting scalable financial infrastructure

Why Israel is blocking foreign journalists from entering

Bitcoin: We’re Entering The Most Dangerous Phase

How Much You NEED To Invest Every Month to RETIRE in 10 Years? (So FEW)

XRP RALLYING! IS THIS THE BEGINNING OF AN XRP BULL RUN?! BREAKING XRP NEWS!

Ethical Hacker Exposes How People Made 100 Bitcoin Daily – Ryan Montgomery
-
 Tech7 days ago
A 1,300-Pound NASA Spacecraft To Re-Enter Earth’s Atmosphere
-
 Crypto World4 days ago
HYPE Token Enters Net Deflation as HyperCore Buybacks Outpace Staking Rewards
-

 Fashion4 days ago
Weekend Open Thread: Addict Lip Glow
-

 Tech2 days ago
Your Legally Registered ‘Motorcycle’ Might Not Count Under Proposed US Law
-
Sports4 days ago
Why Duke and Michigan Are Dead Even Entering Selection Sunday
-

 NewsBeat6 days ago
Residents reaction as Shildon murder probe enters second day
-

 Business2 days ago
Search for Savannah Guthrie’s Mother Enters Seventh Week with No Arrests
-

 Business7 days ago
Search Enters Sixth Week With New Leads in Tucson Abduction Case
-

 Sports6 days ago
PWHL, Senators discussing plan to keep Charge in Ottawa
-

 Business4 days ago
US Airports Launch Donation Drives for Unpaid TSA Workers as Partial Government Shutdown Enters Fifth Week
-
 Tech12 hours ago
Are Split Spacebars the Next Big Gaming Keyboard Trend?
-
Crypto World3 days ago
Coinbase and Bybit in Investment Talks: Could Bybit Finally Enter the US Crypto Market?
-

 NewsBeat7 days ago
I Entered The Manosphere. Nothing Could Prepare Me For What I Found.
-

 Business4 days ago
Country star Brantley Gilbert enters growing non-alcoholic beer market
-

 Business2 days ago
Australian shares drop as Iran war enters third week
-

 Crypto World2 days ago
Crypto Lender BlockFills Enters Chapter 11 with Up to $500M in Liabilities
-

 Sports4 days ago
College Basketball Best Bets: Conference Tournament Semifinal Picks
-

 Politics7 days ago
Trump Says Middle East Is ‘Very Lucky’ That He’s President
-

 Crypto World6 days ago
Three Binance Charts May Be Hinting at Bitcoin’s Next Move
-

 Business5 days ago
Trump demands Powell cut rates as Iran conflict raises energy prices


You must be logged in to post a comment Login