
CryptoCurrency
Bitcoin Nears $90K As Tom Lee Predicts 2X Surge by Late January

Join Our Telegram channel to stay up to date on breaking news coverage
Bitcoin’s price is still flirting with the $90,000 level, as the asset remains indecisive and is barred from the upside by the $94,000 level from late November. BTC is down a fraction of a percentage over the last 24 hours, trading at $90,336 as of 12:00 a.m. EST.
As BTC faces indecision around $90,000, Fundstrat’s Tom Lee remains positive on Bitcoin. According to Lee, the digital asset could rally by the end of January, driven by improved liquidity, increased institutional involvement, and clearer regulatory frameworks.
TOM LEE SAID #BITCOIN IS STILL GOING TO $180,000 IN THE NEXT 21 DAYS
HERE WE GO 🚀 pic.twitter.com/EdgnS1impk
— Vivek Sen (@Vivek4real_) January 9, 2026
Lee also sees increased use of BTC ETFs (exchange-traded funds) as a catalyst, adding to a shift toward mainstream adoption and not just speculative trading.
This comes even as the US spot BTC recorded its fourth day of outflows, totaling $250 million, while Fidelity’s FBTC recorded the only positive value of around $7.9 million, according to Coinglass data.
Bitcoin has maintained a steady range between $85,000 and $90,000 since early December 2025. BTC previously peaked at $126,000 in early October but later faced downward pressure amid global financial uncertainty and reduced institutional activity during the holiday season.
Where does BTC go from here?
Bitcoin Price Analysis: BTC Risks Drop Below $89,000
After going through a recovery surge from the start of the new year, the BTC price has dropped in the last 4 candles, as the asset experienced bearish pressure within the $94,000 area.
On the daily chart, Bitcoin trades well above the 50-day Simple Moving Average (SMA), indicating the price remains bullish in the short term as investors hold steady above $90,000.
Meanwhile, the price is well supported by key Fibonacci Retracement levels at 0.382 and 0.5, at $89,015 and $87,340, respectively.
The Relative Strength Index (RSI) is also consolidating in the 50 area, currently at 50.99, a signal of a tug-of-war between bears and bulls.
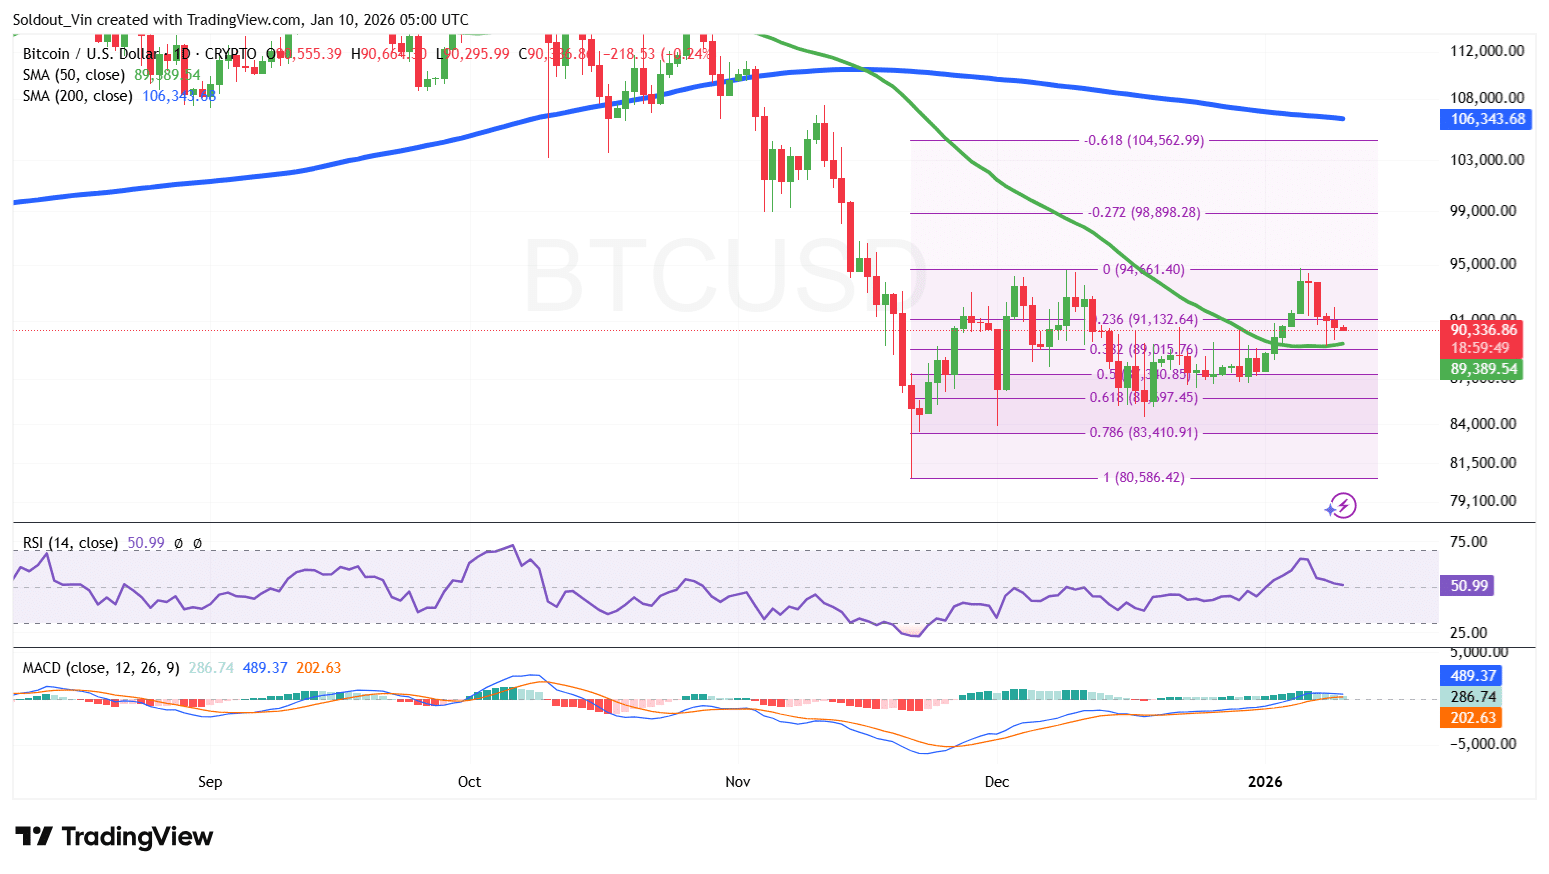
Based on the BTC/USD daily chart analysis, the BTC price could still drop back to $89,389 (50-day SMA), but that level is acting as strong support. This scenario shows that investors remain cautious about any slight move.
If this bearish pressure continues, Bitcoin is at risk of falling below $89,000, with the 0.382 and 0.5 Fib levels acting as immediate support.
However, if the 50-day SMA holds strong, the Bitcoin price could still surge in the long term, with $94,660 and $98,898 as the next target zones on the Fibonacci chart.
Related News:
Best Wallet – Diversify Your Crypto Portfolio

- Easy to Use, Feature-Driven Crypto Wallet
- Get Early Access to Upcoming Token ICOs
- Multi-Chain, Multi-Wallet, Non-Custodial
- Now On App Store, Google Play
- Stake To Earn Native Token $BEST
- 250,000+ Monthly Active Users
Join Our Telegram channel to stay up to date on breaking news coverage


