
Crypto World
Bitcoin Price Bounce Triggers Crash Risk to $58,000?
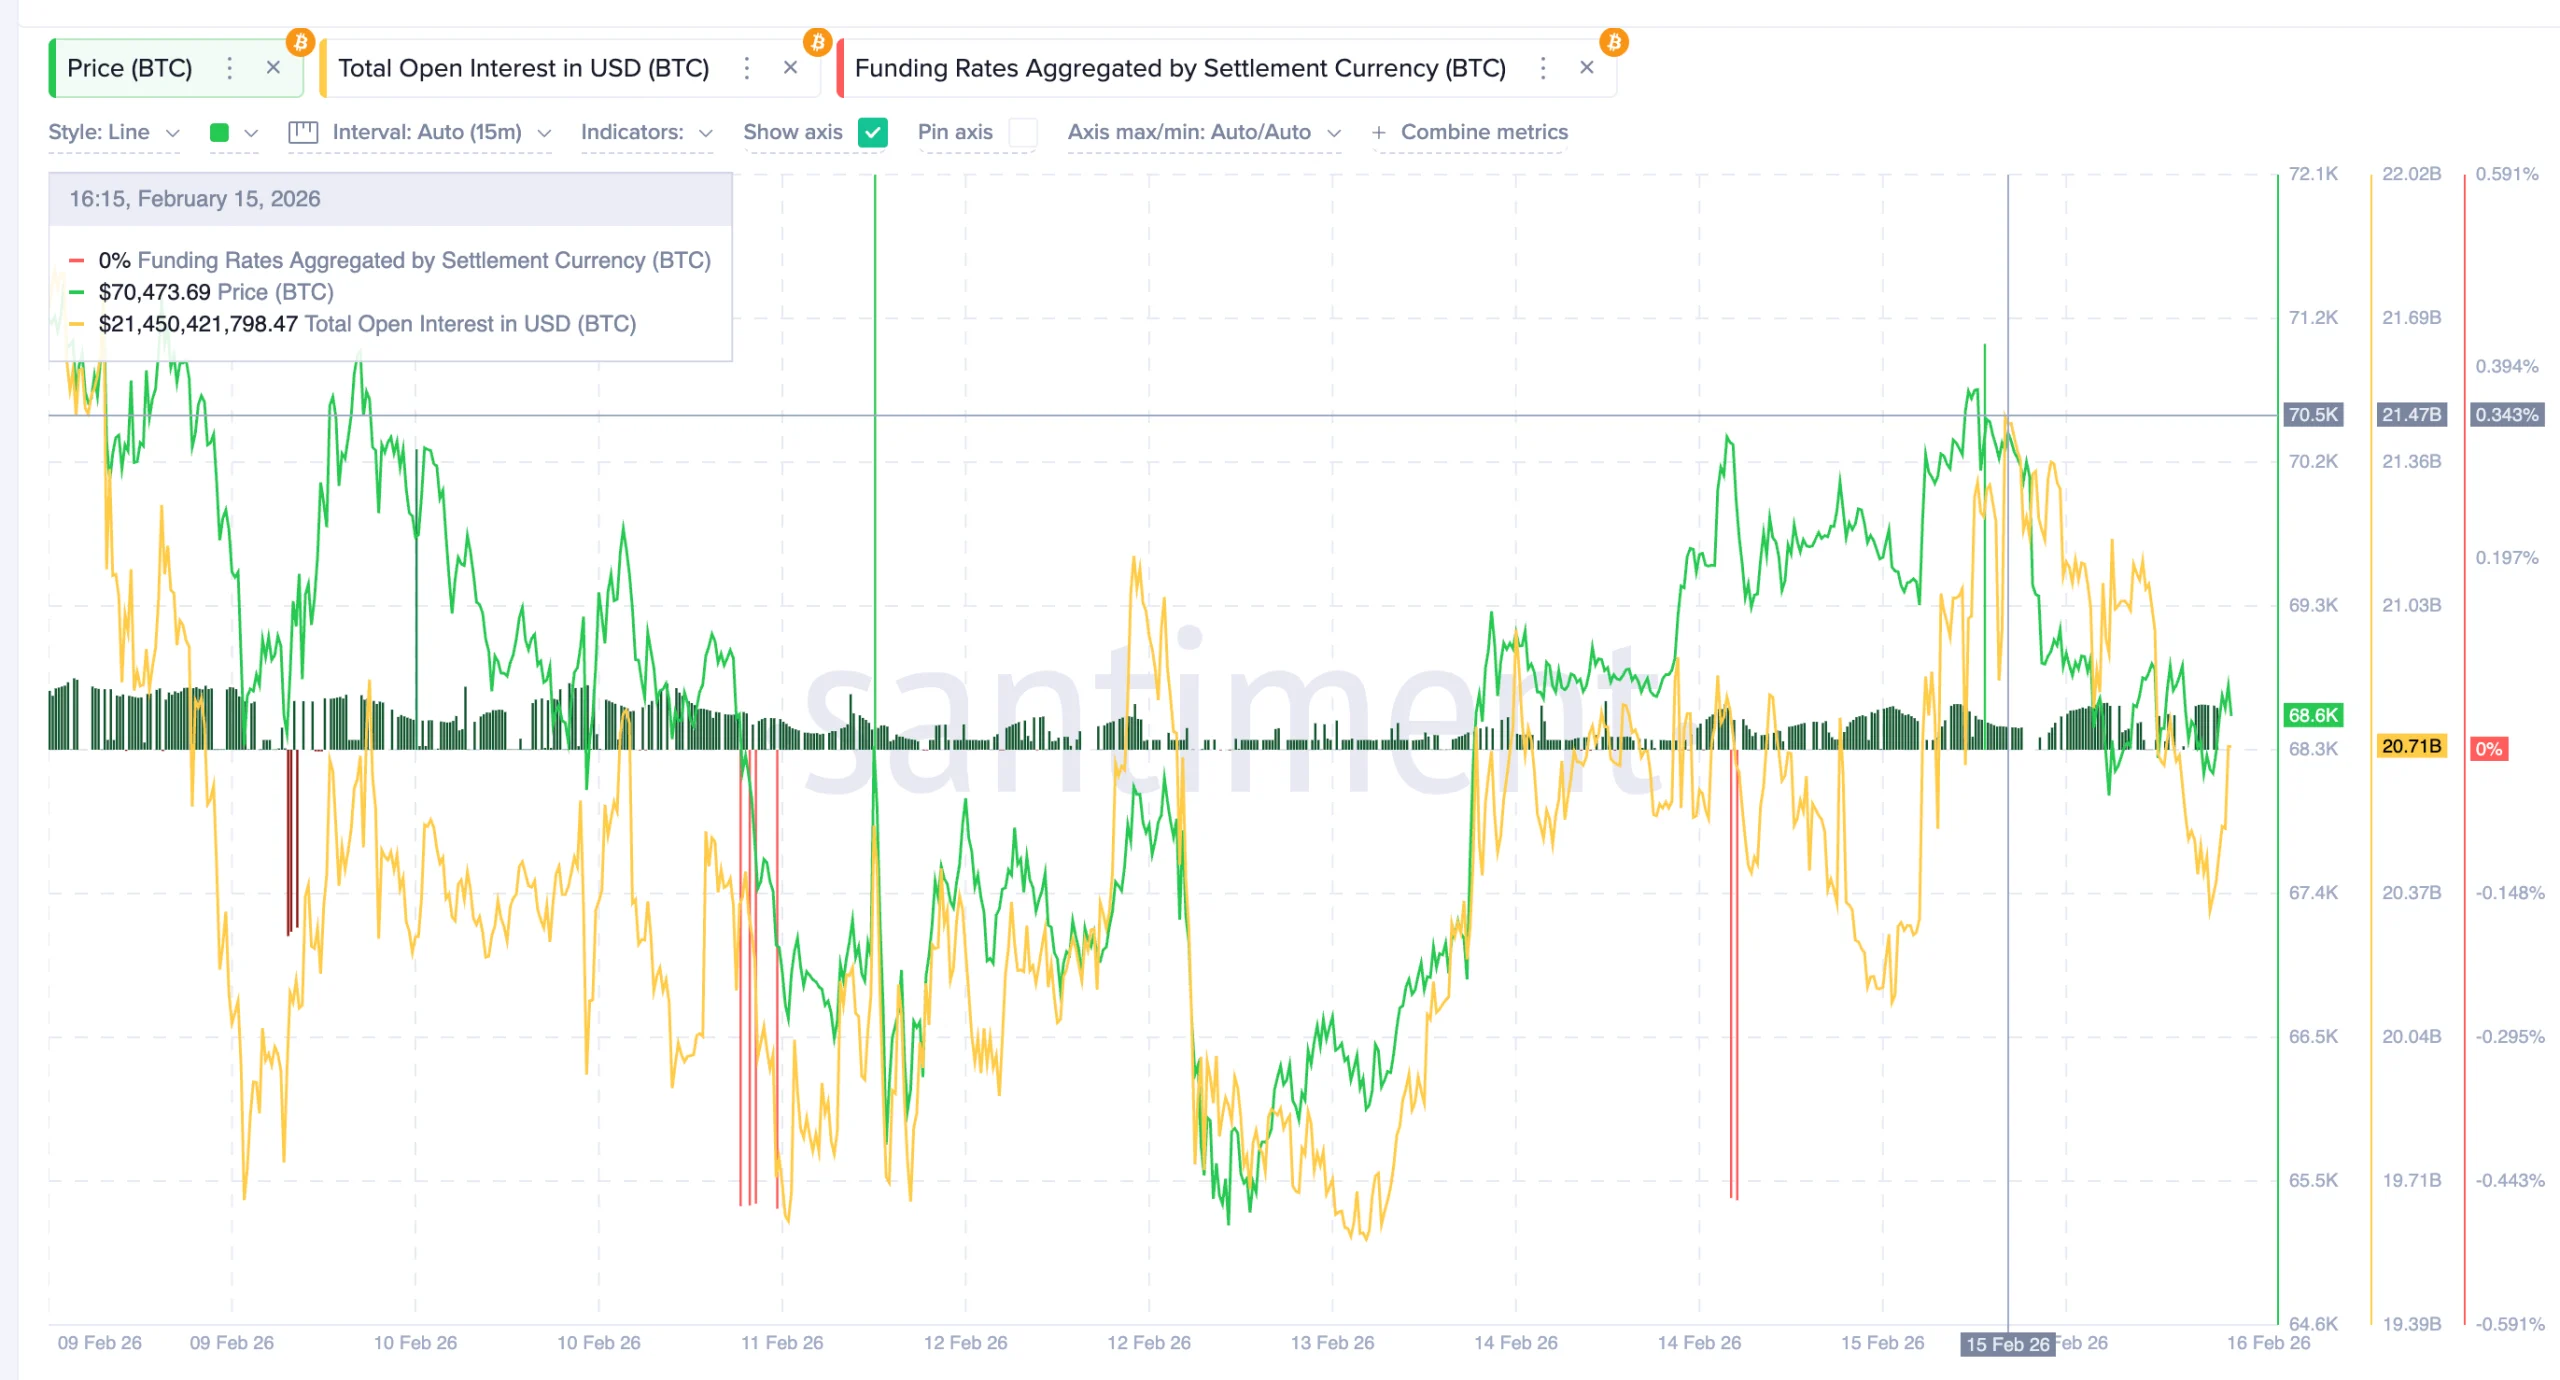
BTC’s recent recovery may be hiding a dangerous signal. The Bitcoin price bounced nearly 9% between February 12 and February 15, giving the impression that the worst of the correction was over.
But the rebound is already weakening. Now, leverage data, momentum signals, and on-chain profit trends suggest the bounce may have increased crash risk instead of ending it.
Sponsored
Sponsored
Bitcoin’s 9% Bounce Drew Nearly $2 Billion in Long Bets
Between February 12 and February 15, Bitcoin climbed roughly 9%. At the same time, futures traders aggressively positioned for further upside. Total open interest, which tracks the total value of active futures contracts, rose from $19.59 billion to $21.47 billion. This was an increase of about $1.88 billion, or roughly 9.6%, between February 13 and February 15.
This increase did not happen in isolation. Funding rates also turned strongly positive, rising toward +0.34%. The funding rate is the fee paid between long and short traders. When it is positive, long traders pay short traders. This shows that most BTC traders were betting on prices rising.
Want more token insights like this? Sign up for Editor Harsh Notariya’s Daily Crypto Newsletter here.
Together, rising open interest and positive funding rates confirmed that the market was positioning for a larger recovery. But the larger chart structure reveals a critical problem.
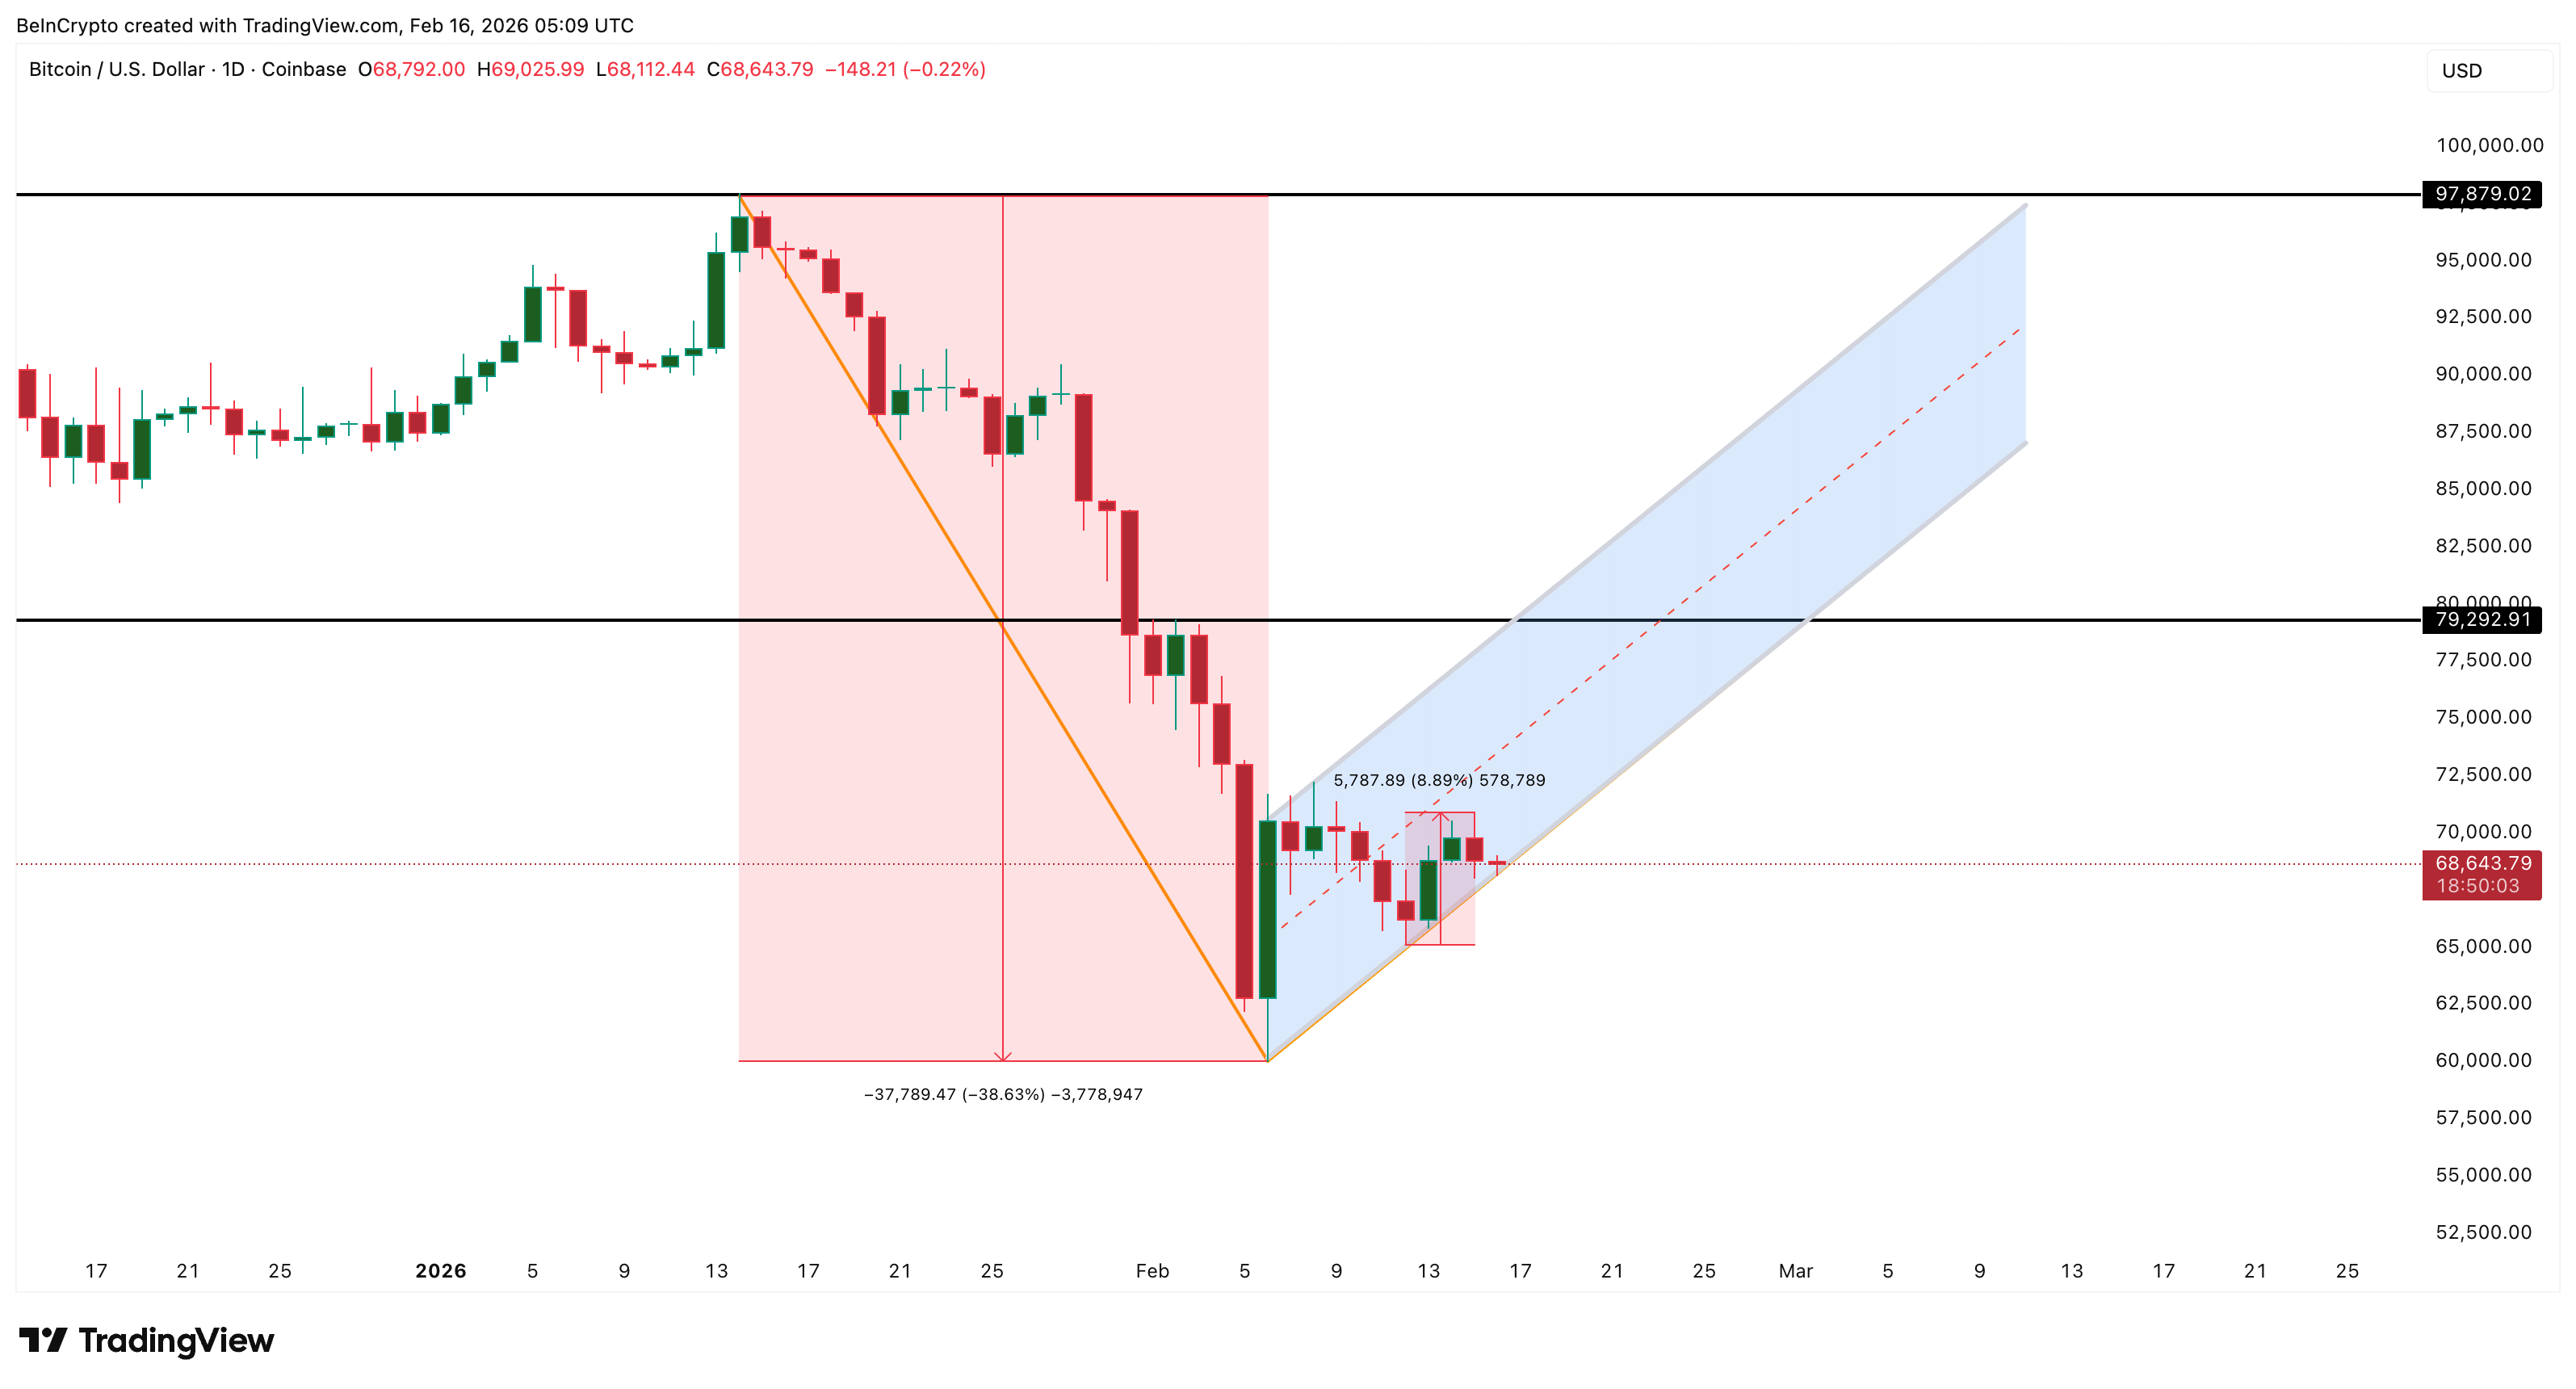
This entire rebound happened inside a bear flag pattern. A bear flag forms when the price rises slowly after a sharp drop but remains inside a downward continuation structure. It often acts as a pause before another decline.
Sponsored
Sponsored
The recent rejection near the local peak and the ongoing pullback now show that Bitcoin is still trading inside this bearish pattern. Price is already drifting toward the lower boundary of the flag. If this lower support breaks, the next leg of the weakening Bitcoin price prediction could begin.
Hidden Bearish Divergence and 90% Profit Surge Show Sellers Are Returning
Momentum indicators are now starting to confirm this growing weakness. On the 12-hour chart, Bitcoin formed a hidden bearish divergence between February 6 and February 15.
During this period, the price formed a lower high, meaning the recovery was weaker than the previous peak. But the Relative Strength Index, or RSI, formed a higher high. RSI measures the strength of buying and selling momentum.
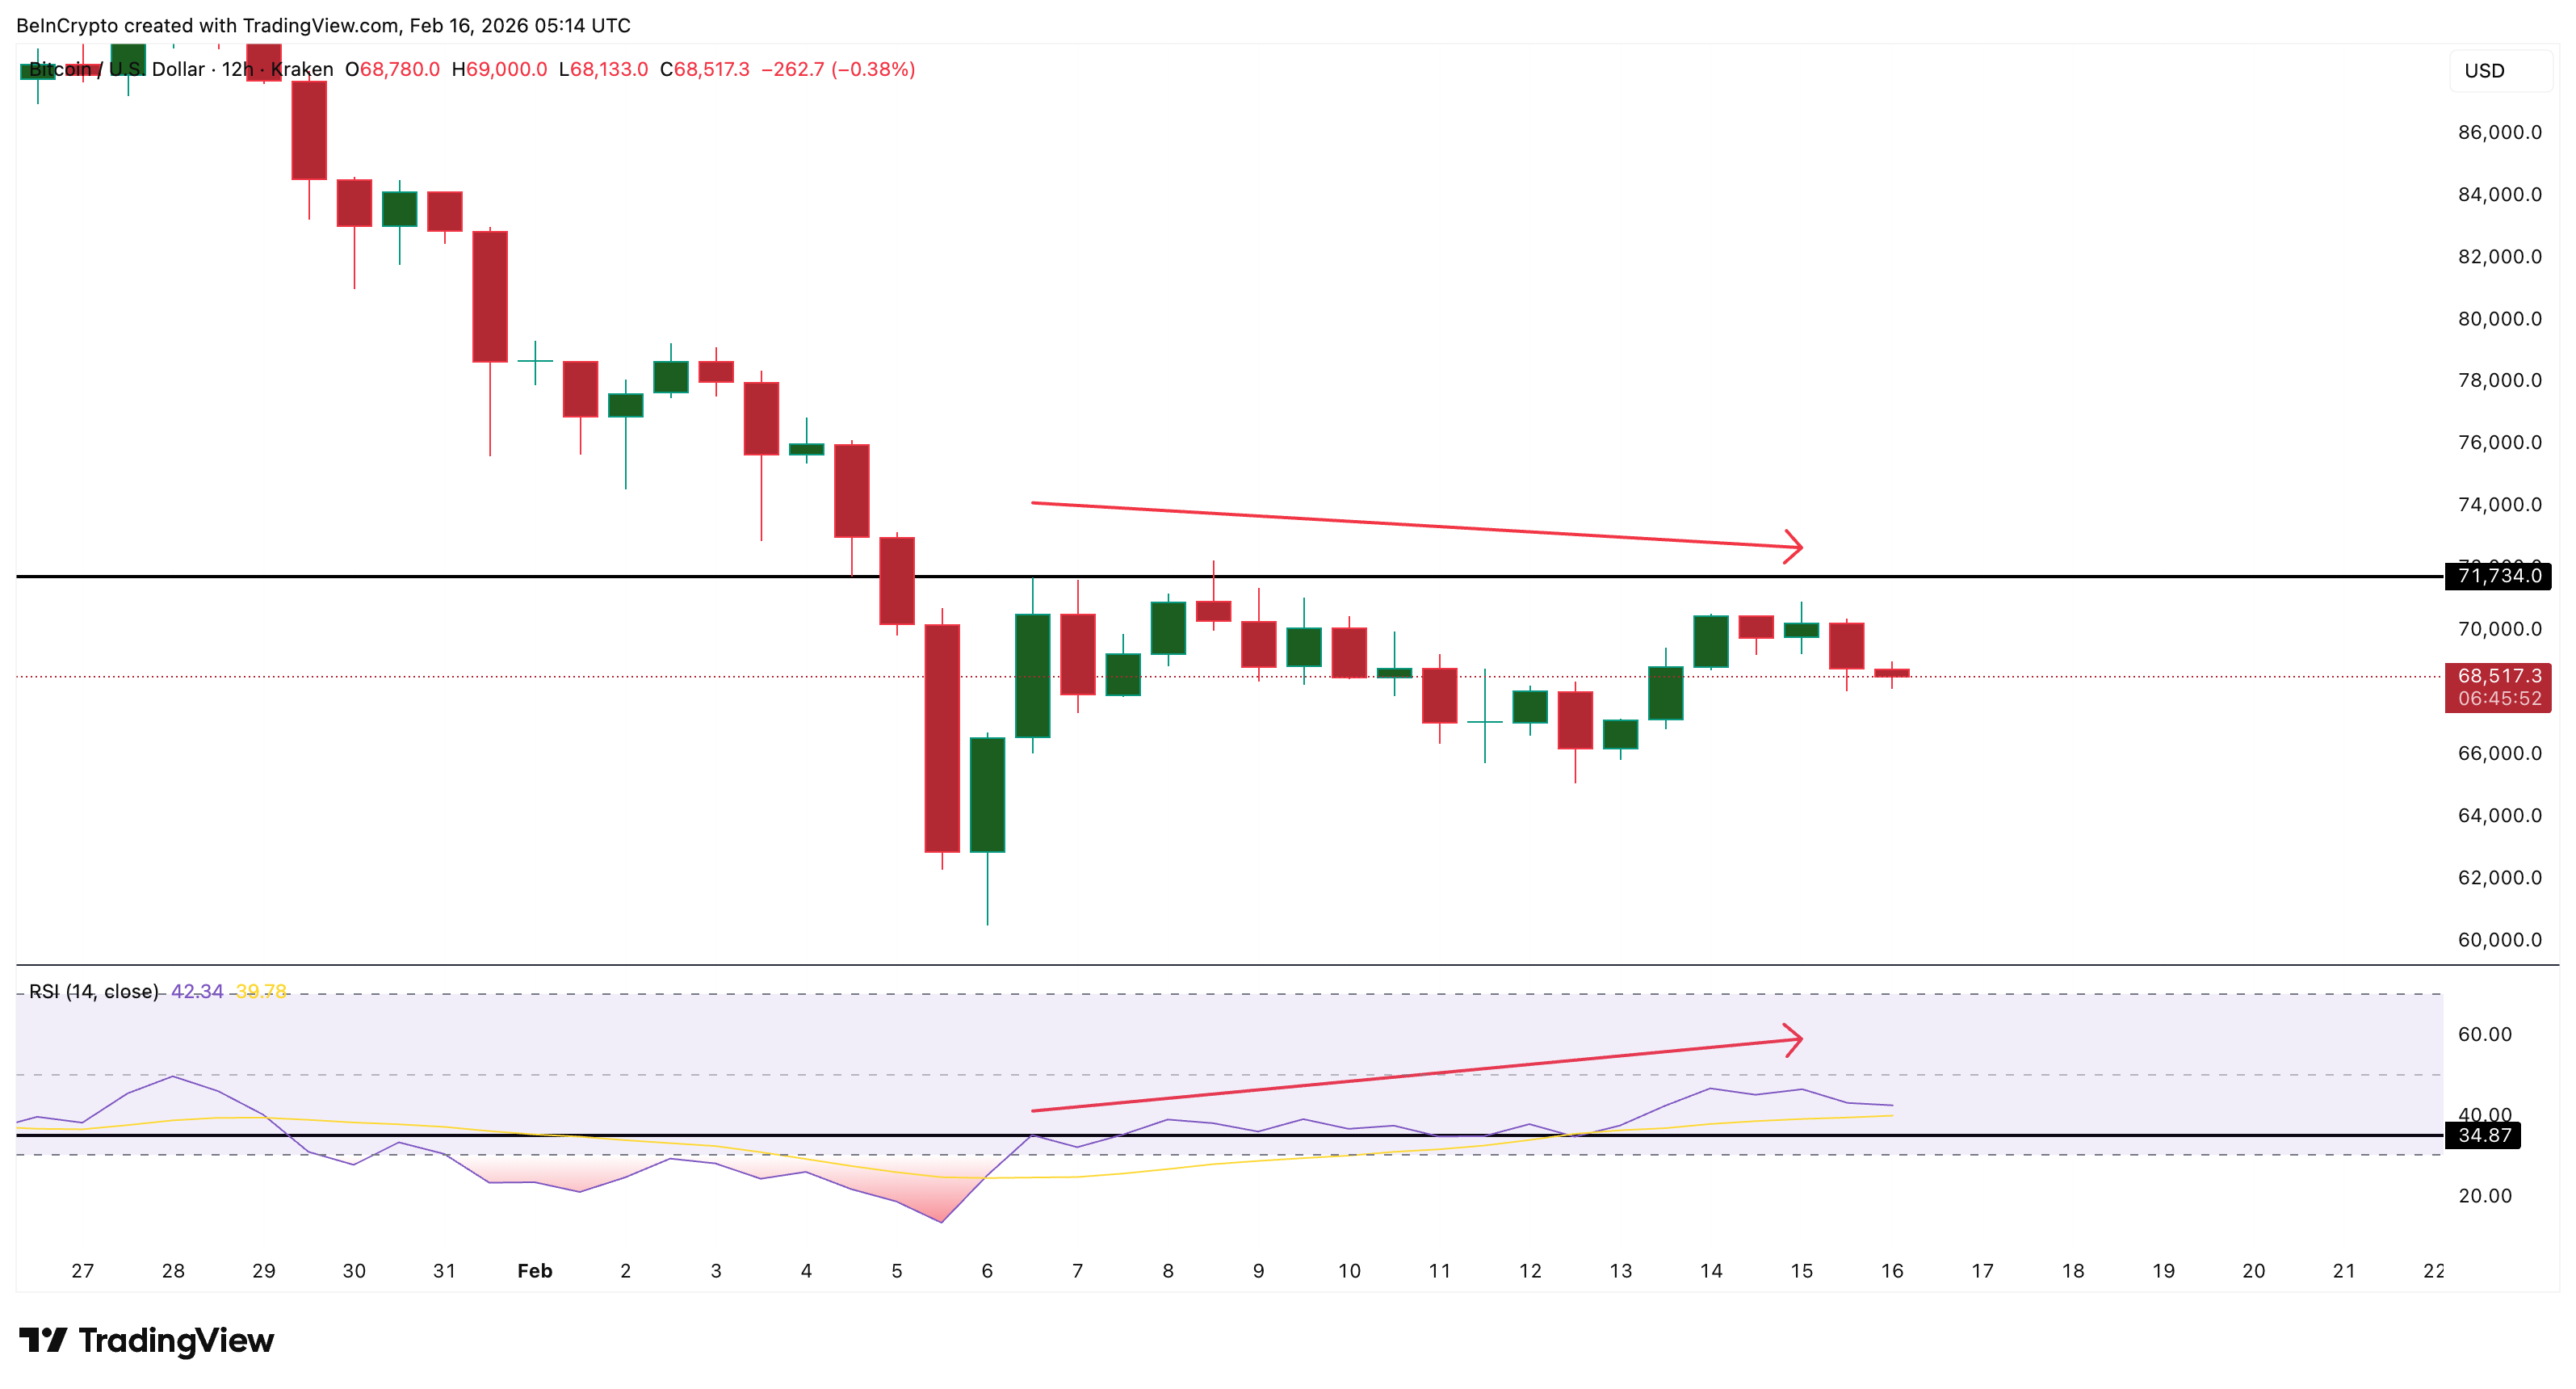
This combination is called hidden bearish divergence. It usually appears when buying momentum rises temporarily, but the overall trend remains weak. It signals that sellers are quietly regaining control. Shortly after this signal appeared, Bitcoin’s pullback began.
Sponsored
Sponsored
At the same time, on-chain profit data surged sharply, creating another warning sign. Bitcoin’s Net Unrealized Profit/Loss, or NUPL, rose from 0.11 on February 5 to 0.21 on February 14. This was an increase of about 90%. It is currently moving near the same zone, at press time.
NUPL measures the average unrealized profit across all Bitcoin holders. It shows how much profit investors are holding on paper. When NUPL rises sharply, it means many investors are suddenly back in profit, even if it is a small amount. This increases the risk of profit-taking.
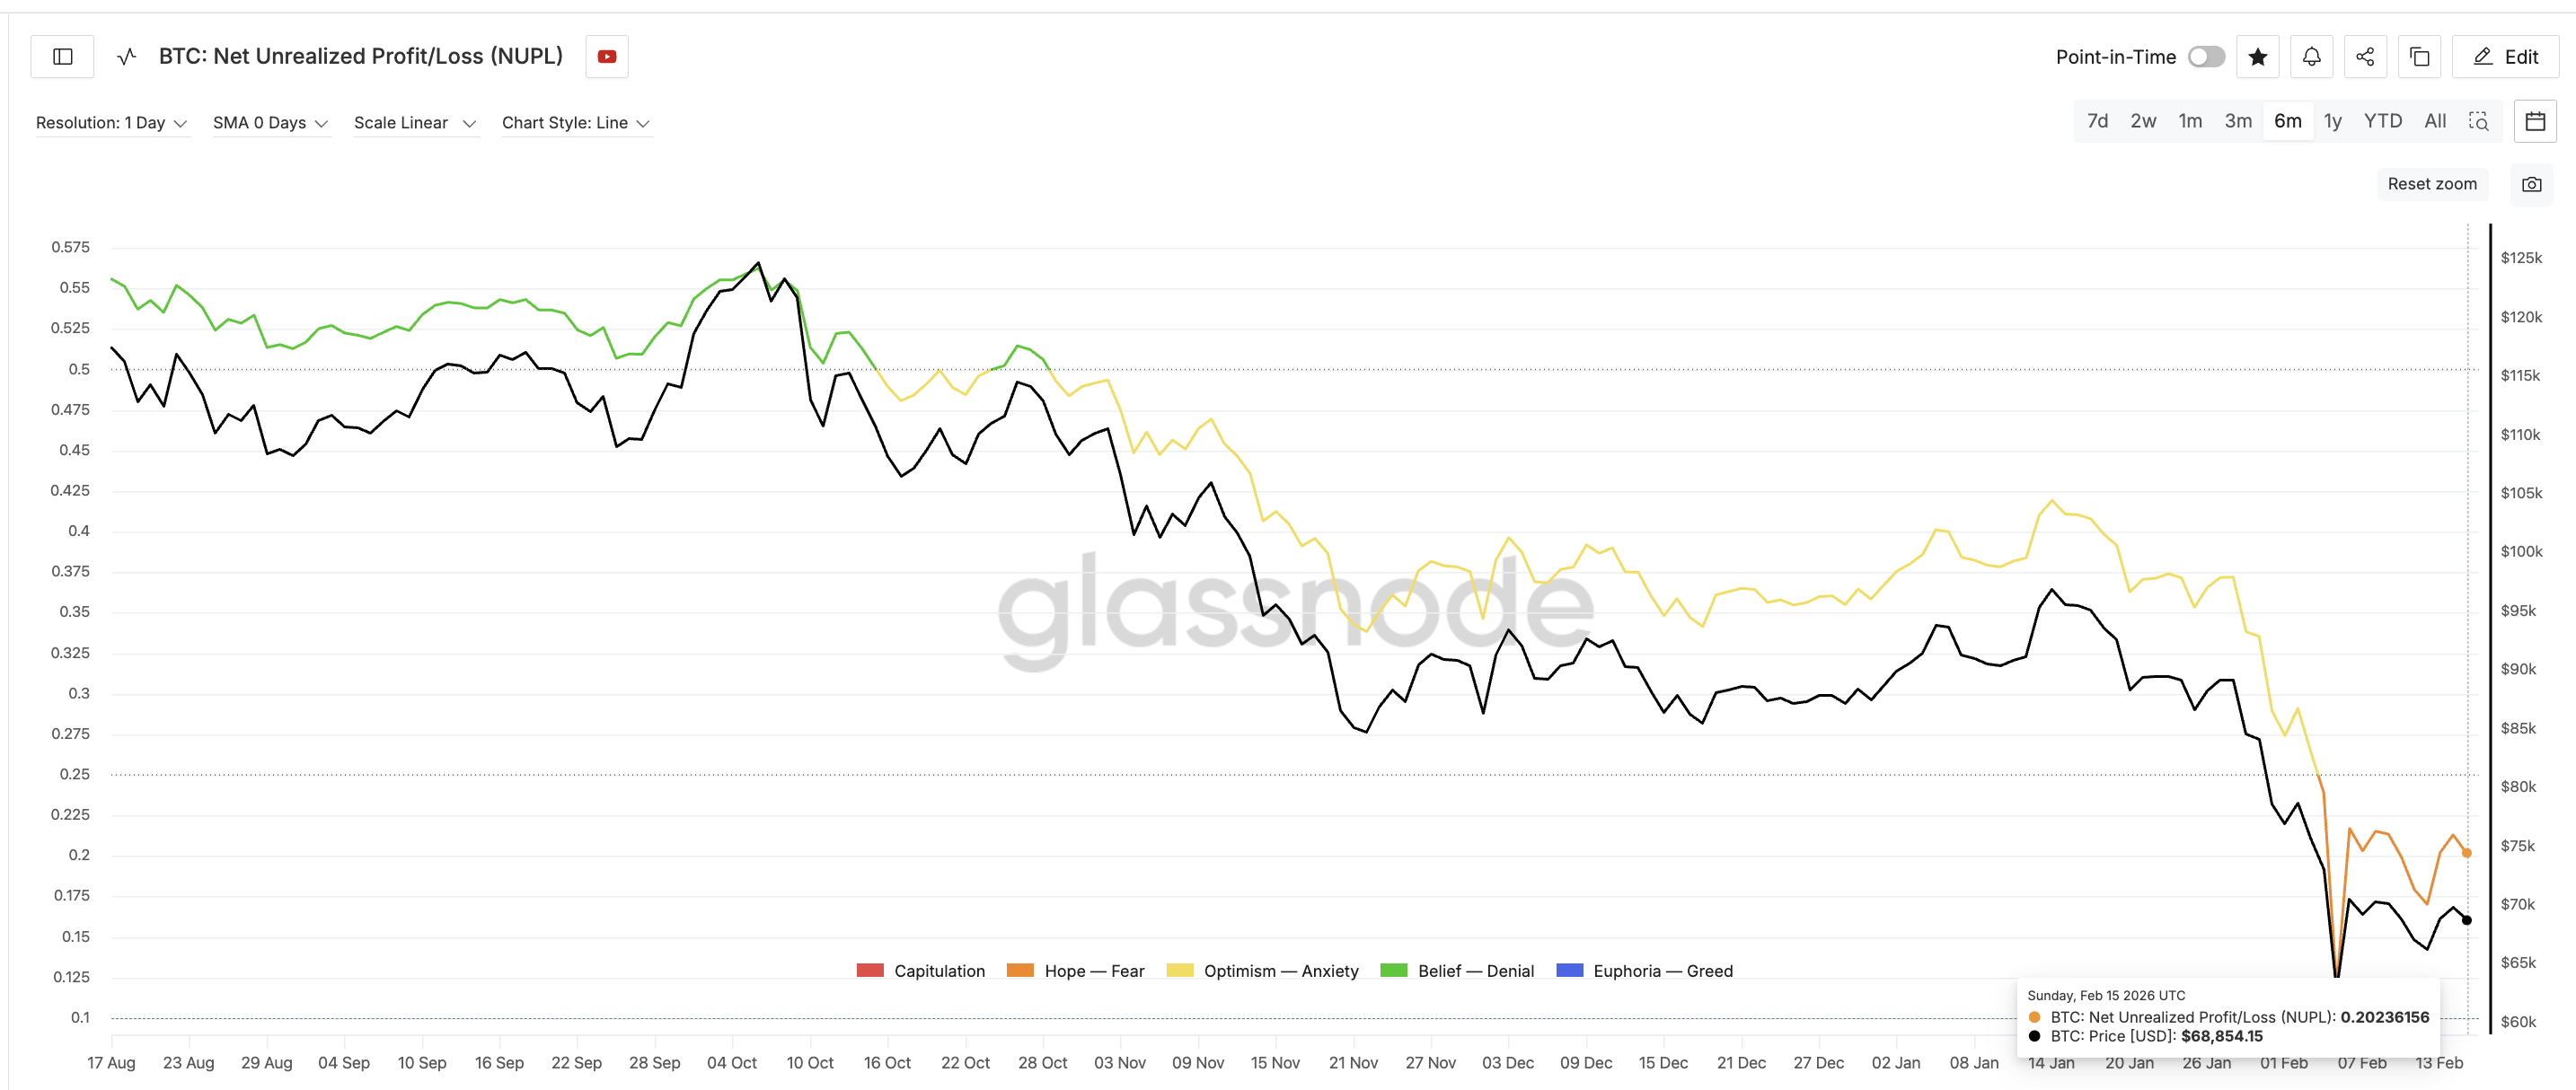
The last time NUPL reached similar levels was on February 4. At that time, Bitcoin was trading near $73,000. Within one day, the price collapsed to around $62,800. That was a drop of nearly 14%. Now, the same profit structure has appeared again.
This creates a scary situation. Investors holding fresh profits may sell quickly if prices start falling. That selling can accelerate the correction. This aligns with the hidden bearish divergence already visible on the chart.
Sponsored
Sponsored
Together, these signals show that the recent bounce may have strengthened sellers instead of removing them.
Key Bitcoin Price Levels Show Breakdown Risk Toward $58,800
Bitcoin is now approaching the most important support zone in its current structure. The first critical level is $66,270. This level forms near the lower boundary of the bear flag pattern breaks.
If Bitcoin breaks below this Fib level, the bearish continuation pattern would activate. The next major downside target sits at $58,880 (the $58,000 zone). This level aligns with the 0.618 Fibonacci retracement level ( a structurally strong zone) and represents roughly a 14% decline from current prices.
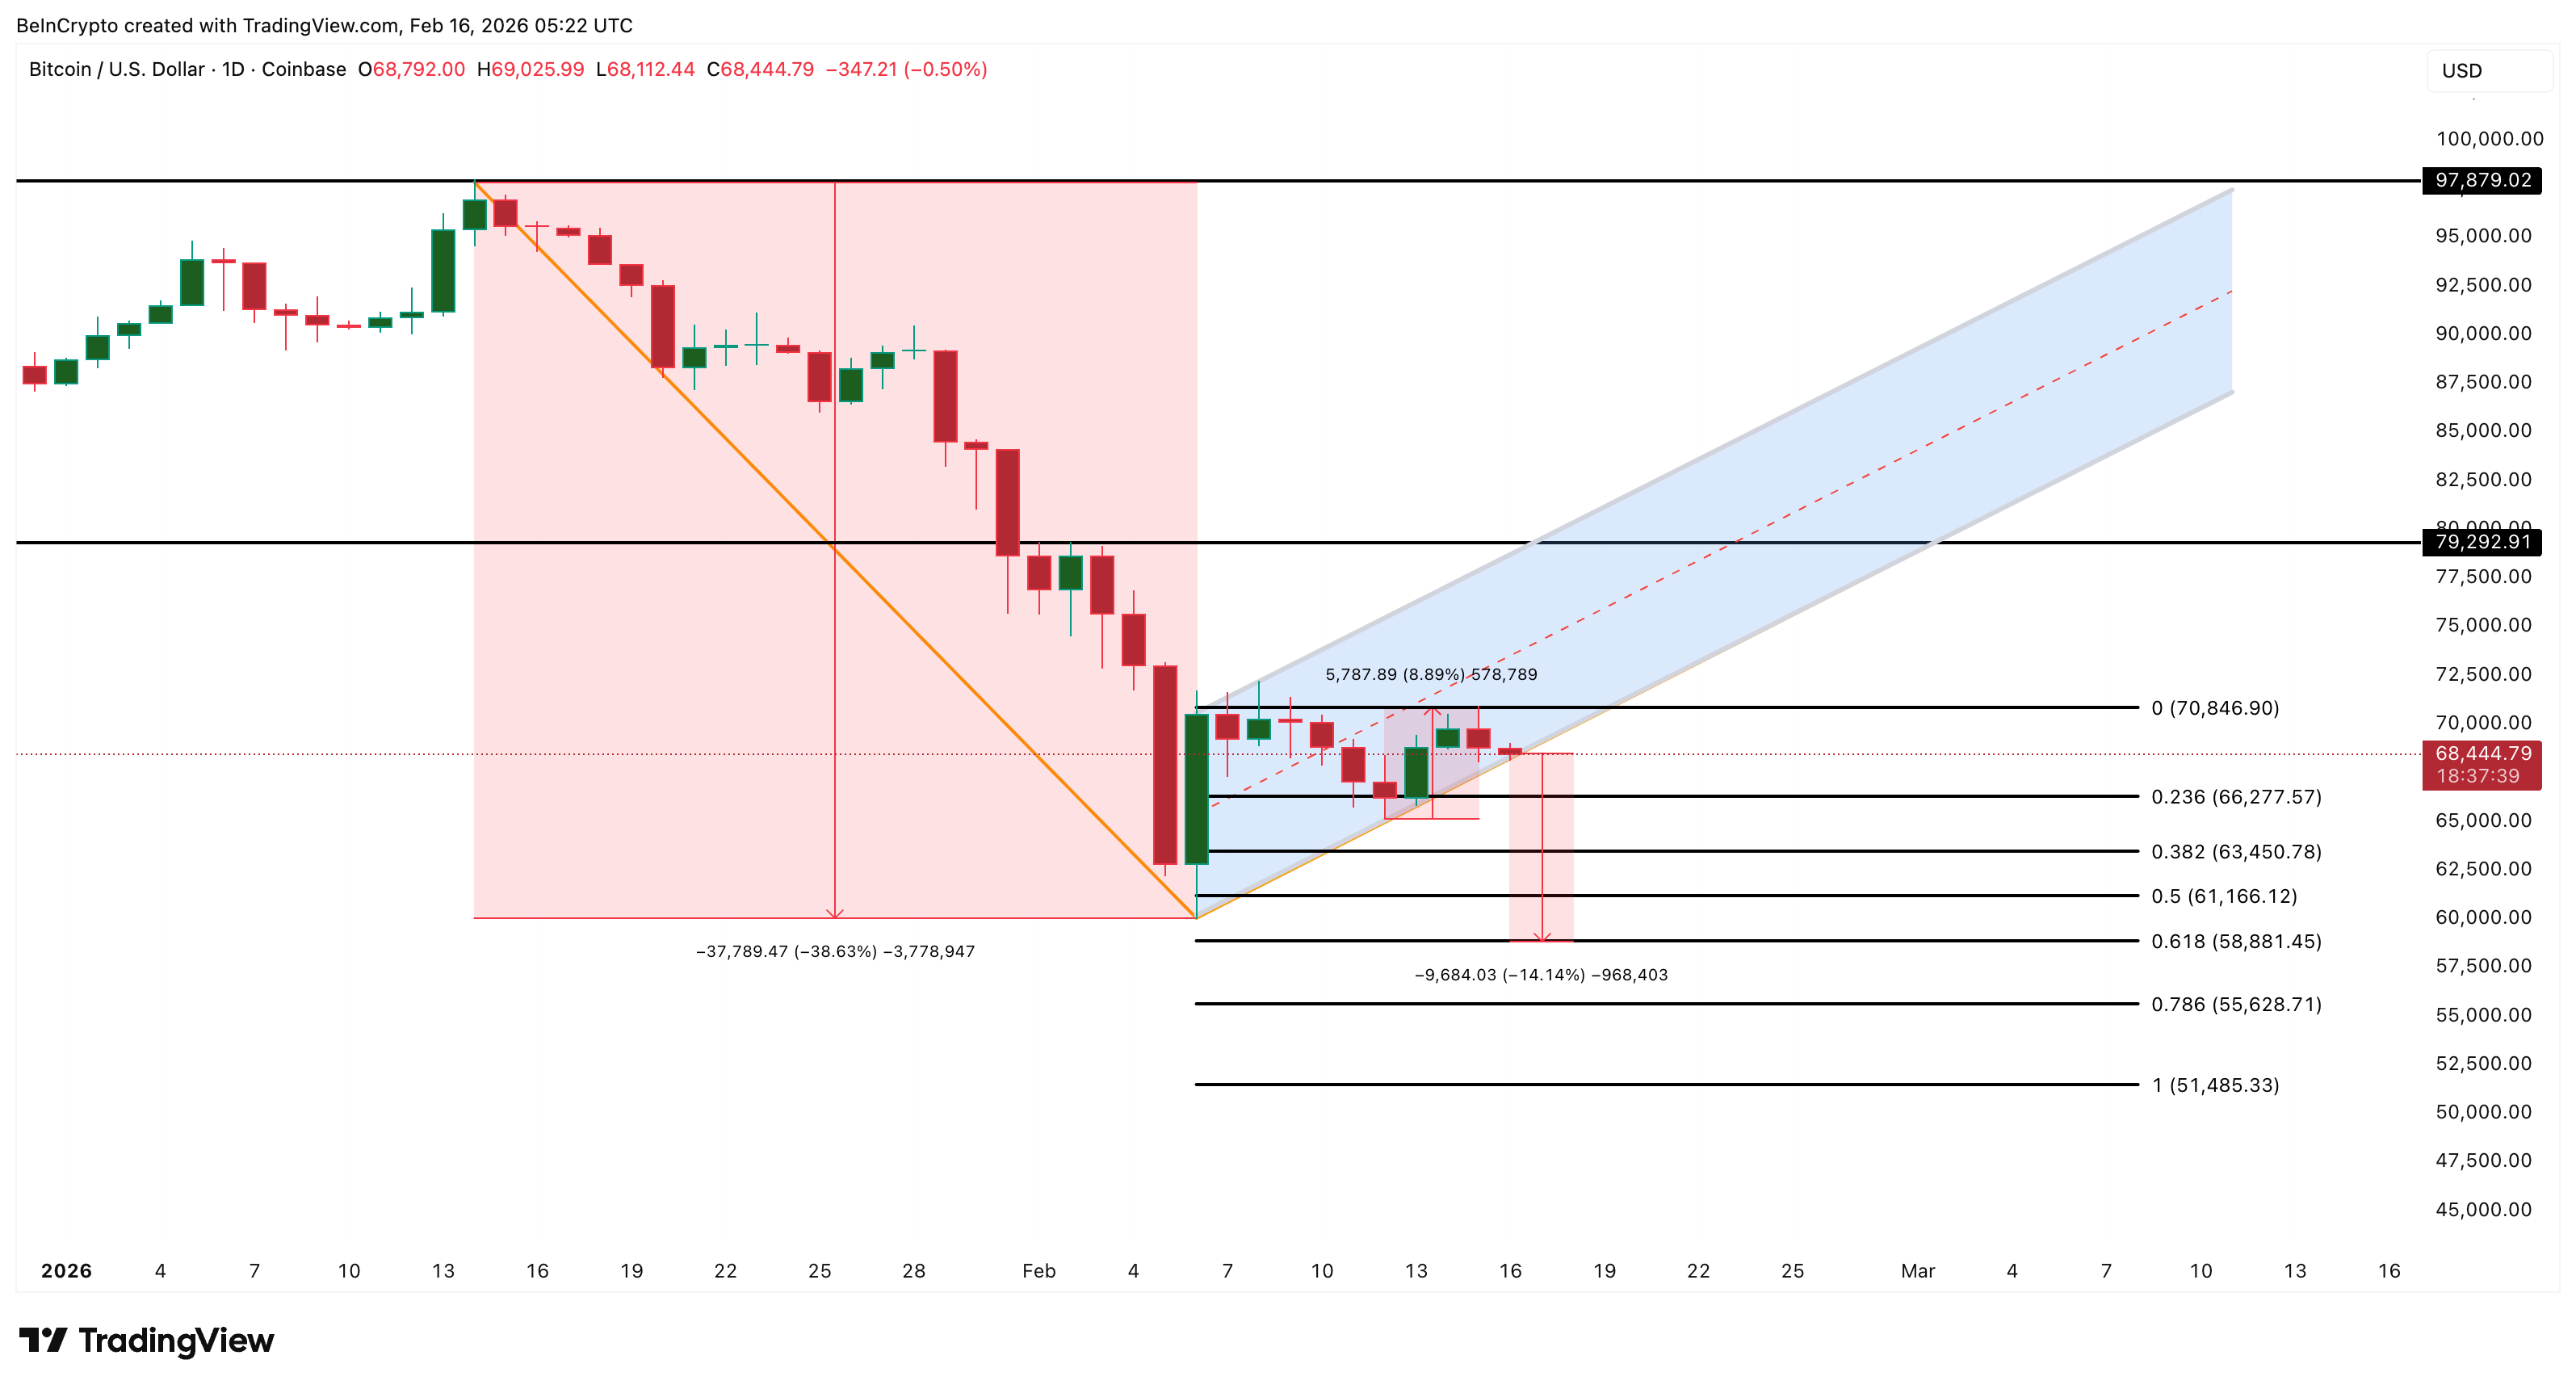
If selling pressure accelerates further, Bitcoin could fall toward the $55,620 zone, which aligns with the deeper projection of the bear flag structure. On the upside, Bitcoin must reclaim $70,840 to stabilize in the short term.
A stronger breakout above $79,290 would fully invalidate the bearish structure. That would signal that buyers have regained control. Until then, the risk remains tilted to the downside. The recent bounce improved sentiment briefly. But rising leverage, hidden bearish divergence, and a 90% surge in unrealized profits now show that the Bitcoin price recovery may have created the conditions for another drop.

Key takeaways:
-
Bitcoin hitting $72,000 would liquidate $2.5 billion in shorts, potentially crushing bears who are overleveraged.
-
Iran’s war and high oil prices currently pressure BTC, but a ceasefire or ETF inflows could spark a rapid recovery.
$2.5 billion in shorts at risk if BTC hits $72,000
Bitcoin (BTC) has consistently failed to hit new highs since attempting to reclaim the $75,000 level since March 17.
Bearish Bitcoin futures bets have been piling up as the war in Iran pushed oil prices to their highest levels since June 2022. However, two events could propel Bitcoin to $72,000 in the coming weeks and help cement a sustainable bull run.

According to Coinglass estimates, a total of $2.5 billion in short positions on Bitcoin futures will be liquidated if Bitcoin rises just 7.5% to $72,000 from the current $67,100 level.
BTC bears benefit from miners’ sales, weak S&P 500
Bears have been adding shorts since March 25, when Iran reportedly refused to negotiate a ceasefire. Additional selling pressure emerged as MARA Holdings (MARA US) announced it sold 15,133 BTC on March 26. The publicly listed Bitcoin miner shifted its focus to AI computing and chose to reduce its Bitcoin holdings to pay down debt.
After peaking near 7,000 points on Jan. 28, the S&P 500 dropped 10% by March 30. Investors fear recession risks because central banks have less room to cut interest rates due to inflation.
Oil prices have jumped over 70% since the war in Iran started in late February, which hikes logistics costs and cuts into consumer spending.

Traders are pricing in 89% odds that the Fed will keep interest rates steady through September, with 5% odds of a hike to 4%.
In early March, bond futures showed the opposite, with 79% odds of rate cuts. Returns on fixed-income investments will likely stay attractive for longer.

Meanwhile, confidence among Bitcoin bears has increased, as reflected by the negative funding rate in perpetual futures contracts.
In neutral market conditions, longs usually pay to keep positions open, causing this indicator to range between 5% and 10% to compensate for capital costs.
Negative funding rates signal a lack of demand for bullish leveraged bets and potential overconfidence from the bears.
Ceasefire or economic weakness may boost Bitcoin
While it is impossible to predict the outcome of the war involving Iran, a ceasefire agreement could spark bullish sentiment and catch bears by surprise.
Bitcoin jumped from $69,150 to $74,900 during the five days ending March 16 after US-listed Bitcoin exchange-traded funds saw $1.5 billion in net inflows over two weeks. If ETF inflows resume, Bitcoin could also reclaim the $72,000 level.
Related: Bitcoin ETFs ‘will be larger’ than gold ETFs–Analyst

US President Donald Trump has asked Congress to boost defense spending to $1.5 trillion, according to a 2027 budget proposal released Friday. These plans include a 10% cut in other areas to offset military expenses.
Trump reportedly said at a private White House event on Wednesday: “We’re fighting wars. We can’t take care of day care,” according to CNBC.
If the US economy loses steam, or if private credit redemptions continue to pressure the market, investors will likely look for alternative hedges.
Consequently, Bitcoin’s appeal would grow as the it presently trades 47% below its all-time high. Thus, a bull run to $72,000 might happen regardless of how long the war in Iran lasts.
This article is produced in accordance with Cointelegraph’s Editorial Policy and is intended for informational purposes only. It does not constitute investment advice or recommendations. All investments and trades carry risk; readers are encouraged to conduct independent research before making any decisions. Cointelegraph makes no guarantees regarding the accuracy or completeness of the information presented, including forward-looking statements, and will not be liable for any loss or damage arising from reliance on this content.

Global X Management Company has launched the Global X Ethereum Covered Call ETF (EHCC), a new fund that writes call options on Ether-related ETPs to generate weekly income distributions, marking the firm’s first crypto ETF beyond Bitcoin.
The fund carries a 0.75% expense ratio, is actively managed, and invests at least 80% of net assets in U.S.-listed Ether ETPs, including spot and futures products, without directly holding the digital asset.
EHCC brings Global X’s total digital asset ETF count to four. It launched with CUSIP 37966B802, an inception date of March 16, 2026, and The Bank of New York Mellon as custodian. The firm manages $78.1 billion in AUM as part of Mirae Asset Financial Group’s $803 billion global platform.
Key Takeaways:
- Ticker: EHCC – Global X Ethereum Covered Call ETF, launched April 2, 2026.
- Expense Ratio: 0.75%, actively managed, no minimum investment.
- Strategy: Writes call options on Ether ETPs; distributes option premiums to investors weekly.
- Tradeoff: Upside above the strike price is capped; downside exposure remains.
- Competitor: Amplify’s EHY has been running the same structure since October 9, 2025, also at 0.75%.
Discover: The Best Crypto to Buy Right Now
What EHCC Actually Does – and Why Ether’s Volatility Is the Product
The core mechanic is straightforward: EHCC holds Ether-linked ETPs and sells call options against that exposure. The option premiums collected are distributed weekly.
In exchange, the fund surrenders gains above the strike price in a rally – a direct cap on upside that income-focused investors are explicitly accepting as the deal.
Pedro Palandrani, Head of Product Research & Development at Global X, framed the thesis plainly: “Although we believe ether has significant growth potential, it’s also a highly volatile asset, which we believe makes it well suited for a covered call strategy that aims to generate weekly income while maintaining exposure to potential price appreciation.”
That volatility isn’t a bug here – it’s what inflates the option premiums that fund the distributions.
Ethereum’s price dynamics make it a credible covered call substrate. ETH has historically moved 60-80% annualized volatility in active periods, which translates directly into fatter premiums when writing calls.
Amplify’s competing EHY, launched October 9, 2025, targets 50-80% annualized option premiums using the same weekly cadence and the same 0.75% fee. EHCC enters a market that already has a benchmark.
The SEC’s May 2024 approval of spot Ether ETFs is what made this structure viable – EHCC needs liquid, regulated Ether ETPs to write options against. Without that underlying infrastructure, the fund doesn’t exist. Bitcoin ETF market trends showed that once regulated wrappers gain traction, derivative income strategies follow fast. That playbook is now running on ETH.

The risk is asymmetric in one specific way: EHCC retains full downside exposure to Ether while capping the upside. In a sustained ETH bull run, holders underperform a straight spot position. In a choppy or declining market, the premium income provides a buffer – but not a floor. That’s the trade.
Discover: The Best Crypto Presales Live Right Now
The Ethereum Income ETF Space Is Getting Crowded – Fast
Global X isn’t first to this specific trade. Amplify’s EHY has six months of operational history, giving it a performance track record EHCC currently lacks.
Amplify also has ETTY – an Ethereum 3% monthly option income ETF – already in the market, signaling a multi-product Ether income strategy that Global X is now moving to match.
The institutional backdrop supports the build-out. Ethereum’s growing role in institutional tokenization is pulling traditional asset managers toward ETH-denominated products.
Regulated income vehicles lower the barrier for allocators who want ETH exposure without the custody risk or the volatility of a direct position. EHCC slots directly into that demand.
Watch EHCC’s first weekly distributions and net inflow trajectory against EHY as the real test. If Global X’s distribution brand and $78.1 billion AUM distribution network pulls traditional ETF investors into the Ether income category, this launch matters beyond the product itself, it normalizes weekly crypto yield as a standard ETF feature.
If flows stay thin, it confirms EHY has the first-mover lock and EHCC is a late follow-on. Q2 2026 will answer that.
Explore: The best pre-launch token sales with asymmetric upside potential
The post Global X Launches Ethereum Covered Call ETF Targeting Weekly Income appeared first on Cryptonews.
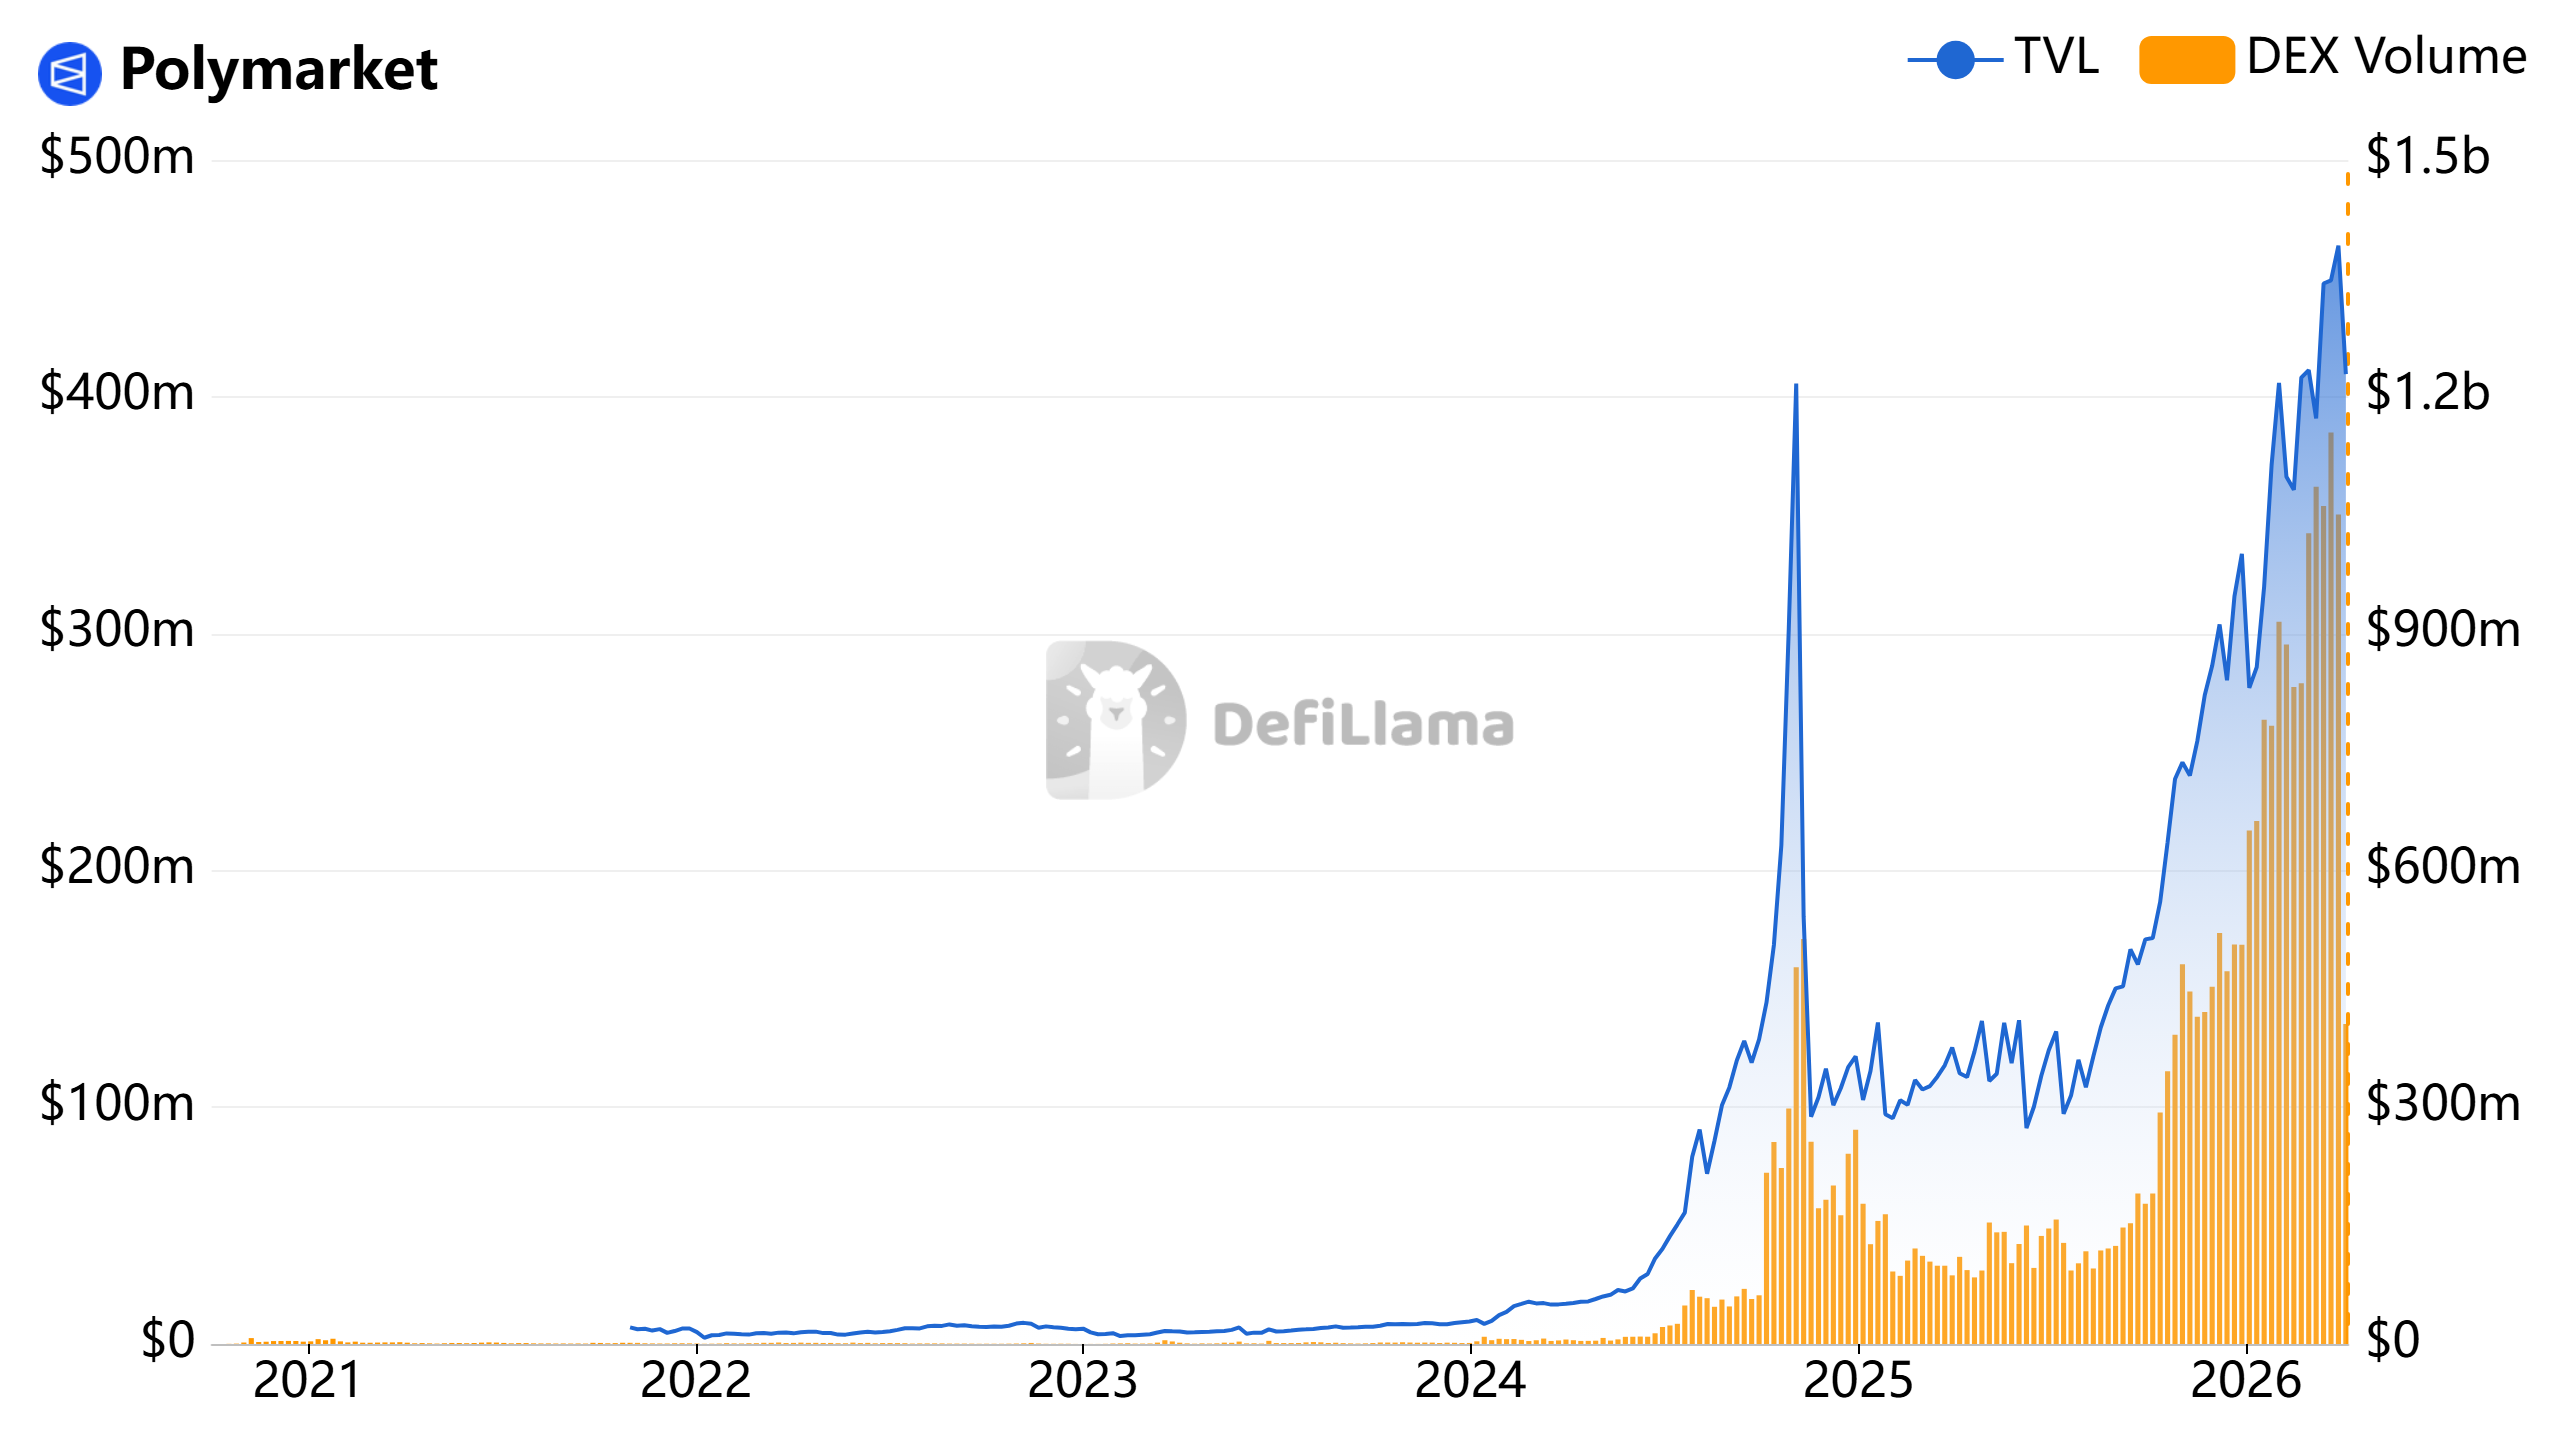
Prediction markets are pushing into Asia’s largest economies, even as local gambling laws place strict limits on betting activities.
Asia represents a combination of scale, active retail participation and limited local alternatives, making it too large to ignore despite regulatory risks.
That’s a similar pattern seen in crypto, where technology moved faster than regulation and licensing frameworks, prompting exchanges to enter markets before clear rules were in place.
Like many startups, the industry’s heavyweights adopted the “better to ask for forgiveness than permission” approach to scale.
Polymarket, one of the fastest-growing platforms, is already recording over $1 billion in weekly volume. It has introduced Chinese-language support, while newer entrants like PredicXion are focusing on local events to drive adoption.
But beneath the surface, the region is fragmented and legally complicated, where access, language and regulation don’t always align with the industry’s global ambitions.

Prediction markets hit local barriers in Asia
Three Asian countries — China, Japan and India — ranked among the world’s five largest economies by gross domestic product in 2024, according to the World Bank.
India and China do not have specific frameworks addressing blockchain-based prediction markets, but both maintain restrictive environments around crypto. India imposes heavy taxation, while China enforces an outright ban on activities such as trading and mining.
South Korea also ranks among the world’s largest economies at 12th and is often cited as one of the most active retail crypto markets. The South Korean won is a consistent top-two currency by global fiat trading volume, according to Kaiko.

Related: How AI agents can reshape arbitrage in prediction markets
“Prediction markets could be a very big opportunity in the Korean market,” Heechang Kang, co-founder at research company Four Pillars, told Cointelegraph. “But I think many prediction markets are having difficulty capturing audiences because their predictions are mostly focused on Western themes.”
Japan faces similar localization challenges, where language and a lack of region-specific events limit broader adoption.
That gap has created an opening for Asia-based platforms. Prediction markets originating from the region, such as PredicXion, are attempting to localize content by focusing on region-specific events.

However, its founder and CEO Andy Cheung said local gambling regulations in key markets remain a “significant concern.”
“In these jurisdictions, authorities often classify activities involving wagering on uncertain outcomes as gambling, which is heavily restricted or outright prohibited outside of tightly controlled state-run lotteries or exceptions,” Cheung told Cointelegraph.
The argument that prediction markets and gambling are different
In China, online gambling is strictly prohibited, and access to platforms such as Polymarket is largely restricted. Some users bypass controls using VPNs to get around the country’s internet censorship, commonly known as the Great Firewall, but that does not eliminate risk.
“Many in the industry are aware of the strict legal environment in these regions, and aggressive user acquisition there does carry risks, not just for operators, but potentially for users themselves under local laws that can treat participation as illegal gambling,” Cheung said.
Regulators in South Korea and Japan have yet to directly address blockchain-based prediction markets as well, and most platforms remain accessible. Both countries, however, maintain strict limits on gambling.
In South Korea, most forms of gambling are prohibited for locals outside a narrow set of state-run exceptions, and the law extends to participation on overseas platforms. Authorities have actively pursued illegal online betting operators and, in some cases, users themselves.
Japan takes a similarly restrictive approach, where gambling is generally illegal outside regulated channels such as lotteries, horse racing and other public betting systems.

Related: Why yen stablecoins are key to Japan’s crypto ambitions
That leaves prediction markets in a gray zone, where access is possible but legal classification remains unresolved.
“Some argue that prediction markets are no different from gambling. I would dispute that,” Jaewon Kim, a researcher at Four Pillars who authored the company’s prediction markets report, told Cointelegraph.
He said the distinction lies in the type of output they produce. Gambling is largely a closed loop where users bet against the house, with outcomes that have little relevance beyond the game itself. Meanwhile, prediction markets aggregate expectations about real-world events.
“During the 2024 US presidential election, prediction markets gained significant traction and, in some cases, were more accurate than polls or expert forecasts,” Kim claimed. “That ability to reflect collective expectations is what sets them apart and gives them informational value beyond simple wagering.”

Legal classification will determine prediction markets’ future in Asia
Several prediction platforms are moving into Asia with the same playbook that defined earlier phases of crypto growth, targeting demand first and leaving regulatory clarity for later. The region offers a rare mix of scale, retail participation and underdeveloped local alternatives.
That tension is already visible on the ground. Platforms can reach users through language support and workarounds like VPNs, but none of those solve the underlying issue of classification. Major Asian markets also have some of the most restrictive legal environments for anything that resembles gambling.

Local players are beginning to test that boundary by tailoring products to regional audiences, though Cheung said platforms like PredicXion are trying to avoid “heavily restricted markets.” Most regions have yet to determine whether prediction markets fall under gambling.
The industry’s argument that prediction markets are distinct adds another layer of uncertainty. If they are treated as information markets that aggregate real-world expectations, they may eventually find a regulatory pathway similar to financial instruments.
If not, they risk being absorbed into existing gambling frameworks that leave little room for expansion.


Kalshi added Democratic strategist Stephanie Cutter as a policy adviser as the prediction market company faces legal and political pressure in the United States.
Summary
- Kalshi hired Stephanie Cutter as policy adviser while facing lawsuits and political scrutiny in Washington.
- Kalshi is building bipartisan ties as prediction markets face legal challenges from states and lawmakers.
- Federal and state officials continue fighting over who should regulate event contracts and prediction markets.
The move places another well-known political figure around the company at a time when regulators, lawmakers, and state officials continue to examine prediction markets and event contracts.
Kalshi said Cutter joined from Precision Strategies, the firm she co-founded in 2013. The company said the appointment will help it “deepen its relationships in DC and across the country.”
Kalshi co-founder and chief executive Tarek Mansour said Cutter can help the company get its message to the right people because of her experience in government and politics.
Cutter is a longtime Democratic strategist with experience in presidential and congressional politics. Her arrival adds a new policy voice to Kalshi as the company pushes to explain prediction markets to officials and the wider public. Cutter described Kalshi as a data-based platform at a time when public debate is often driven by noise and division.
The appointment also fits a broader effort by Kalshi to build ties across both major US parties. In January 2025, Kalshi named Donald Trump Jr. as a strategic adviser. That move gave the company a Republican-linked figure as it tried to expand its standing in Washington.
Kalshi opened a Washington office in January 2026 and has since held nearly 200 meetings with lawmakers and officials from across the political spectrum. That outreach shows how closely the company is tying its growth plans to policy work as prediction markets face closer review.
Legal fights keep building
Kalshi’s policy push comes as state and federal authorities continue to clash over who controls prediction markets. Arizona, Connecticut, and Illinois moved against platforms such as Kalshi and Polymarket under state gambling laws.
In response, the CFTC filed lawsuits arguing that federal law gives the agency “exclusive jurisdiction” over these markets.
Lawmakers have also raised concerns about trading tied to sensitive political and military events. Some Democrats called for more scrutiny after “suspicious trades” linked to the US invasion of Iran.
In March, Kalshi said it would add guardrails to block politicians, athletes, and other relevant people from trading in certain markets, aiming to reduce insider trading and manipulation risks.
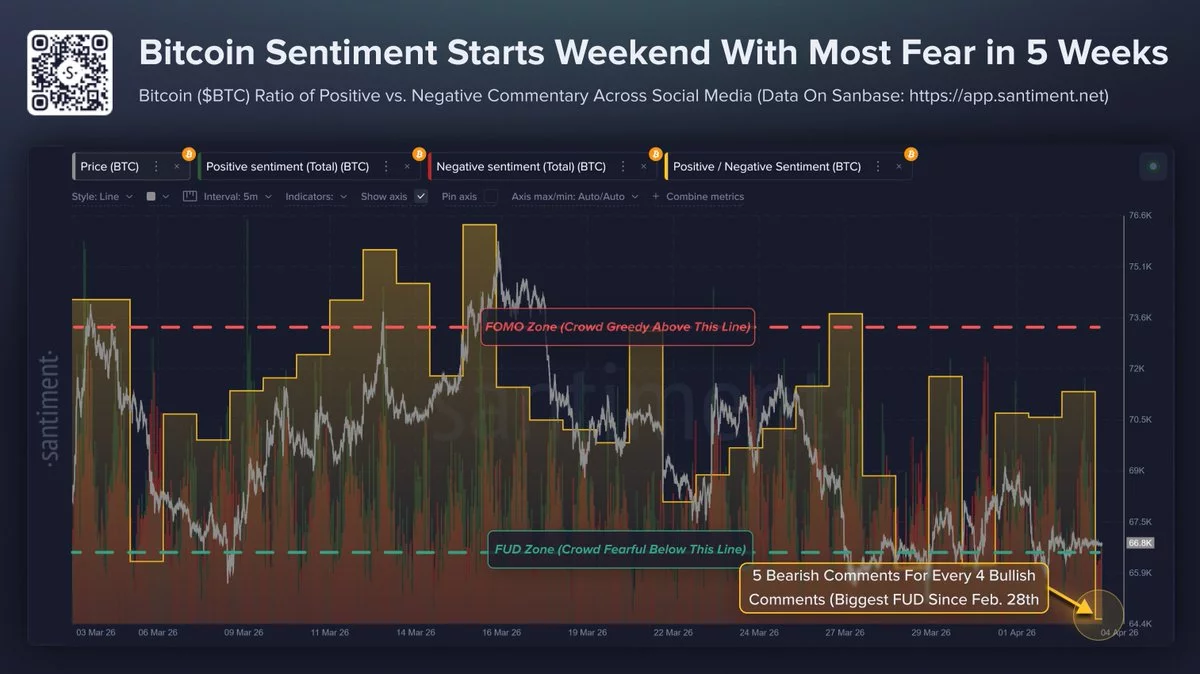
Santiment said traders were watching a small group of digital assets as the market moved into the weekend.
Summary
- Ethereum and Bitcoin led as traders tracked quantum risks, ETF flows, staking, and price pressure.
- Solana chatter rose after exploit reports, network issues, and project losses pushed security concerns higher.
- USDC, Chainlink, and Pippin gained attention through compliance claims, token unlocks, integrations, and meme-driven activity.
The social platform placed Ethereum (ETH), Solana (SOL), Bitcoin (BTC), USDC, Pippin, and Chainlink among the coins drawing the “highest trader interest” across online discussions.
Ethereum and Bitcoin stay in focus
Ethereum drew strong attention as traders discussed security, custody, and market activity. Posts centered on a new white paper about quantum computing risks tied to ECDSA signatures, which protect Ethereum accounts, admin keys, and some on-chain data.
At the same time, traders tracked reports that the Ethereum Foundation staked “around 45,000 to 70,000 ETH.” Social activity also picked up around ETF flow data, Charles Schwab’s plan to offer spot Bitcoin and Ethereum trading, and Ethereum’s price near the $2,000 level.

Bitcoin also remained active in social discussions during the same period. Much of the debate followed a Google Quantum AI white paper that raised fresh talk about how quantum systems could affect Bitcoin’s long-term security model.
Traders also linked Bitcoin’s recent move near the “$67,000 to $70,000” range to wider macro pressure. Social posts pointed to Middle East tensions, oil market fears, corporate treasury buying, and planned retail access through Charles Schwab’s crypto product.
Solana and USDC face risk-driven chatter
Solana social activity rose after reports of a major Drift Protocol exploit that “drained roughly $270 million to $286 million.” Traders also discussed losses across projects tied to the Solana ecosystem and the effect on network confidence.
Online posts also focused on outage claims, failed transactions, slow confirmations, and wallet connection issues. Validator updates and project comments added to the discussion as traders watched for signs of recovery.
USDC also moved into focus after investigator ZachXBT published a dossier about Circle’s compliance record. The report claimed Circle had seen “over $420 million in compliance lapses since 2022” tied to delayed freezes and response actions.
That report spread across X, Reddit, and Telegram. Traders also discussed USDC’s role in cross-border payments, DeFi liquidity, and multichain transfers while questioning custody and freeze controls.
Pippin and Chainlink draw attention
Pippin gained traction as traders treated it like a social-driven memecoin. Posts described it as a token powered by online hype, fast price swings, and rising community attention instead of project fundamentals.
Chainlink drew interest after reports of a quarterly unlock of about 19 million LINK. Traders focused on the share sent to Binance, the amount moved to multisig wallets, and new discussion around Chainlink integrations and oracle tools.
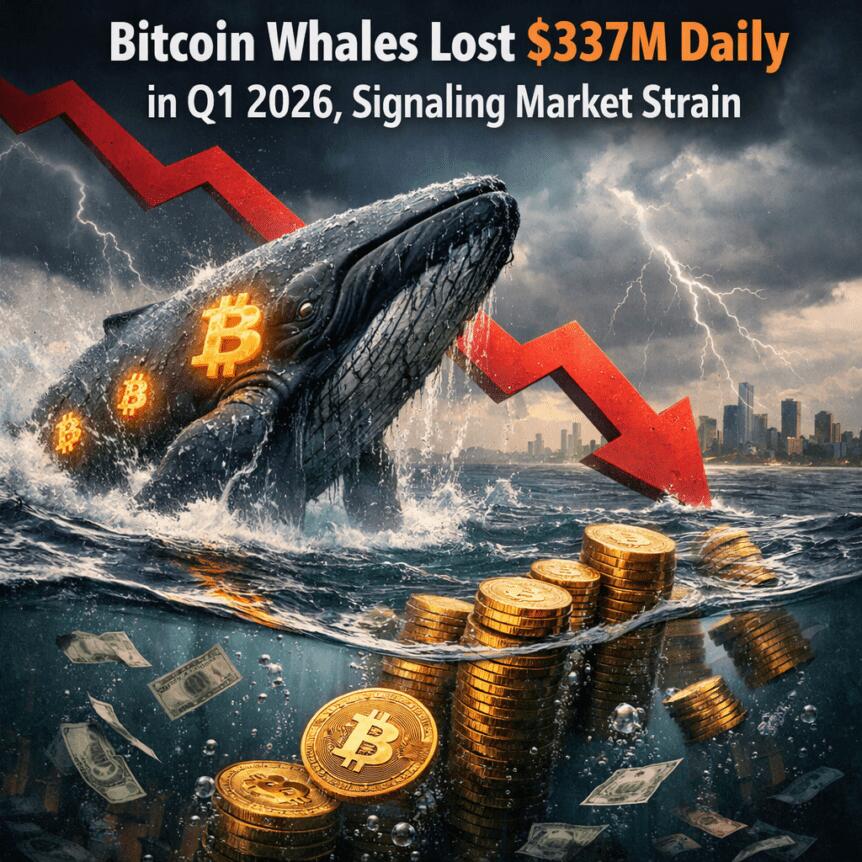
Bitcoin traders with mid- to large-sized holdings continued to lock in losses at a startling pace in Q1 2026, according to on-chain analytics from Glassnode. Data shows that wallets holding 100–10,000 BTC realized losses averaging about $337 million per day—the strongest quarterly signal of capitulation since 2022. The developing pattern combines with persistent losses among long-term holders to raise questions about how far the market may slide before a potential bottom forms.
Key takeaways
- In Q1 2026, sharks (100–1,000 BTC) realized losses around $188.5 million per day, while whales (1,000–10,000 BTC) realized roughly $147.5 million per day, totaling about $336 million daily on average and roughly $30.91 billion in realized losses for the year so far.
- These figures place Q1 2026 among the most severe periods for on-chain realized losses among large BTC holders, behind only Q2 2022’s peak daily loss rate of about $396 million.
- Long-term holders (coins held for more than six months) are also selling at a loss, with losses running near $200 million per day on a 30-day average since late 2025, signaling broader capitulation beyond the largest wallets.
- Analysts note that the current pressure mirrors some of the macro and systemic stress seen in 2022, involving inflation concerns, liquidity outflows, and investor risk-off dynamics tied to macro events and sector-wide volatility.
- Looking ahead, some market observers point to a potential bottom in the $40,000–$50,000 range, but acknowledge substantial uncertainty as macro risks persist and on-chain dynamics evolve.
Capitulation among BTC whales and sharks
Glassnode’s realized loss metric tracks the dollar value of losses locked in when BTC is sold below its purchase price. In Q1 2026, the two key cohorts—sharks (addresses holding 100–1,000 BTC) and whales (1,000–10,000 BTC)—showed pronounced downside pressure. Sharks realized losses at an average of about $188.5 million per day, while whales contributed roughly $147.5 million daily. Combined, large holders have locked in around $30.91 billion in realized losses for 2026 thus far.
These levels mark one of the harshest on-record periods for large holders and come as BTC faces a confluence of macro headwinds. In Q2 2022, Bitcoin experienced more than a 50% price drop, followed by further declines as liquidity drained during the Terra collapse, Celsius disruptions, and the broader market turmoil surrounding the collapse of major crypto ventures. The current quarter’s pace suggests a renewed wave of capitulation among mid- to large-sized investors are bracing for additional downside as macro risks intensify.
Beyond the immediate price action, the on-chain data underscore a reluctance among significant holders to endure ongoing macro stress without reinforcing downside protection. The net result is pressure on supply dynamics and potential liquidity constraints that could complicate a swift recovery if risk-off sentiment persists.
Long-term holders under pressure
Another facet of the broader drawdown in BTC comes from Long-Term Holders (LTHs). Glassnode’s Long-Term Holder Realized Loss chart indicates that losses among LTHs remain elevated, averaging approximately $200 million per day on a 30-day basis since November 2025. In the view of Glassnode analysts, a cooldown toward daily losses well below $25 million would be a meaningful signal of exhaustion in selling pressure and a prerequisite for the base formation that historically precedes a sustainable bull market transition.
“A meaningful cooldown toward levels below $25M per day would represent a more compelling signal of exhaustion in selling pressure. A prerequisite for the base formation that historically precedes a sustainable bull market transition.”
Macro headwinds and the road ahead
The Q1 2026 snapshot arrives amid a broader mix of risk factors that have historically intersected with BTC drawdowns. Analysts cite inflation dynamics tied to energy and geopolitical developments, as well as innovation-driven market turbulence—ranging from concerns around quantum-resilience to the AI-driven risk trade—as pressures that can amplify drawdowns in risk assets, including Bitcoin. These factors echo the kind of rapid-downside catalysts seen during 2022’s crypto bear market, complicating calls for a rapid turnaround.
Some market observers have floated a potential bottom in the vicinity of $40,000–$50,000, framing it as a plausible reversal zone if supply-demand dynamics align with a cooling in realized losses and a stabilizing macro backdrop. Yet others caution that until on-chain metrics show sustained improvement and macro uncertainty lightens, a definitive bottom remains elusive.
This analysis reflects advanced on-chain research and is not investment advice. Investors should monitor how realized losses trend in the coming quarters and how on-chain activity aligns with price action before drawing conclusions about a durable bottom.
As the market weighs these signals, the next steps for BTC investors may hinge on whether the current capitulation can ease and whether price formation can establish a technical base that precedes any meaningful recovery.

Russia’s campaign to block Telegram and restrict Virtual Private Networks (VPNs) triggered a nationwide banking outage on April 3, disrupting card payments, ATMs, and digital transfers country-wide.
Telegram founder Pavel Durov claims the app still has 65 million daily active users in Russia despite the full block.
Censorship Backfires on Russia’s Financial Infrastructure
According to The Moscow Times, Sberbank, VTB, and T-Bank all reported widespread service failures on April 3.
Payment terminals displayed errors, ATMs stopped dispensing cash, and mobile banking apps went offline for hours.
Fyodor Muzalevsky, technical director at IT security firm RTM Group, told reporters that the VPN-blocking measures likely contributed to the disruption.
Preliminary reports pointed to erroneous blocking of IP addresses tied to banking infrastructure.
The Moscow metro reportedly allowed free passage through turnstiles. Some shops and public venues, including at least one zoo, switched to cash-only payments.
Telegram Holds Ground Despite Full Block
Russia’s internet regulator, Roskomnadzor, began throttling Telegram in February 2026, with a nationwide block taking effect around April 1.
The push aimed to migrate users to MAX, a state-backed messaging app controlled by a Gazprom subsidiary.
However, Durov’s numbers suggest the strategy has failed.
“For accuracy, over 50M Russians send at least one message every day, with 65M daily active users in Russia overall despite the ban,” wrote Durov.
Before the restrictions, Telegram had roughly 96 million users in Russia, according to the Carnegie Endowment for International Peace.
The app serves as a primary news source, communication tool, and even a military coordination channel for Russian soldiers in Ukraine.
VPN Adoption Surges as Kremlin Doubles Down
Russia’s Digital Development Ministry ordered major online platforms to block VPN users by April 15. Proposed legislation would also impose fines of up to 30,000 rubles on individuals caught using unauthorized VPNs.
As of January 2026, Roskomnadzor had already restricted more than 400 VPN services, a 70% increase from autumn 2025.
Yet VPN usage continues to climb. Authorities in 83 Russian regions have imposed mobile internet shutdowns at least once since May 2025, typically limiting access to a government-curated whitelist of approved sites.
These measures have made VPNs a daily necessity for millions.
The April 3 banking outage illustrates the collateral risks of aggressive internet filtering.
Moscow could adjust its approach or press forward with deeper restrictions before the April 15 deadline. The move they make could determine the next phase of this digital standoff.
The post Russia’s War on Telegram Hillariously Backfired, Claims Pavel Durov appeared first on BeInCrypto.
Crypto World
LayerZero, Canton, and Zero Blockchain Are Building the Rails for Institutional Cross-Chain Value

TLDR:
- LayerZero has integrated 165+ chains and processed over $200B in volume, creating deep operational lock-in for builders.
- Canton Network processes $8T in monthly RWAs and $350B daily in Treasury repo, with LayerZero as its only live interoperability rail.
- On-chain data shows coordinated ZRO accumulation between $1.30–$2.00, with sizing patterns inconsistent with typical retail behavior.
- Activating the fee switch on $150B in annualized volume would shift ZRO’s valuation from pure optionality to measurable cash flow.
LayerZero, Canton Network, and Zero Blockchain are drawing attention as a potential interoperability stack in the crypto space.
Analysts and on-chain observers are tracking how these three protocols connect crypto-native messaging, institutional liquidity, and execution infrastructure.
The arrangement positions ZRO as a central asset across gas, staking, and value capture functions. Early accumulation patterns and institutional backing are adding weight to the narrative.
Institutional Rails and Network Lock-In
LayerZero has integrated over 165 chains and processed more than $200 billion in cross-chain volume. That scale creates what researchers describe as “infra gravity.” Once an application builds on a messaging layer, migration becomes operationally expensive.
Switching providers for marginal fee savings means reworking compliance systems, risk models, and liquidity routing. That dependency is where network effects become structural rather than speculative.
Canton Network adds a different dimension to this stack. It connects over 800 institutional firms, including Goldman Sachs and J.P. Morgan. The network processes roughly $8 trillion in real-world assets monthly and around $350 billion in U.S.
Treasury repo volume daily. LayerZero is currently the only interoperability rail operating inside that environment. That positioning means the cross-domain liquidity rails for institutions are already in place.
Researcher Nick Research noted on X: “LayerZero is the only interoperability rail live inside that environment. It means if institutional liquidity ever needs to move cross-domain, the rails are already chosen.”
That framing points to a first-mover advantage that is operational rather than theoretical. The integration is live, not pending.
Zero Blockchain rounds out the stack as an execution layer. Its backers include Citadel Securities and the DTCC. Those are not venture bets on technology — they are strategic positions from firms that process real financial volume. The thesis is that interoperability with proper execution controls is where value capture actually concentrates.
On-Chain Signals and the Fee Switch
On-chain data has started reflecting accumulation behavior ahead of any major narrative shift. Clusters of wallets funded through Coinbase Prime accumulated tens of millions in ZRO between $1.30 and $2.00.
The buying patterns showed identical sizing and tight timing, which does not match typical retail activity. Long-duration holders including a16z and ARK have also taken multi-year positions in the asset.
The fee switch is the mechanism that would make this shift visible at the protocol level. Currently, LayerZero routes approximately $150 billion in annualized cross-chain volume with no protocol revenue.
Once fees activate, the valuation framework moves from optionality toward cash flow. That transition tends to reprice assets quickly when it happens on top of an embedded network.
Nick Research summarized the stack plainly: “LayerZero is the messaging layer → Canton is the institutional liquidity pool → Zero is where that liquidity can actually settle and scale.”
The value capture relative to how far network effects have already progressed remains the core observation driving current interest.

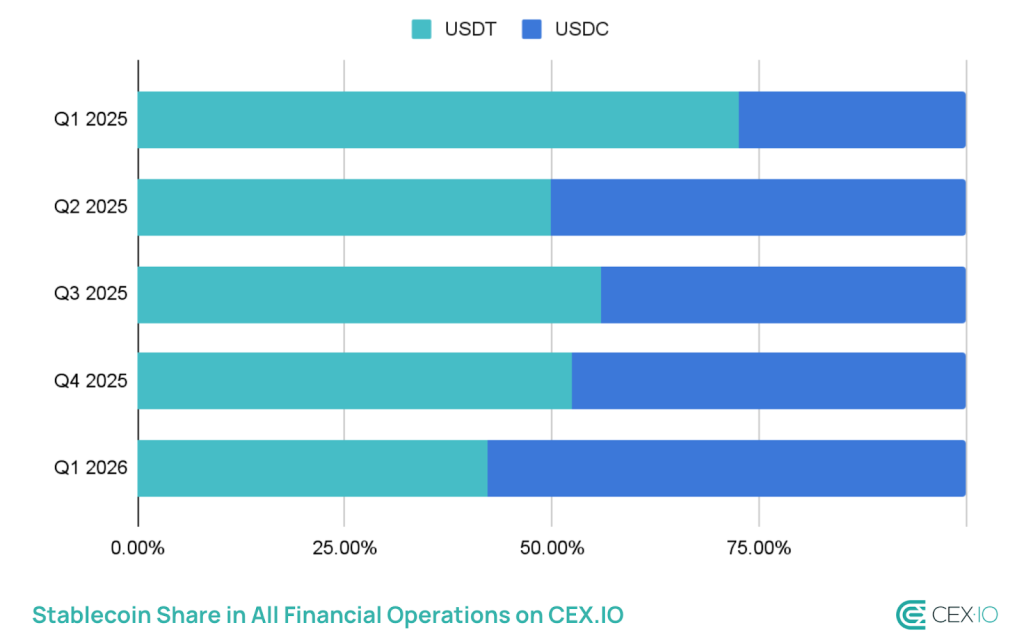
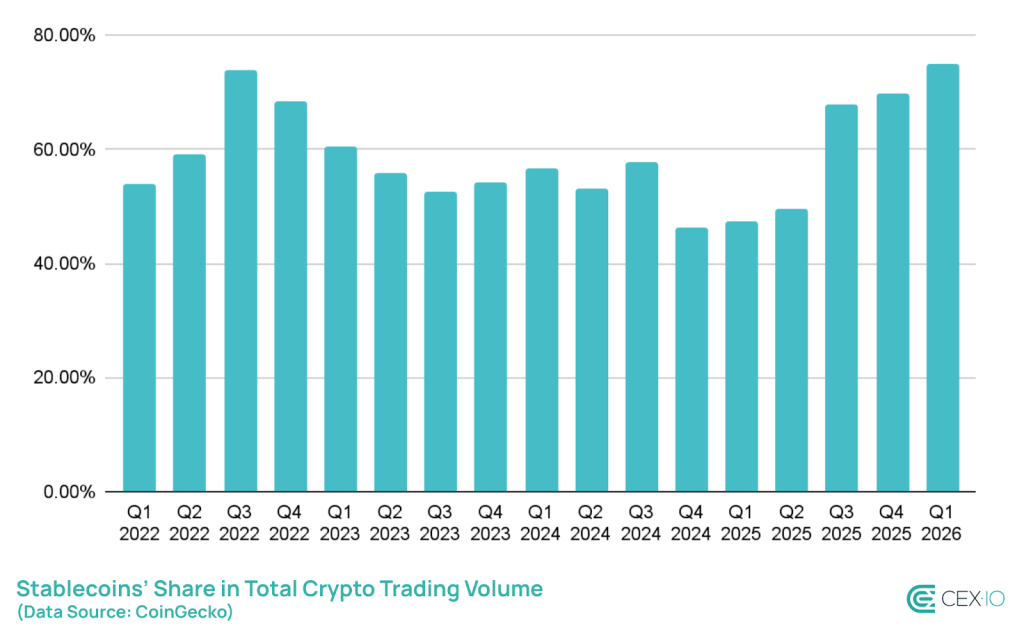
Total stablecoin supply reached a record $315 billion in Q1 2026, rising roughly $8 billion quarter-over-quarter even as the broader crypto market contracted.
The headline figure masks a sharper story underneath: USDC is taking ground from USDT, and the gap is closing faster than most market participants expected.
USDC supply surged 220% since late 2023 to approximately $78 billion, driven by institutional B2B settlement, payroll infrastructure, and programmatic payment rails built by Visa and Stripe.
USDT, still the dominant issuer by raw supply, saw its share slip – a divergence CEX.IO flagged as one of the quarter’s defining market dynamics.
- Total stablecoin supply hit a record $315B in Q1 2026, up ~$8B QoQ – the slowest growth since Q4 2023, but still expansion during a market contraction.
- Stablecoins accounted for 75% of total crypto trading volume in Q1 – the highest share on record.
- Total stablecoin transaction volume topped $28 trillion, exceeding Visa and Mastercard combined.
- USDC supply surged 220% since late 2023 to ~$78B; USDT’s market share slipped amid the divergence.
- Retail-sized transfers fell 16% – the steepest drop on record – while bots drove approximately 76% of all stablecoin transaction volume.
- Yield-bearing stablecoins now represent a $3.7 billion subsector, introducing new fragmentation and regulatory risk.
Discover: The best crypto to diversify your portfolio during market turbulence
Stablecoins also captured 75% of total crypto trading volume in Q1 – the highest share on record – while total transaction volume topped $28 trillion, a figure that now regularly exceeds those of major payment networks like Visa and Mastercard combined. Growth rate slowing is real; demand evaporating is not.
USDC Gain Is a Regulatory Story, Not Just a Market Share Story
The USDC surge is not organic retail adoption. CEX.IO’s data points to institutional programmatic money – B2B corridors, payroll settlement, treasury management, as the primary driver.
USDC’s transaction velocity hit 90x with an average transfer size of $557, a profile consistent with frequent, smaller institutional transactions rather than whale moves.

Circle’s positioning ahead of potential U.S. stablecoin legislation has been deliberate. With the Clarity for Payment Stablecoins Act still under debate and regulatory frameworks for digital assets evolving in Washington, regulated issuers like Circle have a structural advantage in onboarding compliance-sensitive institutional capital. That distinction matters – it’s not market share gained on yield or liquidity depth alone.
Analysts reviewing the quarter described the shift bluntly: “This isn’t retail adoption; it’s institutional programmatic money.” The number that confirms it is USDC’s average transfer size of $557 – dwarfed in absolute terms by USDT’s larger individual trades, but indicative of high-frequency, automated institutional flows that mirror broader tokenization and institutional adoption trends reshaping digital asset infrastructure.
If U.S. stablecoin legislation passes with provisions favoring regulated, audited issuers, USDC’s gain becomes structural. If it stalls, the competitive edge narrows and USDT’s entrenched liquidity depth reasserts dominance.
USDT Still Leads – But the Competitive Moat Is Narrowing
USDT remains the largest stablecoin by supply and the dominant liquidity instrument across emerging market corridors and Tron-based DeFi.
Its concentration on Tron, where low fees drive retail and cross-border transfer volume, gives it a user base that USDC’s Ethereum-centric institutional footprint doesn’t directly compete with. Yet.
The Q1 slip in USDT’s market share comes alongside the steepest recorded drop in retail-sized transfers – down 16% – which cuts at one of USDT’s core use cases.
Simultaneously, bots now account for approximately 76% of all stablecoin transaction volume, meaning the organic retail demand that historically anchored USDT’s dominance in high-frequency small-value transfers is contracting.
CEX.IO flagged this as evidence of “a more sophisticated, but potentially less organic, market structure.”
Tether’s response has been limited to quarterly reserve attestations and geographic expansion rather than product-level innovation. That’s a defensible posture while it holds network effects.
It becomes a liability if institutional capital flows continue rotating into regulated instruments and USDC’s programmatic integrations deepen across Western payment infrastructure.
Watch Circle’s May attestation and Tether’s Q2 report for whether the supply divergence widens. If USDC crosses $90 billion while USDT stagnates, this quarter’s share shift stops looking like a blip and starts looking like a trend.
The $315 billion total supply figure tells you stablecoins are the market’s load-bearing layer. The USDC/USDT split tells you who’s building on top of it.
Explore: The best pre-launch token sales with asymmetric upside potential
The post Stablecoin Crypto Supply Hits $315B in Q1 as USDC Gains, USDT Slips appeared first on Cryptonews.


SpaceX has submitted a confidential draft registration to the U.S. Securities and Exchange Commission, targeting a $1.75 trillion valuation and a raise of up to $75 billion — what would be the largest initial public offering in financial history.
Summary
- SpaceX filed confidentially with the SEC on April 1, 2026, targeting a June Nasdaq listing at up to $1.75 trillion
- The proposed $75 billion raise would more than double Saudi Aramco’s 2019 record of $29 billion and triple Alibaba’s $22 billion U.S. IPO record
- Starlink’s 9.2 million subscribers and approximately $16 billion in 2025 revenue anchor the valuation, alongside the February 2026 merger with Musk’s xAI
The filing, internally codenamed “Project Apex,” was first reported by Bloomberg and confirmed independently by CNBC and Reuters. SpaceX has not publicly commented. A confidential filing allows a company to submit its financials to the SEC for regulatory review before making them public — a standard step before a roadshow.
According to CNBC, 21 banks have been lined up to manage the offering, with Bank of America, Citigroup, Goldman Sachs, JPMorgan Chase, and Morgan Stanley holding senior bookrunner roles. SpaceX is also exploring a dual-class share structure to preserve insider voting control and plans to allocate up to 30% of shares to retail investors — roughly three times the typical norm.
At $1.75 trillion, SpaceX would rank above every S&P 500 company except Nvidia, Apple, Alphabet, Microsoft, and Amazon.
The valuation rests primarily on Starlink, SpaceX’s satellite internet division. The service ended 2025 with 9.2 million subscribers across 150 countries, generating approximately $16 billion in annual revenue, with projections pointing toward $22 billion by year-end 2026. SpaceX merged with Musk’s AI venture xAI in February 2026, folding the Grok chatbot and social network X into a single entity that Musk valued at $1.25 trillion at the time. The company has accumulated more than $24.4 billion in federal government contracts since 2008, spanning NASA, the Air Force, and Space Force, according to FedScout.
Musk’s Path to Trillionaire Status
Musk owns approximately 44% of SpaceX. His current net worth sits at roughly $823 billion, according to Forbes. A successful listing at the target valuation would push him toward becoming the first individual in history to surpass $1 trillion — and the first person to simultaneously lead two separate trillion-dollar publicly traded companies. Tesla currently carries a market cap of approximately $1.4 trillion.
The filing positions SpaceX ahead of OpenAI and Anthropic, which are both reportedly weighing public offerings before year’s end. If all three proceed, Bloomberg has described 2026 as potentially the most consequential year for technology IPOs since the dot-com era.
The SpaceX name has long been exploited in crypto markets through impersonation scams — a pattern documented across multiple platforms and token launches — though the IPO itself represents an altogether different category of market event. It arrives at a moment of intensifying institutional appetite for new financial products, a trend visible across crypto ETF launches and alternative asset offerings that Wall Street is moving quickly to capture.

Why Bearish Bets and ETF Flows May Spark a Rally
In Just 4 Days, Margot Robbie’s Gothic Romance Becomes a Streaming Success
Debenhams Concept Football Half Zip Midlayer Top Collection

Smart energy pays enters the US market, targeting scalable financial infrastructure

Why Israel is blocking foreign journalists from entering

Bitcoin: We’re Entering The Most Dangerous Phase

Looks Like With Magic, You Can Make Some Good Money #magic #magictricks #tvclips #tvshow #magicshow

How Much Money Does LeBron James Actually Take Home? #nba #basketball #money #breakdown

Smart Money Wallet Tips for Financial Growth
-

 NewsBeat2 days ago
Steven Gerrard disagrees with Gary Neville over ‘shock’ Chelsea and Arsenal claim | Football
-

 Business2 days ago
No Jackpot Winner and $194 Million Prize Rolls Over
-

 Fashion19 hours ago
Weekend Open Thread: Spanx – Corporette.com
-
Entertainment5 days ago
Fans slam 'heartbreaking' Barbie Dream Fest convention debacle with 'cardboard cutout' experience
-

 Crypto World3 days ago
Gold Price Prediction: Worst Month in 17 Years fo Save Haven Rock
-

 Tech5 days ago
The Pixel 10a doesn’t have a camera bump, and it’s great
-
Crypto World4 days ago
Dems press CFTC, ethics board on prediction-market insider trades
-
 Entertainment7 days ago
Lana Del Rey Celebrates Her Husband’s 51st Birthday In New Post
-

 Tech5 days ago
Avatar Legends: The Fighting Game comes out in July and it looks pretty slick
-

 Tech4 days ago
EE TV is using AI to help you find something to watch
-

 Sports4 days ago
Tallest college basketball player ever, standing at 7-foot-9, entering transfer portal
-

 Business2 days ago
Login and Checkout Issues Spark Merchant Frustration
-

 Fashion6 days ago
Amazon Sundays: Soft Spring Layers
-

 Tech6 days ago
Elon Musk’s last co-founder reportedly leaves xAI
-

 Fashion5 days ago
The Best Spring Trends of 2026
-

 Tech4 days ago
How to back up your iPhone & iPad to your Mac before something goes wrong
-

 Politics5 days ago
Should Trump Be Scared Strait?
-

 Tech5 days ago
Apple will hide your email address from apps and websites, but not cops
-

 Crypto World5 days ago
U.S. rule change may open trillions in 401(k) funds to crypto
-

 Tech4 days ago
Flipsnack and the shift toward motion-first business content with living visuals
You must be logged in to post a comment Login