
CryptoCurrency
Bitcoin Price Edges Up As BTC Faces Worst November In 7 Years

Join Our Telegram channel to stay up to date on breaking news coverage
The Bitcoin price edged up a fraction of a percent in the past 24 hours to trade at $91,480 as of 2:29 a.m. EST on trading volume that plunged 32% to $51.4 billion.
BTC is still down almost 17% so far this month, as it heads for its worst performance in November since 2019. A year before that, Bitcoin slumped 36.5%, according to Coinglass data.
Meanwhile, Sumit Kapoor, a crypto educator, noted that, “Every time Bitcoin has had a red November, December has also ended red.”
📉 Bitcoin isn’t having a great November$BTC is already down around 20% this month. Normally November is one of Bitcoin’s strongest months, but with just 5 days left and a slow Thanksgiving weekend coming it’s on track to be the worst November since 2018.
Every time Bitcoin… pic.twitter.com/ADmSSttPW3
— Sumit Kapoor (@moneygurusumit) November 26, 2025
In another development, CME Group temporarily suspended trading across its Globex platform after a cooling failure at a CyrusOne data center. It hit late on November 27 in US time and continued into Asian trading hours on November 28.
NEW: CME FUTURES HAVE BEEN HALTED FOR OVER 4 HOURS – OVER 2 HOURS AGO, @CMEGroup SAID ON X “DUE TO A COOLING ISSUE AT CYRUSONE DATA CENTERS, OUR MARKETS ARE CURRENTLY HALTED. SUPPORT IS WORKING TO RESOLVE THE ISSUE IN THE NEAR TERM…”
SOURCE: https://t.co/chbaqirRSi pic.twitter.com/yWMs1vvgYr
— DEGEN NEWS (@DegenerateNews) November 28, 2025
The suspension disrupted financial markets across various sectors, including benchmarks tied to the S&P 500 and the Nasdaq 100. BTC and ETH futures also went offline. CME has confirmed that it is working to restore full operations.
Bitcoin Price Shows Signs Of A Recovery Above Key Resistances
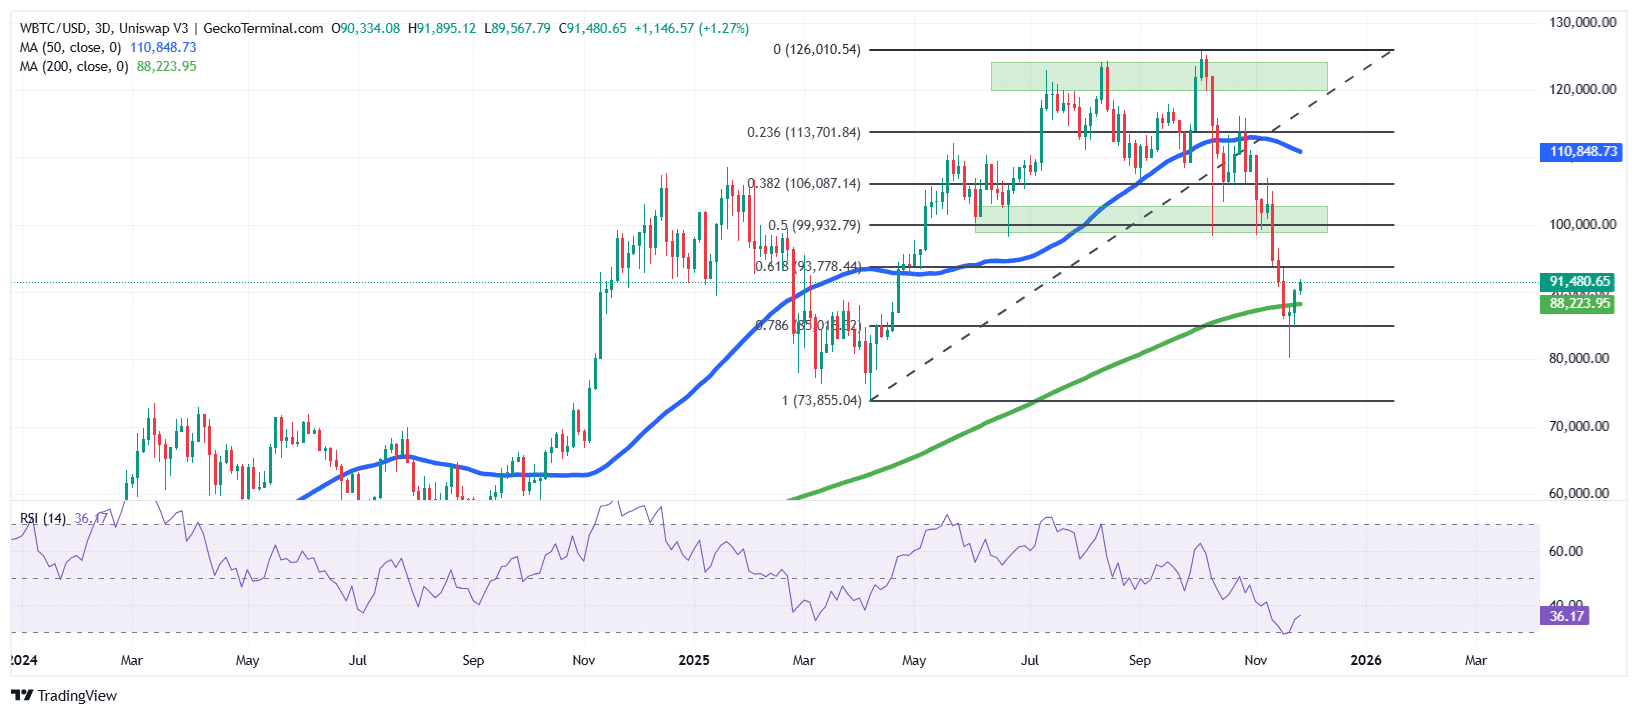
The BTC price, after a drop from the $108,000 level in February, found support around the $79,000 level between March and April.
This area enabled Bitcoin’s price to soar, breaching several key Fibonacci retracement levels. The surge pushed the price of BTC to an all-time high (ATH) of around $126,000.
However, after hitting this resistance level (0 Fib level), Bitcoin then corrected, dropping further below the 0.786 Fib zone to around $80,500.
This level is now acting as a cushion against downward pressure, with buyers stepping in to push the largest cryptocurrency by market capitalization towards the 0.618 Fib level ($93,778), which now serves as the immediate resistance.
The drop from the ATH allowed the BTC price to break below the 50-day Simple Moving Average (SMA) ($110,848). Meanwhile, with the recovery now set, Bitcoin has crossed above the 200-day SMA ($88,223), a sign that BTC could be poised for a sustained recovery on the 3-day chart.
Moreover, the Relative Strength Index (RSI) is also on the verge of a retracement, as the indicator is recovering from the 30-oversold region, currently at 36, and still climbing. This suggests buyers may be stepping in to regain control, which could be a bullish signal.
BTC Price Prediction
According to the BTC/USD chart analysis on the 3-day timeframe, Bitcoin is gearing up for a sustained recovery, given the surge above the 200-day SMA and the upcoming RSI.
If the surge continues and the BTC price regains the $93,778 level (0.618 Fib level), the bulls could push the asset even further, targeting prices above the $100,000 zone, a previous support area.
Conversely, if the bears breach the $85,016 downside level, the price of Bitcoin could drop further to the support area around $73,855.
Ali Martinez, an influential analyst with over 163k followers on X, says that the $84,570 level is a key area to watch on the downside, and the $112,340 area on the upside.
For Bitcoin $BTC, $84,570 is the support that matters, and $112,340 is the ceiling to watch. pic.twitter.com/rI0dhCgiMK
— Ali (@ali_charts) November 27, 2025
Related News:
Best Wallet – Diversify Your Crypto Portfolio

- Easy to Use, Feature-Driven Crypto Wallet
- Get Early Access to Upcoming Token ICOs
- Multi-Chain, Multi-Wallet, Non-Custodial
- Now On App Store, Google Play
- Stake To Earn Native Token $BEST
- 250,000+ Monthly Active Users
Join Our Telegram channel to stay up to date on breaking news coverage


