
Crypto World
Bitcoin price eyes reversal as IFP indicator flips bullish
Bitcoin price is showing early signs of a possible trend shift after a key on-chain indicator flashed a rare bullish signal, even as the market continues to consolidate.
Summary
- Bitcoin’s Inter-exchange Flow Pulse crossed above its 90-day moving average for the first time since early 2025.
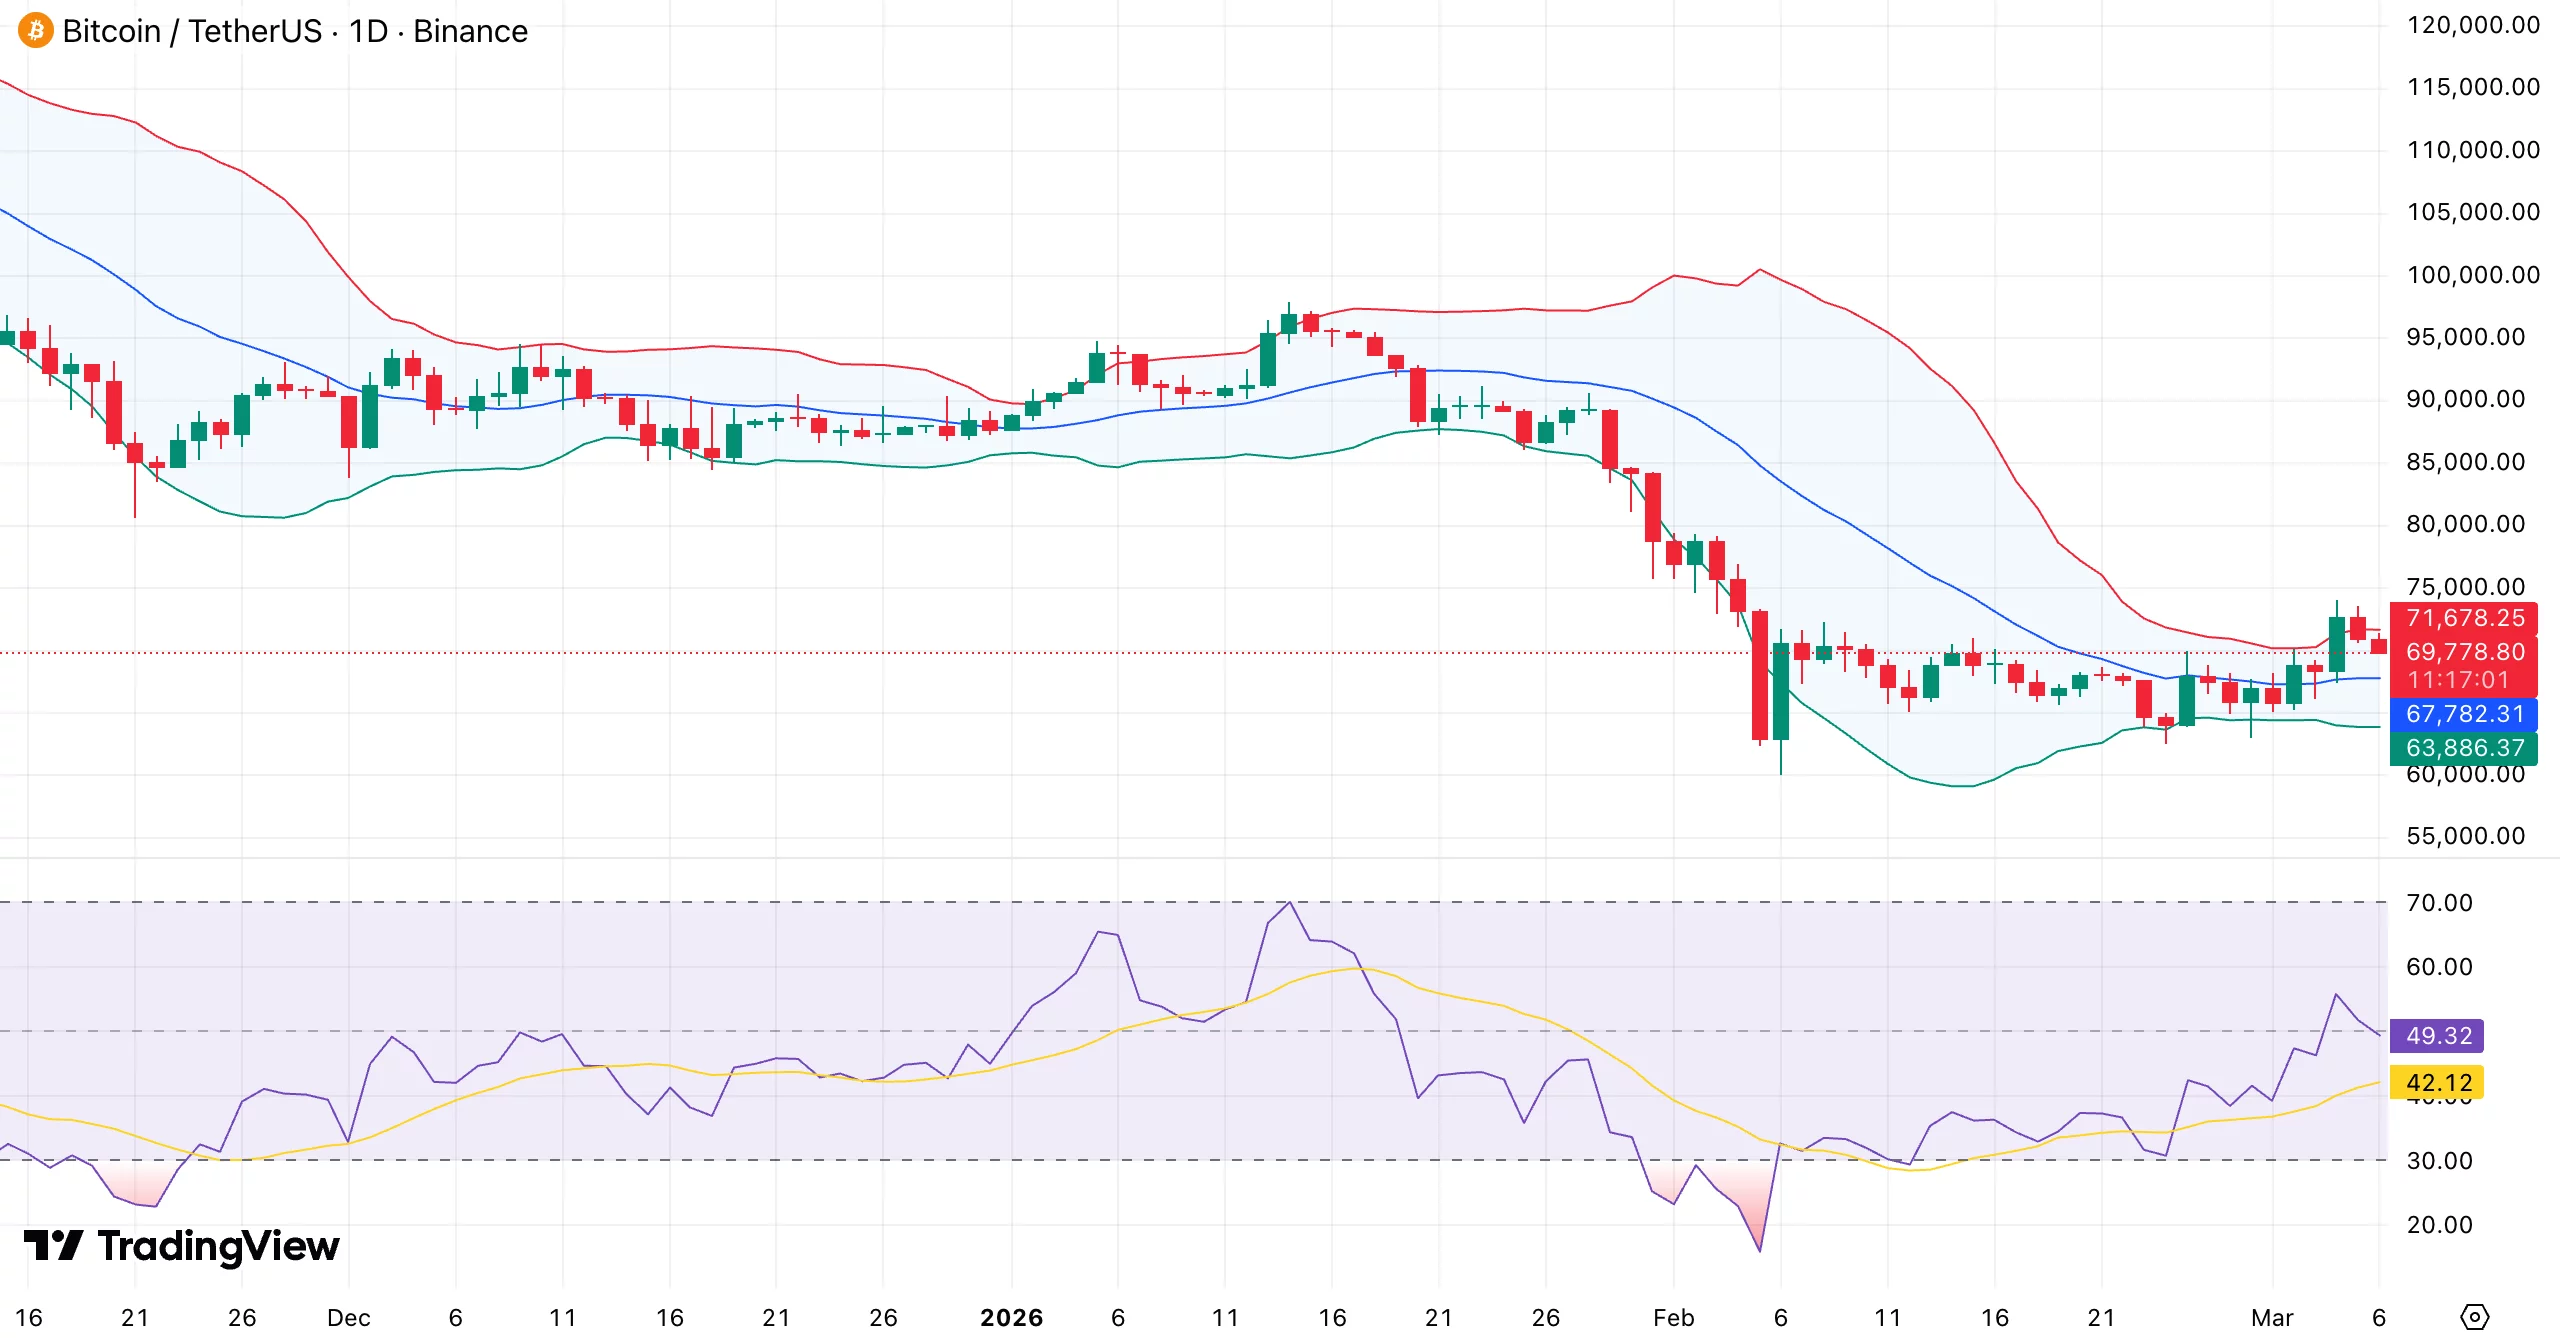
- BTC is consolidating between $67K and $72K after a sharp drop from the $95K region.
- A breakout above $72K could open the path toward the $75K–$78K resistance zone.
Bitcoin (BTC) was changing hands at around $70,080 at the time of writing. That represents a 3.7% decline over the past 24 hours. Even so, the price remains close to the top of its weekly trading band, which currently spans from $63,176 to $73,669.
Short-term weakness hasn’t erased the gains seen over the past week. BTC is still up about 5.8% during that period. Over the last month, however, the trend is slightly negative, with the asset down around 8%. Compared with its October 2025 peak of $126,080, Bitcoin is still trading roughly 44% below its all-time high.
Market participation has also slowed. During the last 24 hours, trading volume dropped to $47.99 billion, a decline of more than 32%. Such pullbacks in activity are common during consolidation phases, when traders step back and wait for clearer direction.
The derivatives market tells a similar story. Data from CoinGlass shows trading volume in derivatives contracts falling by 23% to $72 billion. Open interest also slipped, declining 8% to $45 billion as some leveraged positions were closed.
IFP indicator signals renewed risk appetite
Amid this quieter market environment, fresh on-chain data is drawing attention. Analysts at CryptoQuant report that Bitcoin’s Inter-exchange Flow Pulse has moved above its 90-day moving average.
The shift marks the first time the metric has crossed that level in roughly a year, according to a March 6 report by CryptoQuant contributor RugaResearch.
To understand why this matters, it helps to look at what the indicator measures. The IFP tracks Bitcoin transfers between spot exchanges and derivatives platforms.
A rise in flows toward derivatives venues often signals that traders are preparing leveraged positions in anticipation of potential upside. When the movement heads toward spot exchanges instead, speculation in the market usually declines.
Looking back at historical data adds more context. Since 2016, similar IFP crossovers have frequently appeared near the early stages of bullish cycles. That said, the signal does not always translate into immediate price rallies. In some cases, the market took time to react.
The indicator had spent nearly a full year below its long-term average before this latest development. It turned bearish in early 2025 and remained there throughout much of the year, making it one of the longest negative stretches recorded for the metric.
Bitcoin price technical analysis
On the price chart, Bitcoin appears to be stabilizing after a steep fall earlier in the year. The drop began in the $95,000–$100,000 range and eventually pushed the price down to around $63,000, where buyers finally stepped in.
Since reaching that level, price movement has been largely sideways. This type of behavior often signals that selling pressure is easing while demand slowly returns.

For several weeks now, BTC has traded within a relatively tight corridor between $67,000 and $72,000. Markets often behave this way during accumulation phases, when participants quietly re-position before the next significant move.
The immediate hurdle sits at $72,000. If buyers manage to push the price above that level and secure a strong daily close, a breakout from the range could follow. In that case, attention would likely shift toward the $75,000–$78,000 region, where another supply zone is expected.
Below the current price, support continues to hold around $67,000. A deeper demand area can be found near $63,000, the same region that previously stopped the earlier sell-off.
That dip toward $63,000 may not have been accidental. In many markets, prices briefly fall below a key support level to trigger stop-loss orders before reversing direction.
This type of move is often referred to as a liquidity sweep. Bitcoin quickly rebounded after touching that area, reclaiming $67,000 soon afterward as buying pressure absorbed the sell-off.
Volatility has also been shrinking as the range tightens. Historically, quieter phases like this tend to precede stronger directional moves.
A breakout above $72,000 would likely strengthen bullish momentum and open the path toward higher resistance levels. On the other hand, losing support at $67,000 could weaken the recovery structure and bring the $63,000 demand zone back into focus.


Quick Overview
- Citigroup experiences 3.9% decline to $108 during trading session
- Bank evaluates regional institutions with $500B in assets for acquisition
- Recent asset sales generate $6.5B in capital for strategic initiatives
- Share price trails targets despite 78% surge in corporate banking revenue
- Digital asset infrastructure development continues with Bitcoin custody services
Shares of Citigroup retreated to $108.01, marking a 3.91% decline as market participants reacted to the financial institution’s strategic expansion initiatives. The stock experienced consistent downward momentum throughout the session, signaling investor uncertainty regarding the bank’s growth trajectory. Nevertheless, this pullback occurred against a backdrop of solid capital reserves and comprehensive organizational transformation.
Regional Banking M&A Strategy Takes Center Stage
Citigroup is actively assessing opportunities to acquire a US-based regional banking institution or wealth management firm to enhance its domestic footprint. This strategic initiative targets improved deposit gathering, expanded physical presence, and enhanced credit distribution capabilities. As a result, management seeks to narrow the competitive gap with dominant American banking rivals.
Discussions have centered on organizations managing approximately $500 billion in total assets, alongside established securities firms. Prospective candidates include wealth management platforms such as Stifel and Raymond James, both known for robust client advisory operations. Nevertheless, regulatory clearance remains a prerequisite given current supervisory restrictions.
Chief Executive Jane Fraser maintains her commitment to operational streamlining paired with targeted business expansion. The acquisition framework represents a pivot toward reinforcing American operations following extensive international portfolio optimization. Therefore, this approach complements broader objectives to amplify market presence and earnings potential.
Divestiture Program Bolsters Financial Flexibility
Citigroup has fortified its capital foundation through strategic dispositions and organizational restructuring measures. During February 2026, the institution finalized the transfer of its Russian operations to Renaissance Capital. This divestiture yielded approximately $4 billion in Common Equity Tier 1 capital enhancement.
Additionally, Citigroup divested a 49% ownership position in Banamex, its Mexican retail banking division. This transaction contributed roughly $2.5 billion while strengthening financial resources available for reinvestment. Furthermore, leadership has confirmed no additional Banamex asset sales are anticipated during the current fiscal year.
These strategic dispositions have unlocked substantial resources to finance acquisition activity and domestic market penetration. Consequently, Citigroup maintains significant capacity to allocate funds toward revenue-generating opportunities. This approach demonstrates a deliberate transition toward balance sheet optimization and prudent capital deployment.
Operational Performance and Blockchain Technology Advancement
Citigroup delivered impressive institutional banking results in its latest financial disclosure. Corporate banking revenues surged 78% on an annual basis, reaching $2.2 billion during the final quarter of 2025. This exceptional performance underscores heightened engagement from commercial and institutional client segments.
The stock continues trading substantially beneath the Wall Street consensus target of $135. The existing valuation disparity suggests a disconnect between current market pricing and analyst projections. Implementation success of strategic priorities may prove decisive for future share appreciation.
Citigroup has established foundational systems for cryptocurrency custody solutions and digital wallet capabilities. The organization intends to incorporate digital assets into conventional banking infrastructure while maintaining comprehensive risk management protocols. Beyond this, the bank is evaluating stablecoin applications and blockchain-enabled deposit instruments to enhance international payment settlement efficiency.

Approach by Fed Raises Concerns
The Federal Reserve Bank of Kansas City granted Payward Financial a limited purpose account that is operating under the name Kraken Financial. But authorities have said not much regarding the scope of services to which the account is related, and this has raised questions amongst legislators regarding openness and uniformity in the process of approving the account. Waters has formally requested Kansas City Fed President Jeff Schmid to clarify what legal framework is applied to handle the approval of the account. Further, she reported that existing laws and Federal Reserve access account regulations fail to specify or mention a limited purpose account, casting doubt on the interpretation of regulations.
The legislator has also questioned whether Kraken will be able to get important Federal Reserve products like payments processing, cash management, and securities transferring. Also, she needs to seek clarification regarding potential boundaries associated with the account, like limits on the balance or restrictions on overdrafts, which may limit its operation scope. The debate has been escalated given the comparisons with Custodia Bank that was seeking the same access over several years, yet it turned out in court. The resultant disparity has therefore given rise to an issue of fairness and equal treatment of the Federal Reserve System to various kinds of financial institutions.
The ruling has attracted interest in financial and crypto industries since companies are looking at the way the regulators address access to the central infrastructure. Other than the industry players, consider the development as a milestone to closer integration of crypto companies into the conventional ones that provide financial and payment systems in the US. Waters highlighted that the steady enforcement of regulations is critical towards ensuring that there is trust in the regulation processes. Therefore, she compelled the Federal Reserve to give more disclosures that justify why Kraken was able to clear such requirements using the same circumstances that other candidates were unable to do.
The problem appears in the context of broader uncertainty in the monetary policy and regulation of the direction of the financial system of the United States. In addition, the continuous controversy about interest rates and regulatory models also determines the way the interactions between the institutions and the central bank services and regulatory standards are involved.
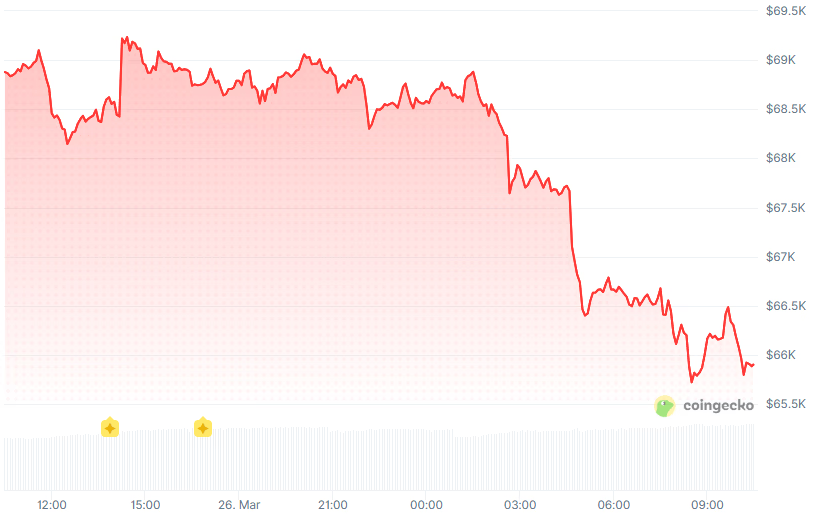
Iran escalation and $171 million in ETF outflows drive BTC below $66,000.
Bitcoin fell to its lowest level in more than two weeks on Friday, dropping below $66,000 as a $14 billion options expiry collided with escalating Middle East tensions and a broader risk-off rout across global markets.
BTC was trading near $65,900 at press time, down roughly 4.5% over the past 24 hours, according to CoinGecko. Ether slipped to $1,983, also off 4%, while Solana tumbled 5.5% to $83. The total crypto market cap fell 3.4% to $2.36 trillion.

The Crypto Fear & Greed Index sits at 13, deep in “Extreme Fear” territory
Nearly $443 million in long positions were liquidated over the past 24 hours, compared with just $58 million in shorts, according to Coinglass, suggesting traders had been positioned for a rally that has not materialized as the U.S.-Iran conflict entered its 28th day.
Almost all of the Top 100 digital assets posted losses over the last 24 hours.
Ondo Finance bucked the bearish trend, rising more than 8% over 24 hours — though it gave back most of its gains by midday — after announcing a partnership with Franklin Templeton to tokenize five ETFs across growth, large-cap, fixed income, equity income, and gold strategies through Ondo Global Markets.
Worldcoin (WLD) and MORPHO are today’s biggest losers, plunging 10% and 8%, respectively.
Macro Pressure Mounts
The selloff extended across traditional markets. The Nasdaq 100 fell to 23,300, now 10% below its January high. Oil topped $96 per barrel as diplomatic efforts to de-escalate the Iran conflict stalled, fueling inflation fears and pushing back expectations for Federal Reserve rate cuts.
The CME FedWatch tool shows a 96% probability that the Fed will hold rates steady at its next meeting, with 4% of the market now pricing in a 25-basis-point hike, a scenario that was virtually unthinkable a month ago.
U.S. spot Bitcoin ETFs recorded a net outflow of $171 million in a single day, the largest in three weeks, per CoinGlass data. Institutional demand has cooled notably since the Fed’s hawkish March rate decision, with recent days showing mixed, low-conviction flows.

Crusoe Unveils Massive AI Campus Partnership with Microsoft in Abilene
Microsoft is significantly expanding its artificial intelligence computing capabilities through a strategic collaboration with Crusoe in Abilene, Texas. The ambitious development features a 900 megawatt AI factory campus engineered to handle cutting-edge computational workloads. This facility represents one of the most substantial AI infrastructure projects currently emerging across the nation.
The planned campus will be positioned next to Crusoe’s current Abilene operations and will comprise two state-of-the-art data center structures. A dedicated onsite power generation facility will be integrated to enhance energy dependability and strengthen grid stability. When fully operational, the entire complex is projected to deliver 2.1 gigawatts of total capacity.
Development activities have commenced with initial land preparation and clearing operations now in progress. The inaugural building is scheduled to begin operations by the middle of 2027. Consequently, this rollout maintains Crusoe’s aggressive deployment schedule for enterprise-scale AI infrastructure projects.
Power Requirements Drive Design of Advanced AI Computing Facilities
The new campus architecture prioritizes energy infrastructure to accommodate escalating artificial intelligence computational needs. The facility will incorporate 900 megawatts of onsite power generation alongside battery storage capabilities. These systems will enable ultra-dense computing environments optimized for demanding GPU-based processing tasks.
Both structures will provide substantial computational capacity while employing closed-loop liquid cooling technology. This engineering approach minimizes water consumption and optimizes thermal control. Accordingly, the infrastructure design addresses the specific demands of high-performance artificial intelligence platforms.
This development represents the latest phase of the Abilene project, which has experienced rapid growth in recent periods. The original deployment began with 200 megawatts and subsequently expanded to 1.2 gigawatts spanning several buildings. Thus, this new campus consolidates the area’s position as a critical hub for large-scale AI implementation.
Geographic Advantages Position Abilene as AI Infrastructure Hub
Abilene has become an increasingly strategic location for AI infrastructure deployment, primarily due to reliable power supply and available land resources. Microsoft has secured approximately 700 megawatts of data center capacity from Crusoe in the surrounding area. This arrangement demonstrates the dynamic evolution of client requirements and infrastructure strategy.
The region has garnered significant industry interest due to multiple large-scale AI projects currently under development. Technology companies are actively realigning their asset portfolios to guarantee long-term access to computing resources. This pattern underscores the escalating competition within the AI infrastructure sector.
Crusoe is simultaneously establishing a production facility for modular AI infrastructure components designed to accelerate deployment schedules. The organization seeks to create standardized infrastructure solutions while navigating energy limitations affecting the broader industry. As such, the Abilene expansion exemplifies a significant industry transition toward scalable, energy-optimized AI development frameworks.
Crypto World
Why TRON price turned bearish even as Anchorage Digital added institutional TRX custody


- TRX dips despite Anchorage Digital enabling institutional custody.
- $0.309 is the key support, with $0.3189 acting as the immediate resistance.
- Market awaits active institutional adoption to boost TRX price.
TRON (TRX) has seen a slight dip to around $0.309, even as news broke that Anchorage Digital, the only crypto firm with a US federal banking charter, will add institutional TRX custody.
On the surface, this might seem contradictory since institutional adoption is usually bullish for digital assets.
But TRX’s price action suggests the market is not always immediately responsive to structural developments.
What Anchorage Digital’s move means for TRON
Anchorage Digital’s integration of TRON into its platform gives US institutional investors a regulated avenue to store, manage, and potentially stake TRX.
It is also part of a phased rollout, with plans including TRC‑20 token support and native staking.
From a technical standpoint, this is a strong signal of growing infrastructure and trust around TRON.
It lowers barriers for institutions that previously faced compliance or custody challenges.
In theory, such developments should increase demand for TRX and push the price upward.
However, markets often take time to internalise these structural changes.
Understanding the current bearish trend
There are likely several reasons for the temporary bearishness.
First, broader crypto market trends have been mixed, with key assets showing minor declines over the past 24 hours as oil rises over $110.
Second, some traders may be waiting for confirmation that institutions are actively using the custody service before entering positions.
Finally, TRX is facing a strong resistance near $0.3189, and on the lower side, there is a strong support around $0.3090 that, if broken, could trigger further downward pressure toward $0.3012.
Going by these levels, it is evident that the TRX price is currently bound in a narrow range, reflecting a period of consolidation.
What to expect over the weekend
While the short-term trend may seem bearish, the institutional integration remains a positive signal.
If adoption by institutions picks up, it could unlock new price ranges for TRX in the coming weeks.
The market may also respond to growing stablecoin activity on the TRON network, which highlights its ongoing utility.
For now, traders should watch for a breakout on either side of the current consolidation range.
A breakout above $0.3189 would confirm the continuation of its recent bullish momentum, while a break below $0.3090 would mean the beginning of a pullback after weeks of bullish trend that has seen it gain over 8%.


A new working paper from the European Central Bank examined four major protocols and found that a small number of actors control the bulk of governance token holdings.
A European Central Bank working paper challenges the notion that decentralized autonomous organizations (DAOs) deliver on their promise of distributed governance, finding that token holdings and voting power across four major DeFi protocols are heavily concentrated among a handful of actors.
The study examined governance structures at Aave, MakerDAO, Ampleforth, and Uniswap using data from late 2022 and mid-2023. The researchers analyzed the top 100 token holders and top 20 voters for each protocol, reviewed 248 governance proposals, and attempted to trace the real-world identities behind pseudonymous blockchain addresses.
The findings land at a moment when governance disputes are roiling some of the very protocols examined in the study, and DeFi projects more broadly are grappling with whether the Labs-plus-DAO structure is fit for purpose.
Top 100 Holders Command Over 80% of Supply
Across all four protocols, the top 100 holders controlled more than 80% of the total governance token supply during both snapshot periods. At Aave and Uniswap, the top five accounted for roughly half of all holdings. MakerDAO was the relative outlier, with the top five holding around 36%.
The concentration proved sticky over time, with distributions remaining largely unchanged between October 2022 and May 2023.
When the researchers dug into who sits behind the top addresses, they found that for most protocols, roughly half or more of holdings traced to addresses associated with the protocols themselves — encompassing treasuries, founders, and developer allocations — or to centralized and decentralized exchanges.
Protocol-associated addresses held 43% of Uniswap’s UNI supply. Centralized exchange holdings were particularly notable at Aave (16%) and Ampleforth (19%). Binance emerged as the dominant exchange holder across all four protocols, with holdings ranging from 2% to 15% of total supply.
The researchers cautioned that available data doesn’t distinguish between tokens held by exchanges on their own behalf versus those held in custody for customers.
Delegates Dominate Voting
The most active voters on governance proposals turned out to be predominantly delegates — entities to whom smaller token holders assign their voting power. This dynamic has long been a known issue in DAO governance, where low voter turnout and outsized whale participation leave a small group of recurring participants shaping protocol decisions.
The top voter at Uniswap in both snapshots was a16z, the venture capital firm, which saw its delegator count grow from 100 to 125 over the study period. At Aave, the protocol’s own smart contracts held the top-voter position.
Of the 68 top voters identified across all protocols, the researchers could not determine the identities of roughly one-third to nearly half of them. Among those they could identify, individuals made up about 21%, followed by Web3 companies at 19%, university blockchain societies, and VC firms.
Uniswap had the highest delegation rate at 27%, with its top 18 voters holding more than half the delegated power.
The ECB team also systematically categorized the 248 proposals and found that “risk parameters” — covering loan-to-value ratios, liquidation thresholds, borrowing rates, and debt ceilings — were the most common, accounting for 28%. Asset listing proposals made up 23%.
Implications for Regulation
The findings carry direct implications for the ongoing policy debate over how to regulate DeFi. The EU’s Markets in Crypto-Assets regulation exempts services provided in a “fully decentralized manner,” but the ECB researchers argue the protocols they studied fall well short of that standard.
Governance token holders, protocol developers, and centralized exchanges have frequently been proposed as potential regulatory entry points. However, the researchers concluded that the ambiguity surrounding who actually controls governance makes all three difficult to use in practice.
“It is not always clear who in the end is responsible or can be held accountable based on publicly available data,” the authors wrote.
The paper also drew parallels between DeFi governance and traditional corporate shareholder governance, noting that both systems suffer from low voter turnout and outsized influence by a small number of recurring participants.
But DeFi lacks the institutional safeguards — proxy voting rules, stewardship codes, disclosure requirements, and fiduciary obligations — that help mitigate those dynamics in public companies. As DAOs increasingly adopt formal legal structures, the researchers suggested that hybrid models integrating traditional legal frameworks with blockchain-based governance may ultimately be needed.
This article was written with the assistance of AI workflows. All our stories are curated, edited and fact-checked by a human.

- Vietnam is investigating a huge crypto fraud involving Vemanti Group.
- As crypto use grows, Vietnam is increasing rules and oversight.
- Nearby countries are also cracking down on online financial scams.
Hanoi, Vietnam — Authorities in Vietnam have initiated what officials believe to be one of the biggest online crime cases involving online assets, as more regions strive to counter online financial fraud.
Vemanti Group Becomes Focus of Public Attention
According to a state-related Vietnamnet source, police believe there is a large-scale scheme that drew billions of US dollars from investors. Although authorities have not released a precise assessment of the overall losses, initial reports indicate the financial impact could be substantial.
The inquiry has made Vemanti Group the center of attention, as it was reported only after the Ministry of Public Security publicly announced the case and local media subsequently covered it.
The company said that its board chairman Nhan Vuong and board member Chien Tran have been indicted in connection with the case.
In a statement, Vemanti argued that authorities in any jurisdiction had not informed it before the indictments were released. The firm said it has engaged U.S. legal representation as it evaluates the case and decides its next steps.
Vemanti also linked the probe to ONUS Pro, a digital-asset site identified as the center of the alleged scheme.
Vietnam Crypto Market Growth Draws Increased Scrutiny
The case comes as Vietnam remains one of the world’s most active cryptocurrency markets. The case comes as Vietnam remains one of the world’s most active cryptocurrency markets. Chainalysis reported that Vietnam ranked fourth in its 2025 Global Crypto Adoption Index, and digital assets are widely used at the grassroots level.
That authorities are paying more attention to fraud signals a broader shift toward a more restrictive approach as cryptocurrencies grow in popularity.
Regional Crackdown Expands Beyond Vietnam Borders
Vietnam is not the only country seeing a crackdown. The Central Bureau of Investigation (CBI) of neighboring India recently arrested a suspect in Mumbai who helped traffic people into scams in Myanmar.
Investigators claim that the victims were coerced into taking part in internet fraudulent schemes, such as cryptocurrency investment scams and international user romance scams.
The events underscore rising cooperation in the region with governments trying to stem cyber-enabled financial crimes related to digital assets.
CBI Arrests Kingpin of Transnational Cyber Slavery Network pic.twitter.com/15Yc1YLO4D
— Central Bureau of Investigation (India) (@CBIHeadquarters) March 26, 2026


- Solana price dropped 5% to near $83 on Friday.
- The altcoin fell as Bitcoin and Ethereum declined to $66,500 and below $1,990, respectively.
- Risk assets sank as Brent oil surged to $110 amid Iran war concerns.
Solana (SOL) price has slipped more than 5% as altcoins mirror declines in Bitcoin (BTC).
The downturn coincided with a dramatic surge in oil prices to $110 per barrel, fueled by geopolitical tensions in the Middle East, with President Donald Trump’s announcement of a deadline extension for Iran seemingly not assuaging sellers.
Iran has largely dismissed US claims that talks have shown progress.
Solana drops to $83 amid crypto dip on oil surge
Solana’s price plunged to a low of $83 during Friday’s session, marking a decline of over 5% within 24 hours.
This aligned with the broader crypto market’s vulnerability to macroeconomic shocks, with Bitcoin sliding to below $66,500.
BTC’s drop below $67k marks the first time bulls have seen these levels since March 9.
Losses triggered massive long liquidations across top altcoins.
The sharp decline for BTC came as oil prices topped $110 despite US President Donald Trump’s announcement of a 10-day extension to the deadline for Iran to open the Strait of Hormuz.
Trump had paused the move to strike Iran’s energy infrastructure by 5 days, but even then, the additional five days appear to have done little to soothe supply concerns.
US stocks faltered as the international benchmark Brent crude futures rose 2.7% to $110.94 a barrel.
Crude gains reversed earlier losses following the early March spike, which also saw BTC prices sink to support.
As risk appetite got a fresh bump, Solana’s trading volume spiked 13% to over $4.1 billion.
The surge in intraday volume across major exchanges signals panic, as the unwinding of leveraged positions has led to significant losses for long positions.
Solana price outlook
From a technical standpoint, Solana’s descent to $83 breached the 50-day exponential moving average (EMA) at $87.50, a critical support that now risks further erosion toward the 200-day EMA near $78.
The relative strength index (RSI) flashed oversold territory at 28, hinting at a potential short-term rebound if oil volatility eases.
However, the moving average convergence divergence (MACD) histogram remains deeply negative, confirming bearish momentum tied to the BTC correlation, which stands at 0.92 over the past month.
A sustained oil price above $110 could push SOL toward $75, but a de-escalation in Hormuz tensions might spark a relief rally back to the $95-$100 level.
Investors might also be looking to monitor US inflation data, with this likely to dictate the crypto market’s next move.
After a brief improvement in sentiment, fear has returned to the crypto market and continues to dominate social discussions. Bitcoin has dropped back below $70,000, raising concerns among retail investors.
Although negative sentiment is spreading across social media, on-chain data paints a more complex picture of retail investors’ actual role.
Retail FUD Sentiment Surges. Will Bitcoin Recover?
Blockchain analytics platform Santiment recently recorded a spike in negative Bitcoin-related keywords on social media.
Terms such as “dip” and “crash” appear frequently in BTC discussions. This reflects a significantly elevated level of FUD (Fear, Uncertainty, Doubt) among retail investors.
Santiment notes that extreme pessimism among retail investors often serves as a contrarian signal. When negativity becomes overwhelming, the market tends to recover as selling pressure nears exhaustion.
“Words like #dip, #pullback, #rejection, #crash, or #bloodbath, it’s usually a safe time to BUY,” Santiment stated.
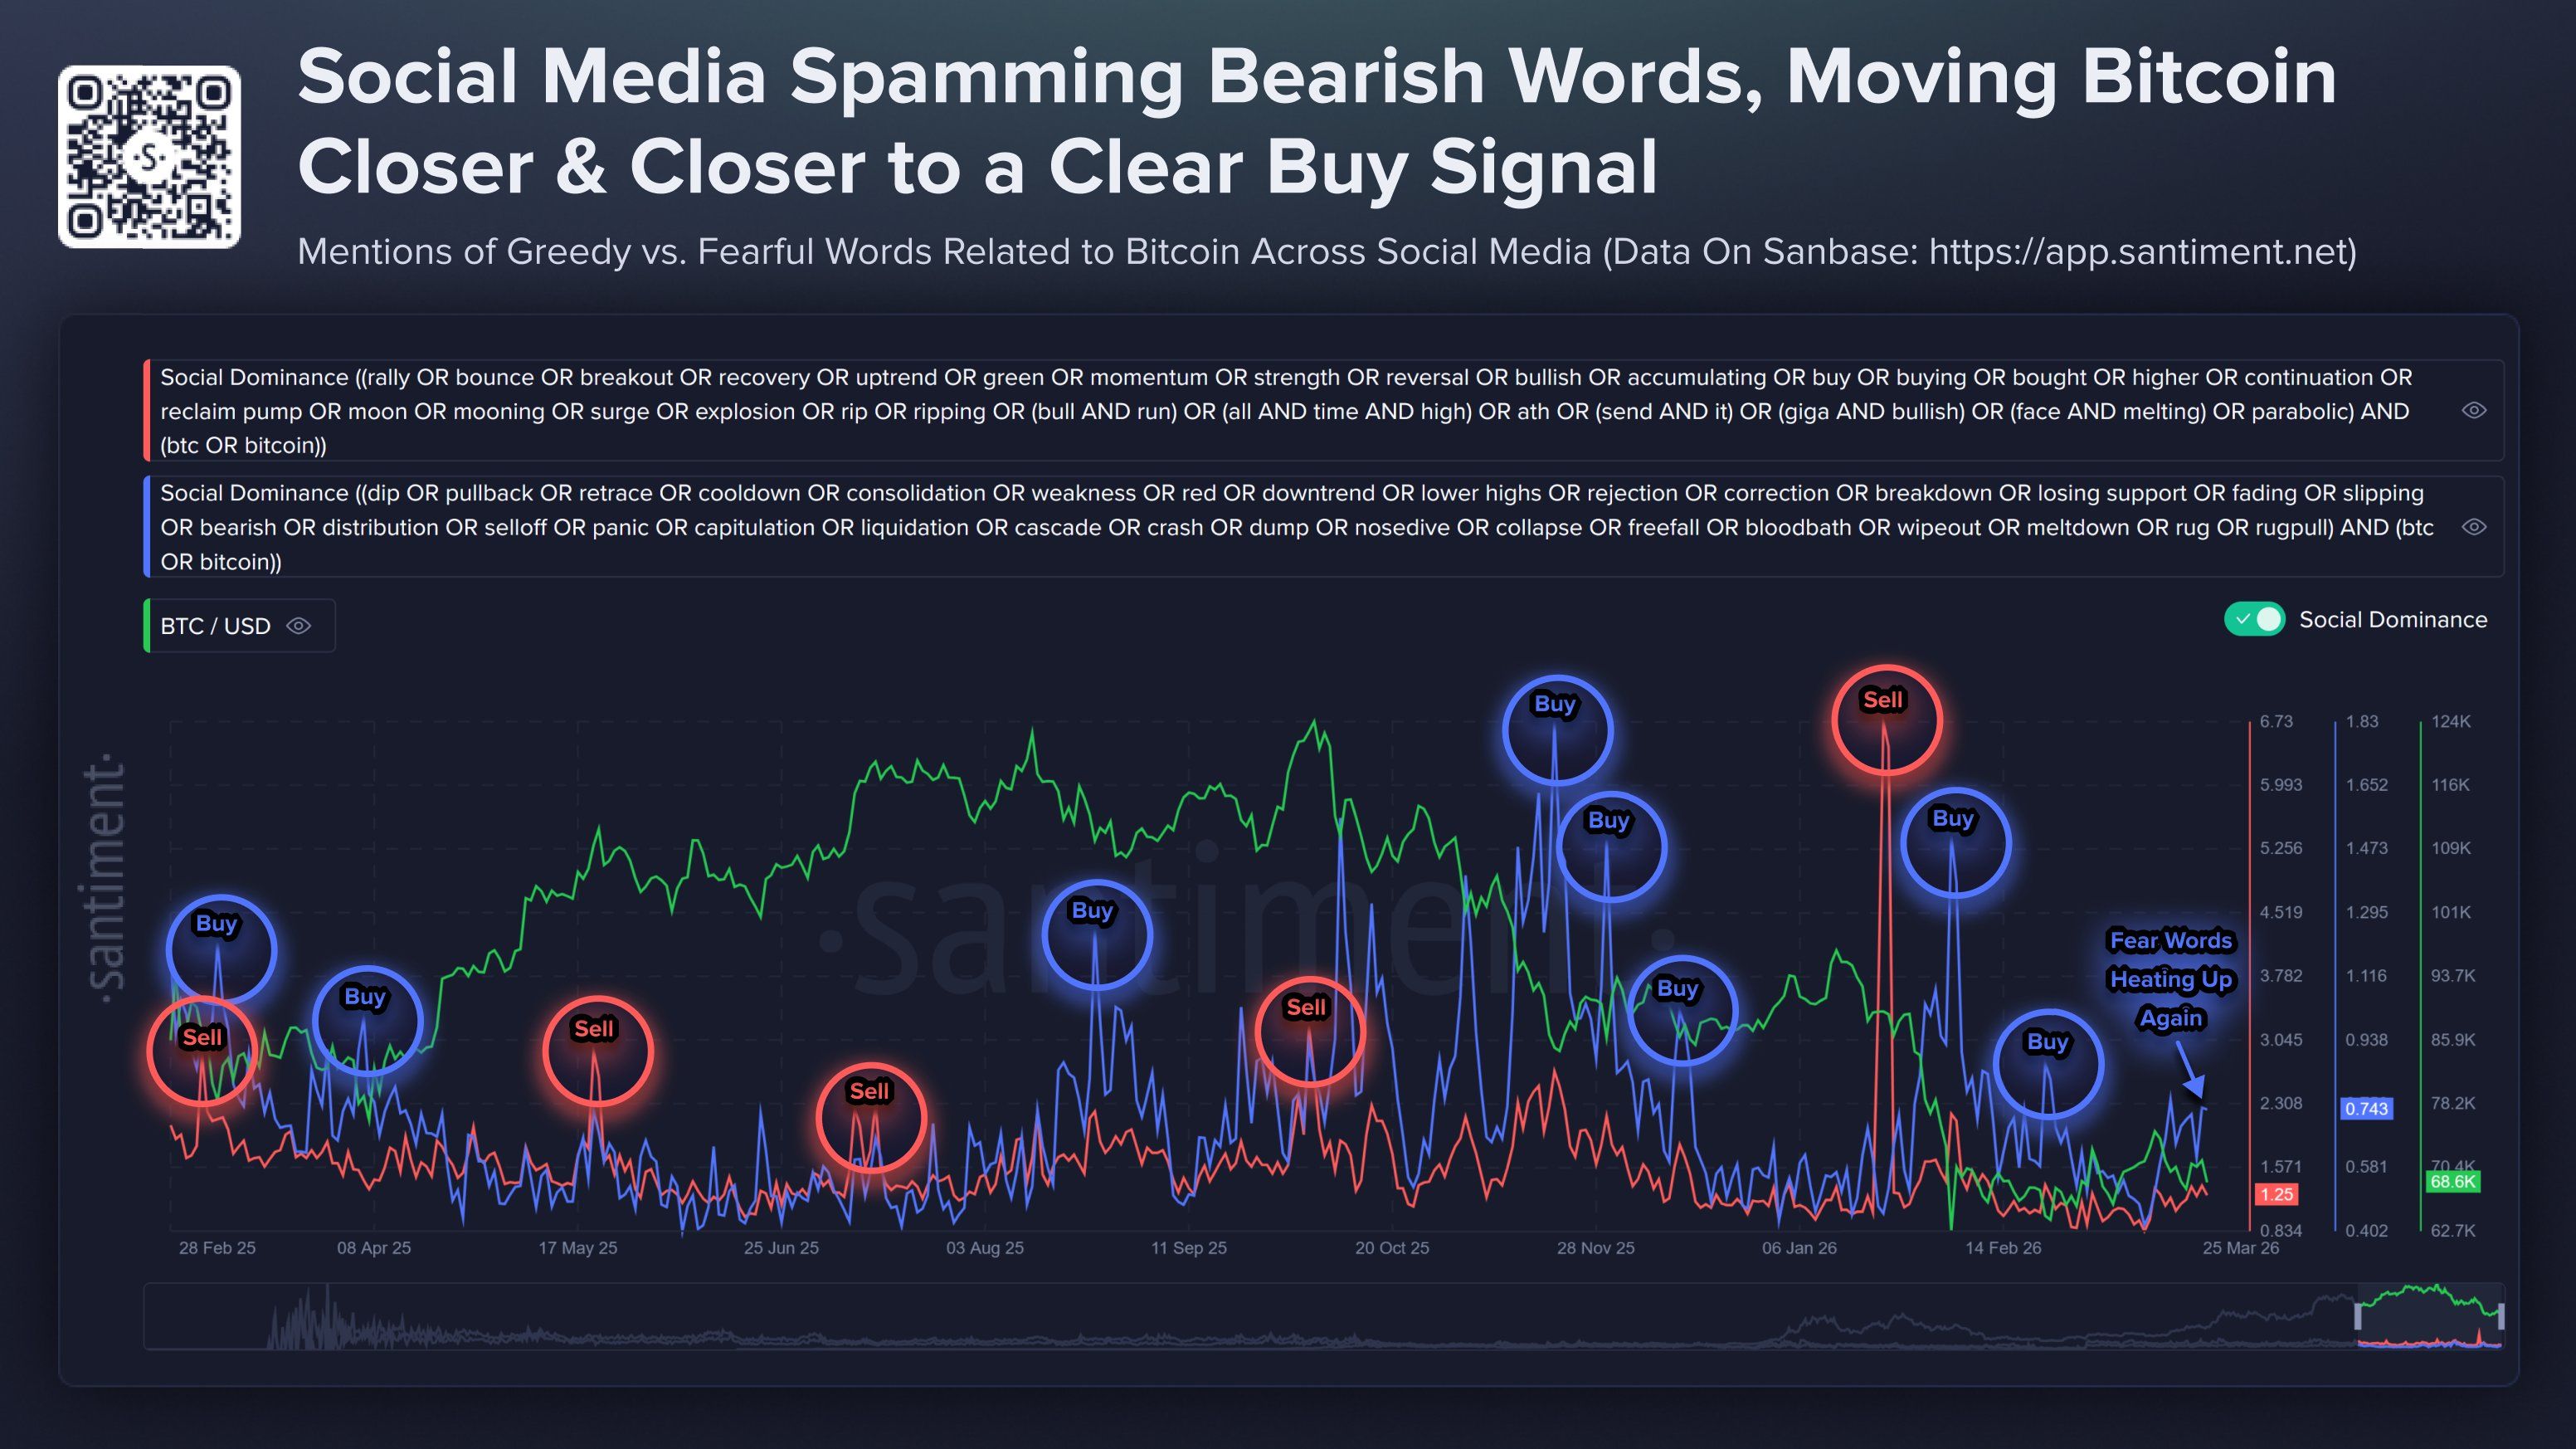
Santiment’s chart illustrates this logic over the past year.
However, the picture goes beyond sentiment alone. A report from CryptoQuant reveals a concerning divergence between trading volume and the actual market share of retail investors.
Zizcrypto, an analyst at CryptoQuant, reported that the 30-day average small trade volume (0–$1,000) from retail stands at $96 million. This level aligns with the market bottom in early 2023.
Meanwhile, retail trading share (0–$10,000) has steadily declined since early 2023. It has dropped from over 2.4% to ~0.7% and has now stabilized.
The divergence between trading volume and market share suggests that retail investors remain active, but their structural role in the market is no longer expanding.
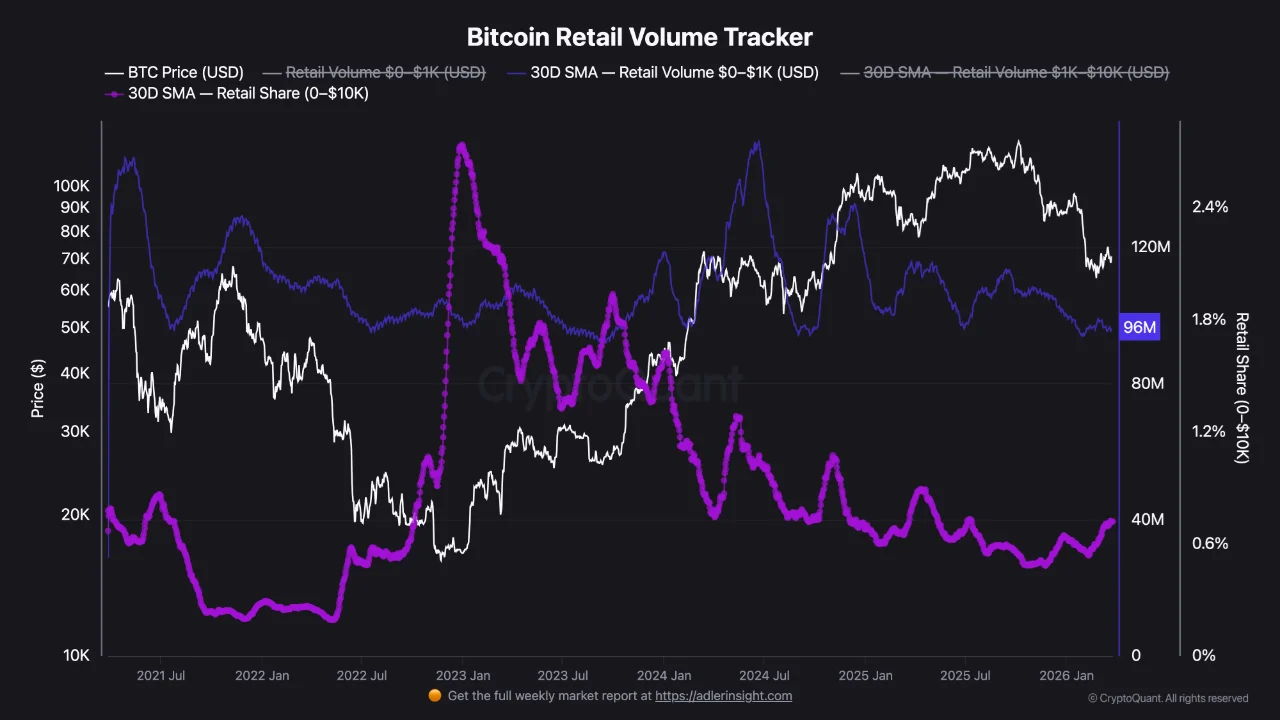
“In this context, retail participation is primarily concentrated in short-term reactive flows rather than sustained engagement,” Zizcrypto stated.
Therefore, Santiment’s view may hold in the short term. However, it is difficult to use it as a basis for predicting a reversal similar to early 2023.
The latest analysis from BeInCrypto indicates that if Bitcoin closes a daily candle below $68,930, the price could continue to decline toward $65,550.
The post Retail FUD Sentiment Rises as Bitcoin Falls Below $70,000: What Are The Implications? appeared first on BeInCrypto.


Intercontinental Exchange has now deployed nearly $2 billion into the onchain prediction market, underscoring Wall Street’s growing conviction that event-based trading is here to stay.
Intercontinental Exchange, the parent company of the New York Stock Exchange, on Friday announced a new $600 million direct cash investment in Polymarket, completing the exchange operator’s structured investment arrangement with the prediction market platform.
The investment is part of a broader equity capital fundraise by Polymarket, according to a press release from ICE. The company also expects to purchase up to $40 million in Polymarket securities from existing holders, which would close out its obligations under the deal first announced in October 2025. The valuation of Friday’s investment is expected to be disclosed after Polymarket completes its fundraising.
ICE made an initial $1 billion direct investment in Polymarket at that time, in what was the largest single investment ever made in a prediction market company. That deal valued Polymarket at roughly $8 billion pre-investment and established ICE as a global distributor of Polymarket’s event-driven data.
ICE’s interest in Polymarket extends beyond a passive equity stake. In February, ICE launched the Polymarket Signals and Sentiment Tool, a product that normalizes real-time and historical prediction market data into structured feeds for institutional traders. The tool packages Polymarket’s crowd-sourced probability assessments as market signals alongside traditional financial instruments.
Prediction Market Arms Race
The capital injection comes amid an unprecedented wave of institutional investment into prediction markets. Rival platform Kalshi raised approximately $1 billion at a $22 billion valuation earlier this month in a round led by Coatue Management. Polymarket is reportedly targeting a valuation of around $20 billion in its current round, according to The Wall Street Journal.
Prediction market monthly volumes have grown 130-fold since early 2024, making it one of the fastest-growing categories in finance. Open interest across platforms crossed $1 billion for the first time in February.
Regulatory Crosswinds
The investment arrives against a complex regulatory backdrop. The CFTC recently issued an advance notice of proposed rulemaking signaling its intent to build a comprehensive regulatory framework for prediction markets. Meanwhile, some lawmakers have introduced legislation that would block prediction markets from offering contracts on war and sports outcomes.
At the state level, regulators continue to challenge the industry — Arizona’s attorney general recently filed criminal charges against Kalshi, alleging it operates an illegal gambling business in the state.
Still, institutional capital appears undeterred by the regulatory uncertainty. For ICE, the completion of its nearly $2 billion investment arrangement signals that one of the world’s largest market infrastructure operators views prediction markets not as a passing novelty but as a category that may eventually sit alongside equities, futures, and fixed income.
This article was written with the assistance of AI workflows. All our stories are curated, edited and fact-checked by a human.

Why hasn’t Mitchell Starc joined Delhi Capitals yet? Alyssa Healy gives blunt reply | Cricket News
Jurgen Klopp reveals Mo Salah text exchange and offers Liverpool advice on replacing him

Telco Turnaround: Can The Sector Still Recover Amid Price Pressures?


-
 Crypto World7 days ago
NIO (NIO) Stock Plunges 6.5% as Shelf Registration Sparks Dilution Worries
-
 NewsBeat2 days ago
Manchester United reach agreement with Casemiro over contract clause amid transfer speculation
-

 Fashion7 days ago
Weekend Open Thread: Adidas – Corporette.com
-

 Politics7 days ago
Jenni Murray, Long-Serving Woman’s Hour Presenter, Dies Aged 75
-

 Crypto World6 days ago
Best Crypto to Buy Now: Strategy Just Spent $1.57 Billion on Bitcoin During Fear While Early Investors Quietly Enter Pepeto for 150x Potential
-

 Crypto World6 days ago
Bitcoin Price News: Bhutan Sells $72 Million in BTC Under Fiscal Pressure, but the Smart Money Entering Pepeto Sees What the Market Does Not
-

 News Videos2 days ago
Parliament publishes latest register of MPs’ financial interests
-

 Sports4 days ago
Remo Stars and Kano Pillars Strengthen Survival Hopes in NPFL
-

 Sports4 days ago
Gary Kirsten Accuses Pakistan Cricket Board Of ‘Interference’, Mohsin Naqvi Responds
-

 Business5 days ago
No Winner in March 21 Drawing as Prize Rolls to $133 Million for Next
-

 Tech5 days ago
Give Your Phone a Huge (and Free) Upgrade by Switching to Another Keyboard
-

 Tech5 days ago
AI enters the chat: New Seattle dating app relies on tech to facilitate meaningful human connections
-

 News Videos4 days ago
Ch 9 Financial Management Part 1 | Detailed One Shot | Class 12 Business Studies Boards 2026
-
Business7 days ago
Columbia Sportswear enters $500 million credit agreement with JPMorgan Chase
-

 Tech6 days ago
Today’s NYT Connections Hints, Answers for March 22 #1015
-

 Business21 hours ago
Instagram, YouTube Found Responsible for Teen’s Mental Health Struggle in Historic Ruling
-
 Crypto World7 days ago
Small-cap Russell 2000 enters correction territory
-

 Business5 days ago
Will Duke Basketball Win It All? Duke Basketball Enters Second Round as Third Favorite to Claim NCAA Title
-

 Sports5 days ago
2026 Kentucky Derby horses, odds, futures, preview, date: Expert who hit 12 Derby-Oaks Doubles enters picks
-
 NewsBeat5 days ago
Update on Wisbech river crash as search for teenage boy enters fifth day
You must be logged in to post a comment Login