
Crypto World
Bitcoin Price Faces 40% Risk Despite Improving US Demand
The Bitcoin price has rebounded nearly 20% after slipping close to $60,000 on February 6. The move has revived “buy-the-dip” hopes and fueled talk of a local bottom. At the same time, US demand indicators have started to recover from recent lows.
But beneath the surface, volume signals, on-chain data, and price structure suggest the rally may be fragile. Several warning patterns now resemble setups that preceded major declines in this cycle.
Bear Flag Shows Big Money Is Not Fully Committed
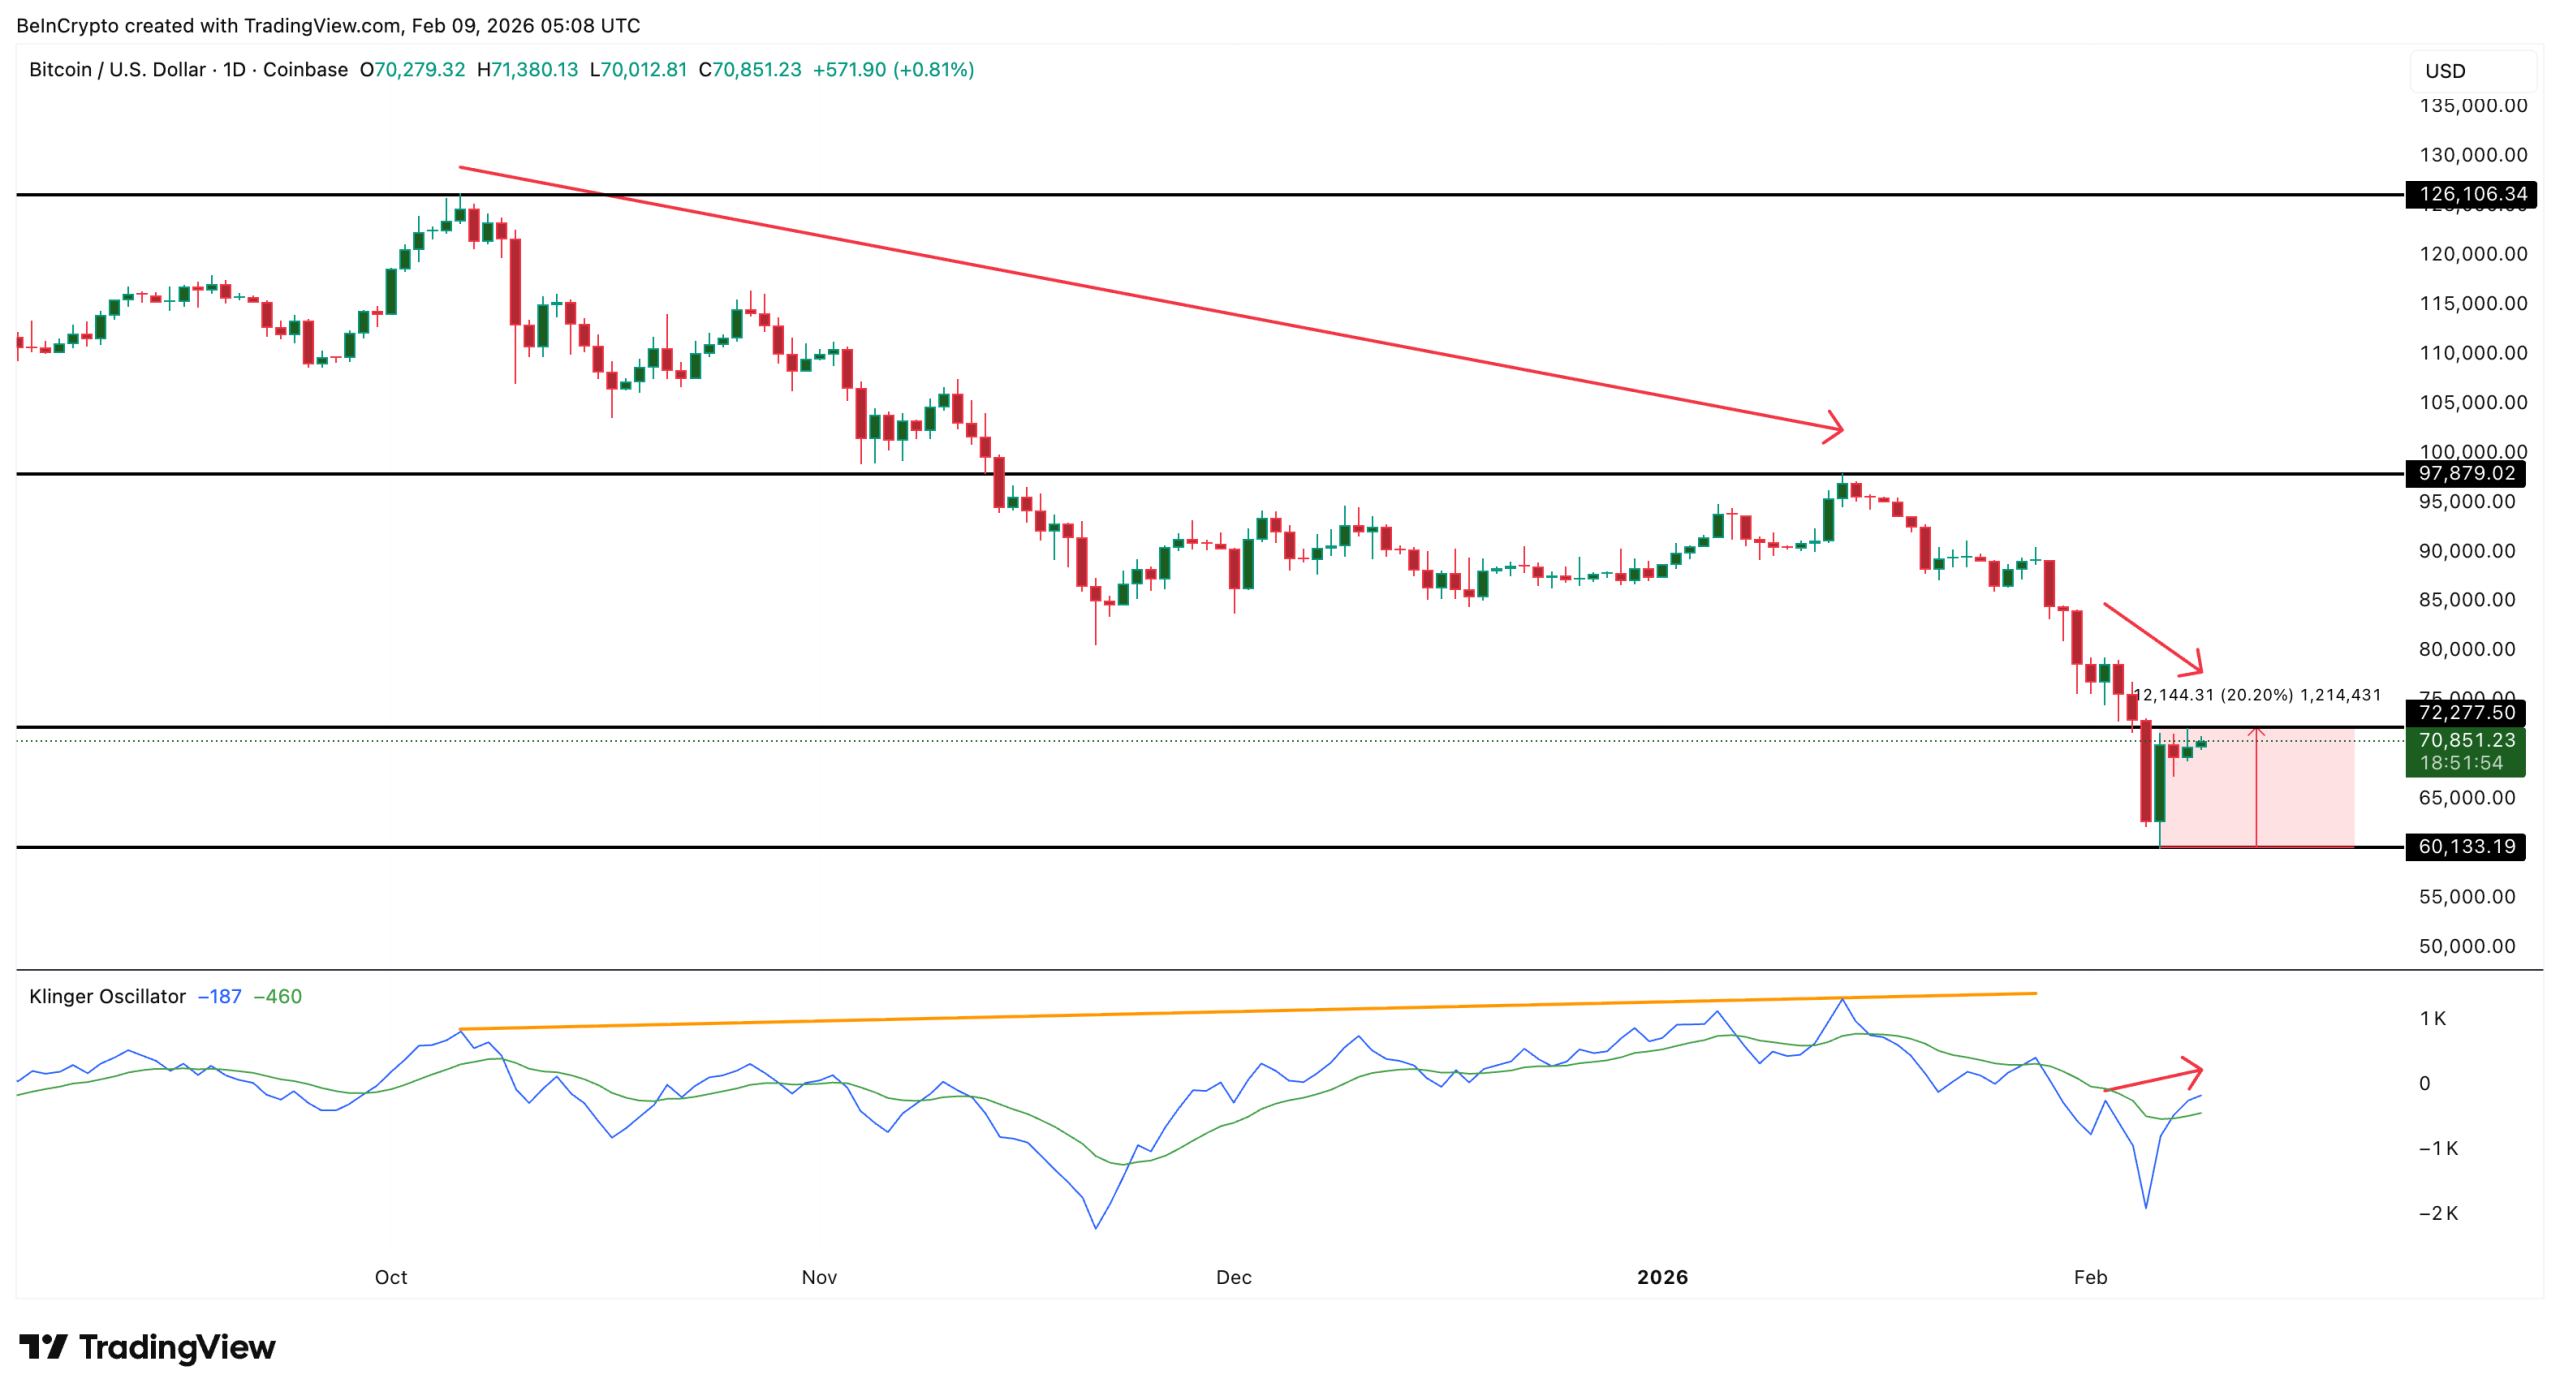
One of the clearest warning signals comes from the Klinger Oscillator, a volume-based indicator that tracks big money flow.
Sponsored
Sponsored
Unlike indicators such as the CMF, which focus mainly on short-term big-money pressure, the Klinger Oscillator measures large-wallet volume intensity across trends. It is designed to highlight how large players position themselves over time, not just day-to-day activity.
In simple terms, it shows whether big money is quietly accumulating or preparing to sell into rallies.
Between October 6 and January 14, Bitcoin fell from around $126,000 to $97,800, a decline of roughly 22%. During that period, the Klinger Oscillator moved higher while the price weakened. This created a bearish divergence.

That divergence warned that volume strength by large wallets (possibly whales and institutions) was not supporting price recovery. Within weeks, Bitcoin extended its decline toward $60,000 as the Klinger reading dropped sharply (possible big money outflows).
A similar pattern is forming again.
Between February 2 and February 9, the price drifted lower while the Klinger Oscillator trended upward. This suggests large players may be positioning (recent buys) to sell into rebounds rather than build long-term exposure.
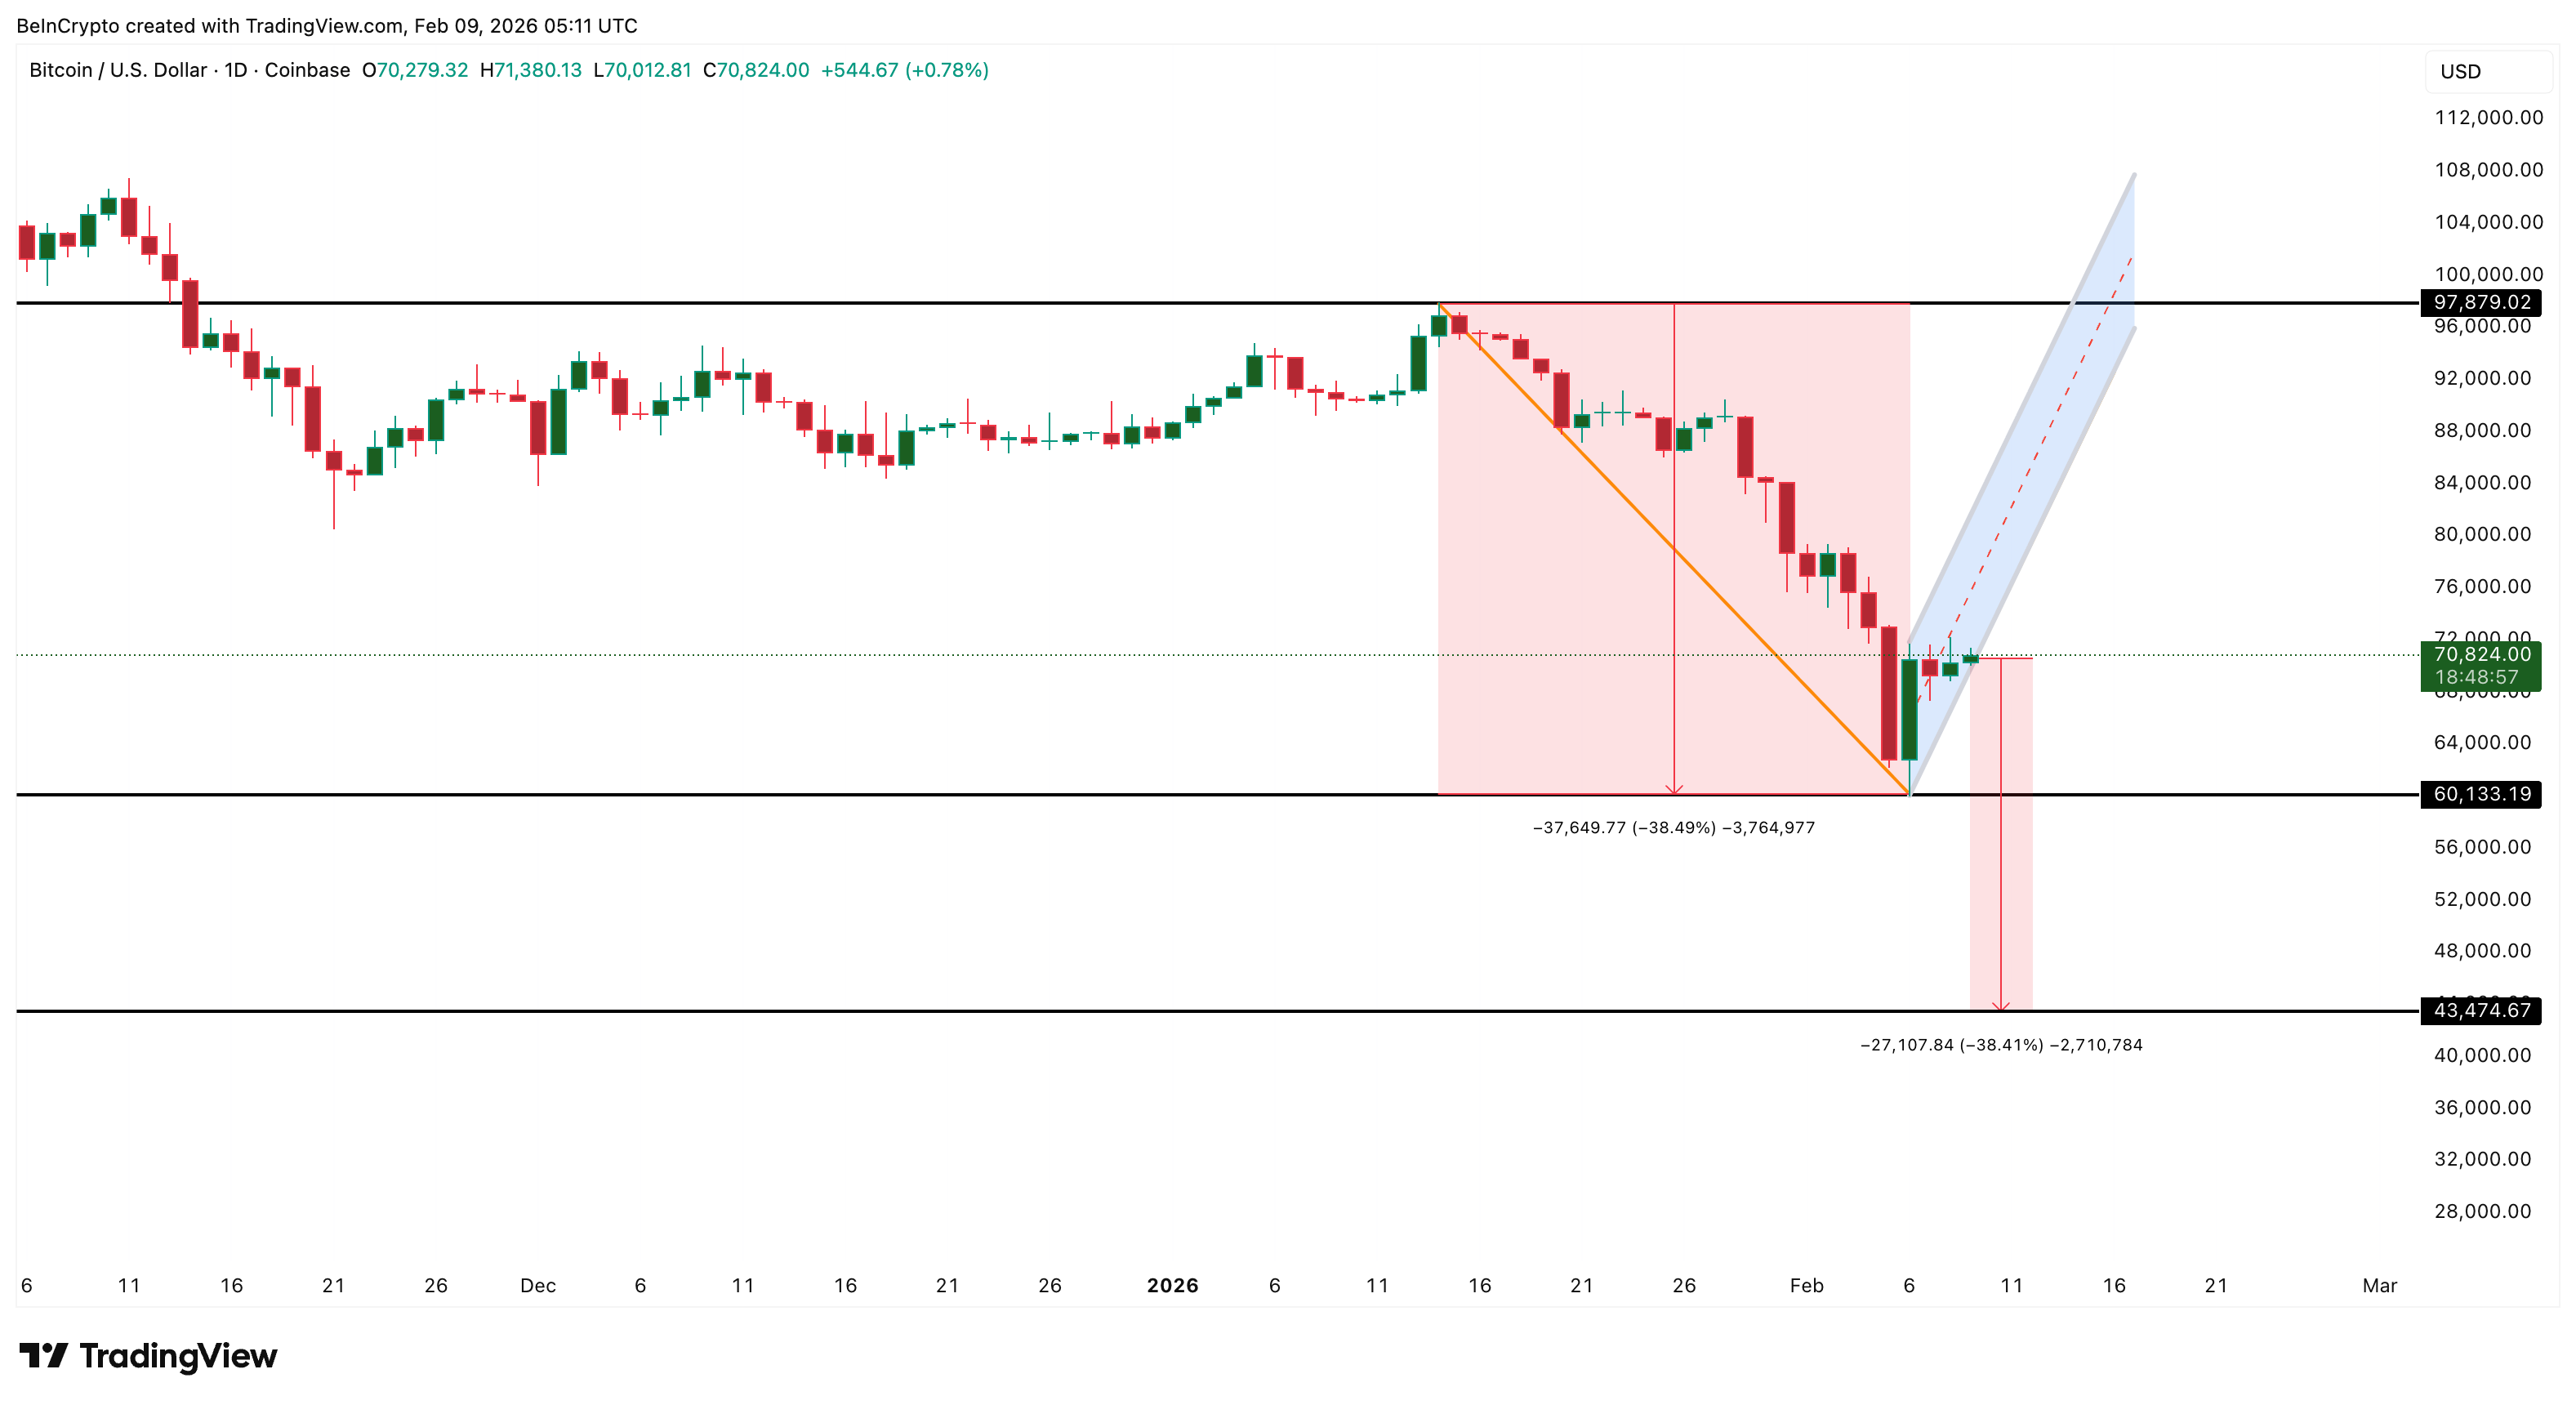
At the same time, Bitcoin’s drop from mid-January to early February formed a sharp downside “pole.” The current price bounce movement resembles a bear flag, a pattern that often signals a continuation of the lower trend, with a near 40% crash possibility if the lower trendline support gives way. That could trap the bulls buying into the bounce.
Sponsored
Sponsored
When rising Klinger readings align with a bear flag, it usually means rallies lack deep institutional support. Big players are active, but not in accumulation mode, and might distribute at any given chance. Days of BTC ETF outflows in the near term would validate the Klinger-led hypothesis.
Improving US Demand Has Failed to Mark Bottoms Before
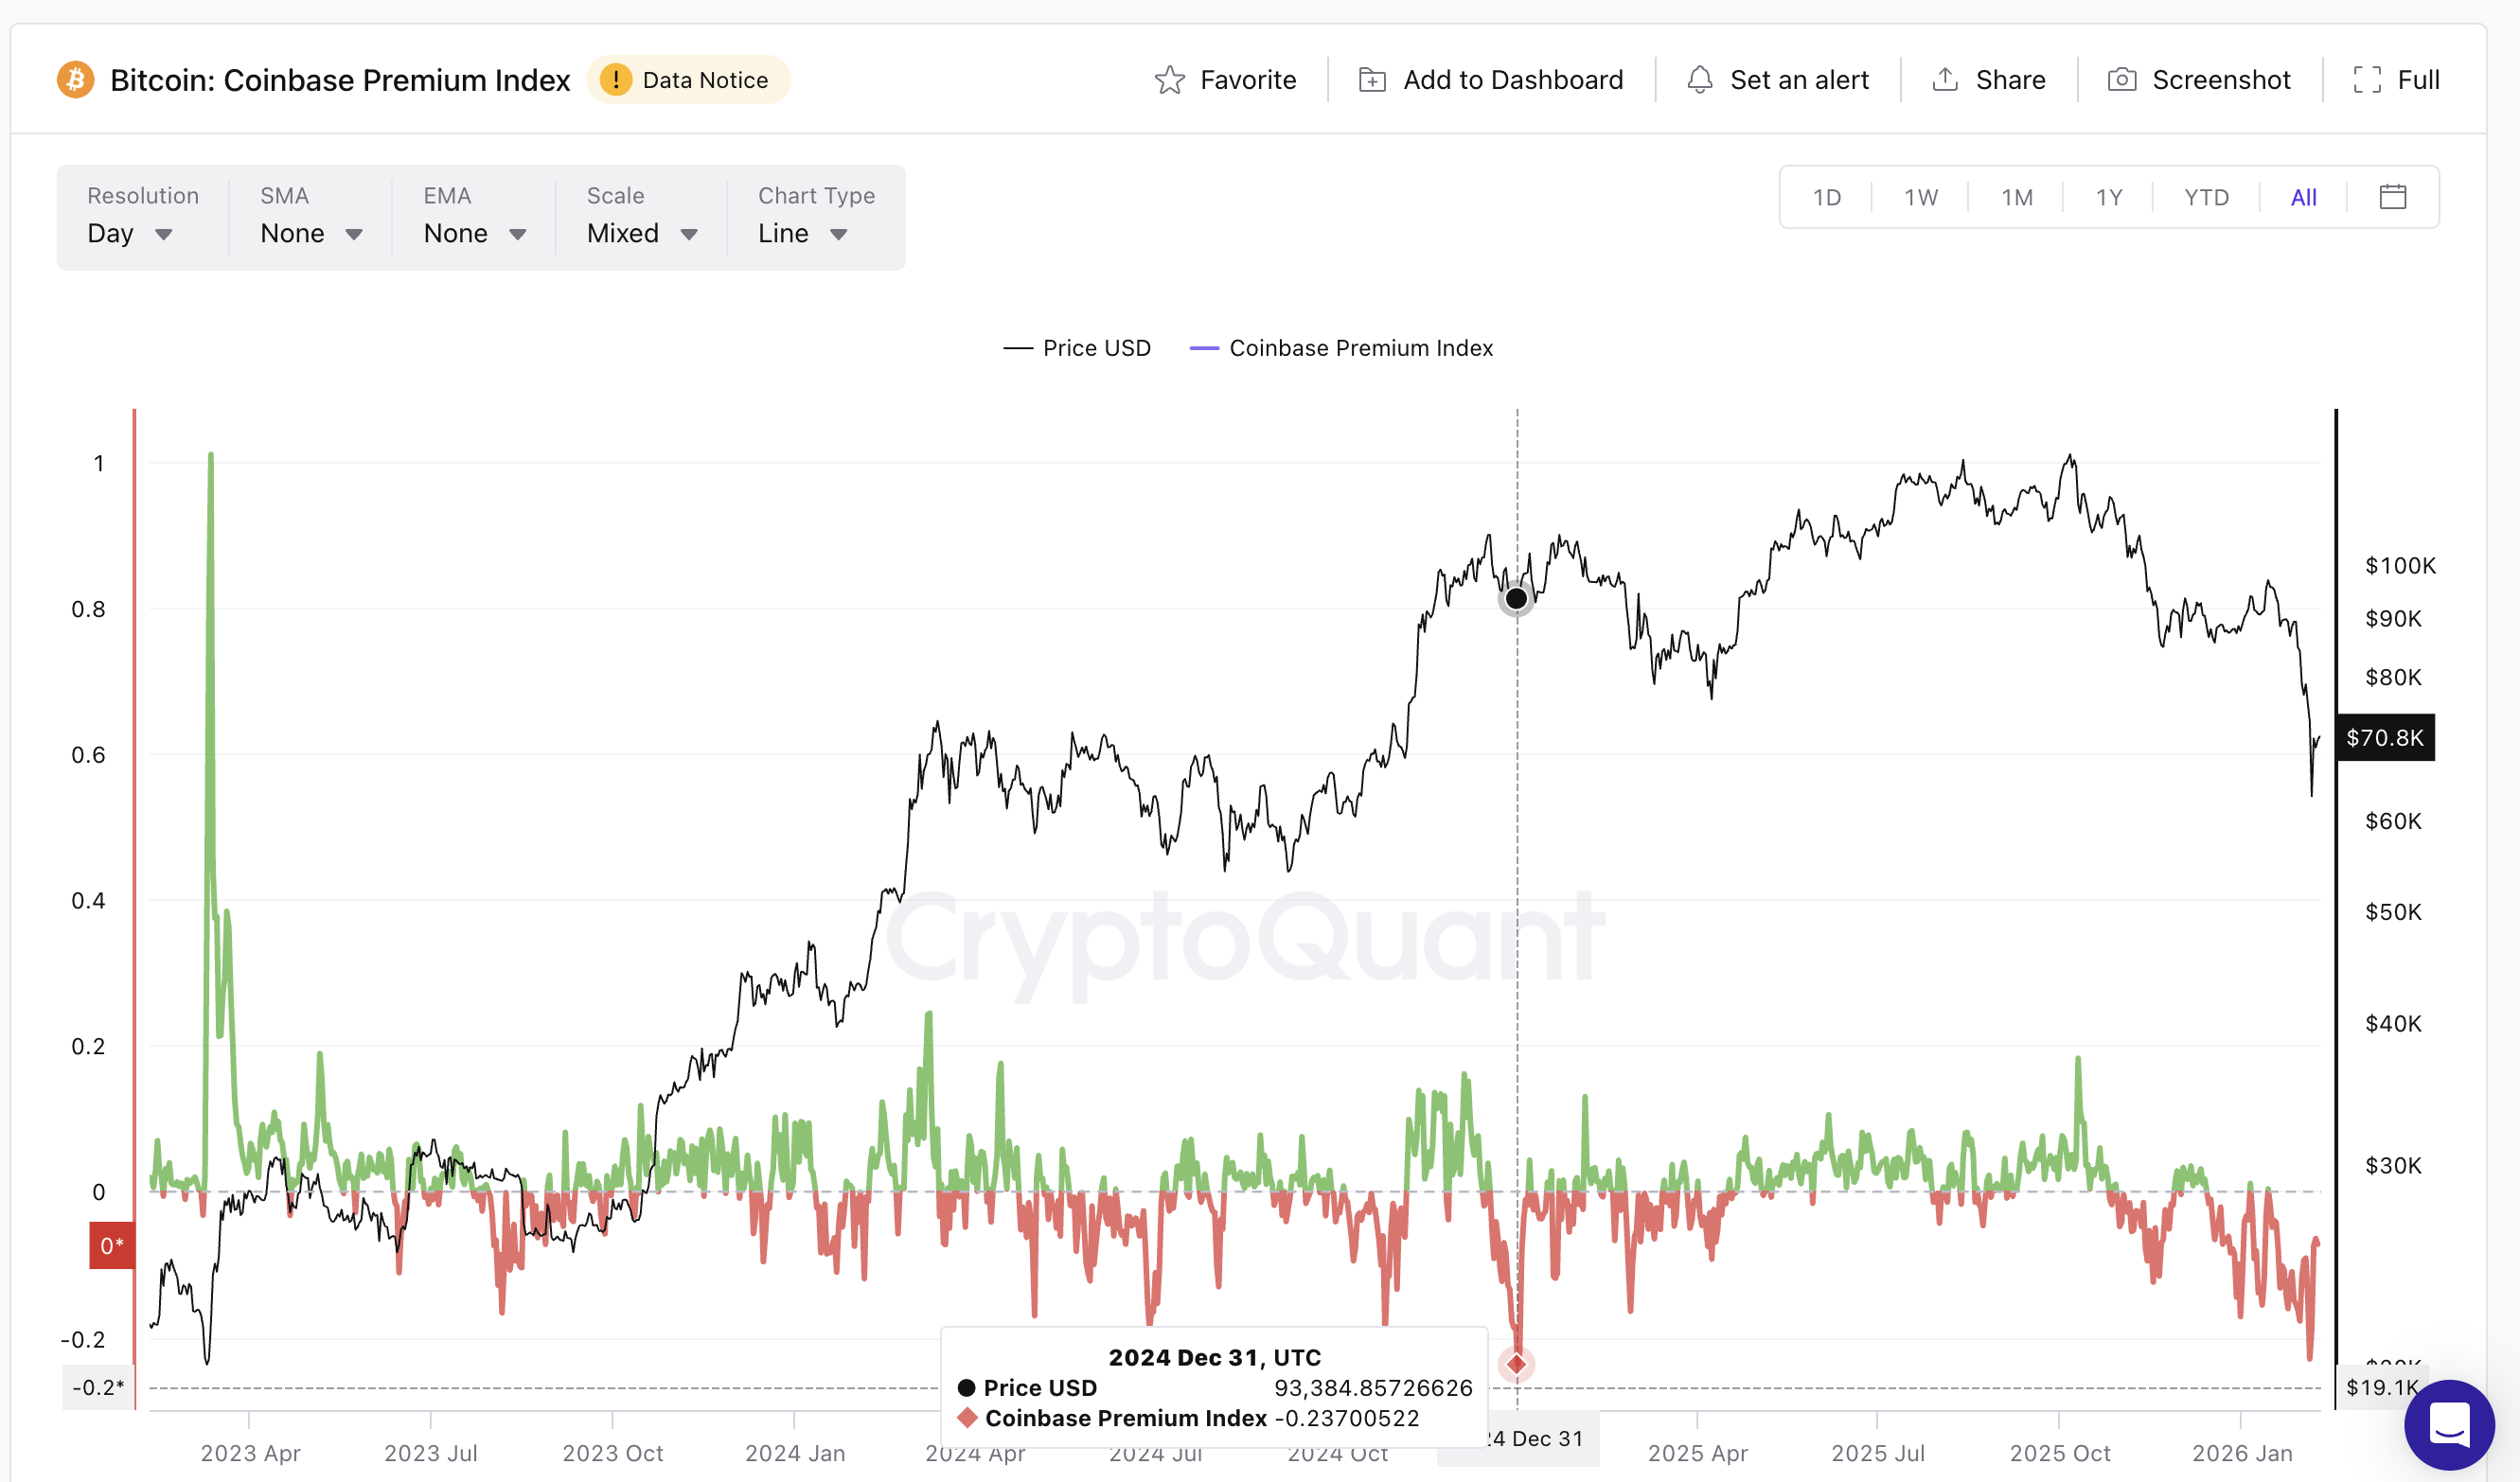
This technical weakness does not exist in isolation. It comes even as US demand has started to improve.
The Coinbase Premium Index tracks whether Bitcoin trades at a premium or discount on US-based Coinbase compared with global exchanges. It primarily reflects American institutional demand.
On February 4, the index fell to around -0.22, showing weak US participation. This level closely matched December 31, 2024, when the index dropped to -0.23. At that time, Bitcoin traded near $93,300.
Sponsored
Sponsored
Want more token insights like this? Sign up for Editor Harsh Notariya’s Daily Crypto Newsletter here.
Many traders believed a bottom had formed. Instead, the price later fell to about $76,200, a decline of nearly 18%.
Since early February, the index has recovered to near -0.07, signaling improving US interest and aligning with the Klinger oscillator’s rising reading. However, history shows that demand recovery often comes before price bottoms, not after. In 2024, US demand improved first. The deeper correction came later.
On-chain data adds another layer of risk.
The 1-day to 1-week holder group, made up of short-term traders, increased its share of supply from about 2.05% to over 3.3% since February 5 (during the 20% rebound). That is a rise of more than 60% in just days, as highlighted by HODL Waves, a metric segregating wallets by time.
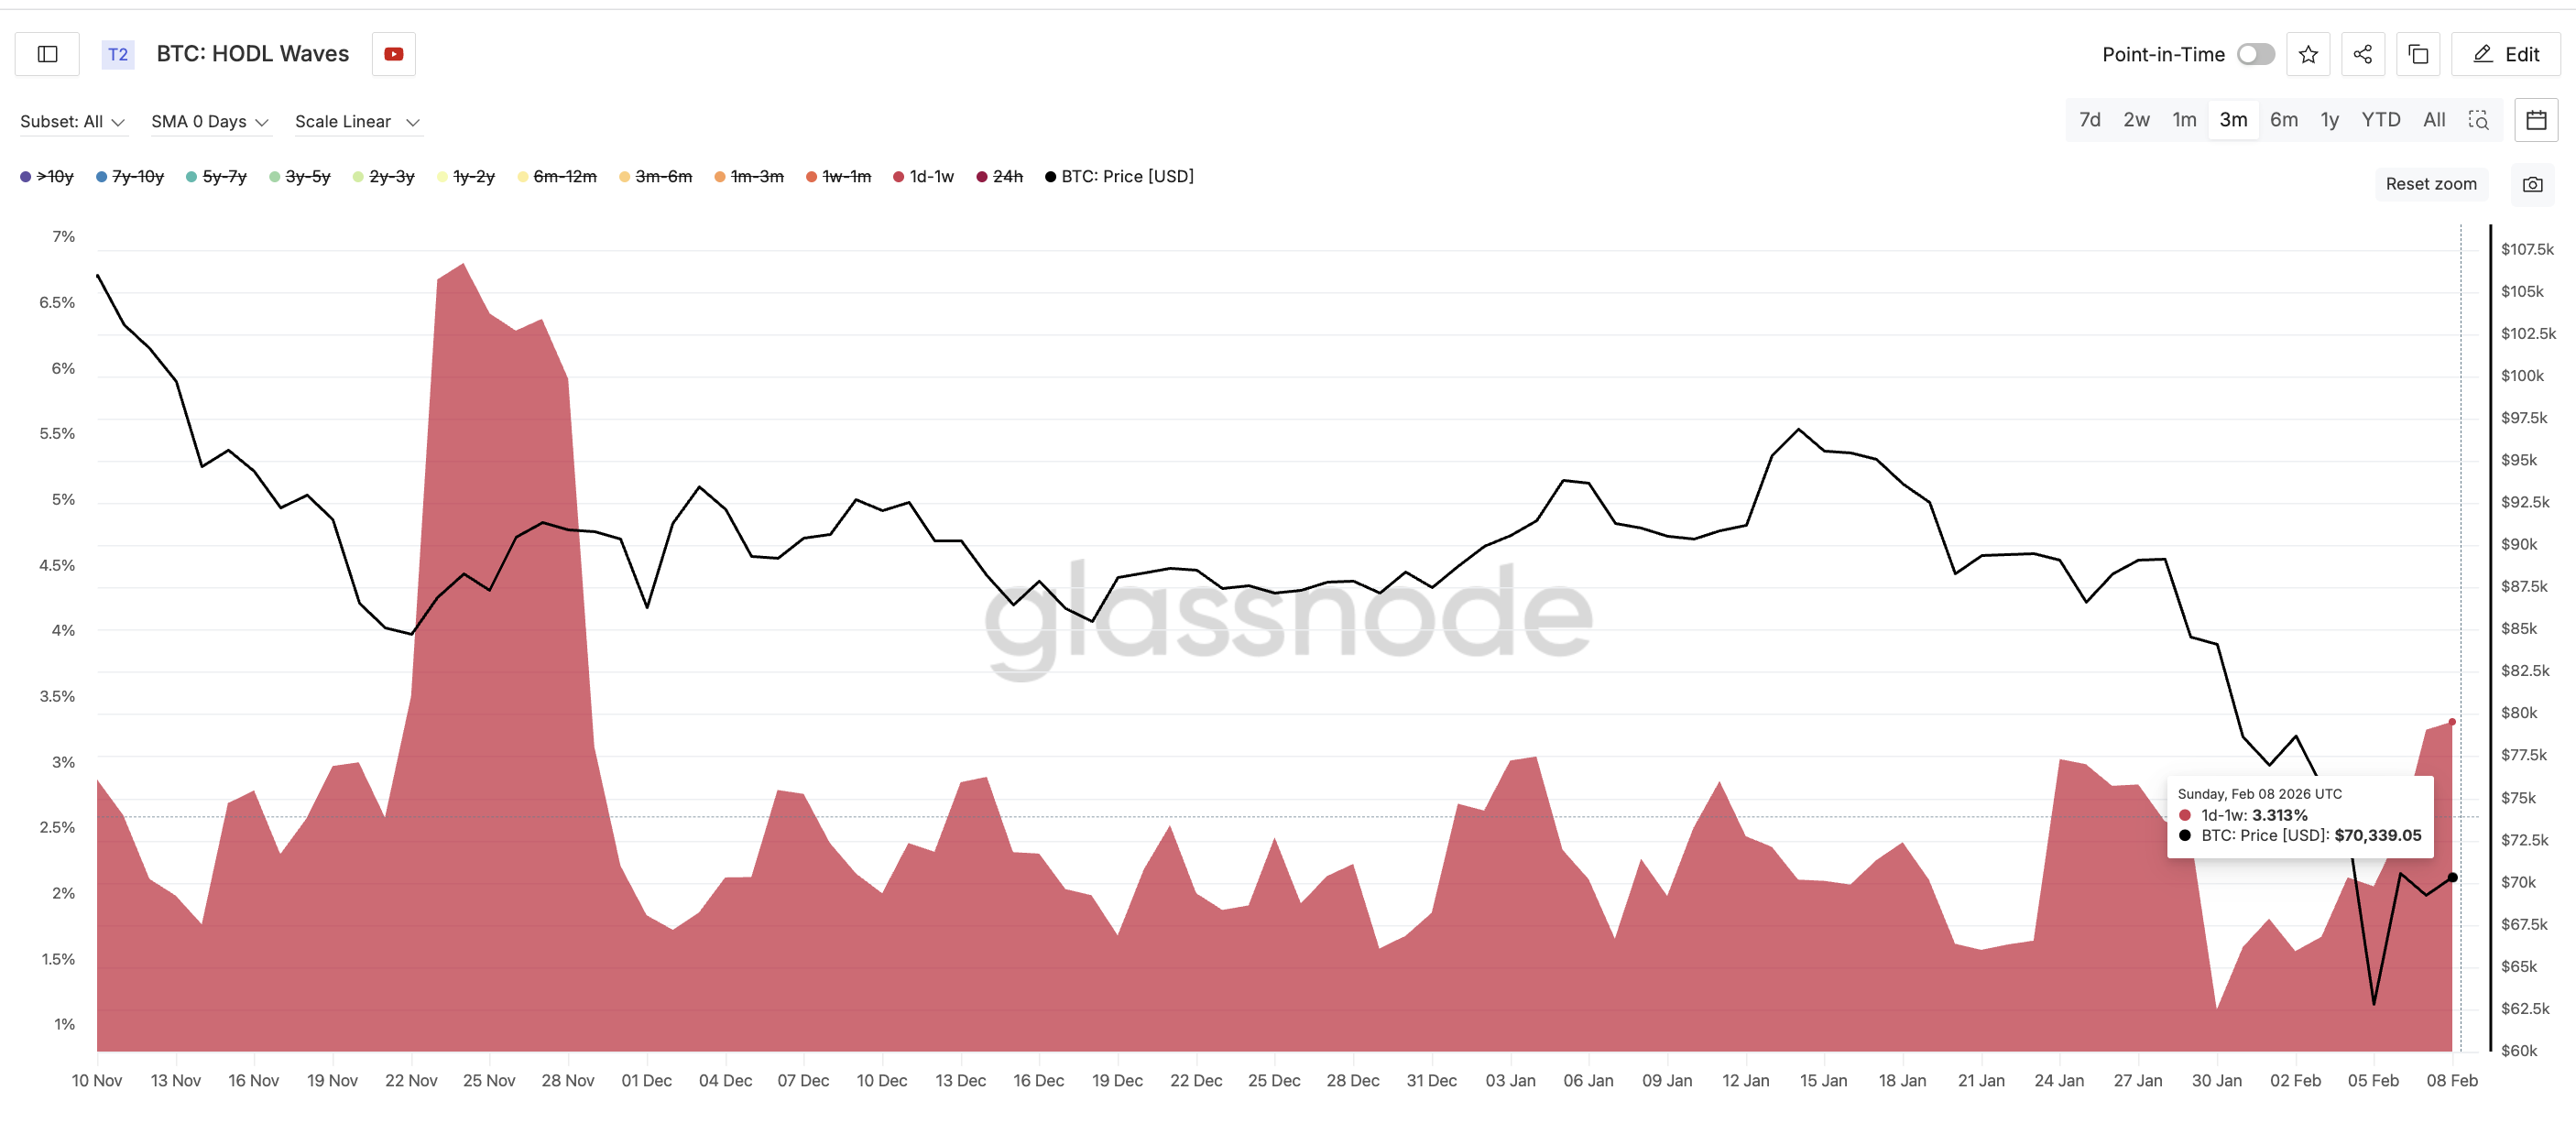
This cohort tends to sell quickly when prices weaken. Their growing presence makes the market more unstable. A similar surge in short-term holders in late January was followed by a rapid 3% pullback. So far, improving US demand is being matched by rising speculation, not strong conviction.
Sponsored
Sponsored
Key Bitcoin Price Levels Show Where the Bounce Could Fail
All signals now converge around a few critical Bitcoin price zones.
The first major support sits near $67,350. A daily close below this level could restart selling pressure.
If that breaks, the next downside targets are:
- $60,130, the recent low
- $57,900 (a key Fibonacci support and a mear 18% correction zone from the current levels)
- $53,450 a major retracement zone
- $43,470, the bear flag projection
A move from current levels to $43,400 would represent a further decline of roughly 35%. On the upside, Bitcoin must reclaim $72,330 to stabilize and get out of the possible bull trap. This level capped recent rallies.
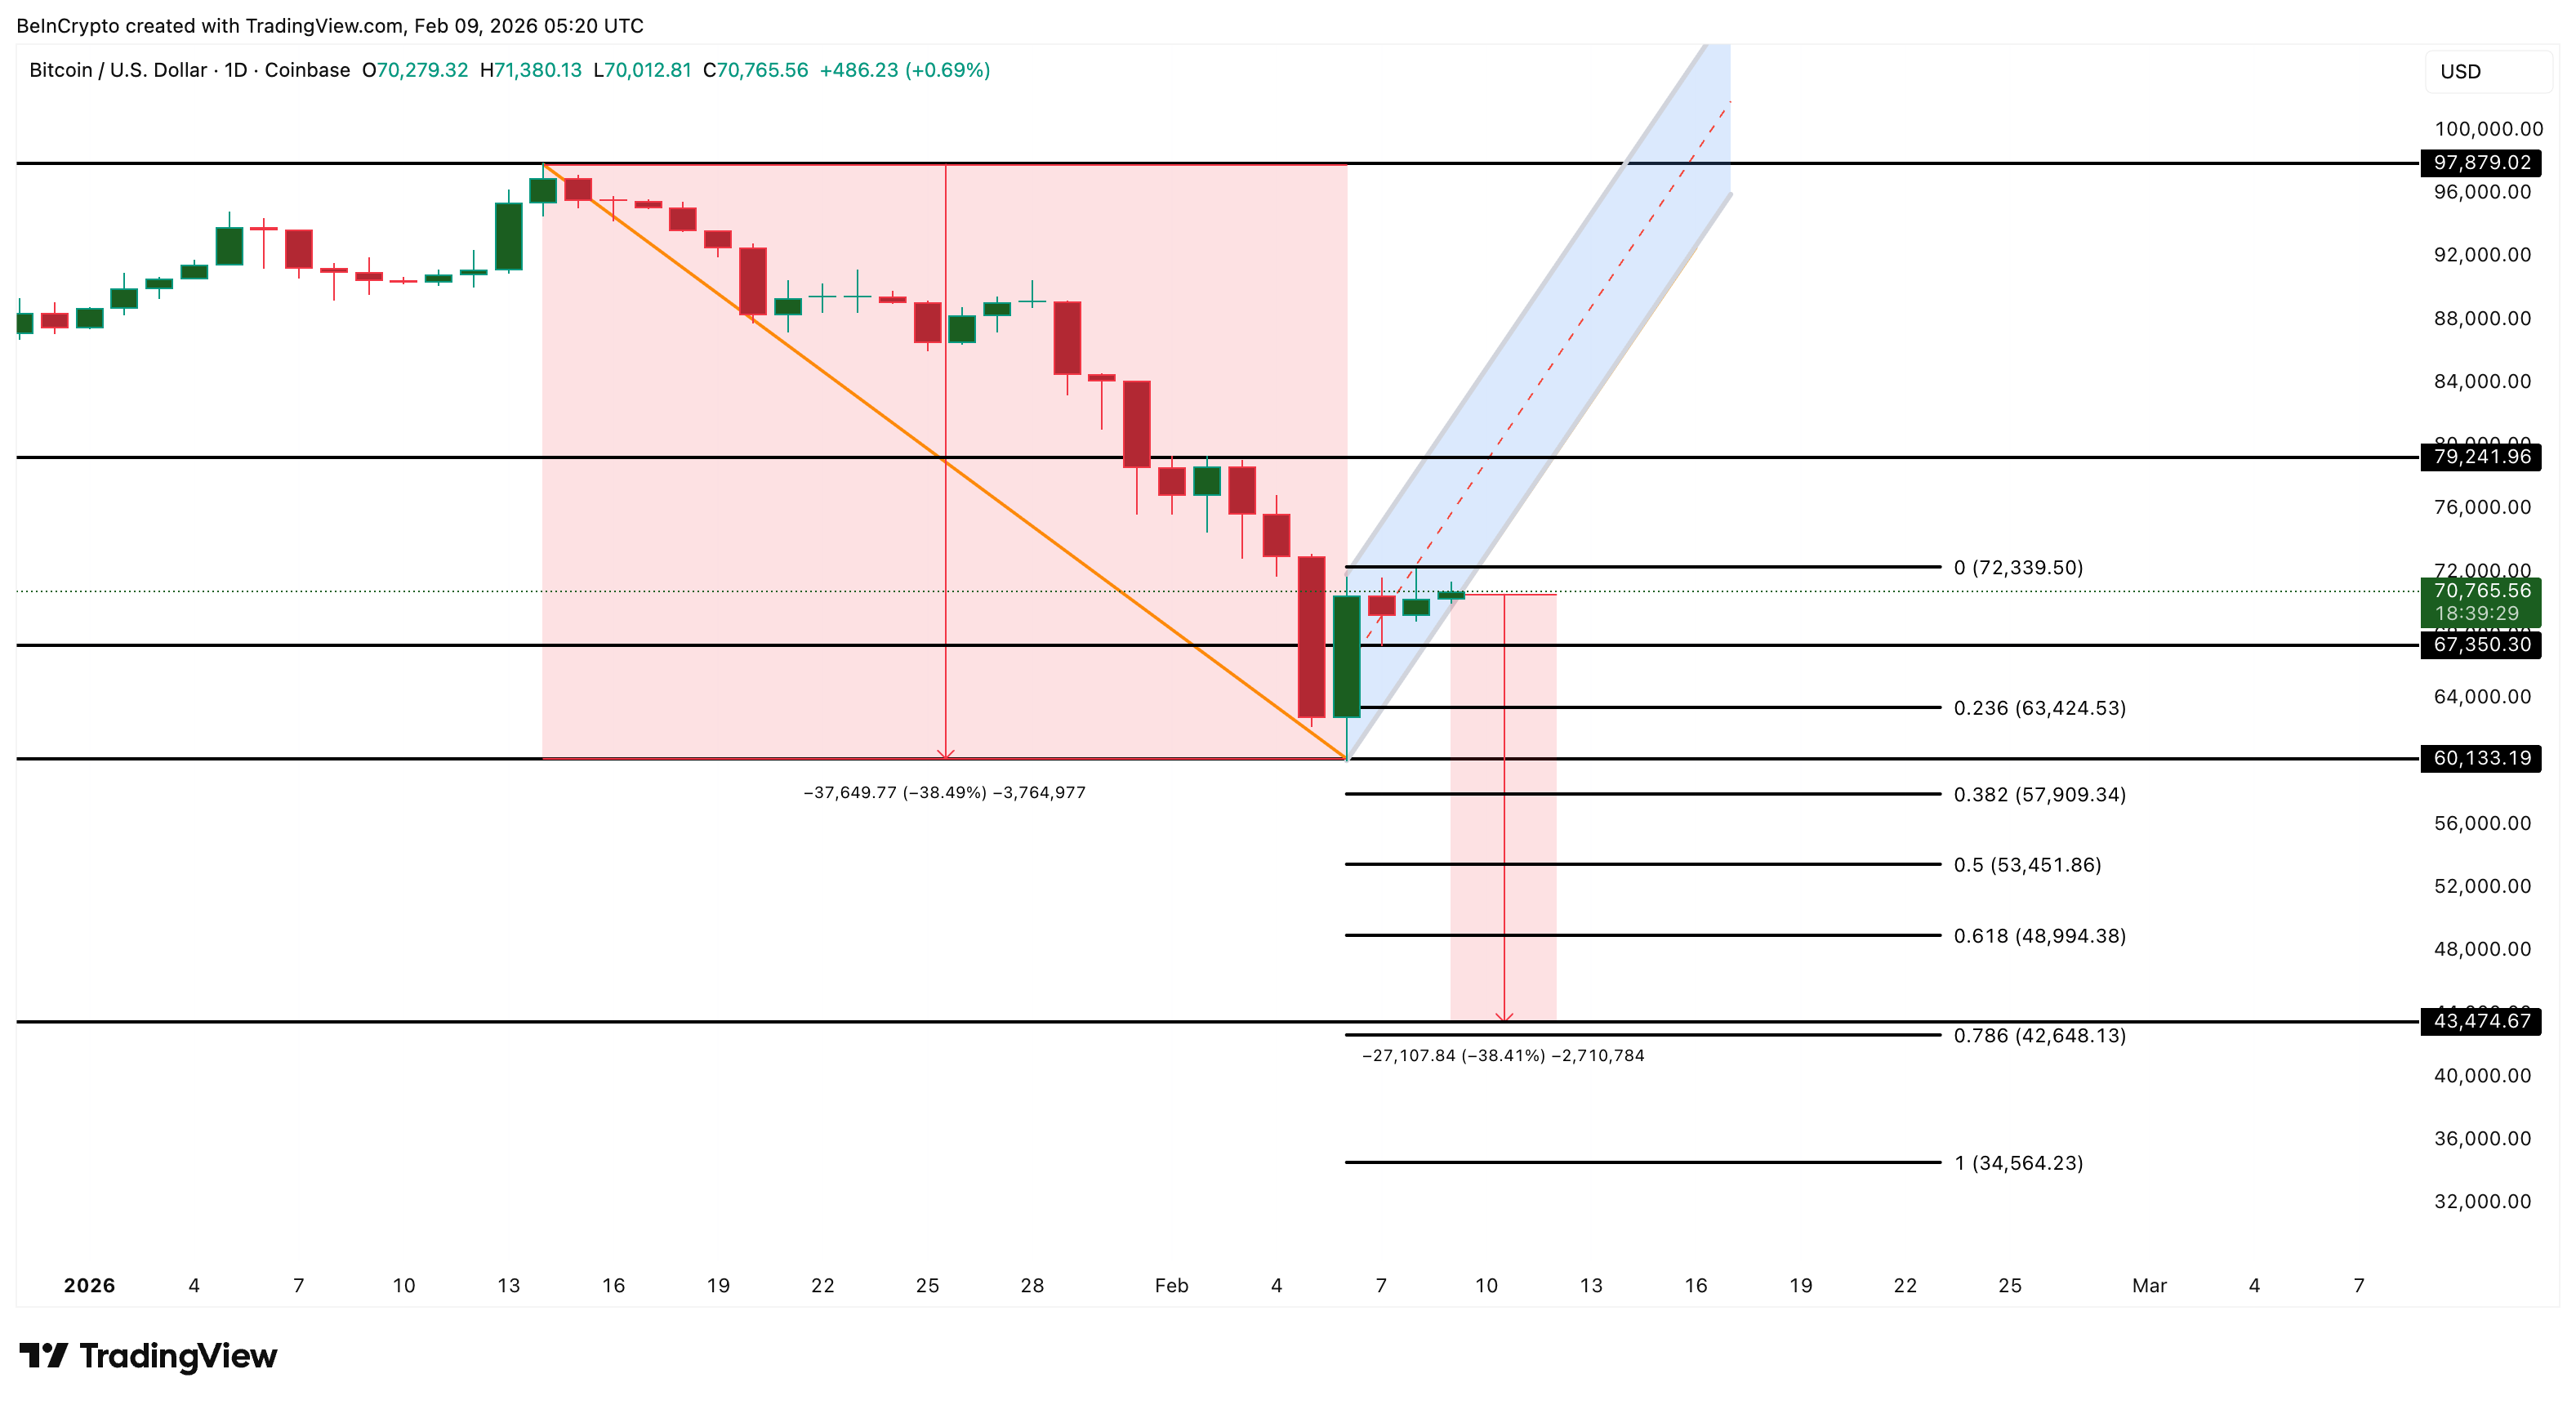
Above that, $79,240 remains decisive. Recovering this zone would retrace about half of the prior fall and likely invalidate the bearish structure. Only then would the path toward $97,870 reopen. Until that happens, all Bitcoin price rallies remain vulnerable.


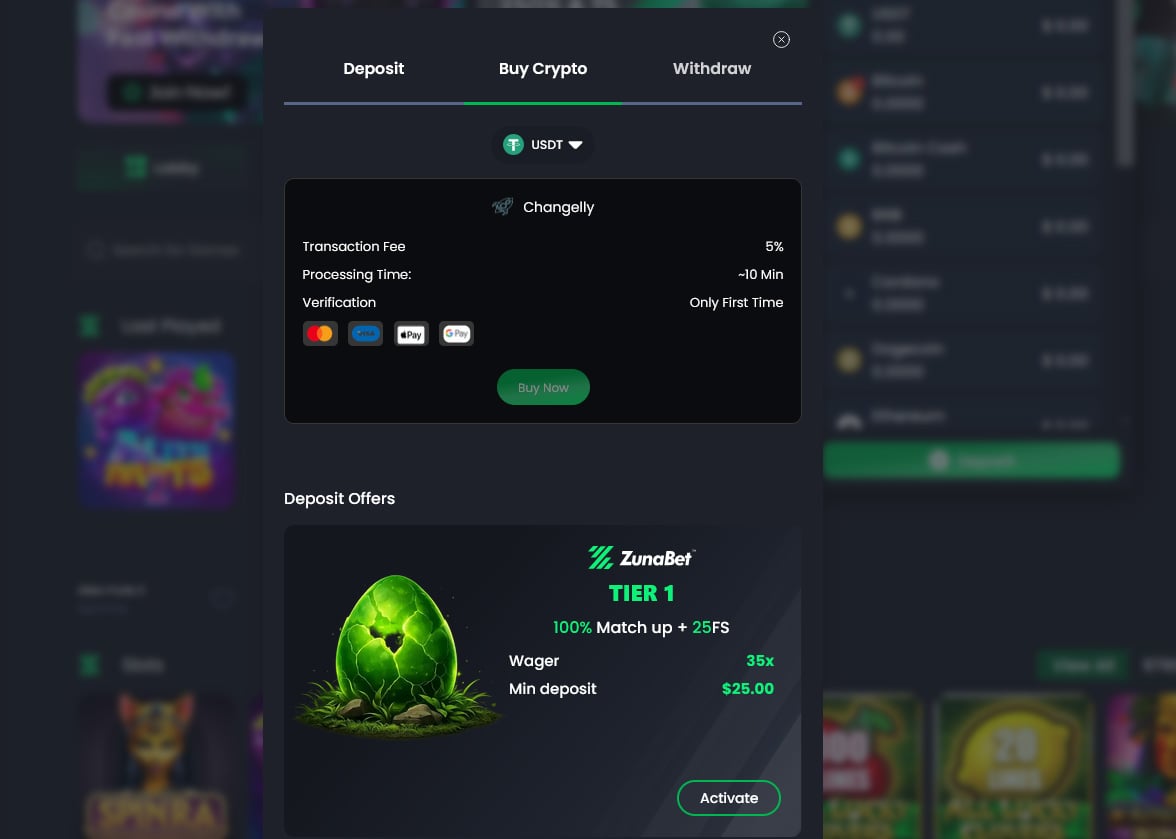
Something is shifting in the crypto casino market. Search volumes for terms like “Stake alternative,” “sites like Stake,” and “Stake.com replacement” have been climbing steadily throughout 2026. Stake.com remains one of the most visited crypto gambling platforms in the world, so the rising interest in alternatives is not about Stake failing — it is about players wanting more. More games, more bonuses, more ways to earn while they play. ZunaBet is one of the names that keeps appearing in those searches. Launched in 2026, it has quickly positioned itself as the kind of platform that players leaving or supplementing Stake are looking for. This article examines what is driving the trend and how the two platforms compare.
Stake.com: Where Things Stand
Stake.com has been a force in crypto gambling since 2017. Licensed in Curaçao, it grew rapidly by being one of the first platforms to build a serious gambling product entirely around cryptocurrency. Bitcoin, Ethereum, Litecoin, Dogecoin, and other major coins are all supported for deposits and withdrawals.
The platform made its name with a lineup of provably fair original games. Crash, Plinko, Dice, Mines, and similar titles became synonymous with the Stake brand and built a community of dedicated players. Third-party games from providers like Pragmatic Play, Evolution, and Hacksaw Gaming fill out the rest of the casino with slots and live dealer tables.
Stake also operates a full sportsbook covering football, basketball, tennis, MMA, esports, and other markets. The odds are competitive and the interface is clean, which keeps experienced bettors engaged.
For years, Stake has held a dominant position in the crypto gambling space. But dominance invites scrutiny, and players who have spent time on the platform are increasingly vocal about the areas where Stake falls short of their expectations.
Why Players Are Looking Elsewhere
The search interest in Stake alternatives does not come from nowhere. Several recurring themes show up in community discussions, forums, and social media conversations about why players are exploring other options.
The most frequently mentioned issue is the lack of a welcome bonus. Stake does not offer any deposit match, free spins, or sign-up promotion for new players. You deposit and you play with exactly what you put in. All rewards are funneled through an invite-only VIP program that activates based on sustained high-volume wagering. For players who do not wager at that level, Stake offers no additional value beyond the games themselves.

The VIP program itself generates mixed opinions. Players who have earned an invitation generally speak well of the rakeback and bonuses they receive. But the closed nature of the system frustrates everyone else. There are no published tiers, no public requirements, and no way to track your progress toward an invitation. For many players, it feels like a program that exists for someone else.
Game library size is another factor. Stake carries a solid selection, but newer platforms have launched with significantly larger catalogs, making Stake’s offering feel less comprehensive by comparison.
These gaps have created an opening in the market, and platforms like ZunaBet have stepped directly into it.
ZunaBet: What the Alternative Looks Like
ZunaBet launched in 2026 under Strathvale Group Ltd with an Anjouan gaming license. The team behind it has more than 20 years of combined online gambling experience. The platform was built from scratch as a crypto-native operation — cryptocurrency is not a payment add-on but the foundation of the entire system.
The game library immediately addresses one of the most common complaints about Stake. ZunaBet offers over 11,000 games from 63 providers, including Pragmatic Play, Hacksaw Gaming, Yggdrasil, BGaming, and Evolution. That covers slots, RNG table games, and live dealer experiences. With 60+ studios contributing content, the range of game styles, themes, and mechanics is among the widest in the crypto casino space. Players moving from Stake to ZunaBet are unlikely to feel like they are downsizing.
The sportsbook is fully integrated. Coverage includes football, basketball, tennis, NHL, combat sports, virtual sports, and esports markets for CS2, Dota 2, League of Legends, and Valorant. One account and one balance handle everything, so switching between casino and sports is seamless.
ZunaBet supports more than 20 cryptocurrencies: BTC, ETH, USDT across multiple blockchains, SOL, DOGE, ADA, XRP, and others. No platform processing fees are applied. Withdrawals are built for speed. Apps are available for iOS, Android, Windows, and MacOS, with live chat running 24/7.
The Bonus Gap
This is the single biggest reason players search for Stake alternatives, and it is where ZunaBet makes its strongest first impression.
Stake offers nothing when you sign up. No matched deposit. No free spins. No promotional credit. Your first session is funded entirely by your own money with zero cushion.
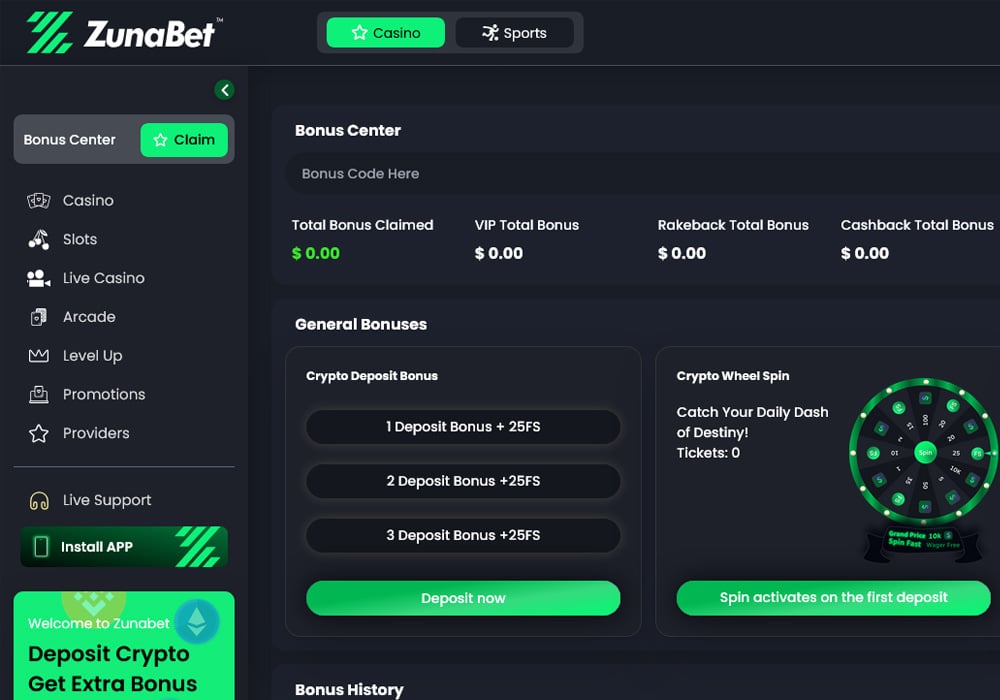
ZunaBet opens with a welcome package worth up to $5,000 plus 75 free spins across three deposits. First deposit: 100% match up to $2,000 with 25 free spins. Second deposit: 50% match up to $1,500 with 25 spins. Third deposit: 100% match up to $1,500 with 25 spins. The three-deposit structure keeps bonus value flowing across a player’s first several sessions rather than concentrating it all on day one.
For a player evaluating whether to try a new platform, this alone answers the question. ZunaBet gives you significantly more to work with from the start, which means more games explored, more bets placed, and more time on the platform before your own funds carry the full weight.
Loyalty: Closed System vs Open Progression
The loyalty comparison is the second major driver of the search trend.
Stake’s VIP program operates behind closed doors. Invitation is based on wagering volume, but the thresholds are not published. Players have no visibility into where they stand or how close they are to qualifying. Those who make it in report strong benefits — rakeback, recurring bonuses, and personal account management. Those who do not make it in see nothing. For a large portion of Stake’s user base, the VIP program might as well not exist.
ZunaBet takes the opposite approach with a dragon evolution loyalty system featuring six published tiers. Squire starts at 1% rakeback. Warden gives 2%. Champion gives 4%. Divine gives 5%. Knight gives 10%. Ultimate reaches 20%. Each tier also unlocks free spins scaling up to 1,000, VIP club membership, and double wheel spins. A dragon mascot named Zuno gives the program personality and makes the progression feel gamified rather than transactional.
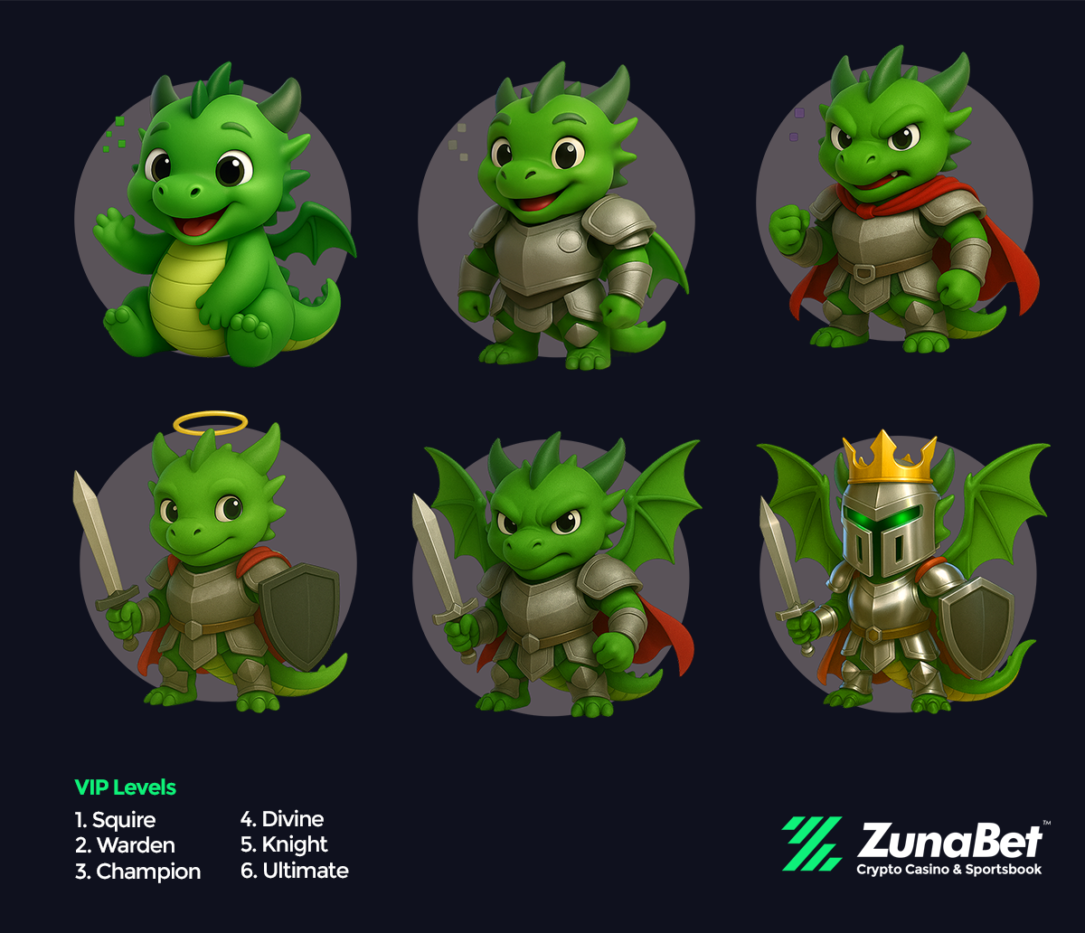
Every element of ZunaBet’s loyalty program is visible from day one. Players see every tier, every reward, and every requirement the moment they create an account. There is no ambiguity and no closed doors. For players frustrated by Stake’s opaque VIP system, this transparency is exactly what they are looking for. The 20% rakeback ceiling at the Ultimate tier offers a return rate that matches or exceeds what many Stake VIP members report receiving, but without requiring an invitation to access.
The Broader Crypto Casino Shift
The surge in alternative searches is not just about Stake specifically. It reflects a broader maturation of the crypto gambling market. When Stake launched in 2017, the options were limited and any decent crypto casino attracted players almost by default. In 2026, the landscape is crowded with platforms competing aggressively on bonuses, game variety, coin support, and loyalty rewards.
Players have become more sophisticated in how they evaluate platforms. They compare wagering requirements, check rakeback percentages, count supported cryptocurrencies, and read the fine print on loyalty programs. The era of sticking with one platform out of habit or lack of alternatives is fading.
ZunaBet benefits directly from this shift. Supporting over 20 cryptocurrencies with no processing fees, offering a game library that dwarfs most competitors, and running a loyalty program with published tiers and up to 20% rakeback positions it as the kind of platform that informed players actively seek out. It was built for a market where players shop around, and it was designed to win that comparison.
Both Stake and ZunaBet sit firmly in the crypto camp, which already separates them from traditional fiat operators like DraftKings, BetMGM, FanDuel, and Caesars. Those platforms process payments through banks and cards with slower withdrawals and higher fees. For players whose finances already run on crypto, neither traditional platform is a natural fit. The real choice for crypto gamblers in 2026 is between established crypto platforms like Stake and newer ones like ZunaBet that are pushing the category forward.
What the Search Trend Signals
Rising search interest in Stake alternatives is not a sign that Stake is declining. It is a sign that the market has evolved past what any single platform established years ago can satisfy without adapting. Players want welcome bonuses. They want transparent loyalty programs. They want massive game libraries and broad crypto support. They want platforms that earn their loyalty rather than assume it.
ZunaBet checks every one of those boxes. A $5,000 welcome bonus with free spins. Over 11,000 games from 63 providers. More than 20 supported cryptocurrencies with zero fees. A six-tier loyalty program reaching 20% rakeback with full visibility. A complete sportsbook with esports. It is a platform built specifically for the player who typed “Stake alternative” into a search engine and wanted to find something better.
Stake wrote the early playbook for crypto casinos. ZunaBet is writing the updated version — with more generosity, more transparency, and more reasons to choose it over what came before. The search trends suggest that a growing number of players are ready for that next chapter, and ZunaBet is the platform best positioned to deliver it.
Disclaimer: This is a Press Release provided by a third party who is responsible for the content. Please conduct your own research before taking any action based on the content.

The digital asset space has shifted a lot in 2026. The era of speculative retail frenzies is being replaced by a sophisticated, capital-heavy infrastructure driven by global institutions.
We are witnessing a historic migration. Crypto innovation is moving from hype-cycle headlines into the mission-critical backends of the world’s largest asset managers, banks, and payment networks.
As the border between TradFi and crypto effectively vanishes, the market requires something more effective than a “popularity contest” to identify its true leaders. It requires a data-backed standard of excellence.
Enter the BeInCrypto Institutional 100 Awards.
Unlike traditional industry awards that often rely on subjective “vibes” or paid placements, BeInCrypto has unveiled a data-backed framework designed to measure excellence across the entire institutional value chain.
Whether the category is high-speed trading infrastructure, the tokenization of real-world assets, or large-scale enterprise rollouts, the 2026 evaluation process is anchored by one “gold standard” rule: Show us the receipts.
In crypto, we know that marketing often outpaces reality. So, how do you solve this? Every point a nominee earns must be backed by an auditable data source. If you can’t trace it to a specific metric, a regulatory filing, or a verified on-chain event, it doesn’t count.
BeInCrypto has built a “firewall” around its rankings. No entity can purchase, negotiate, or lobby for a spot on this list. Unlike traditional awards, where a small committee might pick winners based on personal connections or brand recognition, our process is entirely transparent and traceable.
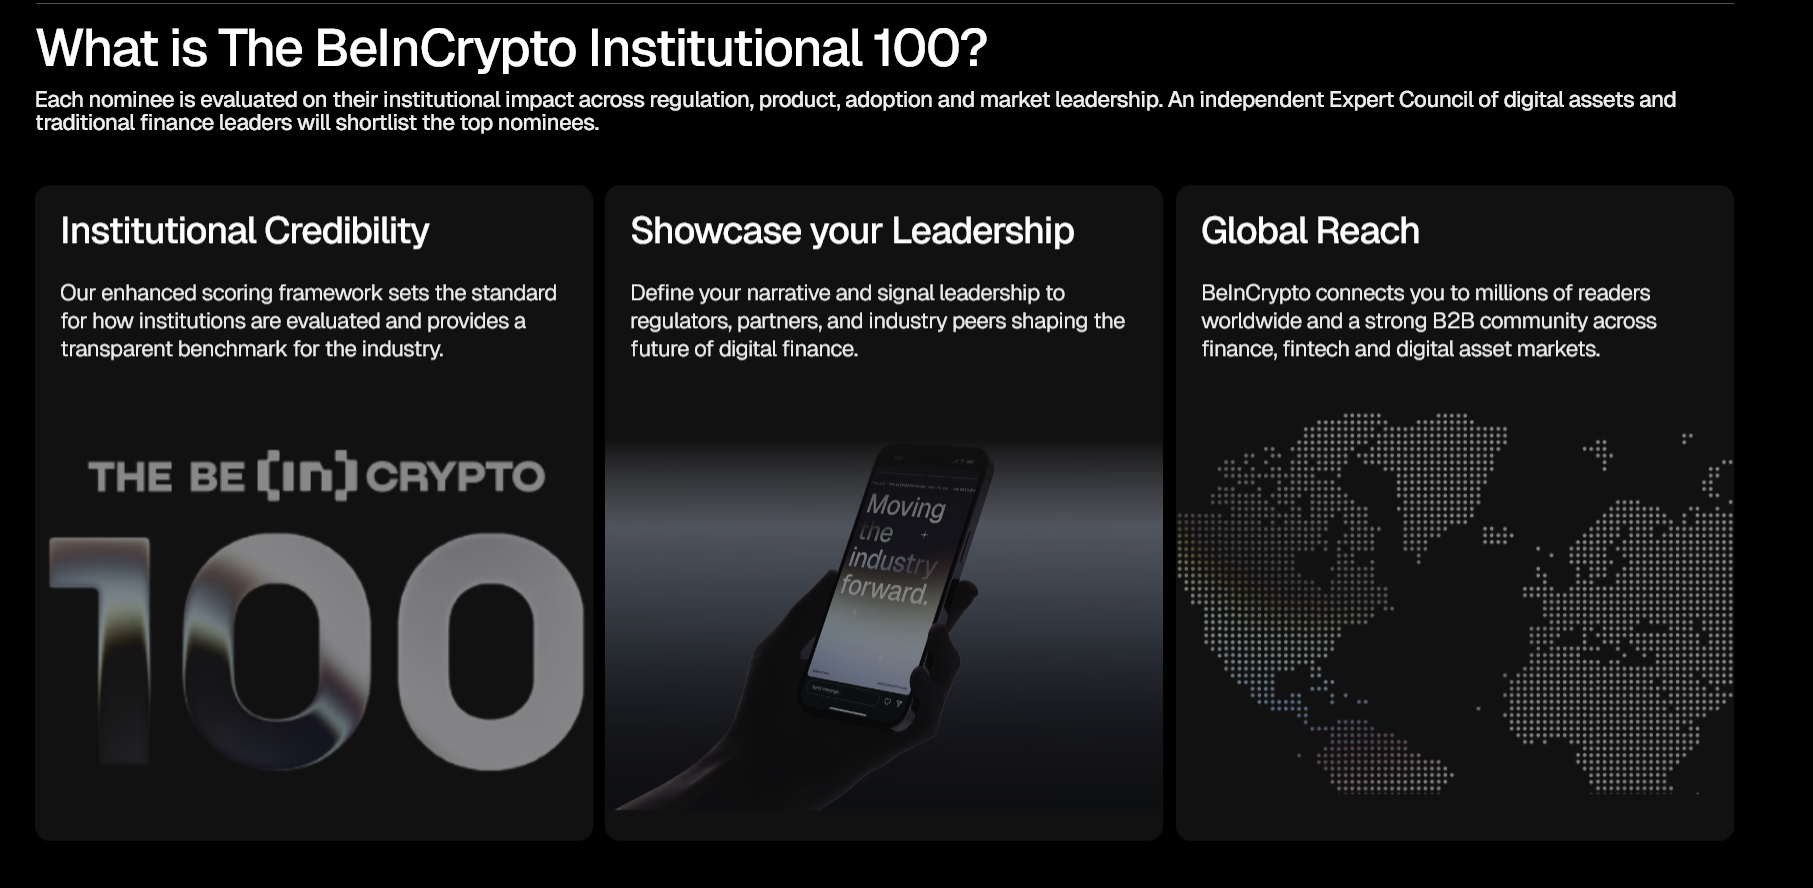
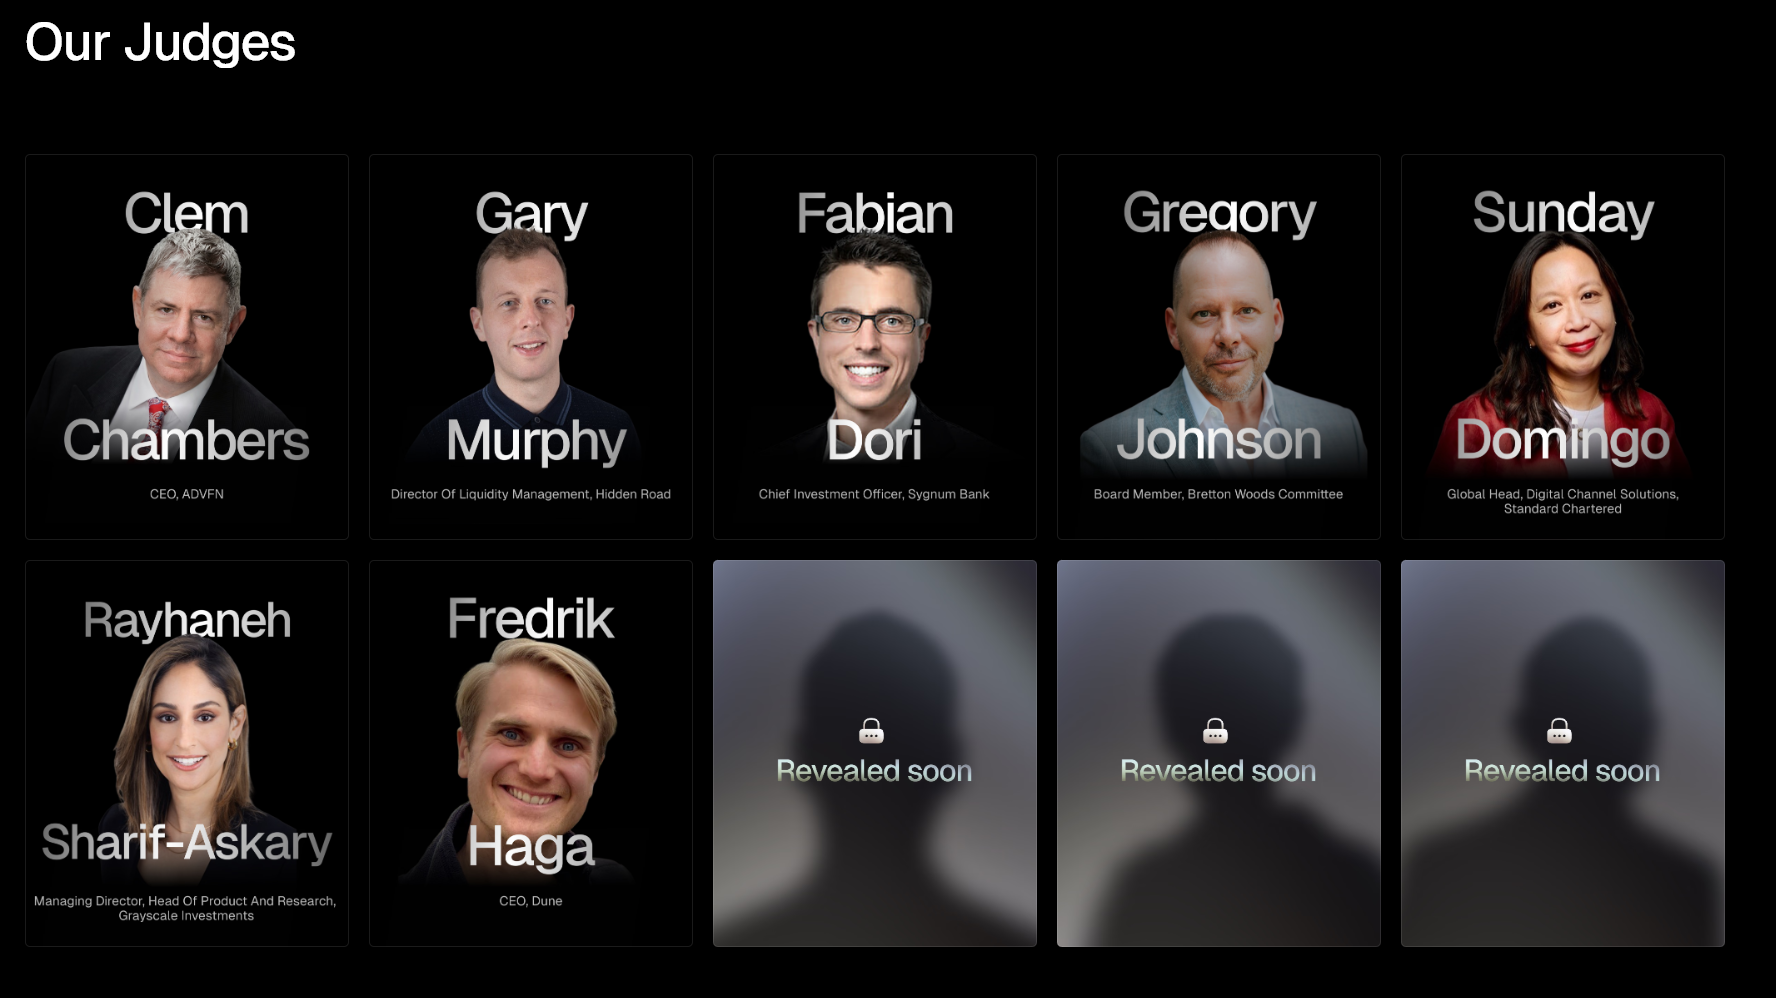
To ensure total fairness, we use a two-stage evaluation designed to eliminate “anchoring bias,” that common human tendency to automatically favour “big names” over better-performing newcomers. Here is how the process works:
- Stage 1: The Data Filter
We start by looking at the numbers. This stage is purely mathematical, using hard metrics to filter dozens of candidates down to the top contenders. If the data doesn’t back up the hype, the nominee doesn’t move forward.
- Stage 2: The Expert Council
The top candidates are then reviewed by a panel of industry veterans. Their job isn’t to pick favorites, but to interpret the data profiles through the lens of real-world experience, strategic execution, and leadership.
- The Result
This creates a ranking where a disruptive, high-growth “underdog” can actually unseat a legacy giant, provided the data proves they are doing a better job.
A Methodology Built for Reality
Institutional finance is built on privacy and proprietary strategy. Many firms treat their specific user numbers and revenue splits as confidential, which often leaves researchers with a “data gap.”
BeInCrypto uses a specialized toolkit of Derived Estimation Methods to ensure these firms are still measured accurately.
Reverse-Engineering Impact
If a firm doesn’t disclose specific user counts, our analysts work backward. Using Revenue-Ratio Inference, we take reported segment earnings and apply industry benchmarks to find a realistic activity level.
The “Reciprocity” Test
We verify partnership claims by checking the other side of the deal. Through Partnership Reciprocity Testing, we search the communications of a nominee’s partners. A partnership that is actively acknowledged by both parties carries significantly more weight than a one-sided claim.
Regional Modeling
By combining a company’s total footprint with local crypto adoption data from sources like Chainalysis, we build an accurate map of their actual influence in specific global markets.
The Three-Track Architecture
You wouldn’t use a ruler to measure the temperature, and you shouldn’t use the same criteria to measure a Bitcoin ETF as you would a New York Law Firm. To keep things fair, the 2026 methodology splits all 25 award categories into three specialized “tracks” based on what kind of data is available.
Track A: The Data-First Track
- Best for: High-transparency products like ETFs, On-Chain Protocols, and Asset Managers.
- How it works: In this track, the numbers do 50% of the talking. Because we can see exactly how much money is moving on the blockchain or in a fund, the data carries equal weight with our experts.
- Example: When evaluating “Best Digital Asset Product,” we look at $AUM$ (Assets Under Management) and daily inflows. If a new Bitcoin ETF is growing at 300% month-over-month, the data automatically pushes it to the top of the pile.
Track B: The Hybrid Track
- Best for: Consumer-facing companies like Neobanks, Crypto Brokers, and Onramps.
- How it works: These companies often have “hidden” data, like how many monthly active users they actually have. This track rewards transparency. We give a 20% “bonus” weight to firms that voluntarily share their internal metrics with our researchers.
- Example: If two Digital Banks have similar public reputations, but Bank A provides verified data on their institutional client growth while Bank B stays silent, Bank A earns a higher “Transparency Score,” giving them the competitive edge.
Track C: The Expert-Led Track
- Best for: Complex areas like Governance, Regulatory Compliance, and Policy Leadership.
- How it works: You can’t measure “good leadership” with a spreadsheet alone. In this track, our Expert Council, veterans from traditional finance and legal sectors, provides 80% of the score. However, we still include a 20% “sanity check” based on measurable signals.
- Example: For “Best Compliance Program,” the Council looks at the quality of a firm’s legal framework. But we anchor that opinion with data, such as: How many licenses do they actually hold? or What is the ratio of compliance staff to total employees? This ensures even “expert opinions” are rooted in reality.
Negative Signals
Innovation shouldn’t come at the cost of integrity. Every nominee faces a mandatory Negative Signal Scan.
This isn’t just a Google search. Our team scours SEC and VARA enforcement databases, Immunefi bug bounty records, and the DefiLlama Hacks database.
An unresolved security breach or a major regulatory fine isn’t just a “red flag,” it’s often a disqualifier. By baking risk assessment into the core score, BeInCrypto ensures that the “Institutional 100” represents the most stable and reliable actors in the space.
Looking Ahead to June 2026
The BeInCrypto Institutional 100 is about setting a real-world benchmark for an industry that has finally found its footing.
By opening up our playbook and publishing this methodology in full, we’re doing more than just handing out awards; we’re inviting the entire market to hold us and the winners to a much higher standard.
When the winners are revealed this June, you’ll know exactly how they got there. In a market still crowded with noise, we’re placing our bets on the data.
The post The BeInCrypto Institutional 100: A Benchmark for the New Financial Stack appeared first on BeInCrypto.
Crypto World
Stanley Druckenmiller Doubles Down on Alphabet (GOOGL) and Amazon (AMZN) Stock Amid AI Cloud Boom

Quick Summary
- Stanley Druckenmiller continued accumulating Alphabet and Amazon shares for the second consecutive quarter
- His Alphabet holdings surged 277% while Amazon positions grew 69% during Q4
- The billionaire investor previously exited Nvidia and Palantir positions, rotating capital into these cloud giants
- Google Cloud delivered 48% year-over-year revenue growth while AWS reaccelerated to 24%
- Both companies currently trade at significant discounts compared to their historical cash flow valuations
Stanley Druckenmiller, who manages capital through Duquesne Family Office, expanded his holdings in Alphabet and Amazon during the final quarter of 2025. This marks consecutive quarters of accumulation for both technology giants.
According to his SEC 13F disclosure, Druckenmiller acquired 282,800 shares of Alphabet’s Class A stock alongside 300,870 Amazon shares. These purchases expanded his Alphabet stake by 277% and boosted his Amazon holdings by 69%.
The legendary investor earned his reputation delivering approximately 30% annualized returns between 1981 and 2010. Market participants and institutional money managers closely monitor his portfolio adjustments.
Druckenmiller previously maintained positions in Nvidia and Palantir but liquidated both holdings entirely. His capital has been redirected toward Alphabet and Amazon instead.
The strategic rationale behind both investments revolves around their dominant cloud computing platforms. Alphabet operates Google Cloud, which ranks as the third-largest cloud infrastructure provider globally. Amazon maintains AWS, the undisputed market leader.
Artificial Intelligence Fuels Cloud Platform Expansion
Google Cloud reported impressive 48% revenue expansion in the fourth quarter. AWS demonstrated renewed momentum with growth reaccelerating to 24% year-over-year.
Both cloud platforms are integrating generative artificial intelligence capabilities and advanced language models. These innovations are attracting fresh enterprise clients while encouraging existing customers to expand their spending.
Alphabet maintains approximately 90% dominance in worldwide internet search through Google. Amazon operates the leading e-commerce platform throughout the United States.
These investments aren’t pure-play artificial intelligence bets. Both corporations generate substantial, diversified revenue streams beyond their cloud computing segments.
Stock Valuations Present Historic Opportunities
Alphabet currently trades at 14.3 times its forecasted 2027 cash flow. Amazon appears even more attractively priced at just 9.7 times projected cash flow for the same period.
When measured against their five-year historical averages, Alphabet trades at a 20% discount while Amazon shows a substantial 48% discount. Both stocks represent historically attractive entry points based on cash flow metrics.
PwC research projects that artificial intelligence will contribute over $15 trillion to worldwide economic output by 2030. Druckenmiller’s recent purchases indicate his conviction that Alphabet and Amazon will capture significant portions of this value creation.
His fourth quarter filing revealed a 29% reduction in Taiwan Semiconductor Manufacturing holdings. This adjustment signals a strategic pivot away from semiconductor manufacturers toward companies deploying AI applications.
The 13F filing documents holdings as of December 31, 2025, and was submitted before the February 17, 2026 regulatory deadline.

Key Highlights
- Alphabet’s President of Global Affairs and Chief Legal Officer, John Kent Walker, divested 9,093 Class C shares on March 27, generating approximately $2.48 million
- Transaction prices ranged between $273.91 and $278.30 per share
- Needham maintained its Buy rating on March 27 with a $400 price objective
- Wells Fargo increased its price objective to $397 from $387, maintaining an Overweight stance
- The company finalized its $32 billion purchase of Wiz, a cloud security provider, on March 11
John Kent Walker, serving as Alphabet’s President of Global Affairs and Chief Legal Officer, executed a sale of 9,093 Class C shares on March 27, 2026, netting approximately $2.48 million. The sale occurred through several transactions, with share prices spanning from $273.91 to $278.30.
Additionally, on March 31, Walker completed a disposal and re-acquisition of 8,993 Class C shares through a transaction valued at $0 — a structure commonly linked to equity compensation plan activities.
The insider transaction hasn’t dampened investor enthusiasm, as the stock has posted an impressive 84% gain over the trailing twelve months.
Two prominent Wall Street analysts expressed optimistic views on GOOGL during the same timeframe.
Laura Martin from Needham reaffirmed her Buy recommendation on March 27, setting a $400 price objective. This target was initially elevated in February from $330, subsequent to Alphabet’s fourth-quarter earnings disclosure.
Wells Fargo similarly acted on March 27, elevating its price objective to $397 from the prior $387 while sustaining its Overweight designation.
Analyst Ken Gawrelski highlighted that GOOGL possesses “all the pieces necessary to be an AI winner,” citing its computational infrastructure, Google Cloud Platform, extensive distribution channels, and consumer data assets as critical competitive strengths.
Wiz Deal Reaches Completion
Alphabet successfully concluded its $32 billion acquisition of Wiz, the cloud and AI security solution provider, on March 11. Wiz will operate within Google Cloud while preserving its independent brand identity.
Wells Fargo anticipates the transaction will enhance Google Cloud’s platform revenue streams and operating profitability throughout fiscal years 2026 and 2027.
On the innovation front, Google has introduced enhancements to its Gemini AI assistant. Recent features enable users to transfer chat histories from competing AI applications — a strategic capability designed to attract users from alternatives like ChatGPT.
Gemini Enhancements and Developer Capabilities
Google unveiled the Gemini 3.1 Flash Live audio model, engineered for real-time conversational interactions with enhanced accuracy and reduced latency. The technology is currently accessible to developers and enterprise clients across various platforms.
Citizens has retained a Market Outperform rating on Alphabet, emphasizing expansion in AI-driven advertising solutions and cloud infrastructure.
Regarding legal developments, Evercore analysts highlighted a Delaware court decision that may affect insurance coverage disputes for companies including Alphabet. The decision is viewed as beneficial to insurance providers.
Based on InvestingPro analysis, the stock is presently trading marginally above its estimated Fair Value.

Brazil’s main stock exchange B3 will begin offering six new derivatives contracts on April 27 that allow investors to bet on the likelihood of future events, ranging from the price of bitcoin to movements in the dollar and Ibovespa index.
The instruments, called Event Contracts, operate on a framework similar to prediction markets like Kalshi and Polymarket. Prices range up to 100 reals ($19), with each contract’s price reflecting the market’s estimated probability of an outcome.
B3’s contracts are regulated by Brazil’s securities authority (CVM) and designed for professional investors, the exchange said.
The six contracts cover mini futures and spot prices for the Ibovespa index, the U.S. dollar, and bitcoin. They are structured with fixed payouts and known risks from the outset, like crypto price prediction markets on Kalshi and Polymarket.
Traders won’t take delivery of the underlying assets, and settlement is instead cash-based. For now, only investors with more than 10 million reals ($1.9 million) in assets or CVM certification can trade the new products.
B3’s vice president of Products and Clients, Luiz Masagão, said the launch is part of a broader push to modernize derivatives trading in Brazil.
The exchange already offers contracts tied to central bank decisions in several countries and has watched the growth of predictive platforms abroad closely, Masagão added.
The exchange late last year revealed it’s working on its own tokenization platform and stablecoin, both expected to be launched this year.
B3’s launch marks the first federally regulated prediction market in Brazil, though it enters an increasingly crowded field. Platforms like Prévias and Palpitada have been operating domestically in a regulatory gray area, while U.S.-based Kalshi recently partnered with XP International, Brazil’s largest brokerage, to offer event contracts tied to Brazilian economic outcomes.
The move also comes amid a global prediction market boom. Notional volume is now nearing $160 billion, according to a Dune dashboard, while unique users have crossed the 3 million mark.
Polymarket and Kalshi dominate the space globally, accounting for most of the notional volume. Intercontinental Exchange, the owner of the New York Stock Exchange, recently doubled down on Polymarket and bringing its total commitment to nearly $2 billion.
Still, the regulatory landscape remains unsettled on both sides of the equator. In Brazil, legal experts say it’s unclear whether oversight of prediction markets should ultimately fall to the CVM, the Central Bank, or the Ministry of Finance.
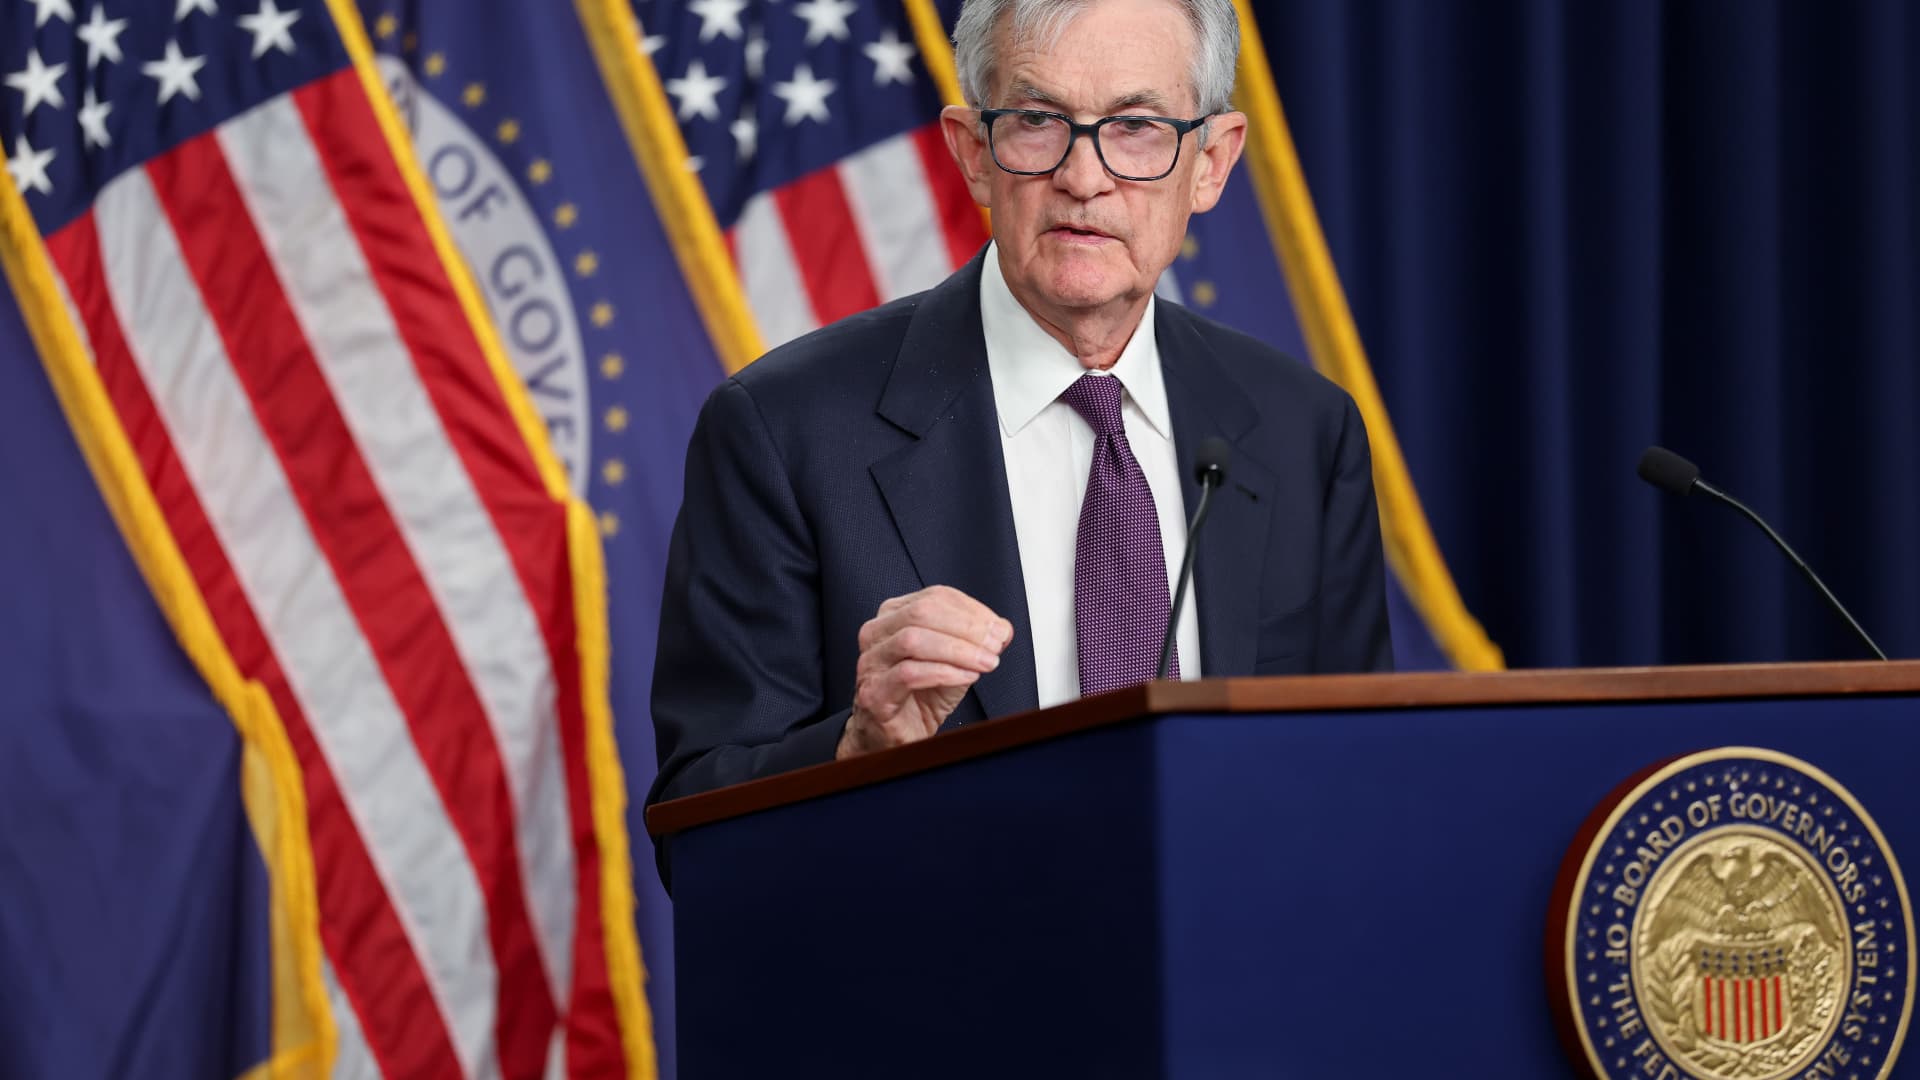
[The stream is slated to start at 10:30 a.m. ET. CNBC Television will start the stream when the event begins. Please refresh the page if you do not see a player above.]
Federal Reserve Chair Jerome Powell speaks Monday to the Harvard University Principles of Economics class.
This will be one of Powell’s final scheduled public appearances before his term ends in May. The discussion comes with markets anticipating the central bank will be on hold regarding interest rates through the end of the year.
In his most recent comments, Powell characterized the economy as growing at “a solid pace” and said he is not concerned with worries of stagflation, low growth with high inflation. However, he noted that policymakers are taking a cautious approach as multiple factors play out this year, including the Iran war, tariffs and a stagnant labor market.
Powell’s term ends officially on May 15, and there is only one more policy meeting between now and then. However, it’s possible he will stay in the position longer if the Senate does not confirm is designated successor, former Governor Kevin Warsh.
The nomination currently is being held up in the Senate Banking Committee as U.S. Attorney Jeanine Pirro continues an investigation into the renovations at the Fed’s headquarters. A judge already has quashed a subpoena Pirro’s office sent to Powell, though she is appealing that decision.
Read more:
Recession odds climb on Wall Street as economy shows cracks beneath the surface
Fed’s Goolsbee says he’s worried about inflation in ‘fraught but intense’ climate
Fed Governor Waller urges caution for now, says rate cuts possible later in the year
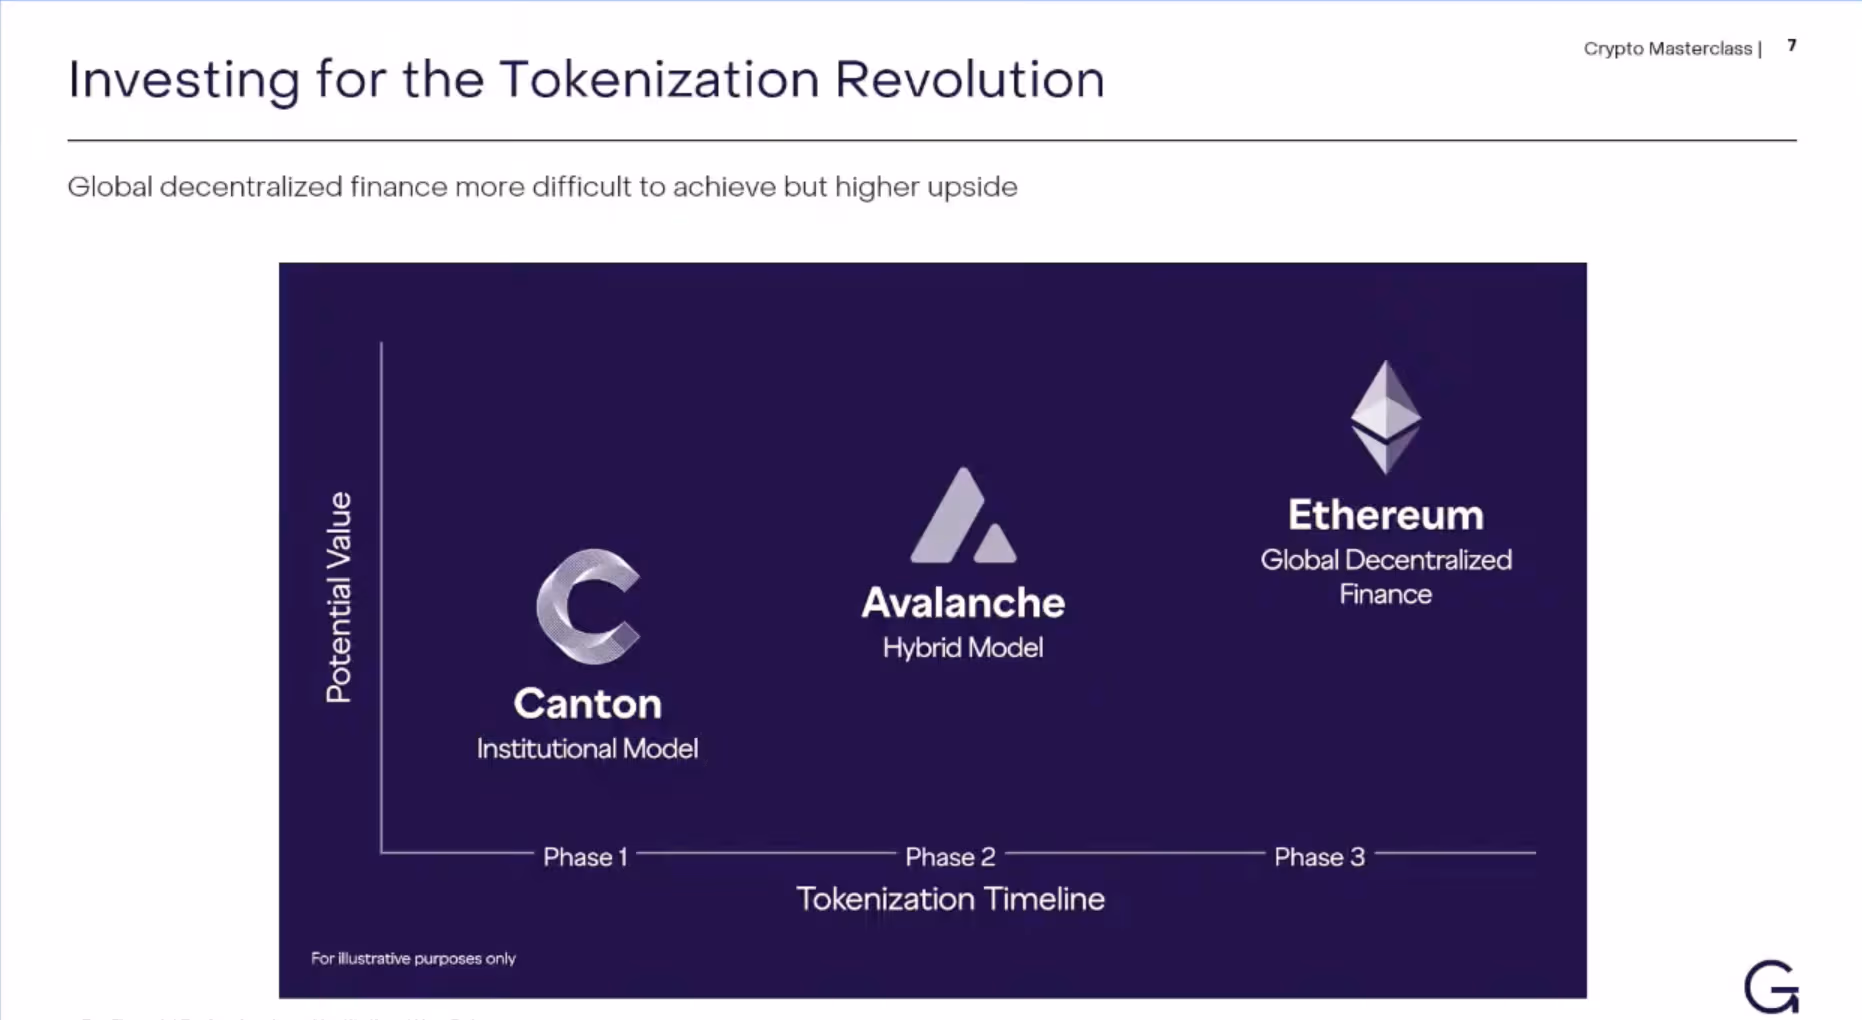
Tokenization has become one of crypto’s favorite buzzwords, but Grayscale head of research Zach Pandl said investors should think about it less as a single trade and more as a long roadmap with different winners at different stages.
Speaking at EthCC conference in Cannes, France, Pandl said that the trend is still in its infancy. Tokenized assets — the process of using blockchain rails to settle, transfer and record ownership of all kinds of financial assets such as bonds, funds and equities — is rapidly growing. However, currently at $27 billion, it still represents roughly 0.01%, a tiny fraction, of global capital markets. That’s projected to swell to near $19 trillion by 2033, according to BCG and Ripple.
Big banks and asset managers already understand the opportunity. “The two things that institutions are aware of are stablecoins and tokenization,” Pandl said. But they are still trying to figure out where to allocate capital to actually benefit from these innovations.
From here, Pandl expects tokenization to unfold in phases, with different types of networks and models capturing value at each stage.
The first winners, he said, may be projects that look more like traditional finance, not less.
“In the early stages of the tokenization process, you will see things that have success that look more similar to how the financial system works today,” he said.
That means institution-centric, permissioned systems that solve practical issues like privacy, identity and control.

Pandl pointed to the Canton Network (CC), backed by Wall Street giants like DRW, TradeWeb, Goldman Sachs and Nasdaq, as a potential winner in this early phase of tokenization.
He said it is “a perfectly reasonable investment” for investors who want nearer-term traction, even if Canton’s approach represents only “a slightly different, slightly upgraded version” of today’s financial system.
The second phase
The second phase of tokenization could be a hybrid model where we have both institution-owned blockchains and a global shared state, with those networks interconnected and speaking to each other. One example for that is Avalanche (AVAX), with hundreds of sovereign, corporate-owned chains (called subnets) live but connected to a primary, layer-1 network.
Ethereum’s ether (ETH), in his view, is the bigger but slower bet. Pandl said he believes the market will eventually move toward “global decentralized finance,” but added that “the tech is not fully ready” and that institutions are not ready either.
That makes ETH the more ambitious investment for those willing to wait for the longer-term shift away from financial intermediaries.
There are also picks-and-shovels plays. Pandl highlighted chain-agnostic service providers such as Chainlink as another way to get exposure, saying they may be “even more compelling” than some blockchains.
Read more: How tokenized assets could become a $400 billion market in 2026


Network News
GOOGLE SAYS BREAKING BITCOIN IS EASIER THAN PREVIOUSLY THOUGHT: Breaking the Bitcoin blockchain with quantum computers may not be as difficult as once thought, and Bitcoin’s Taproot technology, which enables more efficient, private transactions, may be partly to blame, Google’s Quantum AI team said in a blog post and newly published whitepaper. The team said the computing power required to break Bitcoin’s security may be far lower than previously assumed, raising fresh questions about how soon quantum threats could become a reality.In a new whitepaper, researchers found that cracking the cryptography used by Bitcoin and Ethereum could require fewer than 500,000 physical quantum bits, or qubits, well below the “millions” often cited in recent years. Google has previously pointed to 2029 as a potential milestone for useful quantum systems, saying migration needs to come before that, making the paper’s finding that attacks may require less computing power more significant. Quantum computers use qubits instead of traditional bits and can solve certain problems much faster than today’s machines. One of those problems is breaking the type of encryption that protects crypto wallets.Google said it designed two potential attack methods, each requiring roughly 1,200 to 1,450 high-quality qubits. That is a fraction of earlier estimates and suggests the gap between current technology and a viable attack may be smaller than investors think. The research also outlines how such an attack could work in practice. Rather than targeting old wallets, a quantum attacker could go after transactions in real time. When someone sends bitcoin, a piece of data called a public key is briefly revealed. A fast enough quantum computer could use that information to calculate the private key and redirect the funds. — Sam Reynolds Read more.
OPENAI RAISES RECORD $122 BILLION: Artificial intelligence giant OpenAI has closed $122 billion in committed capital at an $852 billion post-money valuation, a round that dwarfs anything raised in private markets and cements the company as the most valuable startup in history by a wide margin. The funding was anchored by Amazon, Nvidia, and SoftBank, with continued participation from Microsoft. SoftBank co-led alongside a16z, D.E. Shaw Ventures, MGX, TPG, and accounts advised by T. Rowe Price. The investor list reads like a who’s who of global capital — BlackRock, Blackstone, Fidelity, Sequoia, Temasek, Coatue, and ARK Invest all participated. For the first time, OpenAI opened participation to individual investors through bank channels, raising over $3 billion from that tranche alone. OpenAI said it is generating $2 billion in revenue per month, up from $1 billion per quarter at the end of 2024. ChatGPT has more than 900 million weekly active users and over 50 million subscribers. The company claims 6x the monthly web visits and mobile sessions of the next largest AI app, and 4x the total time spent of all other AI apps combined. — Shaurya Malwa Read more.
HOW BITCOIN, ETHEREUM, AND SOLANA ARE PREPARING FOR Q-DAY: As quantum computing edges closer to practical reality, the crypto industry is beginning to confront a question it has long deferred: what happens if the cryptography underpinning trillions of dollars in digital assets no longer holds? The answers, so far, are anything but uniform. Across many of the most well-known ecosystems like Bitcoin, Ethereum, and Solana, responses are diverging along familiar lines: what to do on social consensus and technical iteration, and community members are split between caution and acceleration. Quantum computing is a fundamentally different approach to computation that uses the principles of quantum mechanics rather than classical physics. Instead of traditional bits that are either 0 or 1, quantum computers use “qubits,” which can exist in multiple states at once, a property known as superposition, allowing them to process many possibilities simultaneously. Combined with another feature called entanglement, this enables quantum machines to solve certain complex problems far more efficiently than classical computers, particularly tasks like factoring large numbers that underpin modern encryption. How threatening is quantum computing? Consider this: Quantum computers can solve extremely complex problems within seconds, whereas ‘Supercomputers,’ the most powerful computing machines available today, would take thousands of years for the same problems, according to IBM. And that’s why the threats to cryptographic networks stemming from quantum computing are concerning. And even Google, developer of Willow, a quantum supercomputer, is setting a 2029 deadline to migrate its authentication services to post-quantum cryptography, citing progress in the technology. — Margaux Nijkerk Read more.
BASE TEAM RELEASES 2026 ROADMAP: Base, the layer-2 network from Coinbase (COIN), is doubling down on its push to build what it calls a “global onchain economy,” outlining a 2026 strategy centered on markets, payments and developers. Base is one of the most widely used layer-2 networks in the Ethereum ecosystem, having opened to public use in August 2023. It was initially built using Optimism’s OP Stack as part of the broader “Superchain” ecosystem, though the project has since signaled plans to differentiate its infrastructure as it scales. In February, the Coinbase team said the chain will increasingly rely on its own, in-house code. Layer-2 blockchains are built on top of Ethereum and aim to increase speed and lower costs by processing transactions themselves, while still relying on Ethereum for security. The model has become a key part of Ethereum’s scaling strategy, enabling cheaper and faster transactions without moving activity entirely off the network. More recently, however, some Ethereum leaders, including co-founder Vitalik Buterin, have signaled a shift in focus toward scaling the base layer itself, leaving open questions about how layer-2 networks will fit into Ethereum’s evolving roadmap. For 2026, Base said it will focus on three areas: expanding onchain markets, scaling stablecoin-based payments and growing its developer ecosystem — a push that comes as onchain trading venues and stablecoins see rising adoption among institutional players. — Margaux Nijkerk Read more.
In Other News
- Bitcoin’s reputation has historically been built on extreme boom-and-bust cycles, with steep drawdowns of up to 90% following all-time highs. This cycle, however, the decline has been closer to 50%, a shift that analysts said reflects the maturation of BTC as an asset class. “Bitcoin’s drawdowns compressing to about 50% is a sign of a maturing market structure,” AdLunam co-founder and market analyst Jason Fernandes told CoinDesk. “As liquidity deepens and institutional participation increases, volatility naturally compresses on both the upside and the downside,” he added, saying that “at that point, the narrative shifts from questioning its legitimacy to optimizing allocation.” Fernandes’ comments are in response to Fidelity Digital Assets analyst Zack Wainwright’s X post Tuesday, in which he noted growth is becoming “less impulsive,” with a reduced probability of extreme downside events as bitcoin matures. — Olivier Acuna Read more.
- In Jack Dorsey’s view of the world, the job most at risk from the AI revolution is the middle manager. Dorsey argues in a new essay, “From Hierarchy to Intelligence,” published with Roelof Botha, Sequoia Capital’s managing partner, an investor in Block, that his company’s decision to cut approximately 4,000 of its more than 10,000 employees was not a cost reduction but a permanent restructuring to replace middle managers with AI. Corporate hierarchy, the essay argues, has always existed to solve one problem: routing information through organizations too large for any single person to oversee. Managers aggregate context from below, act as messengers from above, and maintain alignment across teams. AI can now perform those functions continuously and at scale, the authors argue, making the messenger redundant. In place of management layers, Dorsey and Botha proposes two AI-driven “world models.” One aggregates internal data from code, decisions, workflows, and performance metrics to create a continuously updated picture of company operations, replacing the context that managers traditionally carried. The other maps customer and merchant behavior using transaction data from Cash App and Square. — Sam Reynolds Read more.
Regulatory and Policy
- Australia passed legislation creating its first comprehensive regulatory framework for digital assets that requires crypto exchanges and custody providers to obtain financial services licenses. The Corporations Amendment (Digital Assets Framework) Bill 2025 cleared both houses on April 1, bringing firms that hold digital assets on behalf of customers into the existing Australian Financial Services Licence regime. Australia’s bill creates two new regulated categories under the Corporations Act: digital asset platforms, which hold crypto on behalf of users, and tokenized custody platforms, which hold real-world assets and issue a corresponding digital tokens. Operators of both must obtain an Australian Financial Services License from ASIC, bringing them under the same core rules as brokers or fund managers, including requirements to safeguard client assets, provide standardized disclosures, avoid misleading conduct, and maintain dispute resolution and compensation systems. Instead of regulating crypto itself, the law targets the companies in the middle that control customer funds, aiming to reduce risks like commingling, insolvency, and misuse of assets that have caused losses in past crypto failures. — Sam Reynolds Read more.
- Hong Kong has missed its own March timeline for HKD stablecoin licensing, with the Hong Kong Monetary Authority (HKMA) yet to approve any issuers despite public signals that the rollout would begin last month. At Consensus Hong Kong in February, Financial Secretary Paul Chan Mo-po said licenses would begin to be issued in March as part of the city’s push to position itself as a regulated hub for stablecoins and tokenized finance. The lack of approvals so far pushes that timeline into April and raises questions about how quickly the framework will move from policy to implementation. “In giving our licenses, we ensure that licensees have novel use cases, a credible and sustainable business model and strong regulatory compliance capabilities,” he said at CoinDesk’s Hong Kong conference.— Sam Reynolds Read more.
Calendar
- Mar. 30-Apr. 2, 2026: EthCC, Cannes
- Apr.15-16, 2026: Paris Blockchain Week, Paris
- May 5-7, 2026: Consensus, Miami
- Sept. 29-Oct.1, 2026: Korea Blockchain Week, Seoul
- Oct. 7-8, 2026: Token2049, Singapore
- Nov. 3-6, 2026: Devcon, Mumbai
- Nov. 15-17, 2026: Solana Breakpoint, London


JPMorgan (JPM) CEO Jamie Dimon said the bank is considering entering the prediction markets space, signaling growing interest from major financial institutions in a sector that has expanded rapidly in recent months, including among crypto-native companies.
“It’s possible one day we’ll do something like that,” Dimon said on CBS on Tuesday, though ruled out offering markets in sport or politics.
“There’s a bunch of stuff we won’t do. And obviously, we have strict rules around insider information.”
Goldman Sachs (GS) has expressed similar ambitions. CEO David Solomon said during the bank’s January earnings call that the firm is actively exploring the space. “I personally met with the two big prediction companies and their leadership in the last two weeks and spent a couple of hours with each to learn more about that,” he said/ “We have a team of people here that are spending time with them and are looking at it.”
The comments highlight how quickly the sector has evolved. Not long ago, prediction markets were a niche corner of finance dominated by just two credible players: Polymarket and Kalshi. Today, competition is intensifying at a rapid pace.
Several crypto-native platforms, including Coinbase (COIN) and Robinhood (HOOD), have integrated prediction market trading into their offerings, expanding access to retail users and increasing overall market activity.
At the same time, the early leaders continue to grow. Polymarket has secured major partnerships and investments, including ties with Intercontinental Exchange, the parent company of the New York Stock Exchange. The company is believed to be valued at around $20 billion. Rival platform Kalshi recently reached a $22 billion valuation following a funding round led by Coatue Management.
The two platforms take different technological approaches. Polymarket operates on blockchain infrastructure, using networks like Polygon (POL) to record trades and settle positions through smart contracts. Users deposit stablecoins, place bets on event outcomes and receive automated payouts based on verified results.
Kalshi does not use blockchain technology, instead operating more like a traditional exchange, offering event contracts under a regulated framework with centralized order matching and settlement.
It remains unclear how JPMorgan or Goldman Sachs would structure their own offerings, particularly whether they would adopt blockchain-based systems or stick to traditional infrastructure.
Regulation remains a key uncertainty. The legal status of prediction markets in the U.S. is still evolving, especially around what types of events can be offered and how contracts are classified. Major banks are likely to wait for clearer guidance before launching products.
Earlier this month, the Commodity Futures Trading Commission (CFTC) took two significant steps toward building a regulatory framework for prediction markets, signaling that oversight of the sector is beginning to take shape.


Cango (CANG) is at risk of losing its NYSE listing after its shares traded below $1 on average for 30 consecutive days, triggering a compliance notice from the exchange and giving the bitcoin miner a six-month window to recover, the company said in a press release Wednesday.
The New York Stock Exchange flagged the company on March 10, warning that failure to lift its share price back above the $1 threshold by the end of the cure period could lead to suspension and delisting proceedings. Cango said it plans to monitor market conditions and explore options to regain compliance, while its shares continue trading in the interim.
Against that backdrop, the company is shoring up its balance sheet with fresh capital.
In a separate announcement, Cango said it has entered into a $10 million convertible note agreement with Hong Kong-listed DL Holdings, alongside issuing warrants to purchase shares at $2.70 apiece. The financing is paired with a non-binding cooperation framework that could see the two firms pursue additional joint investments tied to crypto mining and AI infrastructure.
Proceeds from the note are earmarked for upstream acquisitions and expanding Cango’s push into computing infrastructure, part of a broader pivot beyond bitcoin mining.
Cango’s recent fundraising comes as the company pivots beyond its roots in bitcoin mining toward a broader strategy centered on energy and AI compute infrastructure. The firm has been positioning its global mining footprint as a foundation for high-performance computing, aiming to repurpose or expand its power capacity to support data-intensive AI workloads, a shift that mirrors a wider industry trend of miners seeking more stable, higher-margin revenue streams.
The convertible issuance follows the closing of a $65 million strategic investment round led by entities controlled by chairman Xin Jin and director Chang-Wei Chiu. The deal, settled in USDT and completed March 31, saw the company issue more than 49 million Class A shares.
Together, the transactions underscore management’s effort to stabilize the company financially while betting on longer-term growth in energy and AI-linked compute, even as it faces near-term pressure to keep its NYSE listing intact.
Cango’s shares have slumped sharply this year, highlighting the urgency behind its latest capital raise. The stock is down more than 70% year to date, recently trading around $0.39 after starting January above $1.40, with sustained selling pressure pushing it below the NYSE’s $1 minimum listing threshold.
Read more: Cango is selling off its bitcoin stash to pay down debt and fund an AI makeover

Financial Score Revealed: Fat, Tattoos, and Piercings? #shorts

Seven ways to take back control of your digital life
North East firms win contracts for world-first carbon capture power station

Smart energy pays enters the US market, targeting scalable financial infrastructure

Why Israel is blocking foreign journalists from entering

Bitcoin: We’re Entering The Most Dangerous Phase
Financial Score Revealed: Fat, Tattoos, and Piercings? #shorts

Goldman Sachs CALLED THE CRYPTO BOTTOM! Cardano Just Entered BIG LEAGUES.

#money #millionairemindsetunlimited #motivation #motivation #millionairevibes #millionaire
-

 News Videos7 days ago
Parliament publishes latest register of MPs’ financial interests
-

 Business6 days ago
Instagram, YouTube Found Responsible for Teen’s Mental Health Struggle in Historic Ruling
-
 Tech6 days ago
Intercom’s new post-trained Fin Apex 1.0 beats GPT-5.4 and Claude Sonnet 4.6 at customer service resolutions
-

 NewsBeat5 days ago
The Story hosts event on Durham’s historic registers
-

 Sports5 days ago
Sweet Sixteen Game Thread: Tide vs Michigan
-
Entertainment2 days ago
Fans slam 'heartbreaking' Barbie Dream Fest convention debacle with 'cardboard cutout' experience
-
 Entertainment4 days ago
Lana Del Rey Celebrates Her Husband’s 51st Birthday In New Post
-
Crypto World1 day ago
Dems press CFTC, ethics board on prediction-market insider trades
-

 Sports1 day ago
Tallest college basketball player ever, standing at 7-foot-9, entering transfer portal
-

 Tech3 days ago
The Pixel 10a doesn’t have a camera bump, and it’s great
-

 Entertainment7 days ago
HBO’s Harry Potter Series Will Definitely Fail For One Big Reason, And It’s Not J.K. Rowling Or Snape
-

 Crypto World2 days ago
U.S. rule change may open trillions in 401(k) funds to crypto
-

 Fashion6 days ago
En Vogue in Brown Leather and Tailored Neutrals by Atelier Savoir, Styled by J Bolin
-

 Politics2 days ago
Should Trump Be Scared Strait?
-

 Tech1 day ago
EE TV is using AI to help you find something to watch
-

 Tech1 day ago
How to back up your iPhone & iPad to your Mac before something goes wrong
-

 Fashion6 days ago
What Are Your Favorite T-Shirts for the Weekend?
-

 Fashion5 days ago
Weekly News Update, 3.27.26 – Corporette.com
-

 Fashion4 days ago
Amazon Sundays: Soft Spring Layers
-

 Tech3 days ago
Elon Musk’s last co-founder reportedly leaves xAI
You must be logged in to post a comment Login