
Crypto World
Bitcoin Price Prediction For March 2026: Bounce And Fall?
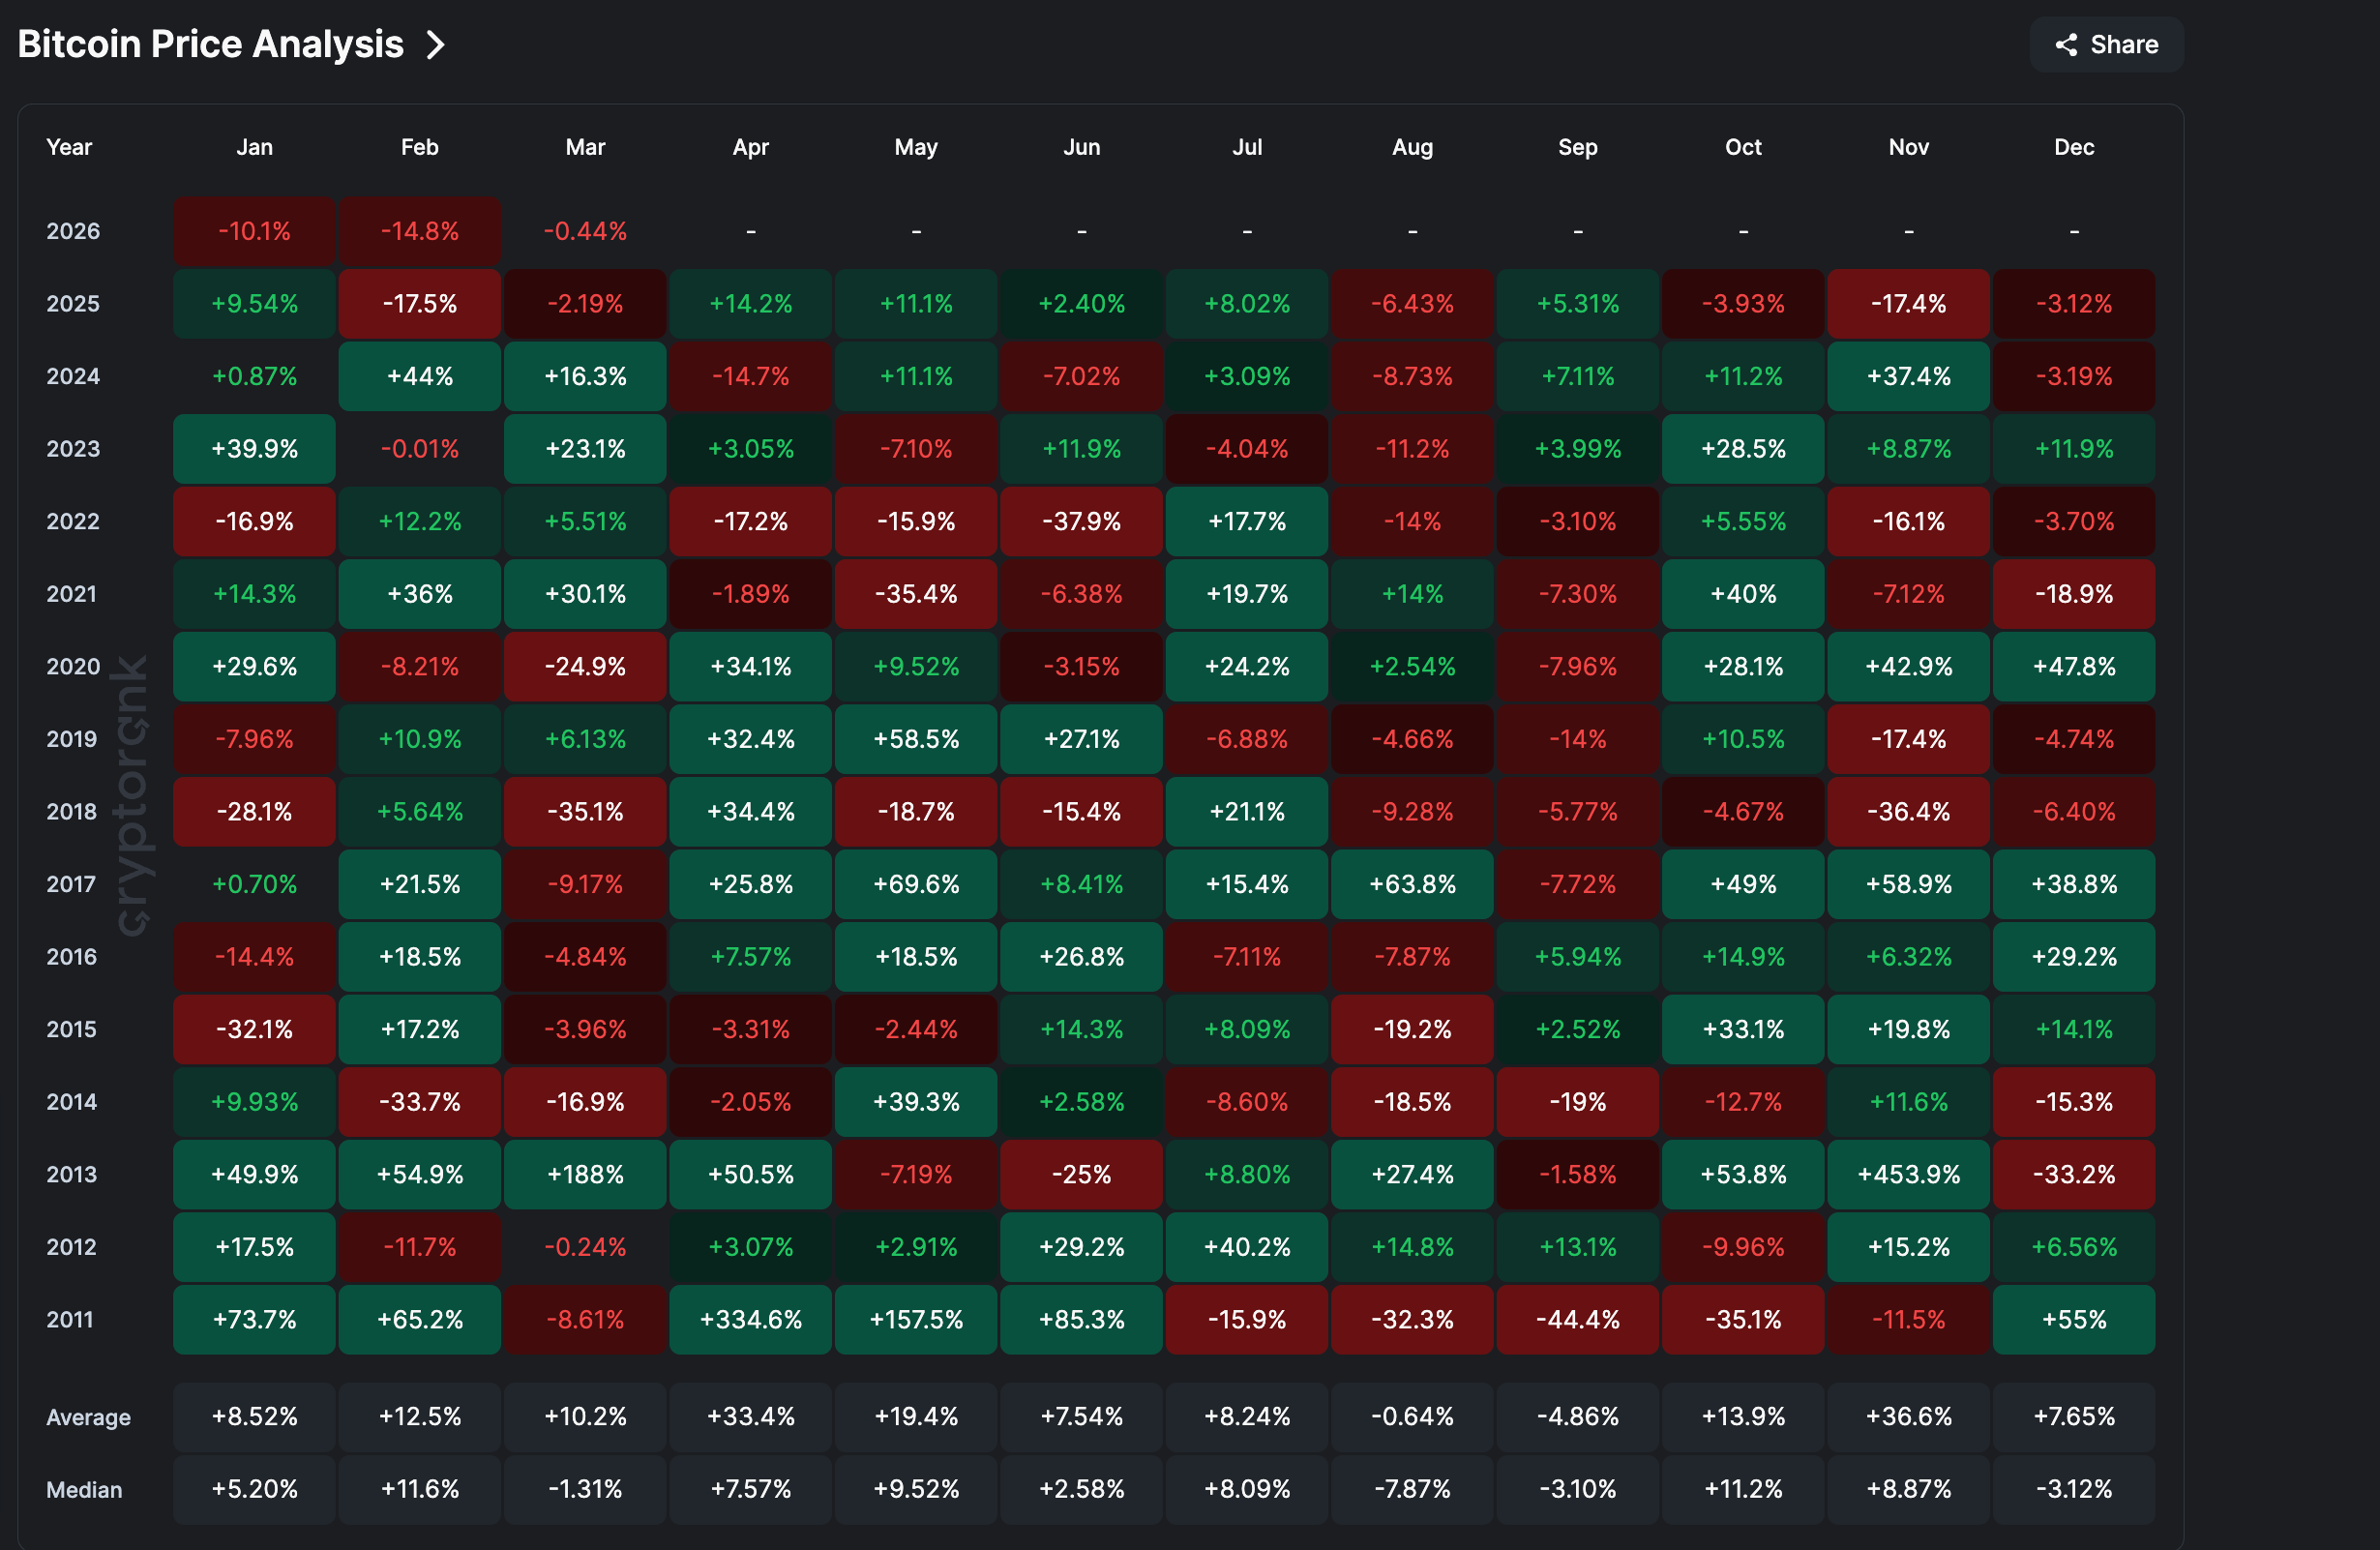
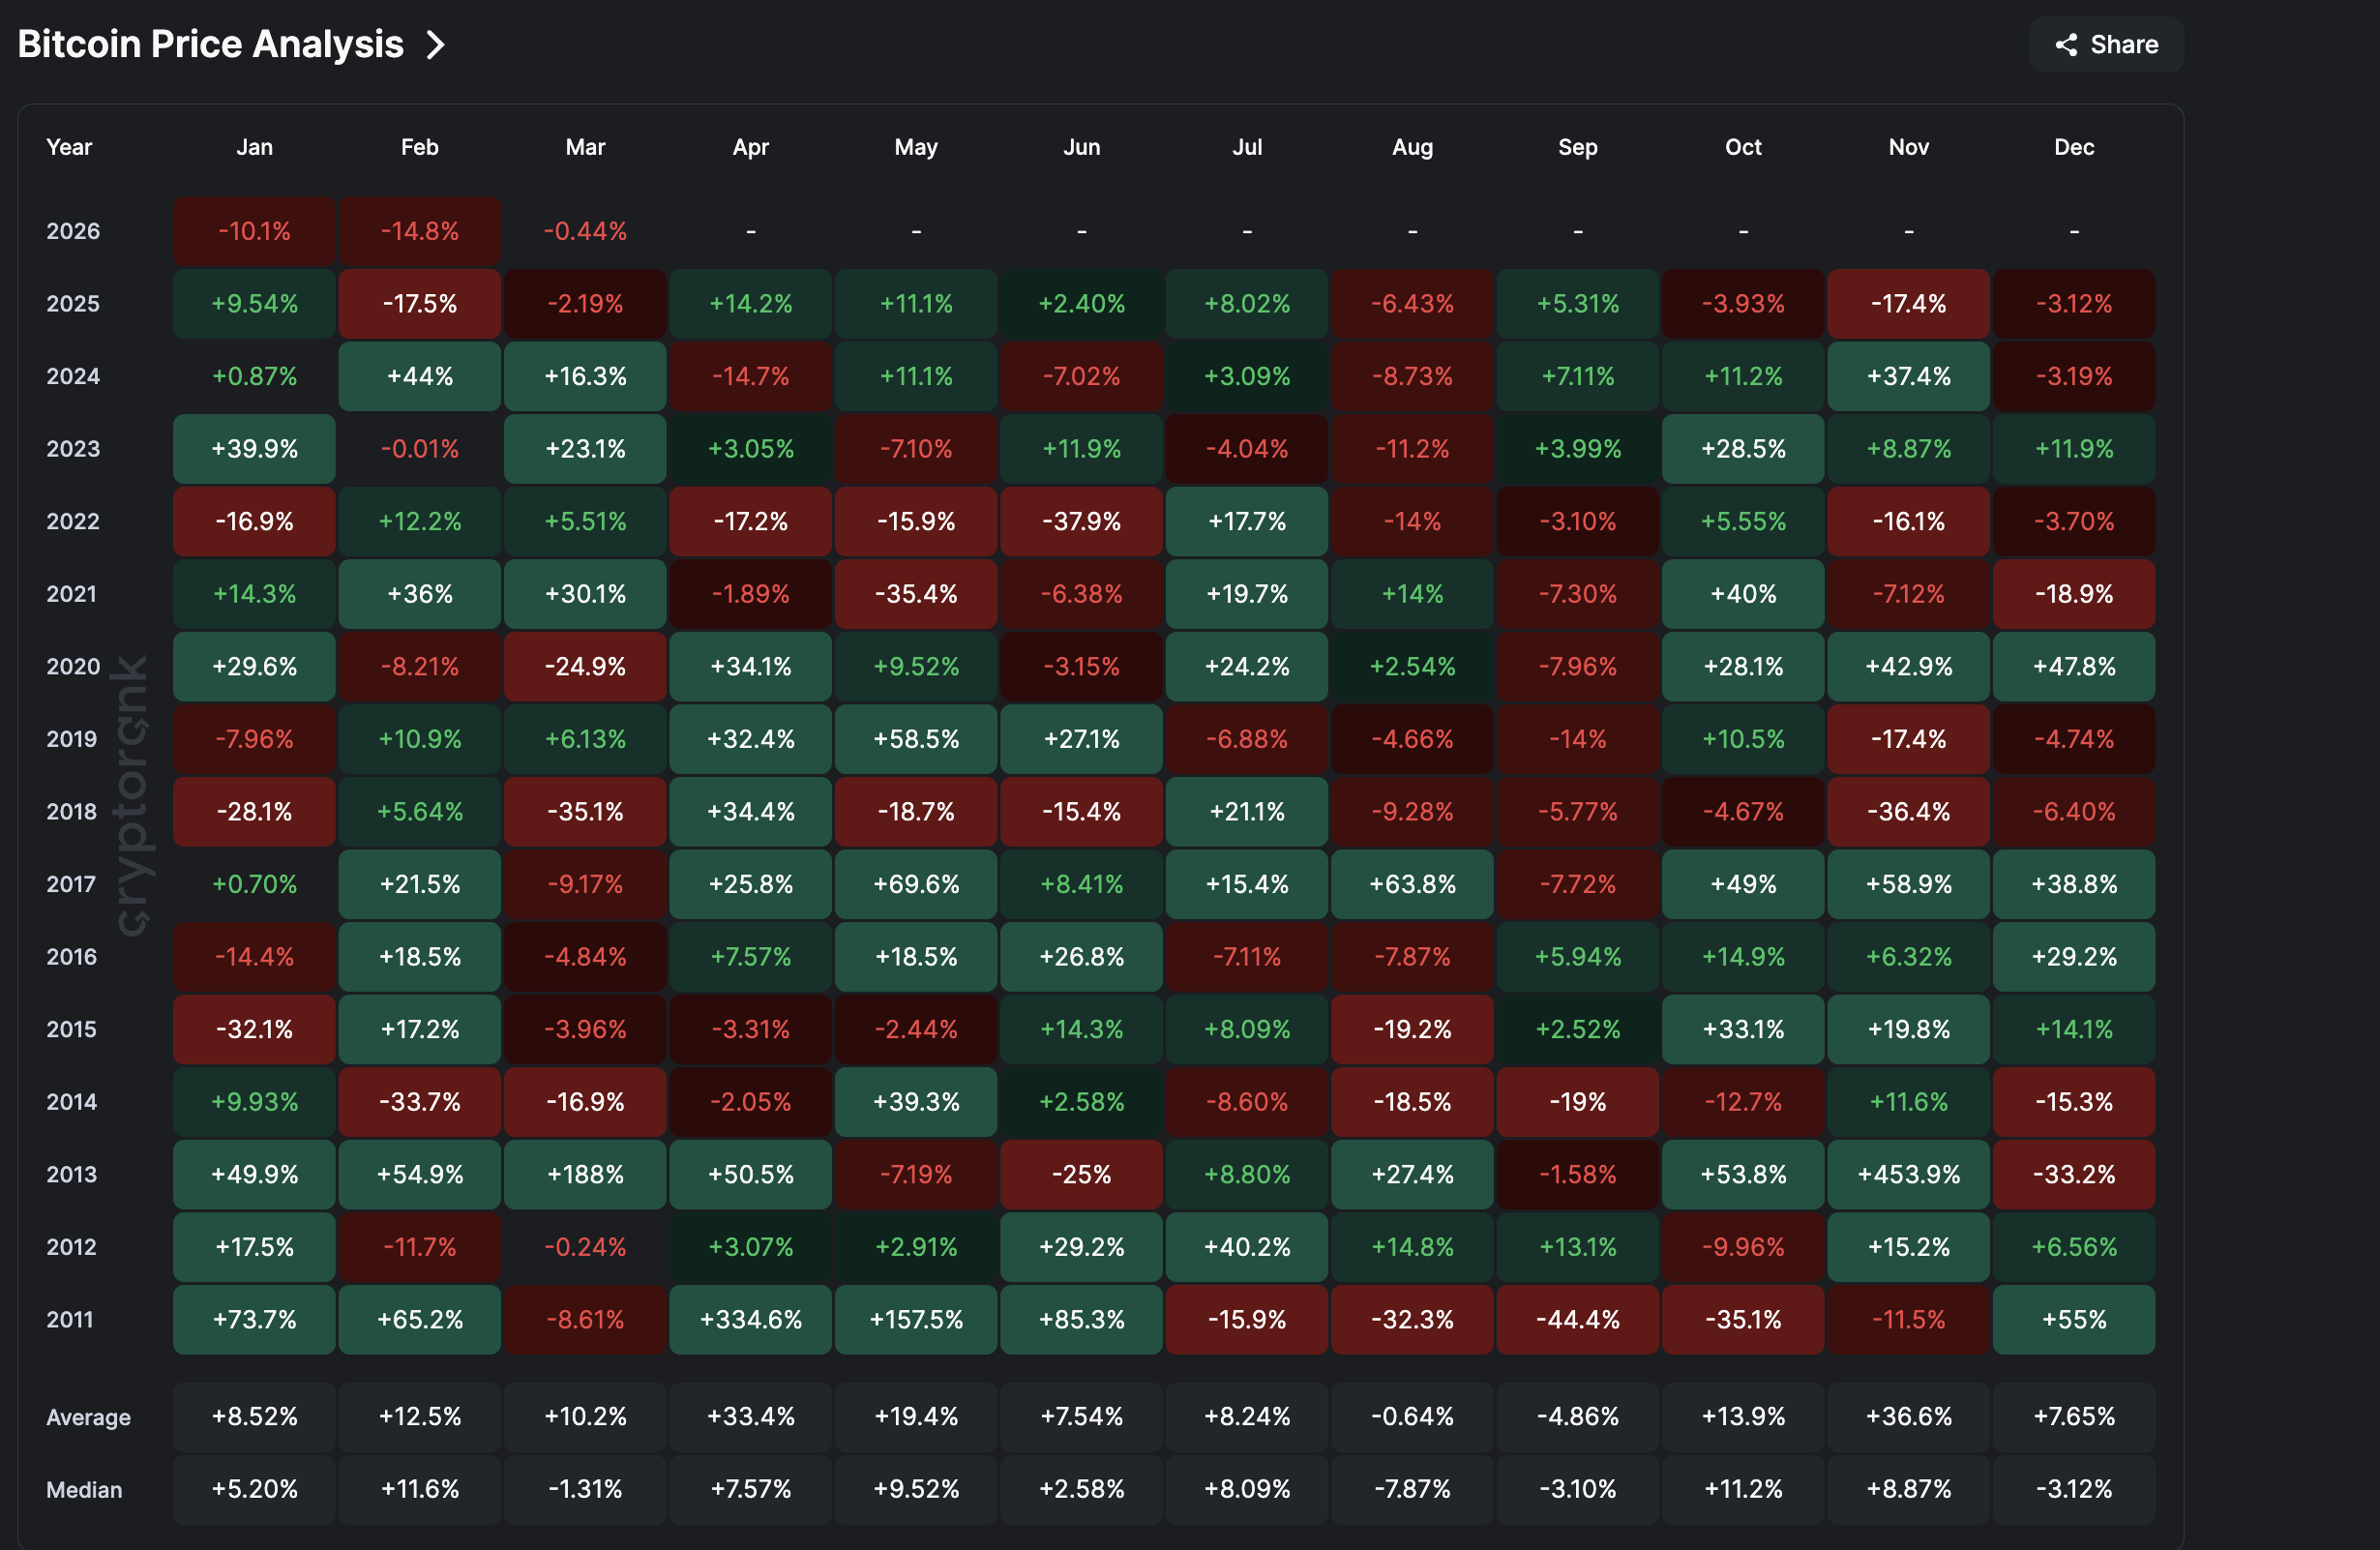
The Bitcoin price enters March bruised. February delivered close to 15% losses, echoing last year’s February, which saw the Bitcoin price drop by over 17%.
With five consecutive red months now on the books, starting from October 2025, and a median March return of −1.31%, the seasonal backdrop offers little comfort. But beneath the surface, a shift may be forming. Here is what the data shows heading into March.
Bitcoin Price Still Trades as a Risk Asset
One of the most pressing concerns for the Bitcoin price right now is its sustained correlation with US equities. This reflects in the historical sightings as a weak S&P 500 month-on-month ensured a dismal February for Bitcoin.
Want more token insights like this? Sign up for Editor Harsh Notariya’s Daily Crypto Newsletter here.
As of March 1, the 30-day rolling correlation between Bitcoin and the S&P 500 stands at 0.55, up from around 0.50 in October 2025.
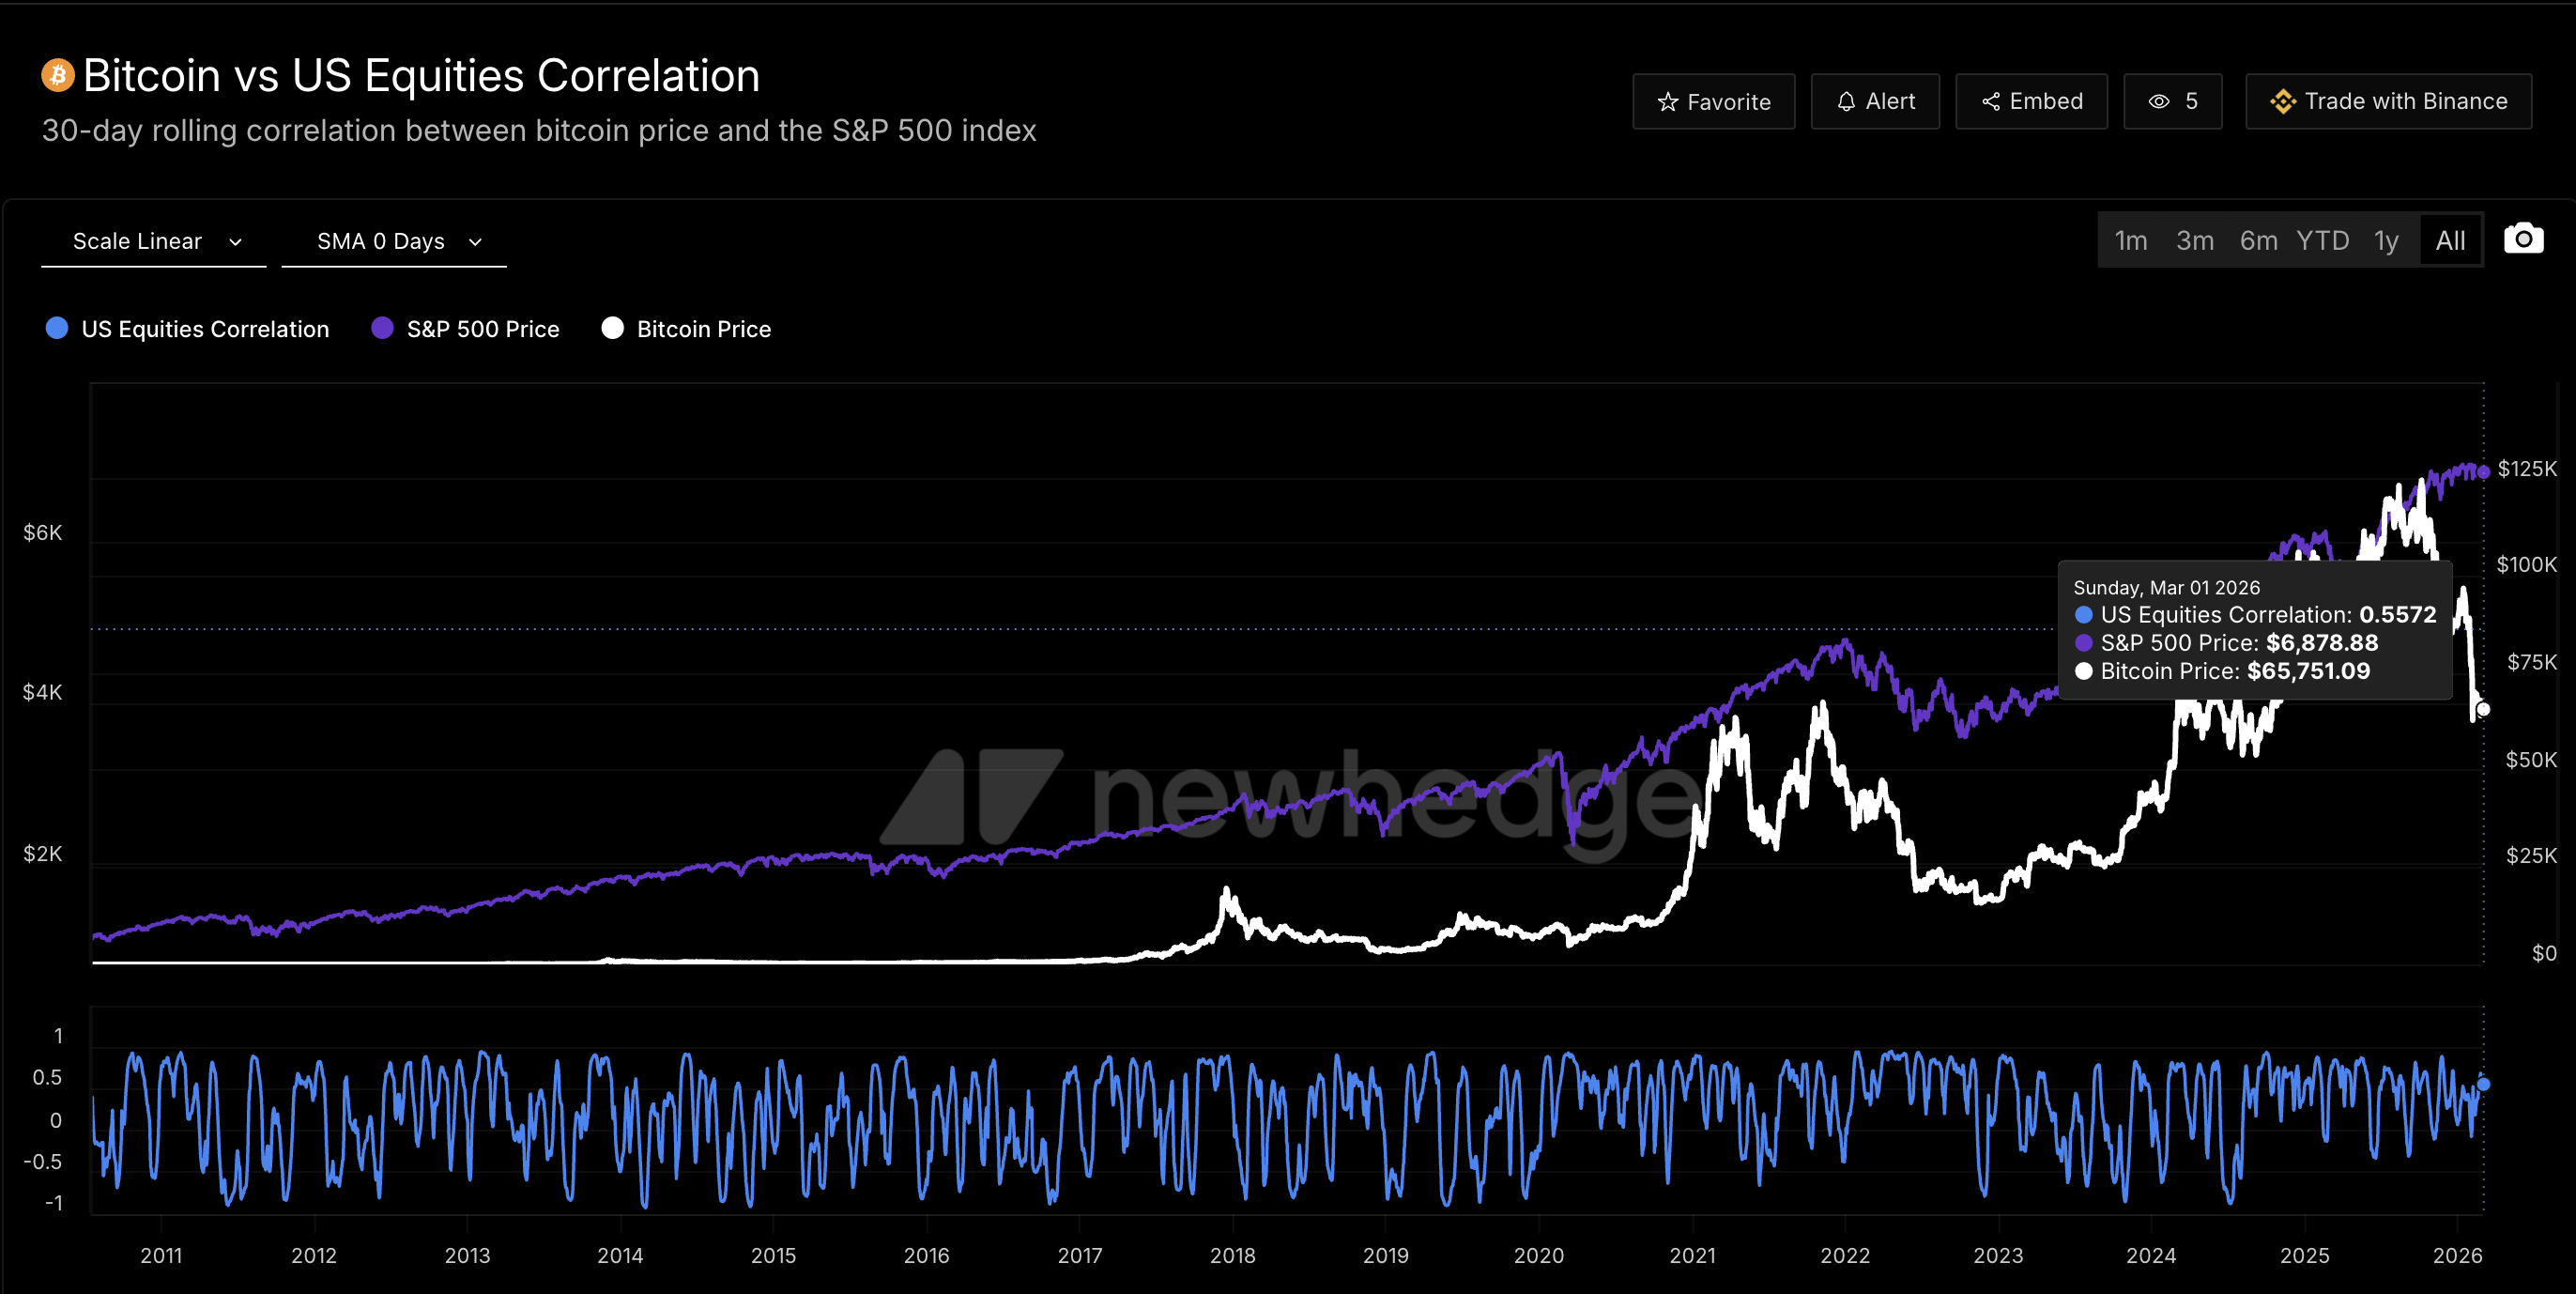
This means the Bitcoin price continues to move largely in step with stocks, undermining its appeal as a hedge against traditional market risk. With Trump’s new global tariffs adding pressure to equities and potential US-Iran military escalation weighing on risk appetite, Bitcoin’s risk-on behavior keeps it vulnerable.
Kevin Crowther, Founder of KC Private Wealth, emphasized this dynamic.
“Bitcoin’s high correlation to software stocks weakens its case as a hedge asset in times of uncertainty, and so as Trump continues to elevate economic uncertainty, continued BTC weakness should be expected,” Crowther said.
Meanwhile, gold and silver continue to surge while Bitcoin bleeds. However, if geopolitical tensions ease, particularly around Iran, risk sentiment could shift. And if the gold and silver trade becomes saturated, capital could begin rotating into Bitcoin as the next uncrowded allocation. That rotation hinges on the equity correlation breaking.
Bitcoin ETF Outflows Are Fading: A Quiet Shift
While the macro picture remains challenging, spot Bitcoin ETF data tells a more nuanced story. February marked the fourth consecutive month of net outflows, but the trend is shifting sharply.
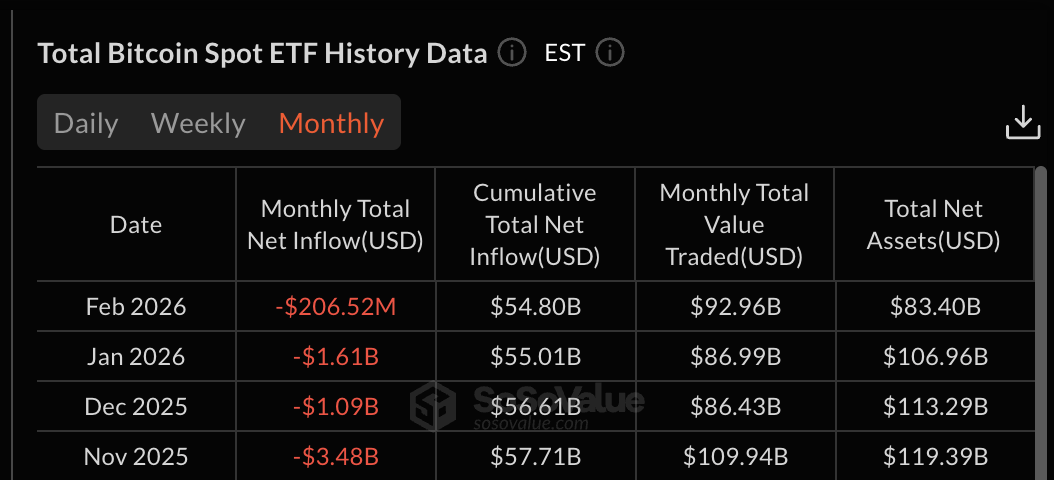
November 2025 saw $3.48 billion in outflows. December brought $1.09 billion, January $1.61 billion, and February closed at just $206.52 million — a 94% reduction from November’s peak.
Orkun Mahir Kılıç, Co-Founder of Citrea, noted that these outflows reflect positioning adjustments rather than a structural retreat.
“The ETF outflows are more consistent with deleveraging than institutional abandonment. For flows to reverse meaningfully, markets need clearer macro direction and lower volatility,” Kılıç explained in an exclusive quote to BeInCrypto.
Nima Beni, Founder of Bitlease, was more direct about what the data signals, especially taking BlackRock’s IBIT outflow into account:
“ETF outflows are retail panic, creating institutional opportunity. BlackRock’s $2.13B IBIT outflow matters less than the fact that 94% of ETF Bitcoin holdings remained despite maximum fear. That’s institutional conviction, not abandonment,” Beni stated.
Overall, the experts didn’t seem perturbed by the ETF outflow streak.
Selling Pressure Is Exhausting Across the Board – The Bounce Catalyst?
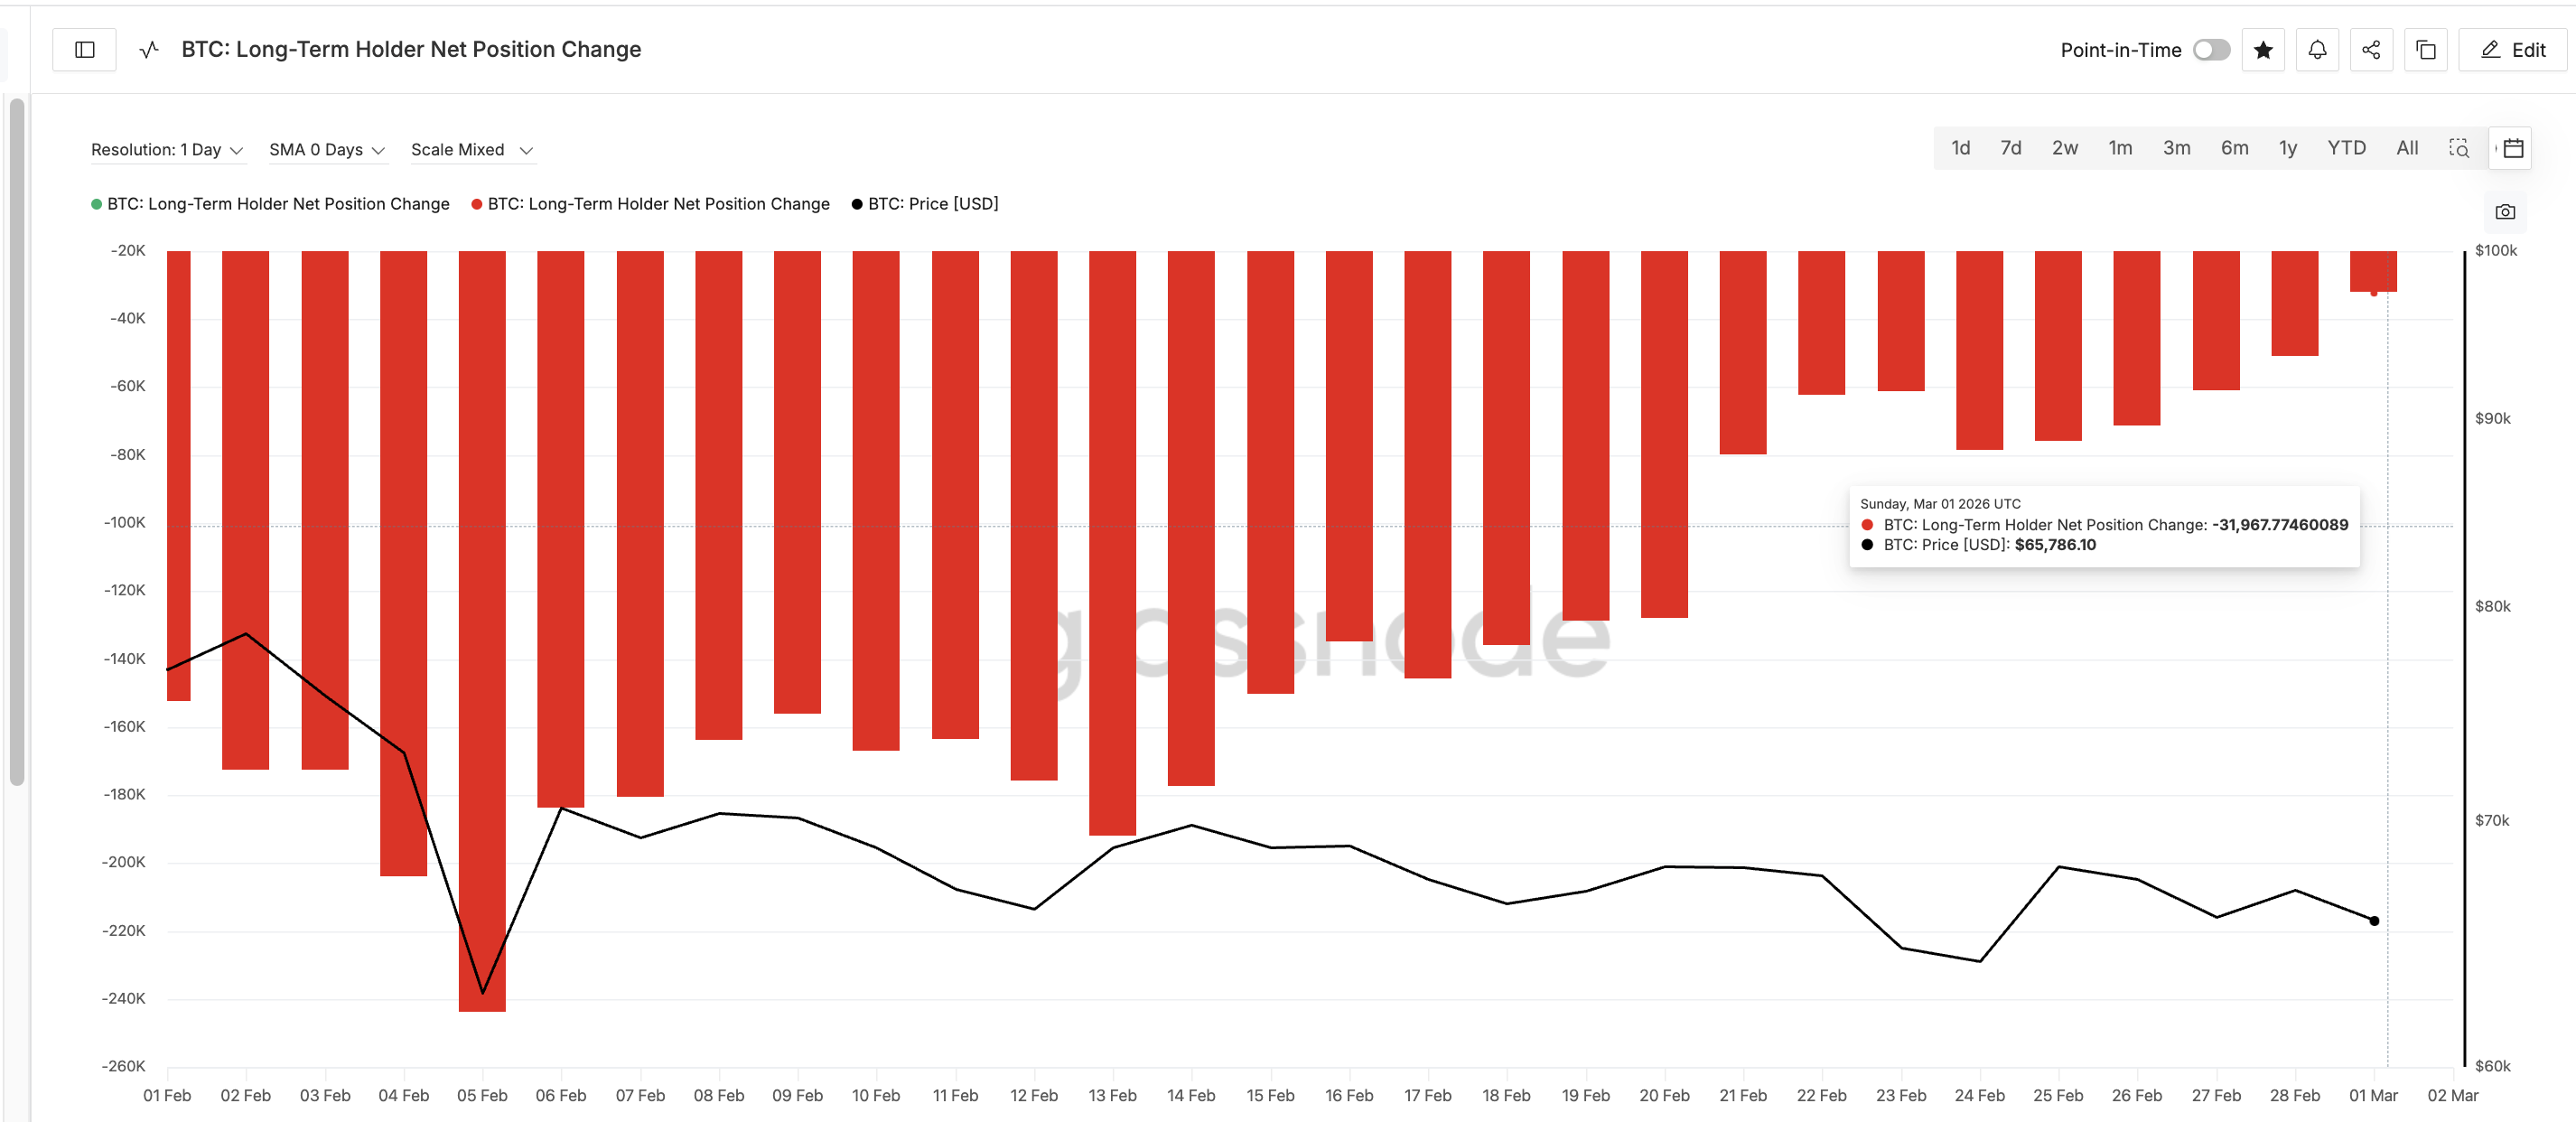
Beyond ETFs, on-chain data shows that selling from both long-term holders and Bitcoin miners is drying up rapidly.
Long-term holders — wallets that have held Bitcoin for 365 days or more — are a critical group for gauging market direction. When their selling ends, the Bitcoin price tends to stabilize and recover. Throughout February, their net selling has collapsed. On February 5, the 30-day rolling net position change for long-term holders stood at −243,737 BTC. By March 1, that figure had fallen to just −31,967 BTC, an 87% reduction.
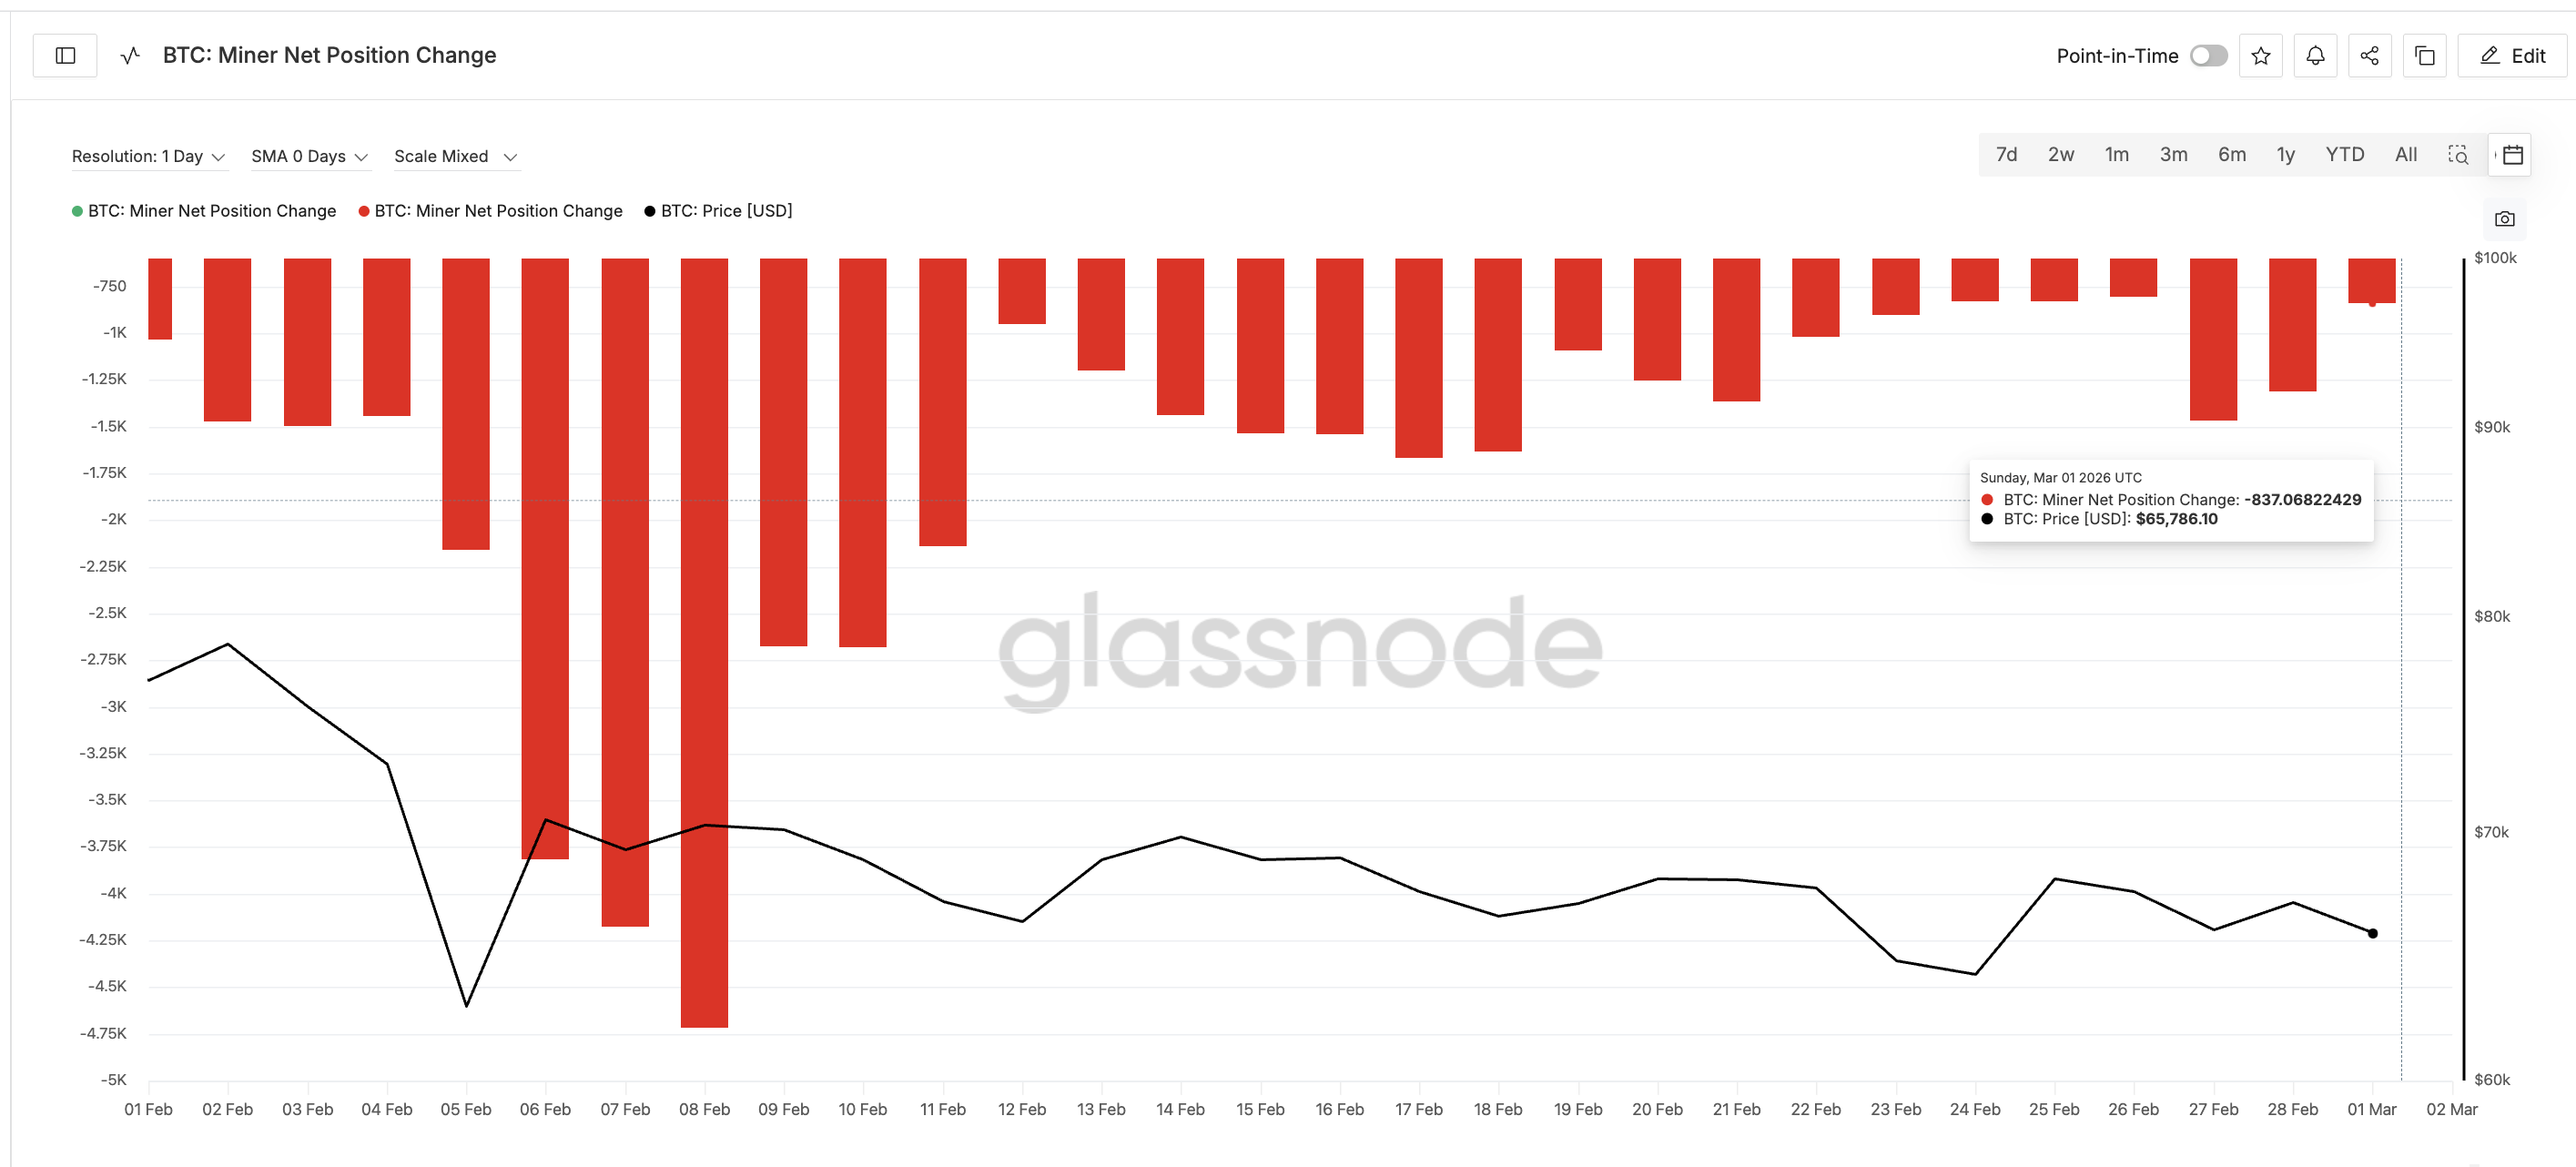
Miner behavior mirrors this trend. Bitcoin miners, who sell BTC to cover operational costs, saw peak capitulation around February 8 when net selling hit −4,718 BTC. By March 1, that had eased to −837 BTC, a sharp decline that suggests the worst of miner capitulation may be behind us.
Han Tan, Chief Market Analyst at Bybit, offered a key distinction here, taking the negative hash rate growth into account.
“Bitcoin miners aren’t capitulating; they’re making strategic diversifications. The drawdown in the hashrate is only to be expected in light of Bitcoin’s price plummet, but does not imply structural capitulation,” Tan noted.
Negative hash rate growth means the total computing power securing Bitcoin is falling instead of rising. This usually happens when miners turn off machines because mining becomes less profitable, often due to lower Bitcoin prices or higher energy costs. This explanation validates what Tan just highlighted.
Whales Are Accumulating Near the 20-Day SMA
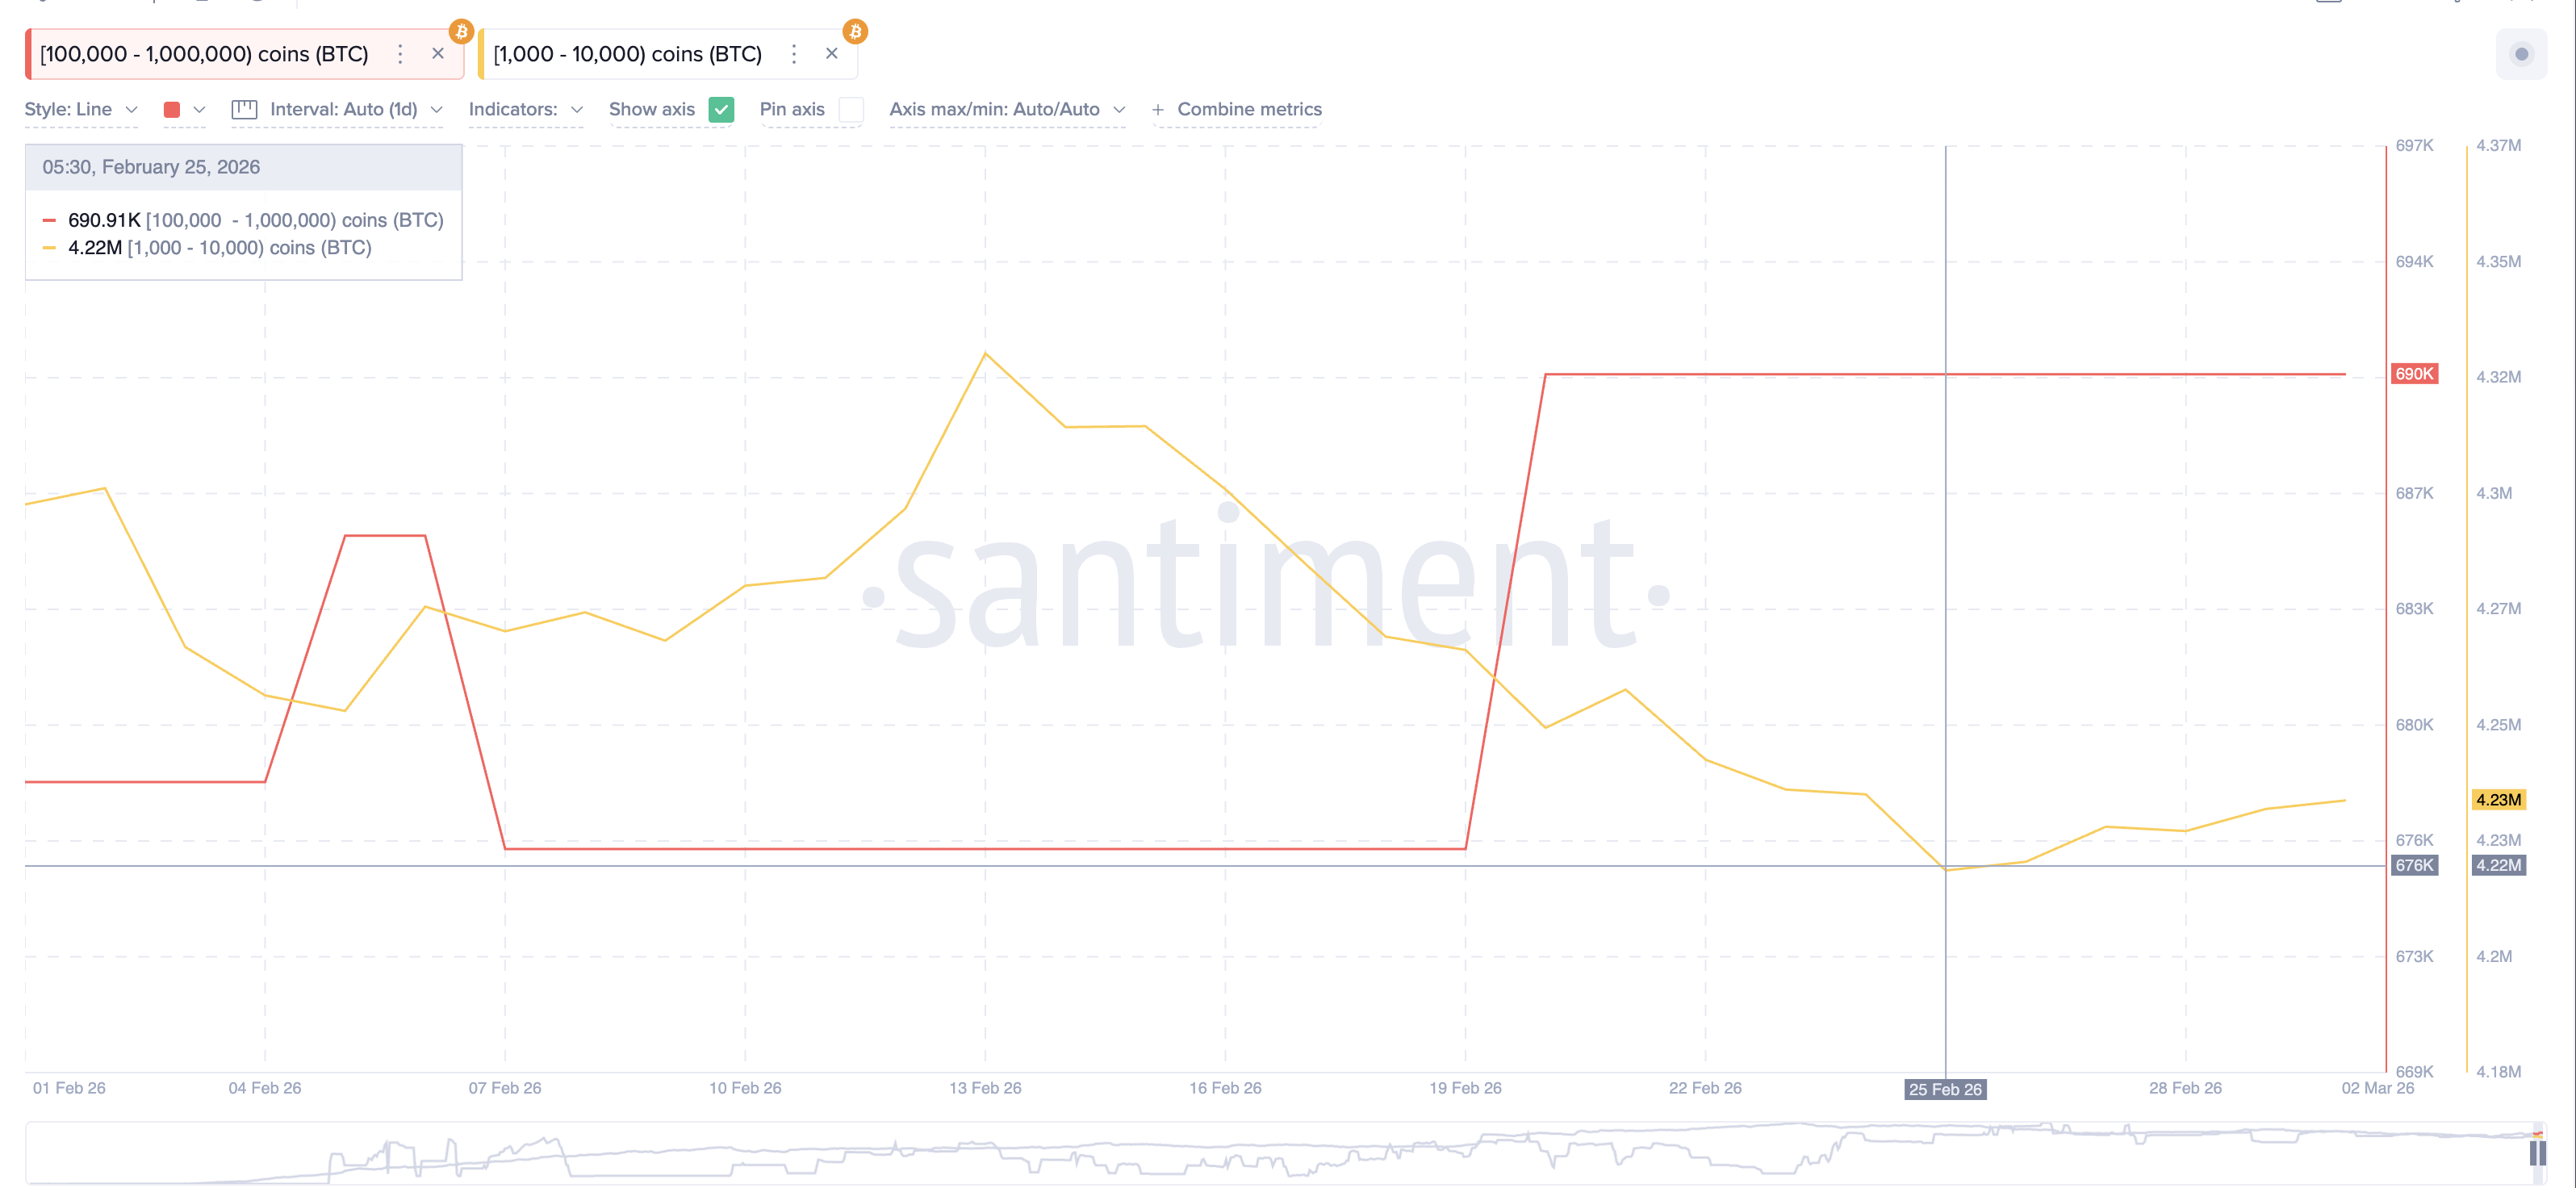
While selling weakens, buying is quietly picking up among whale cohorts. Wallets holding between 100,000 and 1,000,000 BTC increased their holdings from 676,540 to 690,000 BTC around February 19–20, during a brief 4.06% price rebound. Crucially, they have not sold since.
Meanwhile, smaller whales holding between 1,000 and 10,000 BTC began accumulating from February 25, with holdings rising from 4.222 million to 4.23 million BTC.
Why are whales holding?
One likely reason is the 20-day Simple Moving Average (SMA), a short-term trend indicator that smooths prices over 20 days. The Bitcoin price currently trades just below the 20-day SMA at $67,100. The last time this level was decisively crossed — on January 1 — Bitcoin rallied by over 12%. Whales appear to be positioning for a similar breakout.
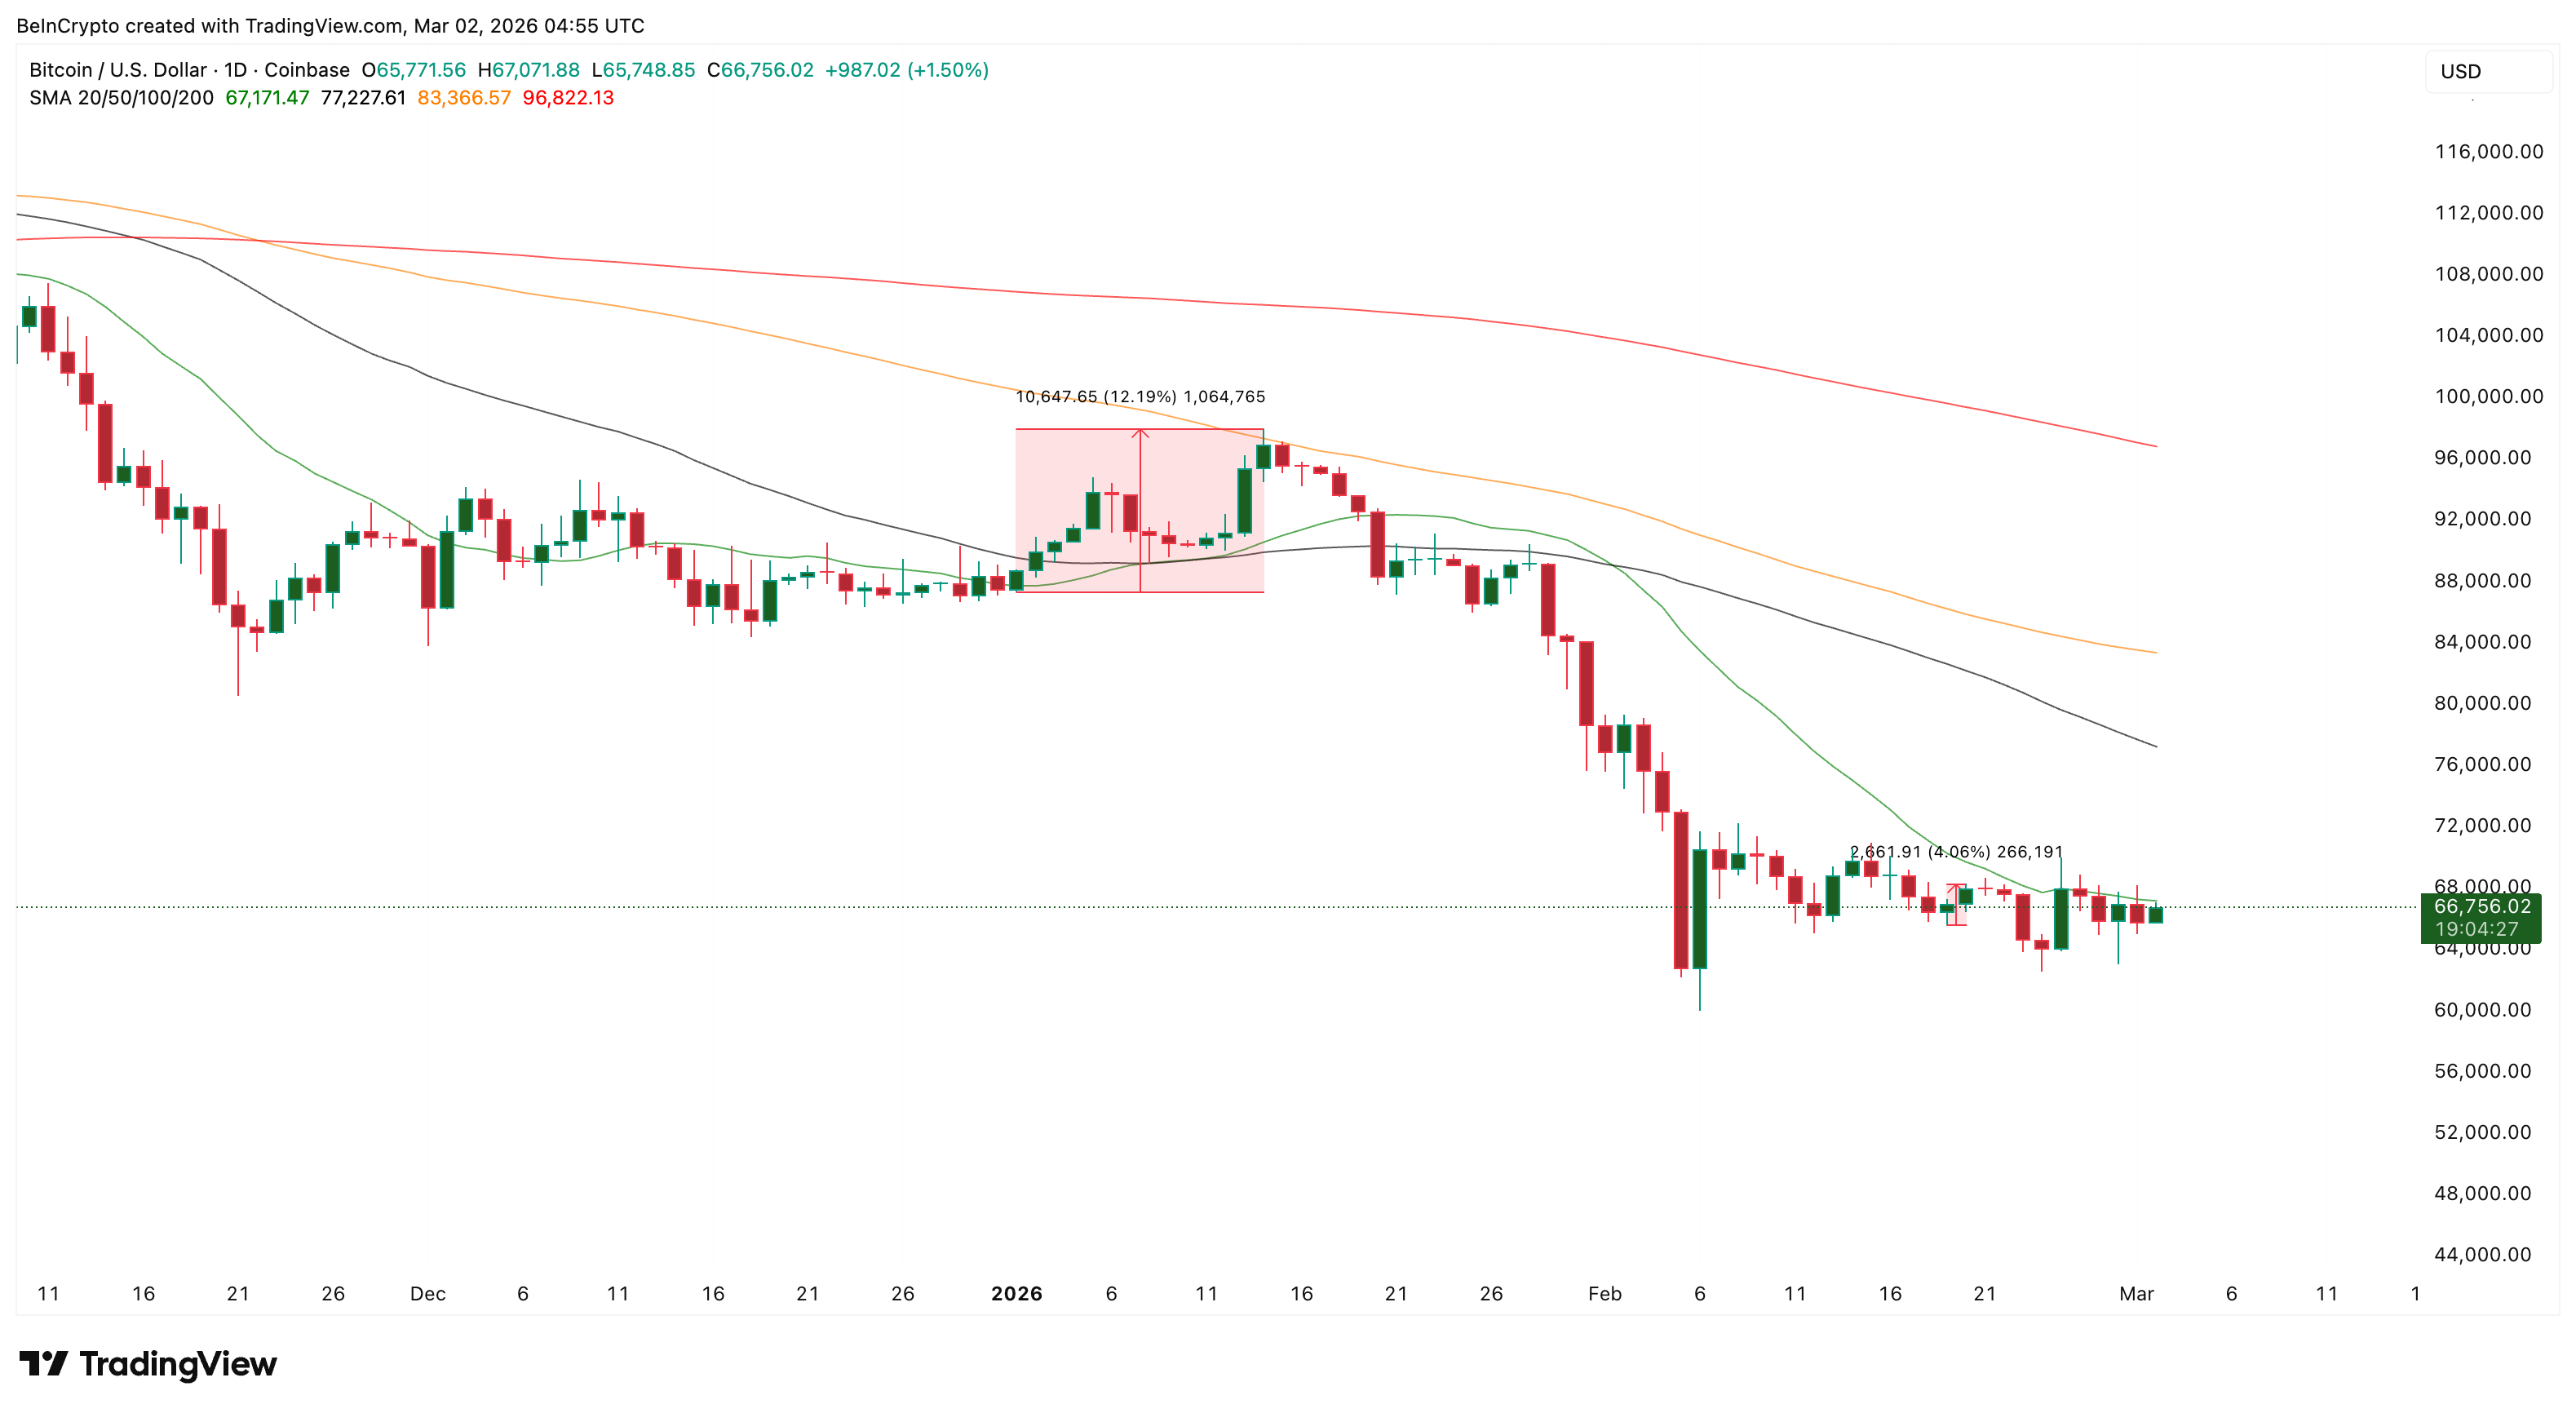
However, the long-term picture requires more conviction. The 50-day SMA sits at $77,200, and the 200-day SMA — the level that could genuinely confirm a bullish reversal — is far above at $96,800.
Han Tan from Bybit highlighted the importance of one such level:
“To the upside, Bitcoin may have to resurface above its 50-day SMA and reclaim the psychological $80k handle before more buyers are enticed back into the fold,” he added.
Bear Flag Threatens Bitcoin Price, but Invalidation Is in Play
On the three-day chart, the Bitcoin price trades inside a bear flag, a bearish continuation pattern where price consolidates upward within parallel trendlines after a sharp drop. The flagpole measures a roughly 39% decline, meaning a confirmed breakdown could project a similar move lower.
Adding weight to this, a hidden bearish divergence has formed on the Relative Strength Index (RSI), a momentum oscillator. Between February 6 and February 24, the Bitcoin price printed a lower high while RSI printed a higher high. This mismatch suggests that despite the bounce, underlying momentum still favors the downside.
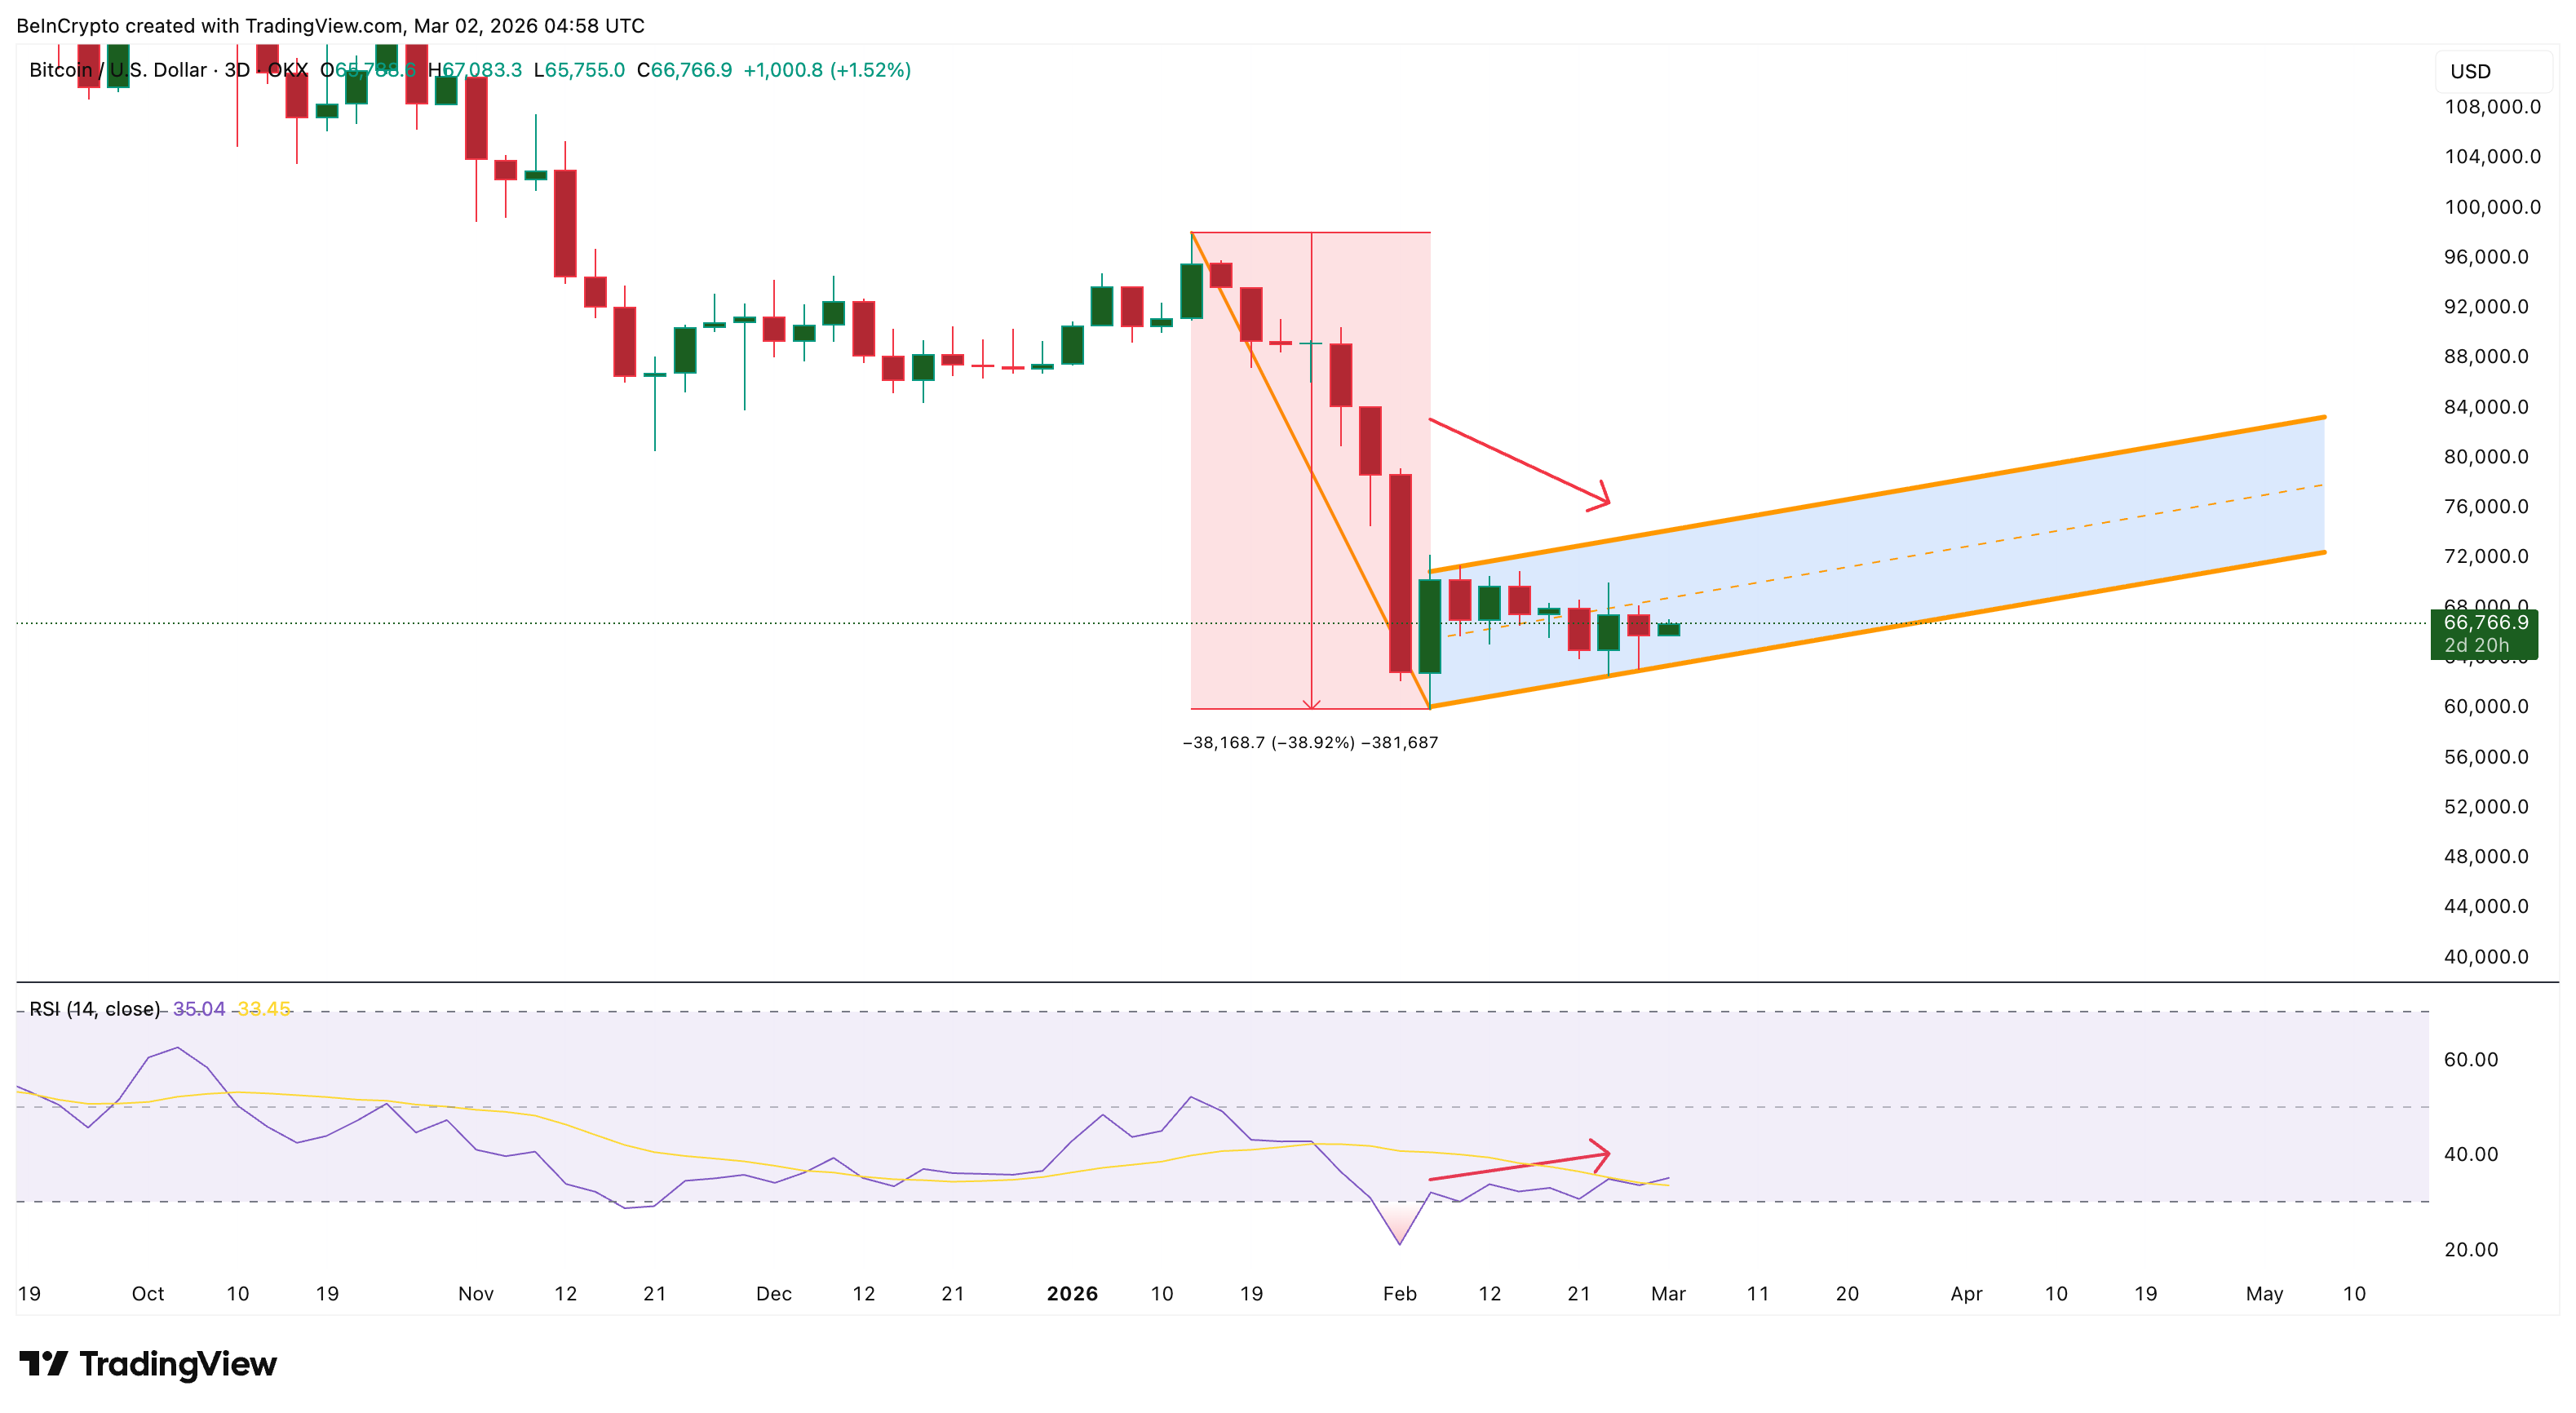
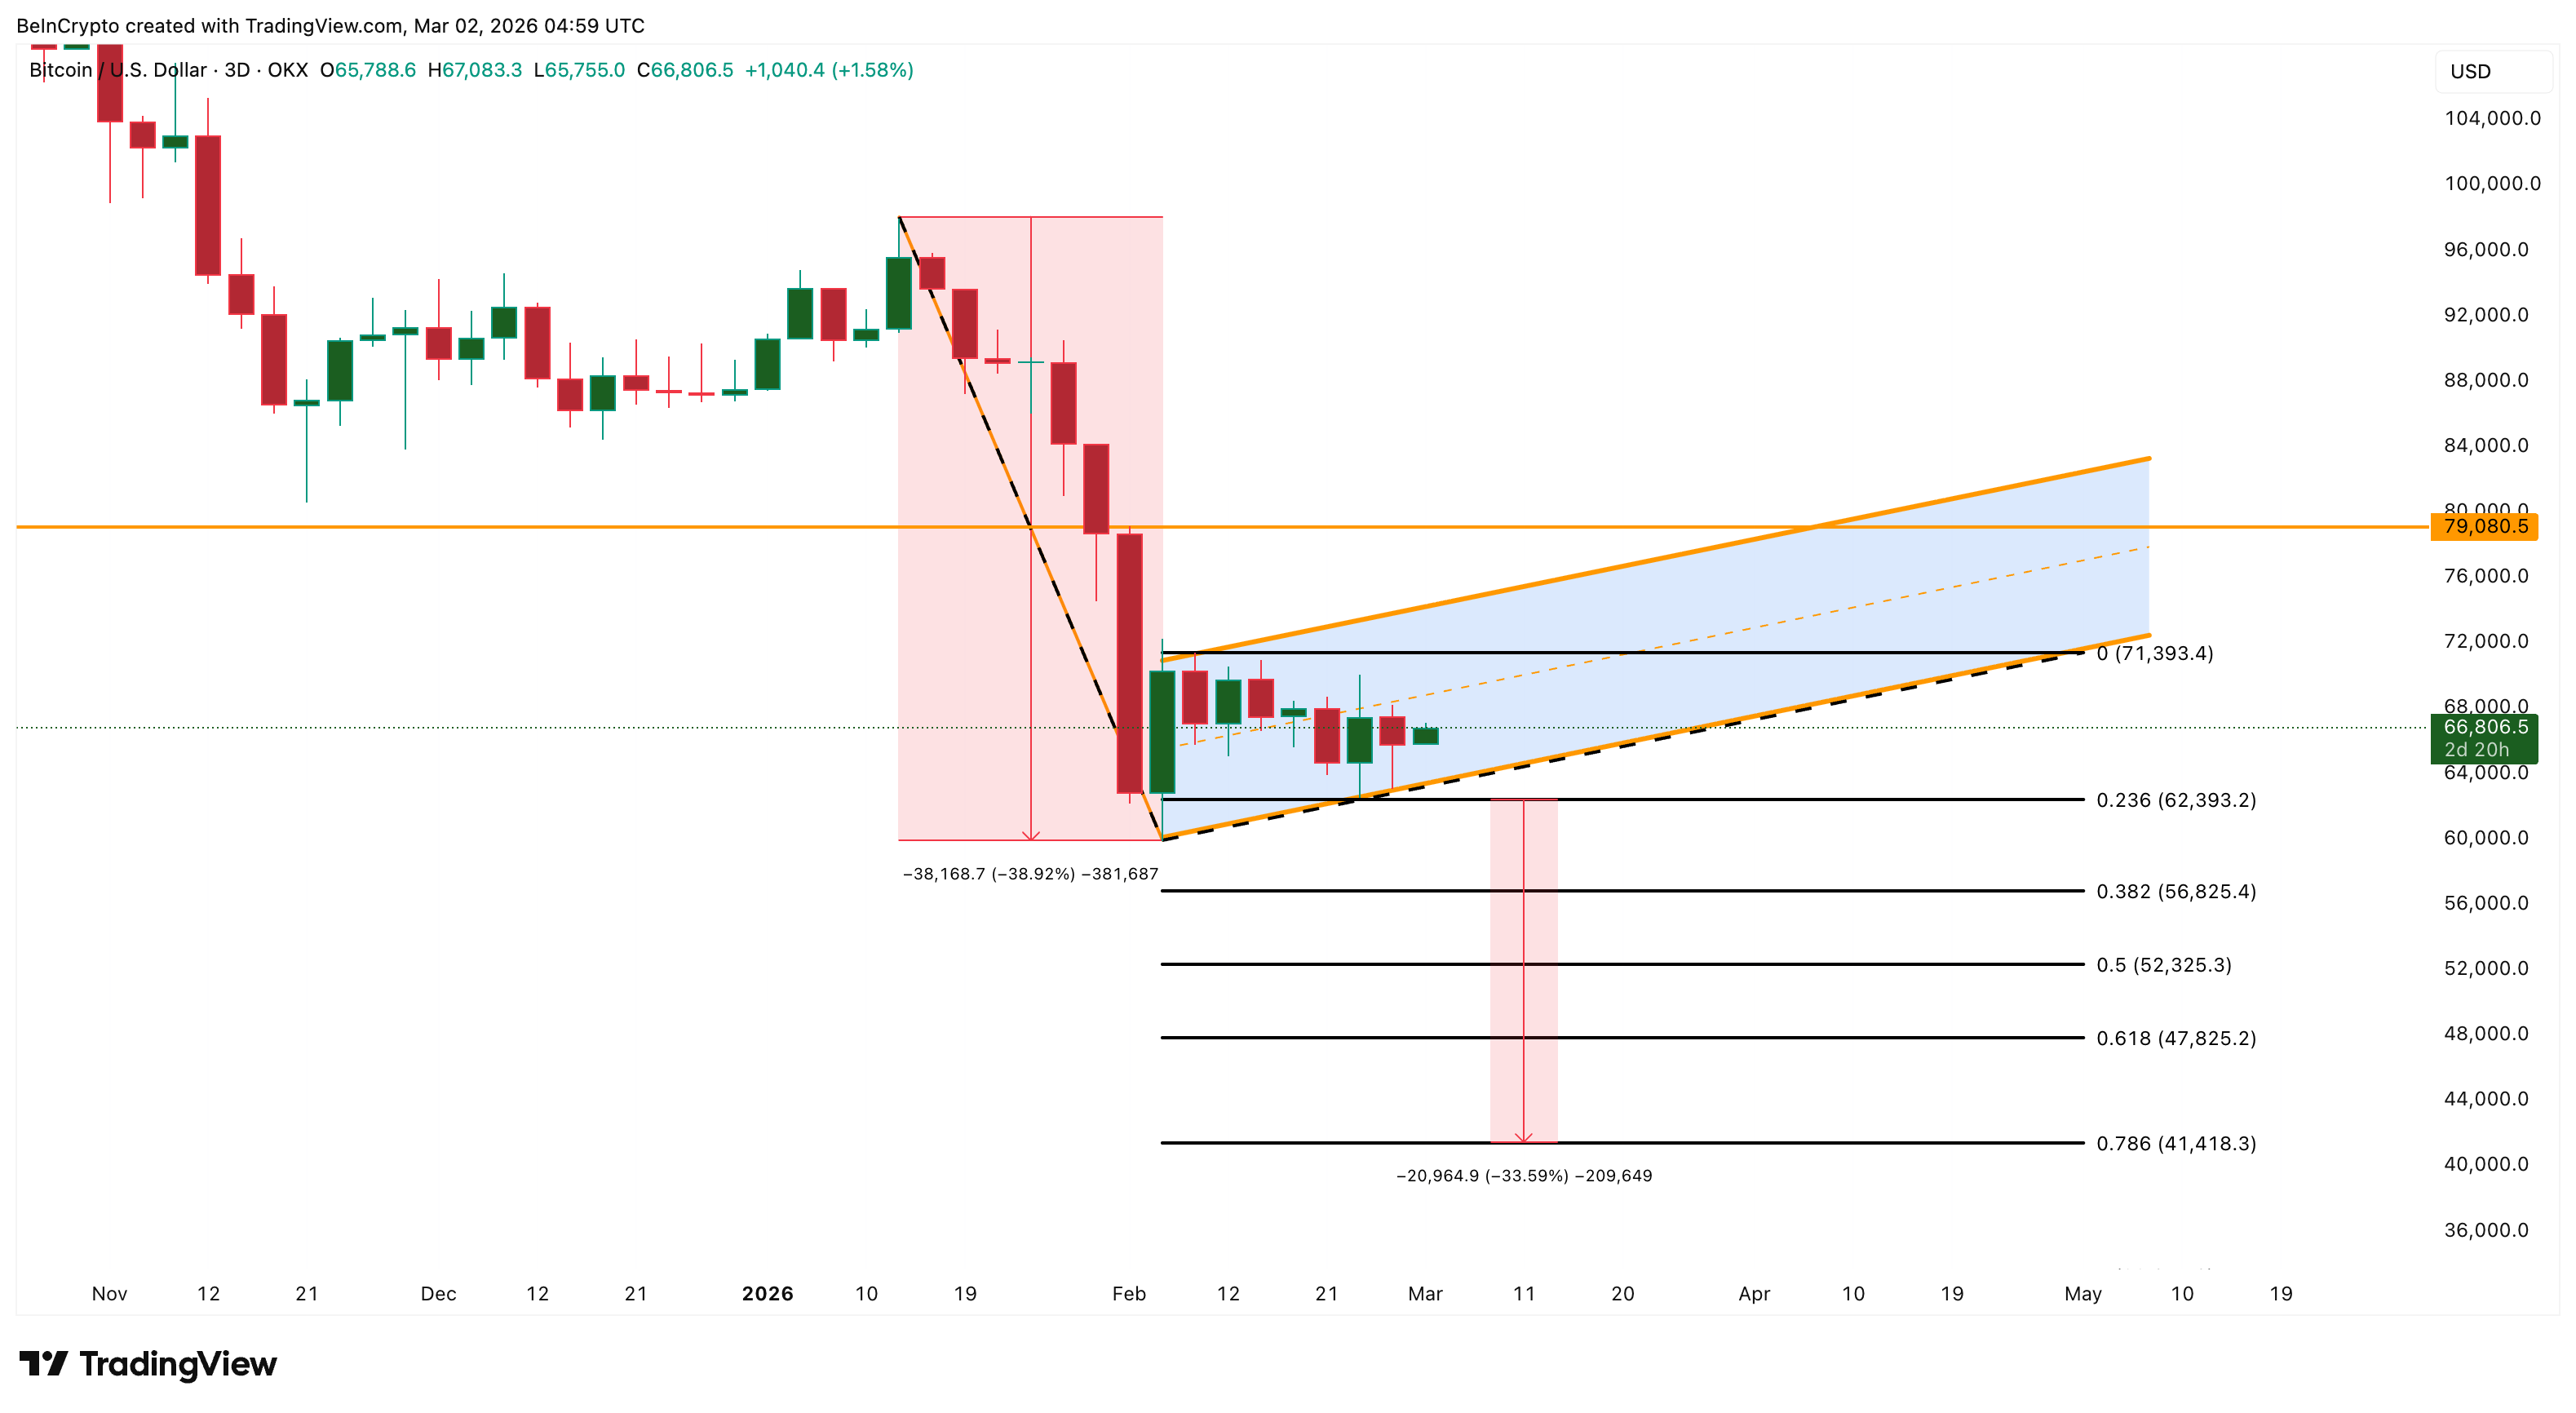
The key levels are clear. On the upside, $71,300 is the first significant resistance. A move above $79,000 would invalidate the bear flag. However, continued BTC price bounces can also shift the structure toward a rising channel, which would become bullish. The next few 3-day candles would therefore determine if the flag breaks or the extension invalidates the bearish pole-and-flag rule.
On the downside, a breakdown below $62,300 opens the door to Fibonacci support levels at $56,800, $52,300, $47,800, and, in extreme scenarios, $41,400.
Crowther sees the most probable outcome as relatively contained, highlighting the chance of a mild bounce.
“Flat, or slightly positive price movement throughout March should be an investor’s base case scenario for now,” he said.
Kılıç, however, pushed back on the bearish framing, aligning with the on-chain selling exhaustion and bounce hopes:
“Extreme fear and the deepest ETF outflow streak in a year aren’t bearish signals. I’d actually define them as classic capitulation, flushing out weak hands and tightening supply,” he stated.
The most likely path for March, therefore, involves a local bounce — driven by exhausting sell pressure and whale accumulation — followed by renewed selling as the broader bear flag structure resolves. Selling is weakening, but it hasn’t been extinguished. A local bottom is not the same as a cycle bottom. March will likely be defined by whether $62,300 support holds or $79,000 resistance breaks first.

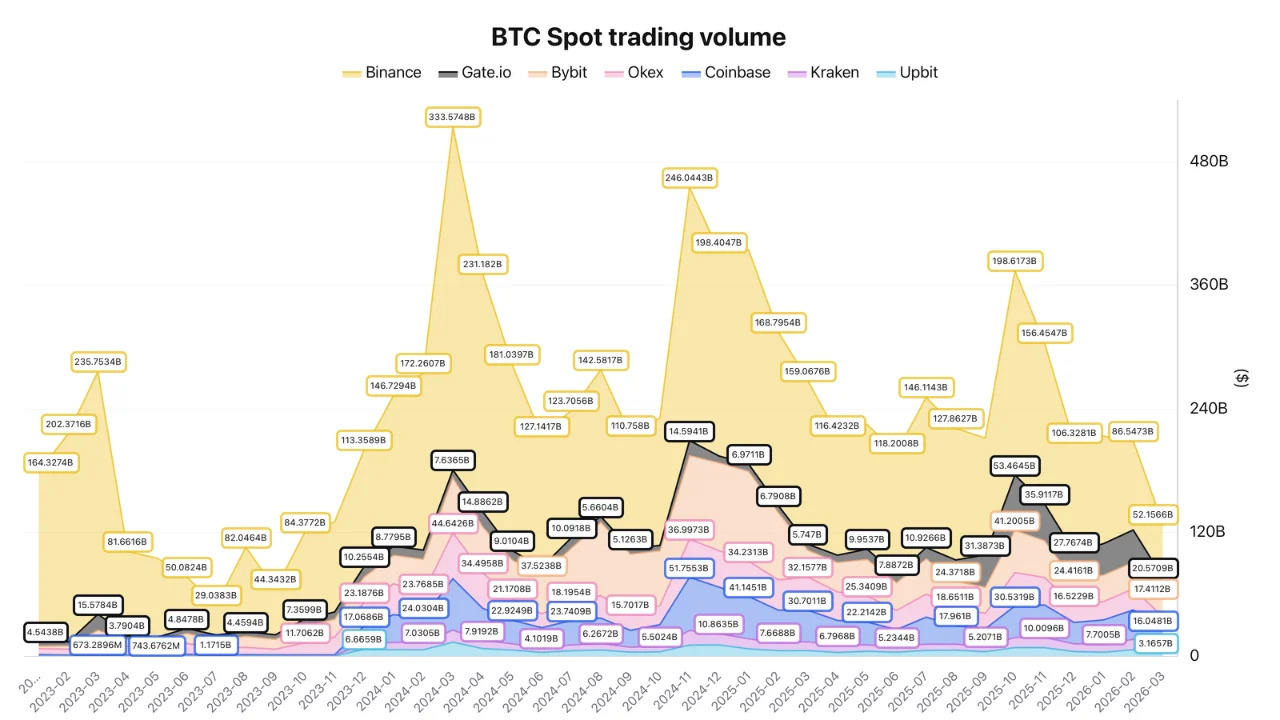
Bitcoin (BTC) spot volumes on Binance have dropped to their lowest level since September 2023, indicating that the current intraday price rise may not be backed by strong demand.
The rally above $71,700 on Monday appears to be driven mainly by news headlines and liquidations in the Bitcoin futures markets.
Binance volumes and exchange flows signal the demand gap for BTC
Crypto analyst Darkfost said that March is on track to record the lowest Binance spot volume since Q3 2023, at roughly $52 billion, compared to the $88 billion recorded in September 2023. The activity levels align with the prior bear market conditions, pointing to the reduced participation.

The exchange flow data shows a similar slowdown. Crypto analyst Arab Chain reported $6.38 billion in seven-day cumulative flows on Binance and $5.14 billion on Coinbase. The Binance flows have dropped to the lowest level since 2024, indicating reduced deposit activity.
However, the lower inflows may also coincide with a reduced supply to sell, as fewer coins move onto the exchanges. The Coinbase flows remain relatively stable, reflecting the steadier participation from the long-term investors.
The large-holder activity added another layer. Market analyst Gaah identified a record surge in the whale inflow momentum, which tracks the rate of change in large transfers to the exchanges.
The current reading of 74.3 surpasses all prior cycle peaks over the past 11 years, with a higher level last recorded at 124.6 in 2015.
The elevated inflow velocity signals an aggressive capital rotation and hedging, increasing BTC’s sensitivity to short-term volatility over the next few weeks.

Related: Bitcoin rebounds to $71K as oil drops after Trump signals pause on Iran strikes
Bitcoin liquidation activity shows traders lack conviction
The BTC rally followed reports that President Trump had deferred the planned US strikes on Iran’s energy infrastructure for five days after citing progress in the diplomatic discussions, a claim later rejected by Iran’s foreign ministry, which denied that any talks had taken place.
BTC still pushed to a weekly high of $71,789 on Binance during the US market session, driven by the above external catalyst rather than by spot demand or futures positioning, leading the move.
Data shows the rally coincided with a reduction in leverage. The aggregated open interest declined by about 9,700 BTC, marking a 4% drop over 13 hours.
The open interest tracks the total number of active futures contracts, and the decline during a price increase signals that the positions were being closed rather than new ones being opened.

This type of move typically occurs when short positions are forced out of the market, reducing the total exposure while pushing the price higher. Binance recorded over $44 million in short liquidations within one hour, the largest since the one-hour long liquidations of $53 million on Feb. 6.
The Coinbase premium (in percentage terms) remained negative during the move, indicating limited spot demand from US participants.
The falling open interest, high liquidations, and weak premiums suggest the move higher was driven by positions being closed rather than new money entering the market, with most of the activity clustered around the $71,000–$72,000 range.
Related: Gold slides as traders eye sub-$50K BTC: Five things to know in Bitcoin this week
This article does not contain investment advice or recommendations. Every investment and trading move involves risk, and readers should conduct their own research when making a decision. While we strive to provide accurate and timely information, Cointelegraph does not guarantee the accuracy, completeness, or reliability of any information in this article. This article may contain forward-looking statements that are subject to risks and uncertainties. Cointelegraph will not be liable for any loss or damage arising from your reliance on this information.
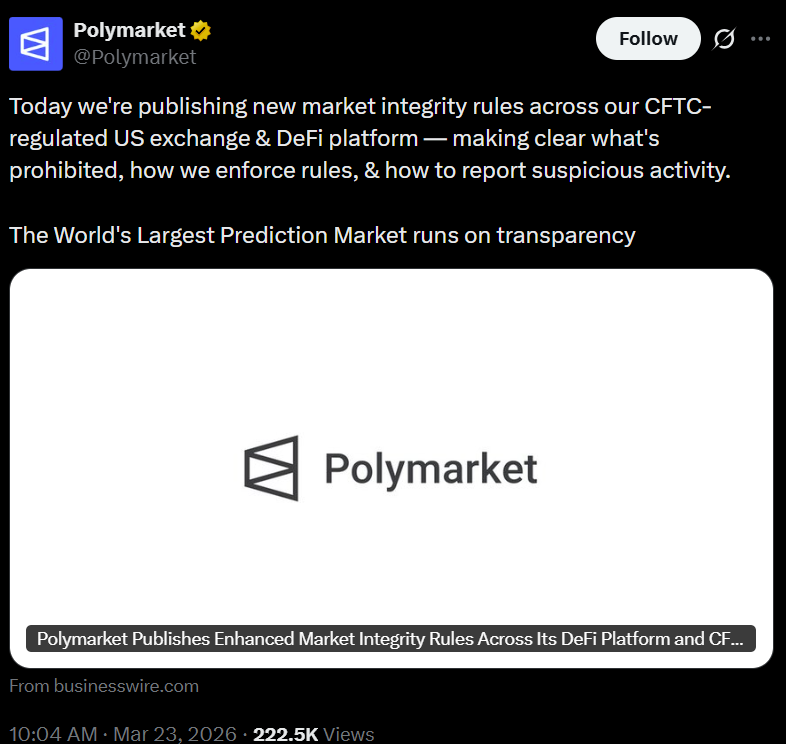
Prediction platform Polymarket has updated its market integrity rules to align more closely with regulatory standards and expand its presence as a regulated trading platform amid growing scrutiny of manipulation and insider trading risks.
In a Monday announcement, the company outlined updated rules governing both its global decentralized finance platform and its US exchange, which operates under compliance oversight by the Commodity Futures Trading Commission (CFTC).
The changes come amid growing scrutiny from regulators and politicians over risks tied to insider trading, market manipulation, and the proliferation of controversial event-based contracts.

Polymarket said the updates include stricter market design standards, clearer resolution criteria — which determine how outcomes are settled — and more defined data sources. The company said it was also enhancing monitoring and surveillance measures to detect suspicious trading activity.
In addition, Polymarket said it would limit certain types of markets, including those deemed easily manipulated or ethically sensitive.
Last week, the company said it had banned and reported users who pressured an Israeli journalist with death threats to amend a news article about an Iranian missile strike that was the subject of a $17 million prediction market.
Related: Bitcoin prediction markets see 70% chance BTC price crashes to $55K in 2026
Prediction market boom continues to draw regulatory pushback, ethics concerns
Prediction markets have surged in popularity, attracting a growing base of active traders wagering on real-world events. The momentum helped Polymarket raise $200 million in July and reportedly seek a valuation of up to $10 billion.
However, regulators remain cautious. Several US states have taken action against prediction platforms, alleging they operate as unlicensed gambling services.
Monday’s announcement came days after Major League Baseball signed a deal with Polymarket, alongside a separate agreement with the CFTC focused on so-called “integrity protections.” The arrangements signal a broader push to legitimize prediction markets through partnerships and regulatory alignment.

Ethical concerns have also intensified. In one widely cited case, a small group of Polymarket accounts reportedly generated roughly $1 million in profits by correctly timing bets on US strikes on Iran, raising concerns about potential insider trading and market fairness.
As Bloomberg reported, all six accounts were newly created in February and had only ever wagered about whether the strikes would occur.
Magazine: Are DeFi devs liable for the illegal activity of others on their platforms?
Crypto World
UnitedHealth (UNH) Stock Faces Pressure from Analyst Downgrades and Regulatory Challenges

Key Takeaways
- Shares began trading at $277.32, significantly below the 52-week peak of $606.36
- Wall Street firms reduced price targets — JPMorgan to $389, Truist to $370, UBS to $410
- Weiss Ratings issued a Sell recommendation in early March
- Fourth-quarter EPS of $2.11 slightly exceeded forecasts; revenue climbed 12.3% to $113.73 billion
- Consensus rating stays at Moderate Buy with a $372.13 mean target according to MarketBeat
UnitedHealth Group (UNH) has experienced significant turbulence recently. Shares opened Monday’s session at $277.32, trading considerably beneath both the 50-day moving average of $297.19 and the 200-day moving average of $324.39.
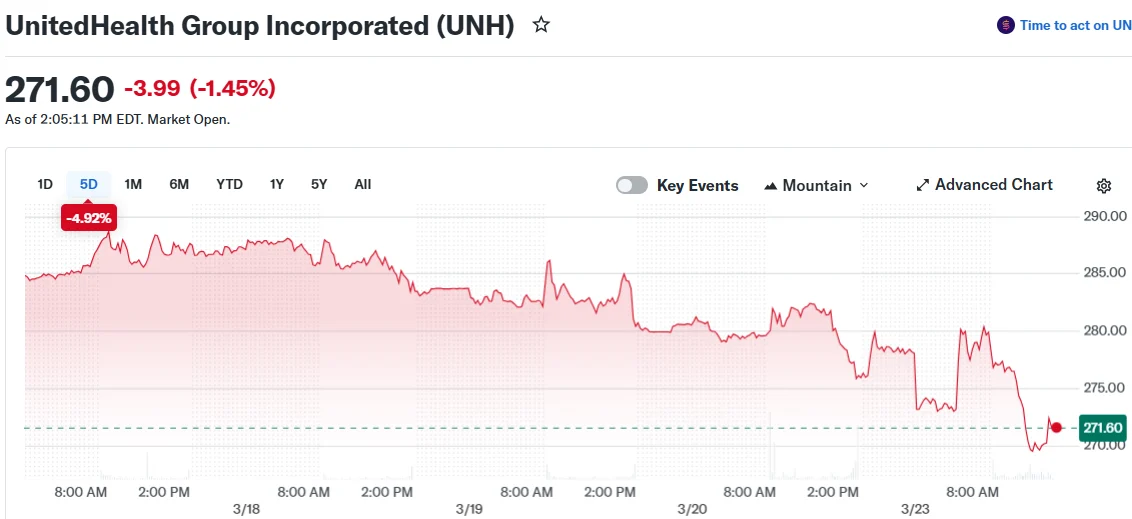
This marks a substantial decline from the 52-week peak of $606.36. The stock’s 52-week bottom rests at $234.60.
The healthcare giant’s market capitalization presently registers at $251.71 billion, accompanied by a price-to-earnings multiple of 21.02 and a beta of 0.41.
The company maintains a debt-to-equity ratio of 0.72, while both current and quick ratios stand at 0.79.
During January, UnitedHealth disclosed fourth-quarter earnings of $2.11 per share, marginally surpassing the consensus forecast of $2.09. Revenue totaled $113.73 billion, representing a 12.3% year-over-year increase and slightly exceeding Wall Street projections.
However, the Q4 EPS figure represents a significant decline compared to the $6.81 posted during the corresponding quarter last year.
Wall Street Firms Reduce Price Targets
Multiple prominent investment banks have decreased their price objectives in recent weeks.
JPMorgan reduced its target from $425 down to $389, Morgan Stanley adjusted downward from $411 to $409, and UBS lowered its projection from $430 to $410. Truist executed the most aggressive reduction, dropping from $410 to $370. Despite these cuts, all four firms preserved Buy or Overweight recommendations.
Weiss Ratings took a more bearish stance, downgrading UNH from Hold to Sell during early March.
According to MarketBeat, the current consensus rating remains at Moderate Buy, featuring 17 Buy recommendations, 8 Hold ratings, and 2 Sell ratings. The mean 12-month price objective stands at $372.13 — suggesting approximately 34% potential upside from present levels.
Regarding institutional investors, significant movements have occurred. Wealth Enhancement Advisory Services reduced its position by 40.6% during Q4, liquidating 170,643 shares. Conversely, Norges Bank, Berkshire Hathaway, and Capital Research Global Investors all increased or established new positions throughout 2024. Institutional investors collectively control 87.86% of outstanding shares.
Ongoing Regulatory Concerns
Department of Justice investigations concerning Medicare Advantage reimbursement methodologies continue creating headwinds for investor sentiment. While the company has secured at least one favorable legal outcome in that matter, broader regulatory pressures surrounding prior-authorization procedures and coverage denial practices persist.
Executives have previously disclosed intentions to reduce certain Medicare Advantage membership and adjust product pricing in response to changing cost dynamics.
Management provided fiscal year 2026 EPS guidance of approximately $17.75. Wall Street analysts currently project full-year EPS of $29.54 for the ongoing fiscal year.
UNH distributed a quarterly dividend of $2.21 per share on March 17, translating to an annualized yield of approximately 3.2%. The current payout ratio stands at 67.02%.
On a constructive note, UnitedHealth recently unveiled a nationwide expansion of its doula benefit initiative, which may enhance member retention and drive improved outcomes within its value-based care framework.

Crypto World
Best Crypto to Buy Now: Bhutan Sells $72 Million in BTC Under Fiscal Pressure While Pepeto Targets 1000x From Presale

Bhutan’s state investment arm transferred 973 BTC worth $72.3 million in a single day, cutting holdings from 13,295 BTC at peak to just 4,400 BTC. The selling looks driven by fiscal pressure, not strategy.
Pepeto built the exchange that helps investors avoid being on the wrong side of forced sales, and with more than $8 million raised and a Binance listing approaching, the best crypto to buy now is not the asset a government is dumping but the presale they have not discovered.
Bhutan’s DHI transferred over 973 BTC worth $72.3 million in 24 hours, reducing holdings from a peak of 13,295 BTC to approximately 4,400 BTC through periodic sales since the October 2025 all time high, according to CoinDesk.
Trump’s postponement of Iran strikes then sent BTC from $68,500 to $71,000, liquidating $270 million in shorts within hours, according to CoinDesk Daybook.
The best crypto to buy now is the one positioned before the forced sellers finish distributing, not after the recovery has already priced in.
Best Crypto to Buy Now: Three Projects Drawing Capital While Sovereign Sellers Distribute
Pepeto
Bhutan did not have a system that told them when to hold and when fiscal pressure would force their hand, and most retail investors do not have one either. That is the gap Pepeto closes, because while a sovereign nation was liquidating BTC at a 50% drawdown from peak, the exchange tools were already running and protecting capital for the wallets that committed early.
The risk scorer checks any contract before your money goes near it, catching the scam patterns that wipe out portfolios overnight, and it delivers every warning in plain language so you make an informed decision instead of discovering the damage afterward. PepetoSwap runs zero fee trades so your capital works harder, and the cross chain bridge moves tokens at zero cost so what you send is what arrives.
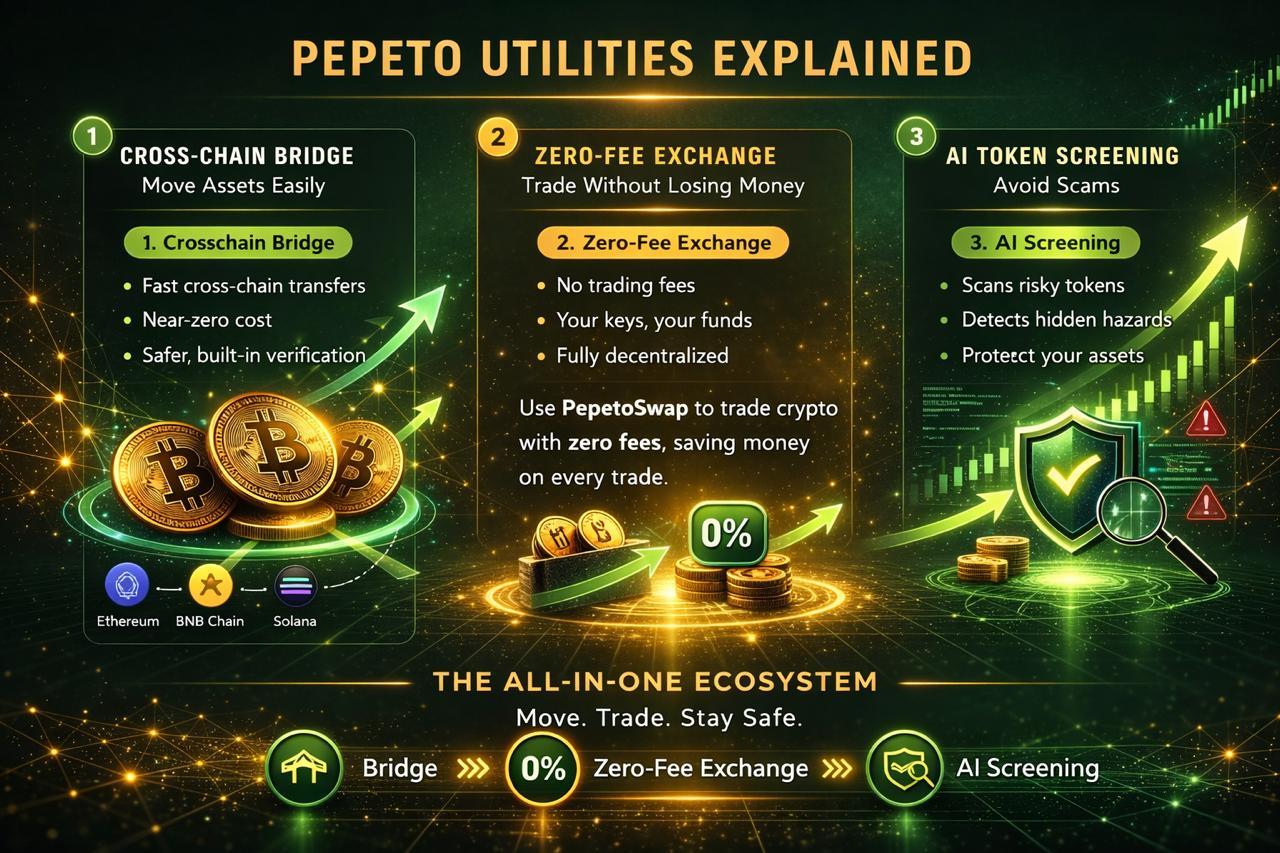
What sets Pepeto apart is that the tools are already live, not gated behind a future milestone. The SolidProof audit verified every contract, a former Binance expert is on the team, and the cofounder who built the original Pepe coin to $11 billion with the same 420 trillion supply and zero products is behind the exchange.
Pepeto is at $0.000000186 with 195% APY staking compounding in early positions while the market recovers. That is why many now view it as the best crypto to buy now. The Binance listing is approaching, and 1000x from the current entry is the projection building from wallets that see the same kind of utility that turned early Shiba Inu and Pepe entries into generational stories.
DOGE
DOGE trades near $0.094 as of March 23, down 87% from its all time high of $0.73, according to CoinMarketCap.
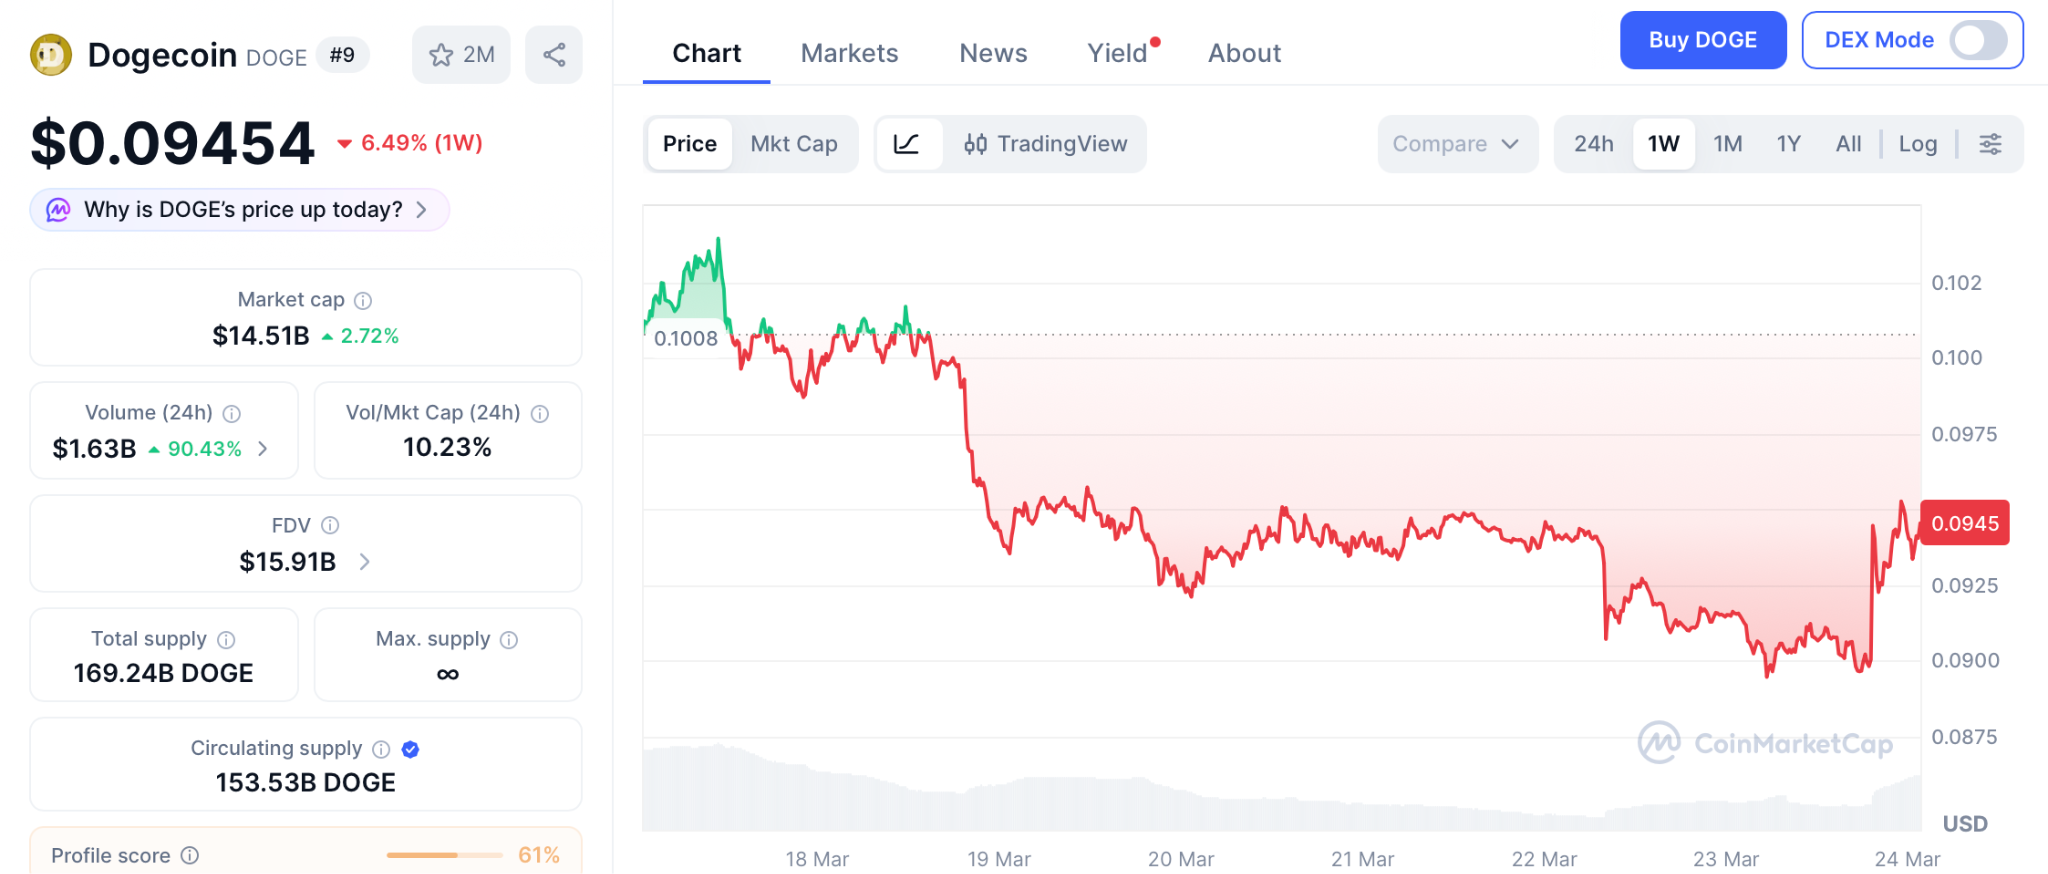
The 21Shares DOGE ETF gives institutions a regulated path in, and RSI is in oversold territory signaling a bounce. But from $0.094 the bullish $0.25 target is a 2.8x over the full year. DOGE is a cycle hold, not the concentrated position the strongest entry demands.
ADA
ADA trades near $0.26 as of March 23 with DeFi TVL hitting a record 520 million ADA and the SEC commodity classification removing the legal cloud, according to CoinMarketCap.
CME futures launched in February and spot ETF filings are progressing. But from $0.26 even $2.00 needs patience across the full year. Cardano builds slowly, and the best crypto to buy now compresses returns into one listing.
Best Crypto to Buy Now Before the Listing Proves What Bhutan’s Forced Selling Could Not See
Bhutan sold 973 BTC at a 50% loss because it had no choice. The wallets filling Pepeto right now have a choice and they are making it while the presale is open. Shiba Inu made millionaires out of people who put in $650 and that token had no exchange, no audit, no bridge. Pepeto has all three plus the cofounder who built Pepe to $11 billion. The best crypto to buy now does not wait for you to feel comfortable.
The stages fill faster each round, the Binance listing gets closer every day, and the entry you are reading about disappears the moment trading begins. Visit the Pepeto official website and take the position before it becomes the one you wish you had taken.
Click To Visit Pepeto Website To Enter The Presale

FAQs
Why is Pepeto considered the best crypto to buy now in 2026?
Pepeto has a running exchange with risk detection, zero fee trading, and a cross chain bridge audited by SolidProof, with more than $8 million raised and 1000x projections building as the Binance listing approaches.
What happened with the Bhutan Bitcoin sale?
Bhutan’s state investment arm sold 973 BTC worth $72.3 million in 24 hours, reducing holdings from 13,295 BTC at peak to 4,400 BTC. Forced selling under fiscal pressure, not strategy.
What makes early presales like Pepeto better than established tokens for big returns?
Large caps like DOGE and ADA have multi billion dollar valuations limiting growth. Pepeto offers presale pricing on a working exchange where the Binance listing compresses the distance into days. The Pepeto official website shows the entry the listing erases permanently.
Disclaimer: This is a Press Release provided by a third party who is responsible for the content. Please conduct your own research before taking any action based on the content.


Summary
- Origins Network has raised $8 million in strategic funding to build a modular blockchain tailored for AI agents with verifiable computation.
- The round includes Animoca Brands and other Web3 investors, with the project pitching a “Proof of Computation” design that separates heavy AI workloads from onchain verification.
- Origins is already working with AWS, Tencent Cloud, and Alibaba Cloud, positioning itself at the intersection of crypto infrastructure and the fast‑growing agentic AI stack.
Origins Network has secured $8 million in strategic financing to build a modular blockchain purpose‑built for AI agents, betting that verifiable compute will be the missing trust layer for the next wave of autonomous systems. The round, announced on March 23, 2026, features Animoca Brands alongside TBV, Candaq, Castrum Istanbul and Coinvestor Ventures, with the team describing the cap table as a blend of Web3, AI and cloud‑native backers.
In a statement, Origins said it wants to make AI “auditable, not mystical,” arguing that users should be able to check how an AI agent arrived at a result rather than accepting black‑box outputs. To do that, the network introduces Proof of Computation (PoC), a design where heavy AI inference runs offchain on GPU‑rich infrastructure, while succinct proofs of that work are verified and settled onchain. “We’re not trying to turn a blockchain into a data center,” the team said. “We’re turning blockchains into verifiers of AI behavior.”
Under the PoC model, AI agents submit their workloads to an offchain execution layer — which can tap infrastructure from partners like AWS, Tencent Cloud, and Alibaba Cloud — and then post cryptographic evidence of the computation back to Origins’ chain. That lets applications prove that a model actually ran a given prompt or data pipeline, without forcing every full node to re‑execute the underlying workload. The project frames this as a middle path between fully centralized AI APIs and heavyweight “AI on L1” experiments that risk clogging general‑purpose chains.
The broader context is a funding wave into modular AI blockchains. In 2024, 0G Labs raised $35 million at pre‑seed to build a modular AI data availability layer, arguing that “core infrastructure needs to be built” before today’s centralized AI stacks can plug into Web3. More recently, networks like Hemi have raised eight‑figure rounds to connect Bitcoin and Ethereum as modular execution and settlement layers, a sign that investors are comfortable backing deep, technical infrastructure plays rather than just consumer apps. Origins is effectively aiming to do the same at the AI layer, but with a tight focus on verifiable agentic workloads.
Lead backer Animoca Brands has spent years assembling one of the broadest Web3 portfolios, with over 600 investments spanning gaming, NFTs, and infrastructure. Its chairman, Yat Siu, has often argued that Web3’s real unlock is “digital property rights at internet scale,” and Origins fits neatly into that thesis by trying to make AI‑generated outputs ownable and auditable rather than ephemeral. In a recent interview, Siu described Animoca as “a gateway to the utility tokens of Web3” — as opposed to pure memecoins — and said the firm is now backing infrastructure that brings institutional‑grade transparency and accountability into crypto.
For crypto markets, the bet is simple but ambitious: if AI agents are going to manage portfolios, underwrite loans, or trade on decentralized exchanges, they’ll need a chain where their decisions can be inspected and, if necessary, challenged. Origins Network wants to be that chain.

Key Highlights
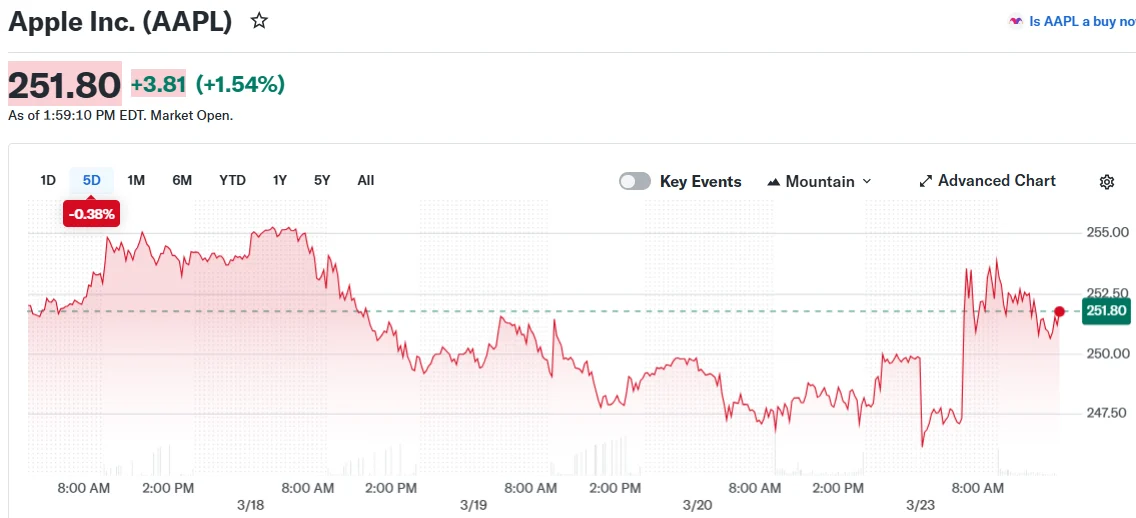
- Apple is set to unveil advertising capabilities within its Maps application, with a formal reveal potentially happening before month’s end
- The advertising model mirrors Google Maps’ approach, enabling companies to purchase priority placement for specific search queries
- The feature is slated to debut in Maps during summer months, accessible on iPhone, additional Apple hardware, and web platforms
- Apple’s services division currently generates north of $100 billion annually, representing over 25% of the company’s overall revenue
- The European Commission determined Apple Maps doesn’t qualify for stringent Digital Markets Act regulations given its limited European market share
Apple is preparing to integrate advertising into its Maps platform, based on a Monday report from Bloomberg. The official announcement may arrive within the next few weeks.
The advertising framework will function similarly to Google Maps’ existing system. Companies will compete through bidding on relevant keywords — for instance, a dining establishment might purchase the term “sushi” — with the winning bidder’s location featured prominently when users conduct related searches.
The advertising functionality is anticipated to launch within Maps by summer’s end. Users will encounter these sponsored listings across iPhone devices, other Apple products, and web-based versions of the service.
This development represents a predictable evolution for the company. Apple has been systematically expanding its advertising operations. In late 2024, the tech giant introduced additional advertising positions within App Store search functionality and announced intentions to broaden advertising opportunities through 2026. Maps has reportedly been considered as the next expansion target in internal discussions.
Apple’s services category — encompassing the App Store, Apple Music, iCloud storage, and Apple TV+ — now produces over $100 billion in yearly revenue. This represents more than one-quarter of the company’s total income, a significant increase from less than 10% ten years prior.
European Regulatory Clearance
Apple received favorable regulatory news recently. The European Commission opted against applying stringent Digital Markets Act requirements to Apple Maps, acknowledging the application’s comparatively modest footprint in European markets versus rival services.
This determination removes a possible obstacle for launching an advertising product in Maps without encountering DMA-related complications in one of Apple’s most important geographic regions.
Upcoming Announcement Opportunities
Apple’s yearly Worldwide Developers Conference (WWDC) is scheduled for June 8–12. The opening keynote presentation on June 8 at 1 p.m. EST typically showcases software innovations and product launches. This event would provide an ideal platform to officially announce the Maps advertising initiative.
AAPL shares advanced approximately 1.5% during Monday’s trading session. Analysts currently maintain an average price target of $304.66 for the stock, suggesting potential upside of roughly 21% from present trading levels.
Wall Street maintains a Moderate Buy consensus rating on AAPL, derived from 14 Buy recommendations, nine Hold ratings, and one Sell rating issued during the previous three months.
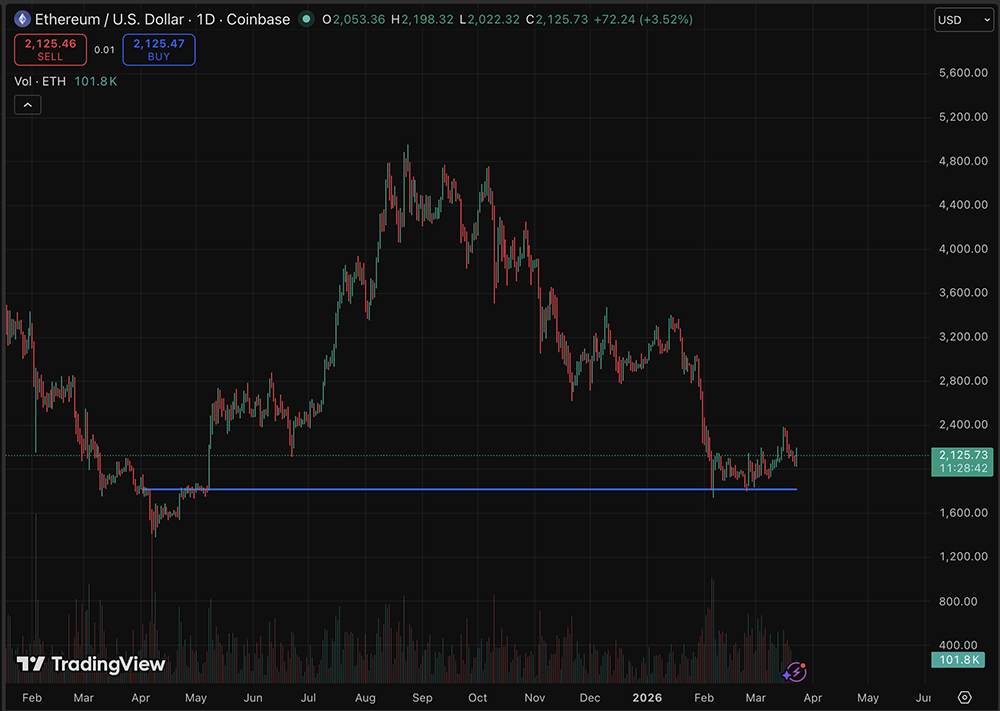
Bitmine Immersion Technologies has staked over $200 million worth of ETH in a massive vote of confidence for the protocol, even as Ethereum price prediction faces a critical test at the $2,000 support level.
Just days ago, Bitmine executed a transaction locking 94,670 ETH worth approximately $204 million, bringing their total staked holdings to an impressive 3,142,291 ETH.
According to on-chain data from Arkham Intelligence, this move represents one of the largest recent staking inflows from a publicly listed firm. The market data is telling: despite four consecutive days of losses earlier in the week, Ethereum is stabilizing.
Trading at above $2,100 at press time, the asset posted a healthy gain of 2.4%. This institutional accumulation during a period of fear suggests smart money is positioning for a supply shock.
Are we witnessing a bottom formation, or is the bearish pressure too heavy?
Ethereum Price Prediction: Can Ethereum Defense Hold $2,000 Support?
Ethereum’s technical structure currently hinges on the $2,000 psychological barrier, a level that has acted as a pivot point throughout Q1 2026. While year-to-date performance shows a 31.1% decline, the asset has maintained an 7.7% gain over the last 30 days, indicating long-term resilience.

Technical indicators paint a conflicted picture. On short timeframes, 24 of 28 indicators signal bearish conditions, yet long-dated moving averages (MA100, MA200) continue to register buy signals. The RSI sits near 50, revealing a market in equilibrium, neither overbought nor oversold.
- Bull Case: If ETH reclaims the $2,378 resistance (R1 pivot), it opens the path toward the $2,785 annual average projected by CoinCodex.
- Bear Case: A breakdown below the immediate support of $1,822.28 could trigger a cascading sell-off toward the $1,647 downside resistance.
Despite the short-term noise, macro forecasts remain aggressively bullish. Standard Chartered has released a forecast predicting that ETH could hit $7,500 by year-end 2026. However, for traders seeking immediate alpha, Ethereum’s current low-volatility grind may offer limited short-term upside compared to emerging infrastructure plays.
ETH is down 60% from its ATH, exchange supply is at decade-lows, and Standard Chartered has a $7,500 EOY target. Whether that plays out or not, the on-chain setup is interesting. What's your current ETH thesis — accumulate here or wait for more clarity? #ETH
—
 Bee Carlsson01
 Memecoin (@BeeCarlsson01) March 2, 2026
Discover: The Best New Crypto
Bitcoin Hyper Targets Infrastructure Rotation as ETH Stalls
While Ethereum battles for stability at established valuations, capital is beginning to rotate into high-performance Layer 2 solutions that promise aggressive growth multiples. Investors are increasingly looking toward the Bitcoin ecosystem for the next wave of programmable liquidity.
Bitcoin Hyper ($HYPER) is capitalizing on this shift by launching the first-ever Bitcoin Layer 2 integrated with the Solana Virtual Machine (SVM). This architecture solves Bitcoin’s critical latency issues, delivering sub-second finality while leveraging Bitcoin’s native security layer. The market response has been immediate and high-volume.
The project has already raised more than $32 million in its ongoing presale. Currently priced at $0.0136, the token offers an arguably low entry point relative to established L2s with a 66% APY staking rewards.
The protocol distinguishes itself with a Decentralized Canonical Bridge, allowing seamless BTC transfers into a high-speed smart contract environment faster than Solana itself.
For traders fatigued by Ethereum’s slow chop around $2,150, Bitcoin Hyper presents a “high beta” infrastructure play (early stage, higher risk, higher potential reward).
Check out the Bitcoin Hyper Presale
The post Ethereum Price Prediction: Valhalla Awaits as Bitmine Staked More? appeared first on Cryptonews.
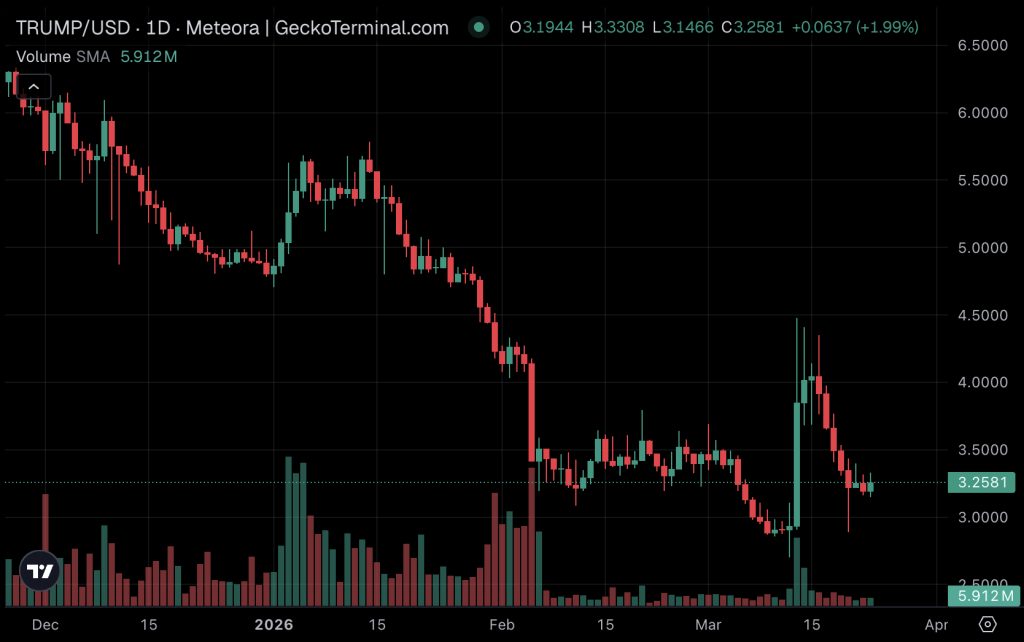
The Official TRUMP crypto price is currently trading at $3.26, a 2.5% gain today, as the asset struggles to find a floor. This price action follows a dramatic reversal where the token surrendered nearly the entirety of a 49.65% rally that peaked on March 13, leaving bulls trapped at higher levels.
The token now sits precariously 20% above its all-time low of $2.73. On-chain data is painting a specifically bearish picture; exchange balance metrics from Glassnode indicate that sellers remain firmly in control of the order book. During the mid-March volatility, balances on exchanges surged from 15 million to approximately 41 million, suggesting a rush to liquidate that has yet to fully abate.
While political headlines often drive sentiment in this sector, the technical reality points to exhausted demand. The market appears to be pricing in further downside risk unless a significant catalyst emerges to absorb the excess supply, especially after Iran denies any talk with the U.S.
Can TRUMP Crypto Hold the $2.60 Floor Amidst Sell Pressure?
The immediate technical structure for TRUMP is defined by a massive supply overhang. The spike of roughly 26 million tokens deposited to exchanges near the $4.00 mark represents approximately $104 million in sell-side positioning at the peak. While balances have since stabilized near 18.5 million, this level remains elevated compared to March lows.
Is the bottom in? The Chaikin Money Flow (CMF) offers a conflicting narrative. The indicator fell to -0.26 in early March before recovering to near zero by March 13, coinciding with the rally. However, the subsequent price collapse suggests that this recovery was a “dead cat bounce” rather than a genuine accumulation.

Conversely, a reclamation of the $3.50 level on high volume would be required to invalidate the current bearish thesis. Until then, the stabilized but elevated exchange balances act as a latent threat, ready to cap any relief rallies.
Discover: The Best New Crypto
Bitcoin Hyper Targets Infrastructure Utility as PolitiFi Tokens Stumble
While political finance (PolitiFi) tokens like TRUMP struggle with sell-the-news price action, smart money appears to be rotating into infrastructure plays that offer utility beyond speculation. The current capital flight from volatile meme-based assets is finding a home in Bitcoin Hyper ($HYPER), a project attempting to solve Bitcoin’s scalability trilemma.
Bitcoin Hyper distinguishes itself as the first-ever Bitcoin Layer 2 to integrate the Solana Virtual Machine (SVM). This architecture aims to deliver settlement speeds faster than Solana itself while anchoring security to the Bitcoin network.
The market response has been quantitatively significant; the project has raised more than $32 million in its presale phase, defying broader market consolidation. Currently priced at $0.013, $HYPER offers a high 36% APY staking program that incentivizes long-term holding, a stark contrast to the rapid turnover seen in political tokens.
While presales carry inherent vesting risks, the $32 million raise suggests strong institutional interest in bringing programmable smart contracts to the Bitcoin ecosystem. For traders fatigued by TRUMP’s volatility, this represents a fundamental hedge.
Research Bitcoin Hyper Presale Here
The post TRUMP Crypto Still The Play? Can Memecoins Still Run During Iran War? appeared first on Cryptonews.
The company, which generated less than $10 million in revenue last year selling eyecare products, raised $134 million to bet entirely on the Sky protocol’s governance token.
NovaBay Pharmaceuticals is changing its name to Stablecoin Development Corporation and its NYSE American ticker to SDEV, effective April 3, the company announced Monday. The rebrand completes a pivot from wound care to crypto that began with a $134 million private placement in January.
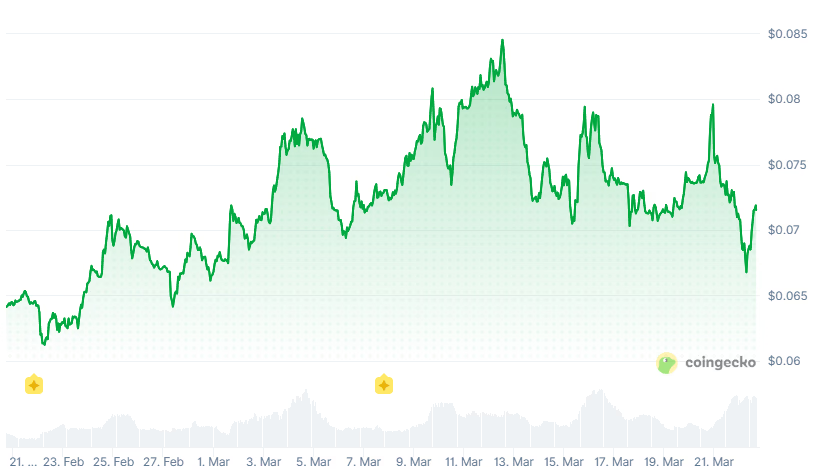
As of March 16, the company held approximately 2.06 billion SKY tokens — roughly 8.78% of the total supply of the Sky protocol’s governance token. SKY is currently trading at around $0.07, according to Coingecko, implying the position is worth roughly $144 million. The token is up 10% over the past month.

The Deal
The January private placement drew capital from R01 Fund LP, Framework Ventures, Tether Investments, and Sky Frontier Foundation. As part of the transaction, the company received approximately 943.6 million SKY tokens valued at around $58 million, along with $25 million in cash and $51 million in stablecoins. Since closing, it has spent an additional $70.7 million acquiring roughly 1.09 billion SKY on the open market at an average price of about $0.065.
The company has staked the majority of its holdings and reported cumulative staking rewards of approximately 26.6 million SKY.
The strategy mirrors Michael Saylor’s playbook of using a public equity vehicle to offer leveraged exposure to a single crypto asset. CEO Michael Kazley framed the approach around stablecoins broadly, calling them “the most compelling structural opportunity in digital finance.”
The bet comes at a pivotal moment for the Sky ecosystem.
Sky’s TVL has surged 38% this month to $7.52 billion, making it the fourth-largest DeFi protocol. The growth has been fueled by Sky’s fixed 3.75% savings rate exceeding yields on major lending platforms like Aave and Morpho in a risk-off environment.
“Honestly, it’s the classic story of how Sky, just like Maker used to, always does better in bear markets because it’s just focused on a solid product that can be trusted to be stable and deliver good returns,” Sky founder Rune Christensen told The Defiant.
NovaBay describes itself as an “on-chain holding company” focused on “long-duration participation in protocol-aligned digital asset ecosystems.”
This article was written with the assistance of AI workflows. All our stories are curated, edited and fact-checked by a human.

The weekend Bitcoin price drop has pushed some traders toward Bitcoin ecosystem infrastructure rather than away from the market altogether. After geopolitical tensions in the Middle East knocked BTC from above $70,000 to as low as $67,360, attention has turned to projects positioning for longer-term Bitcoin utility, including Bitcoin Hyper (HYPER), which has now raised over $32 million in its presale.
The move came after President Trump issued Iran a 48-hour ultimatum to reopen the Strait of Hormuz or face strikes on its energy infrastructure. The waterway, which typically carries about 20% of global oil supply, has been largely closed to commercial shipping since late February.
Oil reacted sharply. WTI crude climbed to nearly $101 per barrel, Brent moved above $113, and the United States Oil Fund jumped past $123 in pre-market trading, adding to inflation concerns across global markets.
Bitcoin sold off as the headlines hit, with long liquidations accelerating the decline before BTC recovered to around $68,000. Even so, some investors are using the pullback to rotate into Bitcoin bets focused on infrastructure, particularly projects promising broader on-chain utility during the next market cycle.
The latest escalation followed renewed friction around key shipping routes. After weeks of disruption that drove oil benchmarks above $100, President Trump posted on Truth Social that if Iran did not reopen the Strait of Hormuz by Monday evening, the US would target the country’s power plants, “starting with the biggest one first.”
Iran responded with threats against energy infrastructure across the Gulf, deepening the standoff and prompting a broader risk-off reaction.
Bitcoin felt that pressure almost immediately. Having held above $70,000, BTC fell roughly 3% on Saturday and triggered more than $240 million in liquidations within hours, sending the price to levels not seen since early March.
Still, market participants watching the longer cycle are treating the move as a macro-driven shakeout rather than a change in Bitcoin’s structural trajectory. A widely shared X post from Documenting Saylor pointed to historical cycle behavior showing Bitcoin advancing from $19,000 to $126,000 in prior runs.
$19K → $69K → $126K → $200K
HIGHER HIGHS EVERY CYCLE
THE TREND IS CLEAR
pic.twitter.com/J2B5E5sNXz
— Documenting Saylor (@saylordocs) March 22, 2026
That same view has supported projections for a potential $200,000 target as the current bull market develops. In that context, short-term volatility has strengthened interest in infrastructure that could expand what Bitcoin holders can do with their assets beyond simple holding.
Bitcoin Hyper pitches next-cycle utility with SVM-based Layer 2 roadmap
That is where Bitcoin Hyper (HYPER) has been gaining traction. The project is being positioned as a Bitcoin Layer 2 designed to improve transaction speed, lower costs, and widen the range of applications available to BTC users.
According to the project, Bitcoin Hyper (HYPER) uses the Solana Virtual Machine (SVM) to support near-instant transactions and low fees while maintaining security links to Bitcoin’s base layer. Once mainnet is live, users are expected to be able to bridge BTC to the network in a trustless manner and use it across decentralized apps, payments, and staking systems that are difficult to build directly on Bitcoin mainnet.
For investors looking at credibility signals, fundraising has been one of the clearest markers so far. The presale has raised more than $32 million, suggesting sustained demand for Bitcoin-focused infrastructure exposure rather than purely directional BTC trades.
From a humble beginning…
To Hyper Scale.
https://t.co/VNG0P4GuDo pic.twitter.com/TTkNzelKN3
— Bitcoin Hyper (@BTC_Hyper2) March 23, 2026

The HYPER token sits at the center of that model. It has a total supply of 21 billion and is intended to be used for fees, governance, and access to network features. The project also says its distribution structure is designed to avoid insider favoritism.
HYPER is currently priced at $0.0136774 in presale. Buyers can also stake tokens at 36% APY while waiting for full mainnet deployment. With the token price scheduled to rise again in a few hours under the project’s preset pricing structure, the sale has continued to draw attention from buyers seeking exposure to Bitcoin infrastructure ahead of the next phase of the market.
Accessing the HYPER sale
Investors looking to join can go to the official Bitcoin Hyper website, connect a wallet, and buy HYPER using SOL, ETH, BNB, USDC, or USDT. Bank card purchases are also supported.
Some participants have been using Best Wallet’s app for mobile purchases. The app is available on the Apple App Store and Google Play, and also supports the project’s “Buy and Stake” option.
At the current presale price of $0.0136774 and with staking rewards at 36% APY, the project is positioning itself as an accessible way to build exposure to Bitcoin Hyper while the broader market remains volatile.
For updates, follow Bitcoin Hyper on X and join the project’s Telegram group.
The post Bitcoin Pullback Puts Focus on Infrastructure Plays as Bitcoin Hyper Presale Tops $32M appeared first on Cryptonews.

AI could be the opposite of social media

Major European train station evacuated after suspicious bags found

Snap-on Incorporated (SNA) Presents at The 38th Annual Roth Conference Transcript


-
 Crypto World3 days ago
NIO (NIO) Stock Plunges 6.5% as Shelf Registration Sparks Dilution Worries
-

 Fashion3 days ago
Weekend Open Thread: Adidas – Corporette.com
-

 Politics3 days ago
Jenni Murray, Long-Serving Woman’s Hour Presenter, Dies Aged 75
-
 Tech6 days ago
Are Split Spacebars the Next Big Gaming Keyboard Trend?
-

 Business7 days ago
How the UK and China Trade Agreement Could Shape UK Businesses in 2026
-

 Crypto World2 days ago
Best Crypto to Buy Now: Strategy Just Spent $1.57 Billion on Bitcoin During Fear While Early Investors Quietly Enter Pepeto for 150x Potential
-

 News Videos5 days ago
RBA board divided on rate cut, unusually buoyant share market | Finance Report | ABC NEWS
-

 Crypto World2 days ago
Bitcoin Price News: Bhutan Sells $72 Million in BTC Under Fiscal Pressure, but the Smart Money Entering Pepeto Sees What the Market Does Not
-

 Politics5 days ago
The House | The new register to protect children from their abusers shows Parliament at its best
-

 Tech4 days ago
inKONBINI Lets You Spend Summer Days Behind the Register
-
 Politics6 days ago
Real-time pollution monitoring calls after boy nearly dies
-

 Crypto World5 days ago
Canada’s FINTRAC revokes registrations of 23 crypto MSBs in AML crackdown
-

 Sports7 hours ago
Remo Stars and Kano Pillars Strengthen Survival Hopes in NPFL
-

 News Videos5 days ago
PARLIAMENT OF MALAWI – PAC MEETING WITH REGISTRAR OF FINANCIAL ON AMARYLLIS HOTEL – INQUIRY LIVE
-
 NewsBeat5 days ago
Residents in North Lanarkshire reminded to register to vote in Scottish Parliament Election
-

 Politics4 days ago
Gender equality discussions at UN face pushbacks and US resistance
-

 Business1 day ago
No Winner in March 21 Drawing as Prize Rolls to $133 Million for Next
-

 Business5 days ago
Who Was Alex Pretti? 5 Key Facts About the ICU Nurse Killed by Federal Agents in Minneapolis
-

 Tech22 hours ago
Give Your Phone a Huge (and Free) Upgrade by Switching to Another Keyboard
-

 Sports6 hours ago
Gary Kirsten Accuses Pakistan Cricket Board Of ‘Interference’, Mohsin Naqvi Responds
You must be logged in to post a comment Login