
Crypto World
Bitcoin Slows Its Slide, Bear Market Still in Play, Analysts Say

Bitcoin (CRYPTO: BTC) has shown signs that selling pressure may be fading, though analysts caution that a durable bottom is far from guaranteed. In recent sessions, the asset has hovered around key technical levels, with the 20-day moving average offering a critical backdrop near $68,500 and volatility compressing as traders digest macro headlines. While one market update noted that BTC did not accelerate lower on risk-off news, the broader bear-market narrative remains intact for many observers, keeping upside exposure tactical rather than structural.
Key takeaways
- Bitcoin appears to have shifted tactically rather than signaling a structural reversal, with near-term momentum stabilizing but persistent bearish conditions.
- The price has regained the vicinity of the 20-day moving average around $68,500, and Bollinger Bands are narrowing, potentially setting the stage for a defined trading range rather than a fresh down leg.
- BTC touched just above $70,000 in late trading on Coinbase but retraced to roughly $68,400, indicating continued volatility and intra-session shifts.
- The $62,500 level has held on three tests, reinforcing it as meaningful support amid a broader bear-market context.
- Bullish divergences are emerging in momentum indicators like RSI and stochastic, hinting at a possible stabilization even if the larger trend remains down.
Tickers mentioned: $BTC
Sentiment: Neutral
Price impact: Positive — a price bounce driven by crowd-long liquidations in derivatives and easing selling pressure.
Trading idea (Not Financial Advice): Hold. With no confirmed trend change, tactical exposure is reasonable while monitoring for a clear breakout or breakdown.
Market context: The price action unfolds against a backdrop of narrowing volatility, strengthening ETF-related flows, and evolving macro headlines that influence risk appetite across crypto markets. As liquidity conditions remain nuanced, traders are weighing whether recent moves represent a genuine shift in momentum or a temporary pause within a continuing bear market.
Why it matters
The latest price dynamics matter because they illuminate how traders are positioning around a potential bottom without assuming a durable reversal. The evidence for a tactical shift—such as stabilizing momentum indicators and a guarded recovery after tests of critical support—could influence risk management decisions for both hedge funds and retail participants. Yet the overarching framework remains cautious: many analysts still classify Bitcoin as being in a bear-market regime, meaning that any bullish exposure should be limited in scope and time-bound unless a clear directional breakout occurs.
From a market mechanics perspective, several indicators align to suggest a pause rather than a pivot. Volatility appears to be compressing, ETF flows have shown resilience, and the once-widening Coinbase discount has faded, all of which are inconsistent with a market rushing into a fresh leg lower. Still, analysts caution that these are characteristics of consolidation, not confirmation of a new uptrend. The resilience around the $62,500 level—tested multiple times—provides a potential platform for range-bound activity or a gradual accumulation phase, should buyers step in at these levels with sustained interest.
Additionally, the narrative around derivatives markets cannot be ignored. Recent observations point to deeply negative funding rates as a key driver of a short-term rebound, where crowded short positions were forced to unwind as price found support. While that dynamic can produce sharp, short-lived bounces, it does not by itself constitute a lasting reversal or a trigger for sustained upward price action. The absence of durable macro catalysts—such as clear liquidity inflows or institutional commitments—underscores why traders remain cautious about calling a new bull leg.
What to watch next
- Observe BTC’s behavior around the 62,500 support level over the coming sessions to see if buyers maintain conviction or if bears pressure the price lower again.
- Monitor momentum indicators (RSI, stochastic) for continued bullish divergences or a retreat back into bearish territory.
- Track ETF flow data and any shifts in the Coinbase-related pricing discounts as signals of broader liquidity and investor sentiment shifts.
- Watch for changes in funding rates in derivatives markets; a sustained shift back to positive funding could alter the risk-reward dynamic for long positions.
- Keep an eye on macro catalysts that could reintroduce risk-off pressures or, conversely, catalyze renewed risk appetite in crypto assets.
Sources & verification
- 10x Research market update: Is the Bitcoin correction over, bottom formed, or is this a bear-market trap? ( https://update.10xresearch.com/p/is-the-bitcoin-correction-over-has-the-bottom-formed-or-is-this-a-bear-market-trap )
- Bitcoin price context and market observations referenced in BTC price coverage (Cointelegraph article on price movements and bear-market context): https://cointelegraph.com/news/bitcoin-holders-show-zero-panic-as-btc-hits-dollar70k-amid-middle-east-tensions
- TradingView BTCUSD price data (Coinbase exchange view): https://www.tradingview.com/symbols/BTCUSD/?exchange=COINBASE
- ETF flows and related analysis referenced in coverage of how ETF activity affects Bitcoin price dynamics: https://cointelegraph.com/news/are-bitcoin-etfs-quietly-accumulating-or-just-not-selling-the-flow-data-that-matters
- Derivatives funding rate context and potential short-squeeze signals: https://cointelegraph.com/news/negative-bitcoin-funding-rate-may-signal-pending-short-squeeze-above-dollar70k
Bitcoin price action: tests of support and momentum signals
Bitcoin (CRYPTO: BTC) has been navigating a delicate balance between tactical resilience and structural risk. After a period in which selling pressure appeared to intensify alongside macro headwinds, the market is displaying a constellation of signals that traders read as a potential shift in near-term dynamics without confirming a new long-term trend. The most cited technical talking points center on the interaction with the 20-day moving average, the narrowing of volatility bands, and the resilience of a critical support zone around $62,500.
The 20-day moving average has re-emerged as a yardstick for assessing near-term momentum, with BTC hovering near that level at the time of writing. A tightening of Bollinger Bands reinforces the notion that price action may be compressing into a more defined range, which often precedes a breakout or a sustained consolidation. In practical terms, a break above the upper band could portend a bullish continuation, while a break below the lower band would reaffirm downside risk in a bear-market context. These technical nuances are amplified by the price’s behavior around the $70,000 mark in late sessions, where a brief ascent gave way to a retracement as traders reassessed risk and liquidity conditions.
From a supply-demand perspective, the $62,500 threshold has proven notable. It withstood tests on three separate occasions, suggesting authentic support that buyers have targeted in a market characterized by fragile liquidity. The price’s ability to rebound from the $63,000s demonstrates that demand exists at specific price points, even as overall sentiment remains cautious. In tandem, momentum indicators—specifically RSI and stochastic—have started to exhibit bullish divergences, a pattern that traders often interpret as an early harbinger of stabilizing momentum. While these signals are encouraging at the margin, they are not a substitute for a decisive trend shift, especially as macro catalysts remain uncertain.
Beyond the price action, market mechanics play a central role in interpreting the recent bounce. Negative funding rates in derivatives markets have contributed to a squeeze dynamic, where crowded short positions were unwound as price rose from the mid-$60,000s. This type of price activity is not inherently indicative of a durable reversal; it reflects the intricacies of leverage and risk parity in a market that remains susceptible to rapid shifts. The absence of broad, structural inflows—particularly from institutional buyers—keeps the door open for renewed pressure should liquidity conditions deteriorate or if macro risk sentiment deteriorates further.
Looking ahead, the market will be watching for sustained price action that can convert tactical gains into a more persistent trend. Traders will evaluate whether the momentum divergences sustain themselves, whether ETF flow dynamics continue to provide relief to selling pressure, and whether any macro event can catalyze a more pronounced shift in risk appetite. In the meantime, market participants are likely to treat any move that reclaims or holds above the $68,000–$70,000 zone as a potential cue for cautious optimism, while remaining mindful of the longer-term bear-market framework that many analysts still cite as the prevailing context.


Key Takeaways
- The corporate entity Balancer Labs is ceasing operations following a November 2025 security breach that cost $110 million
- The protocol’s total value locked has plummeted 95% from its 2021 high of $3.5 billion to approximately $157 million
- BAL token emissions will cease entirely under a comprehensive restructuring initiative
- Protocol operations will transition to the Balancer Foundation and DAO, with all fees flowing to the treasury
- Token holders will have access to a buyback program offering fair exit opportunities
The corporate force behind one of decentralized finance’s prominent trading platforms is calling it quits.
Balancer Labs co-founder Fernando Martinelli revealed this week that the company responsible for developing and supporting the Balancer decentralized exchange is discontinuing operations. This decision comes in the wake of a November 2025 security incident that resulted in approximately $110 million in stolen digital assets — marking the third major security compromise in the platform’s operational history.
According to Martinelli, the security breach “introduced significant and persistent legal risks,” rendering continued operations untenable. In a governance forum post, he stated that Balancer Labs had transformed into “more of a burden than a benefit to the protocol’s long-term viability.”
CEO Marcus Hardt explained that the organization’s expenditures to incentivize liquidity far exceeded generated revenues. This imbalanced spending model was simultaneously eroding value for Balancer token stakeholders.
Balancer’s Dramatic Decline
During its zenith in late 2021, Balancer commanded nearly $3.5 billion in total value locked, positioning it as a foundational component of DeFi infrastructure alongside platforms like Aave, Uniswap, and Curve.
Today, that figure stands at just $157 million — representing a catastrophic 95% reduction. The project’s market capitalization has contracted to $10 million, with the token currently trading around $0.16, dramatically below its historical peak.
The November security incident accelerated this downward trajectory. Total value locked contracted by an additional $500 million during the two-week period immediately following the exploit.
Neverthstanding these setbacks, Martinelli noted the protocol continues generating over $1 million in fees across the most recent three-month period. While insufficient for current operational requirements, this revenue stream could sustain a more streamlined organization.
Proposed Restructuring Framework
Balancer Labs leadership has outlined a comprehensive transformation plan. BAL token emissions would be eliminated entirely, dismantling what Martinelli characterized as a “self-perpetuating incentive system that depletes more value than it creates.”
The existing veBAL governance framework would also be discontinued. Martinelli argued it had been “dominated” by meta-governance entities, compromising representative decision-making.
Protocol fee distribution would be restructured to channel 100% of revenue to the DAO treasury, up from the current 17.5% allocation. The v3 protocol share would decrease to 25% to encourage more sustainable liquidity provision.
A BAL token buyback initiative would provide holders with exit liquidity at reasonable valuations.
Key personnel from Balancer Labs would transition to a newly formed organization designated Balancer OpCo, contingent on governance approval. Martinelli plans to withdraw from any official capacity while remaining available for advisory support.
The product roadmap will consolidate around five core pool categories: reCLAMM pools, liquidity bootstrapping pools, stablecoin pools, weighted pools, and expansion to non-EVM blockchain networks.
The Balancer DAO has been presented with two governance proposals addressing the restructuring plan and tokenomics modifications.
BAL was trading at $0.72 on Tuesday morning.


Hostplus is reviewing whether to add crypto exposure to its investment menu after member interest in digital assets continued to grow.
Summary
- Hostplus is studying crypto access after members asked for digital assets in retirement portfolios.
- Any crypto option would likely launch through Choiceplus, pending approval and consumer protection checks.
- Growing SMSF crypto activity shows rising interest in digital assets among Australian retirement savers.
A Bloomberg report said the fund is considering a model that would give access through its Choiceplus option, though the plan still needs regulatory approval and further design work.
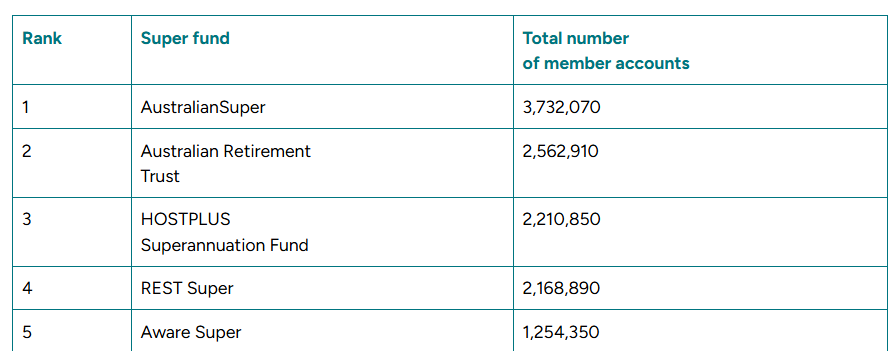
Hostplus is one of Australia’s largest super funds by member count. It has about 2.2 million members, and it ranks among the country’s biggest retirement funds by assets under management, according to Canstar.
Its chief investment officer, Sam Sicilia, said member requests helped keep the issue on the table. He said,
”There’s certainly a demand from some of our members who write in and say, ‘Why can’t I have access to cryptocurrency?’” according to Bloomberg.
Choiceplus could be the path for a launch
The report said any crypto access would likely sit inside Hostplus’ Choiceplus option. That part of the fund allows members to manage parts of their retirement savings more directly than standard investment options.
Sicilia said the offer could arrive as soon as the next financial year if the structure is approved. He also said, ”We’d love to get regulatory tick-off, even if it means waiting another six months,” showing the fund is willing to wait for formal clearance.
In addition, the proposal is still at an early stage. It would need regulatory approval before any launch, and the fund also needs to address consumer protection issues tied to crypto access in retirement products.
Australia’s superannuation market remains large and tightly watched by regulators. APRA said it supervises financial institutions with about A$10.1 trillion in assets, while industry reporting has placed total superannuation assets near A$4.5 trillion by late 2025.
Broader crypto interest is growing in retirement markets
Large super funds have moved slowly on direct crypto access, but some parts of the market have already taken steps. AMP introduced Bitcoin futures exposure in May 2024 as part of its investment approach, according to the report.
Self-managed super funds remain a major route for Australians who want crypto in retirement portfolios. BTC Markets said SMSF registrations on its platform rose 69% year over year in the 2024–2025 financial year, pointing to continued interest from retirement-focused investors.


A report by Reuters has added new attention to internal tensions at the US Securities and Exchange Commission after the resignation of its former enforcement chief.
Summary
- Report says Margaret Ryan faced resistance while pursuing cases involving Justin Sun and Elon Musk.
- SEC settled Justin Sun’s case as questions grew over the agency’s enforcement direction.
- Ryan resigned after reported clashes over Trump-linked cases and broader crypto enforcement decisions inside SEC.
The report said the disagreement centered on how the agency handled cases tied to people close to US President Donald Trump.
Margaret Ryan stepped down as director of the SEC’s Division of Enforcement on March 16. The agency confirmed her resignation that day and named Sam Waldon as acting director, but it did not give a reason for her exit.
The report said Ryan wanted to press ahead with fraud and other charges in matters involving people linked to Trump. It said SEC Chair Paul Atkins and other Republican appointees resisted that approach, which led to conflict inside the agency.
One point of tension involved crypto entrepreneur Justin Sun. The SEC sued Sun and three of his companies in March 2023, alleging unregistered securities sales and wash trading tied to Tronix and BitTorrent.
Earlier this month, the SEC moved to settle that case for $10 million. Sun and the companies did not admit or deny the allegations, and the court filing showed the agency planned to dismiss the claims once the settlement process is completed.
The matter drew more attention because of Sun’s financial ties to the Trump family’s crypto venture, World Liberty Financial. Public reporting said Sun bought $30 million of its tokens in November 2024 and later increased that position to $75 million in January 2025.
Musk lawsuit also added pressure
Another case involved Tesla chief executive Elon Musk. The SEC sued Musk in January 2025, claiming he failed to disclose on time that he had built a stake of more than 5% in Twitter in 2022, which let him keep buying shares at lower prices.
On March 17, the SEC and Musk said in a joint court filing that they were in talks to settle the lawsuit and asked for more time in the case. The filing suggested that further court action might not be needed if the talks succeed.
Ryan’s exit comes at a time when the SEC is already facing questions over its enforcement direction. The agency under Trump has dropped or settled several crypto-related cases that were started during Gary Gensler’s tenure.
The former top enforcement official at the U.S. Securities and Exchange Commission reportedly clashed with the regulator’s leadership before stepping down last week, with part of the friction tied to how cases connected to figures in Donald Trump’s orbit were pursued. Reuters, citing people familiar with the matter, reported that Margaret A. Ryan pressed to pursue fraud and related charges in probes involving individuals linked to Trump, but was resisted by SEC Chair Paul Atkins and other Republican appointees.
Ryan resigned on March 16 after just over six months in the role. An SEC announcement of her departure offered no public explanation for the resignation, leaving questions about the enforcement direction amid a political transition in Washington and shifting crypto-related priorities.
Two high-profile investigations cited as flashpoints involved crypto entrepreneur Justin Sun and Tesla CEO Elon Musk, both connected in various ways to Trump and the broader political landscape. The SEC’s case against Sun and three associated entities reached a settlement earlier this month, a development that underscored the friction points between aggressive enforcement and evolving regulatory guidance.
Key takeaways
- Ryan advocated for fraud charges in probes linked to Trump associates, but faced pushback from SEC leadership during a politically charged period.
- The Sun case and its settlement became a focal point of the disagreement within the agency’s enforcement ranks.
- The Musk case, filed in the final weeks of the previous chair’s term, remains under discussion as the parties pursue a potential settlement.
- The departures and legal sagas unfold amid heightened scrutiny from lawmakers and a broader debate about how crypto cases should be handled by the SEC.
Sun case tests enforcement priorities and crypto guidance
The Sun matter was among the enforcement actions that reportedly strained Ryan’s relationship with top officials. The SEC sued Justin Sun in March 2023, accusing him and three of his companies of selling unregistered securities and engaging in manipulative wash trading. The parties settled the lawsuit for $10 million, with Sun and the entities neither admitting nor denying the SEC’s allegations. The case has been cited as emblematic of the agency’s challenge in applying evolving crypto guidance to real-world actions.
Sun’s broader involvement in Trump-linked ventures heightened the political sensitivity of the matter. After stepping up his crypto investments around World Liberty Financial, Sun bought tokens valued at $30 million in November 2024 and increased his stake to a total of $75 million by January 2025, according to reports cited by Reuters. An SEC enforcement official told Reuters that the Sun case’s trajectory was complicated by shifting crypto guidance and pending crypto laws, and that Ryan supported the settlement, even though her signature did not appear on the court documents.
Tron, the company named in the Sun lawsuit, did not immediately respond to requests for comment. The firm has previously declined to comment on pending legal matters.
Musk dispute and ongoing settlement talks
The SEC’s action against Elon Musk, filed in the final week of former Chair Gary Gensler’s tenure, accused Musk of failing to disclose that he had acquired beneficial ownership of Twitter (now X) in early 2022, a staffing and disclosure issue the regulator argued violated securities rules. In a joint court filing dated March 17, the parties indicated ongoing settlement discussions, signaling potential resolution despite the ongoing litigation.
Lawyers familiar with the suits noted that both cases were historically seen as having strong prospects for the SEC if pursued to trial, illustrating the high-stakes nature of crypto-enforcement decisions in a climate of shifting political and regulatory currents.
Enforcement philosophy under political scrutiny
The corporate and crypto enforcement landscape has grown increasingly entangled with U.S. politics. Democratic lawmakers have scrutinized the SEC’s crypto stance, while coverage of the agency’s enforcement posture has highlighted tensions between a hard line on securities violations and a more tempered approach in certain high-profile cases under the prior administration. Observers point to a broader debate about how aggressively the SEC should pursue crypto assets and related activities as new guidance and laws continue to take shape.
The development comes as the agency navigates a transition in leadership and ongoing questions about how to balance investor protection with clarity for issuers, developers, and investors in the rapidly evolving digital asset space. Reuters noted that the leadership shakeup and the Sun and Musk cases sit at the center of these discussions, with lawmakers watching closely for signals about future enforcement priorities.
Earlier coverage from crypto press has highlighted lawmakers’ concerns about the SEC’s crypto interpretation and how enforcement aligns with the White House’s regulatory agenda, underscoring the risk of policy pivots affecting market participants and innovators alike.
As Ryan’s successor takes the reins, market observers will be watching the SEC’s next moves on crypto cases, transparency in charging decisions, and how political considerations might shape the agency’s willingness to pursue or settle high-profile actions.
What remains uncertain is how the agency will translate evolving crypto guidance into concrete actions going forward, and whether the ongoing settlement talks with Musk will set a new precedent for disclosure enforcement in the technology and internet-enabled asset space. Investors, traders, and builders should monitor potential shifts in enforcement style, the appointment of a new enforcement division leader, and any forthcoming crypto policy updates that could recalibrate risk and opportunity across the market.
Crypto World
South Korea Restricts Government Fuel Use While Hormuz Crisis Threatens Military and Market Stability
TLDR:
- South Korea limits government vehicles to six operating days weekly amid worsening Middle East oil supply disruptions.
- The KOSPI fell 4.9 percent Monday as the won weakened and inflation accelerated under growing fuel pressure.
- Six countries across three continents now ration fuel, marking a shift from developing to advanced economies.
- U.S. troops stationed in South Korea rely on the same disrupted Middle Eastern supply chain facing civilian restrictions.
South Korea has announced mandatory fuel rationing, restricting government vehicles from operating one day per week on a rotating license plate schedule.
The move places the world’s 10th largest economy alongside developing nations that have already imposed similar measures.
As the Strait of Hormuz remains closed, energy supply chains face mounting pressure across multiple continents.
Rationing Spreads Beyond Developing Economies
South Korea imports between 73 and 87 percent of its oil from the Middle East. Every barrel travels through the Strait of Hormuz before reaching Korean shores. With the strait closed and mined, no alternative route exists for crude imports at scale.
The KOSPI index dropped 4.9 percent on Monday before a social media post from former U.S. President Donald Trump temporarily eased market fears.
The South Korean won has also been weakening steadily. Inflation is accelerating alongside these currency pressures.
Analyst Shanaka Anslem Perera noted on social media that the rationing is “no longer a developing-world phenomenon” and is “migrating up the GDP ladder.”
Countries that have already implemented restrictions include Sri Lanka, Bangladesh, Pakistan, India, and Slovenia. Slovenia was the first EU member to introduce QR codes and odd-even plate systems.
South Korea joins that list as a G20 member and home to global semiconductor manufacturers Samsung and SK Hynix.
The country fabricates roughly a quarter of the world’s memory chips. That output now operates under the same energy strain affecting far smaller economies.
Military Readiness and Regional Stability Face Pressure
South Korea hosts 28,500 American troops across several U.S. Forces Korea bases. These operations require continuous supplies of diesel, aviation fuel, and generator capacity. Joint military exercises between U.S. and South Korean forces consume thousands of tonnes of fuel annually.
That fuel supply traces back to the same Middle Eastern supply chain now under civilian restriction. If civilian vehicles face rationing, military logistics are under comparable pressure. Reduced military logistics capacity could affect deterrence posture against North Korea along the DMZ.
Taiwan is also watching developments closely. TSMC fabrication plants in Hsinchu are reportedly counting liquefied natural gas reserves in single-digit days.
Taiwan imports nearly all of its energy, and its timeline may be shorter than South Korea’s given smaller strategic reserves.
The broader picture connects a closed maritime chokepoint to semiconductor output, military readiness, and currency stability across three continents. Sri Lanka, Bangladesh, Pakistan, India, Slovenia, and now South Korea have all imposed rationing measures.
One strait is driving policy decisions in six countries simultaneously. As Perera put it, “The molecules do not check GDP rankings. The molecules check whether the chokepoint is open.”


As the Iran war rages on, U.S. Treasury yields – the market’s gauge of borrowing costs – have surged to multi-month highs, pricing in delayed Fed rate cuts and higher inflation expectations.
The question is at what point the Treasury market, which underpins global finance, starts causing trouble for both the government and the economy, forcing the Trump administration to rethink the war or consider a mechanism to cap yields.
According to ING, that point comes when a little-known 10-year U.S. Treasury swap spread blows past 60 basis points. We are not there yet.
“Watch the 10-year swap spread. It’s just below 50bp now. If that were to shoot to 60bp, it would spell enough trouble to ultimately shape the war path. Why? It’s a measure of the de-rating of Treasuries. We need to steer clear of that. It’s not just the negative perception, it’s the added cost of funding U.S. debt,” Padhraic Garvey, CFA and regional head of research Americas at ING, said in a note to clients Friday.
Garvey emphasized that rising swap spreads aren’t just about perception; they increase the implied cost of funding for the U.S. government, making it more expensive for the heavily-indebted Uncle Sam to issue new bonds and borrow more. This could ripple through the financial system, tightening credit conditions and leading to risk aversion in both stocks and bitcoin .
“Narrow swap spreads are the good look. Wide swap spreads are the opposite,” he said.
Focus on the 10-year yield
Other observers are focused on the 10-year Treasury yield, the benchmark rate that sets borrowing costs across the U.S. economy, influencing risk-taking in both the economy and financial markets.
Since the Iran war began at the end of February, the yield has surged roughly 45 basis points to 4.37%.
According to The Kobeissi Letter, the 4.5%–4.6% range represents a critical “line in the sand.” That’s the level at which President Trump pulled back from his sweeping Liberation Day tariffs last April.
“This is in line with the rapid surge seen around ‘Liberation Day’ in April 2025. As the 10-year note yield surged above 4.50%, President Trump began floating a potential tariff pause. And, once the yield broke above 4.60%, he officially implemented a 90-day pause on reciprocal tariffs on April 9th, 2025,” the letter noted on X.
Put simply, the bond market could soon reach a point where the Trump administration feels pressured to temper the war.
On Tuesday, President Donald Trump paused attacks on Iranian infrastructure, claiming productive talks with Iran, though Iran denied having any contact. Meanwhile, early Wednesday, U.S. and Israeli forces reportedly struck new Iranian energy facilities, including a natural gas pipeline in Khorramshahr.
If the yield breaks the 4.5%–4.6% range, it could rise to 5%, the level analysts have flagged as a make-or-break point for risk assets in recent years.
According to The Kobeissi Letter, the U.S. economy cannot sustain a 5% level in the 10-year yield.
Arthur Hayes, co-founder of BitMEX and chief investment officer at Maelstrom Fund, has previously stated that a potential rise in the 10-year yield above 5% could trigger a mini-financial crisis, forcing the Fed to step in with liquidity injections.
In other words, bitcoin could initially drop in a knee-jerk reaction, but liquidity injections could quickly recharge bulls.
The takeaway is clear. bitcoin traders need to closely track Treasury yields and swap spreads, as shifts in these markets could directly influence risk appetite and policy decisions.
Crypto World
BitGo Launches MCP Server to Connect Institutional Crypto Infrastructure With AI Development Tools
TLDR:
- BitGo launched an MCP Server that connects its crypto infrastructure to AI-native development environments.
- Developers can use natural language to explore wallets, configure webhooks, and review transaction flows.
- The MCP Server supports tools like Claude Code, Cursor, VS Code, ChatGPT, and JetBrains IDEs.
- BitGo’s Developer Portal also features an Ask AI tool for direct, in-page documentation assistance.
BitGo has launched a Model Context Protocol (MCP) Server, connecting institutional crypto infrastructure to AI-native development tools.
The new capability allows developers to access BitGo’s platform resources through natural language. This move positions BitGo as an early adopter of AI-ready infrastructure in the digital asset space.
BitGo Opens Developer Resources Through Natural Language Access
The BitGo MCP Server gives developers direct access to documentation, API references, and product information. Compatible AI tools can now connect to BitGo’s Developer Portal and pull relevant context automatically. This reduces the time teams spend searching for technical guidance manually.
Developers can use natural-language prompts to explore wallet functionality and review transaction flows. They can also configure webhooks, understand staking documentation, and navigate policy features. These tasks previously required manual searches through the developer portal.
As shared on X, BitGo noted that “AI is changing how developers build,” adding that the platform is now ready for AI-native workflows. The company framed the MCP Server as a step toward making BitGo fully accessible within the AI economy.
MCP is an open standard that allows AI assistants to connect to external information sources. By adopting this standard, BitGo joins a growing list of infrastructure providers building for AI-driven development environments.
Compatible Tools and Platform Availability
The BitGo MCP Server is available now and works with several MCP-compatible clients. These include Claude Code, Claude Desktop, Cursor, ChatGPT, JetBrains IDEs, VS Code, and Windsurf. Developers can find setup instructions directly on the BitGo Developer Portal.
BitGo CEO and Co-founder Mike Belshe stated that developers can now treat BitGo as agentic infrastructure. He added that the MCP Server is only the first step in making the platform accessible to the broader AI economy.
Beyond the MCP Server, BitGo’s Developer Portal also features an Ask AI tool. This tool lets users ask questions directly within documentation pages without leaving their workflow. It offers another channel for developers to find guidance faster.
The combination of the MCP Server and the Ask AI tool reflects a broader shift in how developer platforms are evolving.
Platforms are moving toward conversational and AI-assisted access rather than traditional documentation browsing. BitGo’s approach aligns with this trend across the software development industry.

(Incentives that don’t kill your protocol long-term)
The DeFi boom brought us a tidal wave of liquidity mining programs. “Stake our token, earn our token” became the mantra, and for a while, it worked—liquidity poured in. But too often, these early experiments had a fatal flaw: they offered short-term rewards at the expense of long-term protocol health. Welcome to Liquidity Mining 2.0, where incentives are smarter, sustainable, and designed to grow both capital and community without burning the house down.
The Problem with “Free Token” Models
Early liquidity mining campaigns relied heavily on emission-driven rewards. Users were attracted by high yields, often several hundred percent APY, but there were hidden costs:
- Unsustainable inflation – New token issuance diluted existing holders, undermining token value.
- Hot money liquidity – Users chased yield without loyalty to the protocol. Once rewards dropped, liquidity evaporated.
- Governance and protocol risk – Tokens distributed too widely or too quickly sometimes gave control to opportunistic participants, not long-term stakeholders.
In short, free tokens often created a short-term spike, followed by a long-term crash.
Liquidity Mining 2.0: Principles of Sustainable Incentives
To avoid repeating past mistakes, DeFi projects are evolving their approach. Here are the core principles:
1. Reward Quality, Not Quantity
Instead of dumping tokens, protocols now reward actions that strengthen the ecosystem:
- Longer lock-up periods for stakers
- Providing liquidity to underrepresented pools
- Engaging in governance or community building
This ensures rewards are earned, not just grabbed.
2. Multi-Dimensional Incentives
Liquidity Mining 2.0 combines token rewards with non-monetary benefits:
- Exclusive governance privileges or voting power
- Access to premium features or lower fees
- Reputation systems that recognize long-term commitment
By diversifying incentives, protocols retain liquidity and encourage meaningful engagement.
3. Dynamic Emissions
Instead of a fixed APY, protocols now adjust rewards based on:
- Market conditions
- Pool health
- Token performance
Dynamic models prevent over-inflation while maintaining attractive yields for committed users.
4. Cross-Protocol Collaborations
Some projects now reward users for supporting multiple parts of the ecosystem. For example, providing liquidity on one protocol may earn rewards on another, creating network effects and reducing reliance on a single token for incentives.
5. Vesting and Lock-ups
Time-based vesting ensures that rewards are earned over the long term, reducing the likelihood of a massive sell-off right after farming.
Examples of Protocols Doing It Right
- PIVX – incentivizes masternodes and governance participation instead of high-speed token drops.
- Curve Finance – rewards users based on the stability of liquidity provided, favoring sustainable pools.
- OlympusDAO – uses bonding and staking mechanisms to align incentives with long-term treasury health.
These models show that thoughtful design can maintain high liquidity without tanking the protocol’s token economics.
Moving Forward
Liquidity Mining 2.0 isn’t just a tweak; it’s a mindset shift. Protocols must ask: Are we rewarding participation that grows the ecosystem, or are we just chasing TVL for short-term optics?
The next generation of DeFi projects will combine smart financial incentives with community-aligned strategies, creating ecosystems that are resilient, loyal, and sustainable.
Because in the long run, free tokens may attract wallets, but sustainable incentives attract believers.
REQUEST AN ARTICLE


Stablecoin issuer Circle has urged the European Commission to lower the barrier for institutions to engage with crypto-asset service providers in response to parts of its proposed Market Integration Package — a broad policy initiative aimed at strengthening capital markets in Europe.
In a statement on Monday, Circle said the Commission’s MIP proposals represent a “meaningful step toward a digitally enabled financial system” but also outlined several areas for improvement.
Those included reforming the DLT (distributed ledger technology) Pilot Regime and scaling what the Commission describes as e-money tokens (EMTs) by permitting more crypto-asset service providers to operate. Circle said it submitted its feedback to the Commission on March 20.
The main piece of crypto legislation in Europe is the Markets in Crypto-Assets Regulation, which took effect in December 2024.
However, it has been widely criticized by some crypto lawyers, including Yuriy Brisov, partner at Digital & Analogue Partners, who argued it is difficult to interpret and that its implementation varies from country to country.
Circle said the Commission’s MIP could offer Europe-based crypto market participants more legal clarity by outlining what crypto-assets can be used as collateral.
Circle recommended lowering the barrier to entry for e-money tokens to be used in settlement by changing the market capitalization threshold under the Central Securities Depositories Regulation.
“Restricting settlement to ‘significant’ EMTs risks excluding euro-denominated EMTs” and creates a “chicken-and-egg scenario that stifles their growth,” Circle said, adding that the thresholds are a “structural barrier to institutional participation and secondary market liquidity.”
Circle seeking to expand EURC in the region
In addition to Circle’s flagship USDC (USDC) stablecoin, the company also offers a euro-backed, MiCA-compliant stablecoin, EURC (EURC), in Europe.
However, Circle noted that no euro-denominated EMT is close to reaching the market cap threshold.
Circle said the Commission should adopt more “adaptive thresholds” that are based on criteria like market uptake and liquidity conditions while conducting supervisory assessments.
Related: ECB opens digital euro work on ATMs and payment terminals
The company also said the DLT Pilot Regime, as currently proposed, restricts cash accounts to credit institutions and central securities depository financial institutions and that it should be expanded to include crypto-asset service providers.
Circle concluded that the MIP “represents a pivotal moment” for the EU to modernize its financial system and that connecting traditional finance with blockchain infrastructure through “clear and proportionate regulation” would unlock new levels of efficiency and liquidity in the region.
Magazine: Clarity Act risks repeat of Europe’s mistakes, crypto lawyer warns
Hostplus, Australia’s third-largest pension fund by member count, is reportedly considering offering cryptocurrencies as an investment option, citing interest from its members in the asset class.
“There’s certainly a demand from some of our members who write in and say, ‘Why can’t I have access to cryptocurrency?’” Sam Sicilia, the fund’s chief investment officer, told Bloomberg on Monday.
Investment offerings in crypto could be available as soon as next financial year, he said, with Bitcoin and other digital assets offered through its ChoicePlus investment option, which allows people to self-manage their retirement savings portfolio.
The plan is still in its design phase and would require regulatory approval, as well as resolution of a range of other issues, such as consumer protections before it could go live.
Hostplus is the third-largest retirement fund (known locally as a super fund) in Australia by member count and the fifth-largest by assets under management at over $96 billion ($139 billion Australian dollars), according to financial comparison site Canstar.
Australia’s total superannuation assets were estimated to be worth around $4.5 trillion Australian dollars by the end of the September 2025 quarter.
“We’d love to get regulatory tick-off, even if it means waiting another six months,” Sicilia told Bloomberg. “We are long-term investors. Six months doesn’t really move the dial for us.”

Super fund members asking for access to crypto
AMP was the first super fund to embrace crypto in May 2024, when it introduced exposure to Bitcoin via Bitcoin futures contracts as part of its investment strategy.
Sicilia told Bloomberg that crypto has evolved significantly since Hostplus first looked at the industry a decade ago.
Related: Ripple targets April for Australian financial license via acquisition
Self‑Managed Super Funds (SMSFs) are currently the main way Australians gain exposure to crypto for retirement savings. SMSFs are retirement funds set up and managed by individuals, rather than conventional funds managed by large institutions on behalf of members.
Australian crypto exchange BTC Markets reported in its Investor Study Report that SMSF registrations increased 69% year-on-year during the 2024–2025 financial year.
OKX Australia CEO Kate Cooper told Cointelegraph in February that a significant area of growth for the exchange has come from SMSF trustees, with a growing number of funds set up specifically so trustees can invest in digital assets, “because they currently can’t invest via the big super funds.”
Magazine: Banks want to run Vietnam’s crypto exchanges, Boyaa’s $70M BTC plan: Asia Express

Companies House disciplines 132 staff over compliance breaches in three years
Balancer Labs Closes Operations Following Devastating $110M Hack

Alan Ritchson’s Beatdown Of His Neighbor Takes New Turn Amid Viral Clip


-
 Crypto World3 days ago
NIO (NIO) Stock Plunges 6.5% as Shelf Registration Sparks Dilution Worries
-

 Fashion4 days ago
Weekend Open Thread: Adidas – Corporette.com
-

 Politics4 days ago
Jenni Murray, Long-Serving Woman’s Hour Presenter, Dies Aged 75
-
 Tech7 days ago
Are Split Spacebars the Next Big Gaming Keyboard Trend?
-

 Crypto World2 days ago
Best Crypto to Buy Now: Strategy Just Spent $1.57 Billion on Bitcoin During Fear While Early Investors Quietly Enter Pepeto for 150x Potential
-

 News Videos6 days ago
RBA board divided on rate cut, unusually buoyant share market | Finance Report | ABC NEWS
-

 Crypto World2 days ago
Bitcoin Price News: Bhutan Sells $72 Million in BTC Under Fiscal Pressure, but the Smart Money Entering Pepeto Sees What the Market Does Not
-

 Politics6 days ago
The House | The new register to protect children from their abusers shows Parliament at its best
-

 Tech4 days ago
inKONBINI Lets You Spend Summer Days Behind the Register
-
 Politics7 days ago
Real-time pollution monitoring calls after boy nearly dies
-

 Crypto World6 days ago
Canada’s FINTRAC revokes registrations of 23 crypto MSBs in AML crackdown
-

 Sports20 hours ago
Remo Stars and Kano Pillars Strengthen Survival Hopes in NPFL
-
 NewsBeat5 days ago
Residents in North Lanarkshire reminded to register to vote in Scottish Parliament Election
-

 News Videos6 days ago
PARLIAMENT OF MALAWI – PAC MEETING WITH REGISTRAR OF FINANCIAL ON AMARYLLIS HOTEL – INQUIRY LIVE
-

 Politics5 days ago
Gender equality discussions at UN face pushbacks and US resistance
-

 Business2 days ago
No Winner in March 21 Drawing as Prize Rolls to $133 Million for Next
-

 Business5 days ago
Who Was Alex Pretti? 5 Key Facts About the ICU Nurse Killed by Federal Agents in Minneapolis
-

 Sports19 hours ago
Gary Kirsten Accuses Pakistan Cricket Board Of ‘Interference’, Mohsin Naqvi Responds
-

 Tech1 day ago
Give Your Phone a Huge (and Free) Upgrade by Switching to Another Keyboard
-

 Sports4 days ago
2026 Kentucky Derby horses, odds, futures, preview, date: Expert who nailed 12 Derby-Oaks Doubles enters picks
You must be logged in to post a comment Login