
Crypto World
Bitcoin Undervalued vs Gold: Analyst Signals Rally Ahead

Bitcoin (CRYPTO: BTC) is widely cited as undervalued when measured against traditional stores of value like gold and the broad money supply, according to Samson Mow, the chief executive of Bitcoin technology firm Jan3. In a Saturday post on X, Mow argued that BTC sits roughly 24% to 66% below its trend relative to gold’s market cap or the level of global liquidity, while gold itself appears overextended. The claim adds a contrarian note to ongoing debates about whether crypto markets have found a bottom or are simply pausing before another leg lower or higher.
At the same time, macro price benchmarks paint a mixed picture. Gold futures for April delivery closed at $5,247.90, while tokenized gold offering PAX Gold USD was trading around $5,404.14 as of the time of writing. Against that backdrop, Mow pointed to Bitcoin’s Z-score—a metric that gauges how closely BTC’s current price tracks its long-run average relative to a benchmark, in this case the BTC-to-gold ratio. A Z-score of 0 means the price aligns with the historical average; negative values signal the asset trading below that average.
The Z-score for the BTC-to-gold ratio was around -1.24 at press time, suggesting BTC remains below its historical mean but not by the extreme margins seen in past episodes. Data from TradingView shows that the indicator has swung widely in the past, including moments when the ratio dipped far beneath the norm. In November 2022, for instance, the BTC-to-gold Z-score briefly plunged below -3, a period coinciding with the FTX collapse and a subsequent rally in BTC of more than 150% over the following 12 months.
This history of decisive rebounds after deep dislocations is echoed by earlier cycles. During the Covid crisis in March 2020, the Z-score dipped below -2 and BTC bottomed near $3,717, only to surge more than 300% in the ensuing year, culminating in a then-astronomical peak in November 2021 of around $69,000. Those patterns have led some analysts to draw parallels with today, while others caution that the macro and regulatory landscape has evolved, potentially altering how these signals play out in real time.
While Mow highlights potential upside based on valuation gaps and historical Z-score triggers, others in the market remain wary. A cross-section of analysts has projected further downside for BTC as investor sentiment wavers in the face of geopolitical tension and persistent macro uncertainty. Some believe the market could test lower levels, with discussions framing a possible move toward new lows for the current cycle. Yet even within this more cautious camp, the same data points used by Mow—value signals and on-chain momentum—are often cited as important clues for the next meaningful directional shift.
For context, the broader crypto narrative has included crosscurrents—from tailwinds such as institutional interest and macro liquidity to headwinds like regulatory risk and episodic liquidity squeezes. The focal point for many observers remains Bitcoin’s role as a potential hedge or as a risk-on asset depending on the moment, as well as how it weathers macro shocks and liquidity cycles. The weekend’s developments in the Middle East added another layer of geopolitical risk, underscoring that crypto markets, like traditional markets, are not insulated from global events.
As the debate about BTC’s trajectory evolves, the market is reminded of past cycles where valuation gaps and extreme sentiment extremes have preceded sharp reversals. The question remains whether the current price near the mid-to-high $60,000s will reflect a duration that negates those earlier patterns or whether a more persistent risk-off mood will push Bitcoin toward the lower end of the spectrum before new catalysts emerge.
In sum, while the price action continues to oscillate near current levels, the ongoing discussion about BTC’s fair value relative to gold and the money supply—augmented by Z-score analysis—provides a framework for assessing potential turning points. The next few weeks could test the resilience of the current range, particularly if the BTC-to-gold ratio reverts toward its historic mean or if macro developments reassert their dominance over market sentiment.
The Z-score framework has shown that when BTC-to-gold moves extend beyond historical norms, corrections or rallies often follow in subsequent months. The current reading around -1.24 keeps the door open to a test of higher ground if support holds and risk appetite returns.
Bitcoin to crash to $50,000?
The contrarian view presented here sits against a broader chorus of analysts who warn that more downside could be on the horizon, driven by ongoing investor caution and geopolitical tensions. Several observers have flagged the possibility of BTC tracing a path toward the $50,000 mark, arguing that price action could mirror or exceed prior bear-market patterns as macro data and regulatory signals unfold. By contrast, those who emphasize valuation and historical precedents point to the same indicators that historically preceded significant rallies following sharp declines, suggesting that a bottom could be forming even as volatility remains elevated.
The ongoing debate about BTC’s bottoming process is not just about price—it touches on liquidity dynamics, risk sentiment, and the durability of crypto-specific catalysts such as on-chain activity, mining economics, and institutional participation. As BTC hovers in a range, traders will likely scrutinize key technical levels, the pace of liquidity inflows, and how macro shocks translate into risk-on or risk-off moves across crypto markets.
Ultimately, the discussion centers on how investors interpret valuation signals in the context of a still-fragile macro environment and evolving regulatory expectations. While some forecasts call for a dramatic re-rating, others argue that a sustainable recovery could emerge as confidence builds and fundamentals align with price action. The next leg of this narrative will be shaped by the balance between speculative momentum and real-world utility that continues to define the crypto market’s longer-term trajectory.
Why it matters
Valuation-driven arguments like Mow’s underscore a broader point: crypto markets are not merely driven by narratives or hype but by measurable relationships to broader financial assets. If Bitcoin’s price starts to close the gap with gold and money supply on a sustained basis, it would alter the risk-reward calculus for both retail and institutional participants, potentially reshaping portfolio allocations and hedging strategies.
Moreover, the BTC-to-gold comparison frames how crypto assets are perceived in the context of traditional stores of value. A shift back toward historical norms in this ratio could signal renewed appetite for crypto as a non-sovereign store of value or a diversification vehicle, even as gold remains a familiar anchor for risk management. These dynamics matter not only for traders but also for developers, miners, and fund managers evaluating how crypto markets fit into broader exposure targets.
From a market structure perspective, such signals also influence liquidity flows, cross-asset correlations, and the pace at which crypto products—like ETFs and exchange-based investment vehicles—can attract new money. In an environment where macro volatility is a persistent feature, signals that imply potential volatility compression or expansion will be watched closely by participants seeking to calibrate risk and reward.
What to watch next
- Monitor BTC price action relative to the -2 and -3 Z-score thresholds for BTC-to-gold, noting whether the ratio reverts toward the mean or diverges further.
- Track the BTC-to-gold ratio on TradingView for signs of momentum shifts that align with macro liquidity trends or risk-on/off sentiment shifts.
- Watch macro indicators and regulatory updates that affect crypto liquidity and investor confidence, especially in regions with active policy debates.
- Observe major price drivers such as exchange capital flows, mining economics, and the pace of adoption in institutional and retail channels.
Sources & verification
- Samson Mow, X post discussing Bitcoin valuation relative to gold and global money supply (link provided in original coverage).
- TradingView data for the BTC-to-gold ratio (BTCXAU) used to illustrate the Z-score dynamics.
- Historical references to the FTX collapse and subsequent BTC rally from Cointelegraph coverage.
- Cointelegraph reporting on the Covid-era price dynamics and BTC’s subsequent rally to multi-year highs.
- Link to tokenized Gold price (PAX Gold USD) cited in the market context of gold price benchmarks.
Bitcoin valuation signals and potential reversal
Bitcoin (CRYPTO: BTC) sits at a crossroads flagged by valuation comparisons and a momentum metric that has historically preceded meaningful moves. Samson Mow’s main contention is that BTC is notably undervalued relative to gold’s market cap and the broader money supply—an assessment grounded in quantitative gaps rather than pure sentiment. Specifically, he points to a calibration where Bitcoin’s current level is roughly 24% to 66% below its trend line when juxtaposed with gold’s market capitalization or the extent of global liquidity. By contrast, gold, a traditional hedge, is described as overextended in this framing.
The argument leans heavily on the BTC-to-gold Z-score, a gauge of how far the price of BTC deviates from its long-run average when measured against gold. At the moment, the Z-score hovers around -1.24, indicating BTC is below its historical mean but not in territory that has inexorably presaged a parabolic rally. In the past, however, the same metric has signaled powerful reversals: during November 2022, the ratio’s Z-score dipped beneath -3, a backdrop that preceded a roughly 150% advance in BTC over the following year as traders digested the FTX collapse and the broader liquidity environment.
Historical analogies are a recurring feature of crypto markets, and the Covid-19 period is often cited in tandem with the Z-score narrative. In March 2020, the metric slipped below -2 and BTC carved a bottom near $3,717 before staging a multi-hundred percent recovery in the subsequent 12 months, culminating in the 2021 rally that took prices to the vicinity of $69,000. Those episodes illustrate how valuation gaps paired with macro stress can coincide with outsized upside if demand returns and risk appetite stabilizes.
Yet the current cycle carries its own wrinkles. Some analysts project further downside as investors absorb macro uncertainty and geopolitical tensions, with price targets that contemplate a move toward the $50,000 area. Others maintain that the combination of a reversion toward historical norms in BTC’s valuation relative to gold and a renewed willingness to allocate capital to crypto assets could spark a fresh leg higher. The truth likely lies somewhere in between, shaped by how swiftly liquidity conditions normalize, how regulation evolves, and how much on-chain activity confirms sustained network utility.
The price backdrop remains fluid, with BTC trading in the mid- to high-$60,000s and a broader market environment that still rewards resilience and clear catalysts. If the underlying relationships continue to align with past cycles—valuation gaps closing, risk sentiment shifting, and liquidity improving—the potential for a renewed price impulse cannot be discounted. Conversely, if macro headwinds intensify or regulatory constraints tighten, the path could tilt toward range-bound behavior or further corrections. Investors should remain vigilant for shifts in the balance of fear and opportunity that have historically driven crypto volatility.


Key Highlights
- Intel shares have soared 220% over twelve months, reaching $70.32—the highest price in twenty-five years
- New CEO Lip-Bu Tan slashed over 20,000 positions and restored positive free cash flow during the latter half of 2025
- Nvidia committed $5 billion to Intel’s operations; partnerships include Alphabet and Elon Musk’s Terafab initiative
- First quarter 2026 financial results arrive April 23—elevated expectations may trigger price swings
- A single analyst projects shares could reach $150 by 2029 if margin expansion and profit growth materialize
Intel’s recent performance represents one of the semiconductor industry’s most striking comebacks. After touching a multi-year bottom near $18 in June 2025, shares rocketed to $70.32—a twenty-five-year peak—with a remarkable 58% spike compressed into just nine trading sessions. Many investors are now questioning whether the opportunity has passed or if upside remains.
The transformation narrative revolves primarily around Lip-Bu Tan, who assumed the CEO role in March 2025. A veteran venture capitalist with expertise in corporate turnarounds, Tan previously guided Cadence Design Systems to a staggering 3,200% appreciation during his twelve-year tenure. Upon joining Intel, he acted decisively. Workforce reductions exceeded 20,000 employees while capital expenditures were trimmed. Free cash flow, which had posted a combined negative $44 billion drain from 2022 through 2025, finally turned positive in the second half of the previous year.
Intel’s product portfolio has gained fresh momentum as well. The chipmaker unveiled its Core Series 3 mobile processors utilizing the advanced 18A manufacturing process, designed to handle routine AI workloads while extending battery performance for consumer laptops.
Strategic AI Collaborations Mark New Direction
Intel’s strategy extends beyond expense reduction—it’s mounting a serious challenge in the artificial intelligence sector. The firm has forged partnerships with Alphabet focusing on AI capabilities and cloud computing infrastructure. Additionally, Intel is collaborating with Elon Musk on “Terafab,” a semiconductor manufacturing joint venture connecting SpaceX and Tesla.
Then comes Nvidia. Last September, Nvidia poured $5 billion into Intel to manufacture specialized x86 server processors designed to work seamlessly with Nvidia’s graphics processing units. Ben Reitzes, analyst at Melius Research, stated bluntly: “The demand for the x86 server CPU has gone through the roof at hyperscalers. The x86 became an AI chip.”
This represents a fundamental transformation in market perception regarding Intel’s position within AI infrastructure.
Yet the dramatic rally has pushed valuation metrics into stretched territory. Intel currently commands approximately 95 times projected earnings—surpassing valuations for Nvidia, Taiwan Semiconductor, Broadcom, and AMD. Gross profit margins hover below 40%, contrasting sharply with Taiwan Semi’s 55% and Nvidia’s 75%.
Production Efficiency Presents Ongoing Challenge
A significant portion of the margin disadvantage stems from manufacturing capabilities. Intel currently farms out roughly 30% of its wafer production to Taiwan Semiconductor while expanding internal fabrication capacity. Yield rates on its cutting-edge manufacturing process are estimated around 70%, compared to Taiwan Semi’s 90%.
Should these yields climb as the technology matures, profitability margins would likely follow suit. Analyst Reitzes forecasts Intel could generate $7 in earnings per share by 2029. Applying a standard semiconductor industry multiple of 22 times forward earnings produces a theoretical price target of $150.
Wall Street sentiment remains measured. Roughly one in five analysts tracking Intel maintains a Buy recommendation, significantly trailing the S&P 500 average of 55%. The consensus target price stands at $51.25—markedly below current trading levels.
Institutional money managers are quietly building positions. ZEGA Investments established a fresh stake during Q4. Executive Vice President David Zinsner purchased approximately $250,000 in shares this past January.
Intel will announce Q1 2026 results on April 23.


Key Takeaways
- Amazon shares reached $250.56, sitting just 1.4% beneath the record closing high of $254.
- The e-commerce giant’s stock has climbed 20% during April, finishing higher in nine out of the past 10 trading days.
- Truist Securities lifted its target to $285, forecasting 25% AWS revenue expansion in Q1.
- TD Cowen analyst John Blackledge maintained his Buy stance with a $300 target price.
- Amazon announced plans to purchase Globalstar for approximately $12 billion and partnered with Apple on satellite services.
Amazon has been building impressive momentum over recent weeks. Shares concluded Friday’s session at $250.56 — the highest closing price since November 3, 2025 — leaving the stock within striking distance of its all-time record close of $254, just 1.4% away.
The upward trajectory has been consistent and methodical. AMZN shares have finished in positive territory for nine of the last ten trading sessions, accumulating a remarkable 20% gain throughout April. For the year, the stock has advanced approximately 8.6%.
As Amazon prepares to report Q1 results on April 29, investor focus has intensified. Wall Street analysts are projecting earnings per share of $1.63 — a slight uptick from the $1.59 posted in the same period last year — alongside total revenue of approximately $177 billion, marking roughly 14% year-over-year expansion.
Truist Securities analyst Youssef Squali upgraded his price objective Friday to $285 from $280, reaffirming his Buy recommendation. His forecast anticipates AWS revenue climbing 25% in Q1, representing an acceleration from the 23% growth achieved in Q4 2024, fueled by expanding AI collaborations with companies including OpenAI and Anthropic.
Squali further projects North America marketplace revenue will expand approximately 10% compared to last year, characterizing economic pressures such as elevated fuel prices as “manageable” assuming they remain temporary.
Financial commentator Jim Cramer offered his perspective over the weekend, labeling Amazon “ascendant” while drawing a sharp contrast with Microsoft, which he characterized as becoming viewed as a “chronic underperformer.” Cramer positioned Amazon as the superior investment choice currently, citing its growth momentum against Microsoft’s decelerating revenue trends.
Wall Street Eyes $300 Price Level
John Blackledge from TD Cowen, recognized as a 5-star analyst, reaffirmed his Buy recommendation alongside a $300 price objective — representing approximately 20% potential upside from Friday’s closing price. His projections suggest Q1 revenue will marginally exceed consensus estimates, with operating income tracking roughly 4% ahead of expectations.
Blackledge highlights high-margin advertising revenue and AWS as primary profit catalysts, supplemented by ongoing improvements in fulfillment operations.
Looking toward Q2 2026, his revenue forecast sits 1.5% above Street consensus while his operating income estimate runs 5% higher — indicating expectations for continued AWS growth acceleration.
Across Wall Street, Amazon commands a Strong Buy consensus rating derived from 42 Buy recommendations and only 3 Hold ratings. The average analyst price target registers at $284.77, suggesting approximately 14% upside potential from present levels.
During Q4 2025, AWS delivered 24% year-over-year revenue growth. CEO Andy Jassy characterized this performance as the division’s “fastest growth in 13 quarters” — a metric that analysts are incorporating heavily into their Q1 projections.
Amazon Enters Satellite Communications Market
Beyond the upcoming earnings report, Amazon executed a significant strategic transaction this week. Tuesday brought the announcement of an agreement to purchase Globalstar at an equivalent price of $90 per share — establishing a valuation approaching $12 billion for the satellite communications company.
This acquisition positions Amazon to develop its own space-based internet infrastructure, challenging the market dominance currently held by Elon Musk’s Starlink operation.
Additionally, Amazon finalized an arrangement with Apple to deliver satellite connectivity capabilities for existing and upcoming iPhone and Apple Watch products. This partnership leveraged a pre-existing Globalstar relationship that Apple had previously established.
The consensus Wall Street price target of $284.77 implies approximately 14% potential appreciation from AMZN’s latest closing price of $250.56.

Key Takeaways
- Oklo (OKLO) shares climbed 30% this week alongside NuScale Power (SMR), which also gained over 30%
- White House issued new directives to accelerate nuclear power development for space exploration
- Goals include an orbital reactor demonstration by December 2028 and a lunar-based system by 2030
- Oklo announced a significant board restructuring, bringing in four new directors with nuclear sector expertise
- The company recently missed earnings expectations while insiders sold more than $50M in shares over three months
Oklo experienced a breakout week as shares of the small modular reactor developer surged 30% across five consecutive trading sessions. The rally was fueled by favorable policy developments, industry-wide momentum, and internal governance changes.
The primary driver? New White House directives released this week focused on accelerating nuclear power technology for space applications. The roadmap establishes an orbital reactor demonstration target of December 2028, with a lunar surface reactor planned for 2030.
NuScale Power (SMR) experienced a parallel surge, climbing more than 30% during the same timeframe. Nano Nuclear Energy (NNE) advanced approximately 20%, while uranium miner Uranium Energy (UEC) posted gains of roughly 10%.
The nuclear energy sector has experienced sustained upward momentum, with consecutive positive sessions attracting significant investor interest.
Space Nuclear Initiative Sparks Market Enthusiasm
The White House directive provides investors with concrete milestones. The establishment of a 2028 orbital demonstration and 2030 lunar reactor creates specific timeframes for potential contract awards and supply chain development.
Andrew Chanin, co-founder and CEO of ProcureAM, explained to Yahoo Finance that dependable power sources are essential for space infrastructure. “Lunar bases, orbiting space stations, orbiting data centers — all these require energy,” he noted.
The sector’s momentum also benefited from NASA’s successful Artemis II lunar flyby mission, which concluded earlier this month and maintained space exploration in the investment spotlight.
Oklo simultaneously announced a board overhaul this week, appointing four new directors with nuclear engineering and industrial expertise. The company designated a Lead Independent Director and transitioned its CTO to a senior technical advisory position. Market participants interpreted these moves as signals of increased operational focus.
Underlying Financials Present Challenges
Despite the stock’s impressive run, the company’s financial performance reveals ongoing challenges.
Oklo fell short of its latest quarterly expectations, reporting a per-share loss of $0.27 versus analyst projections of -$0.17. Wall Street currently anticipates a full-year EPS of -$8.20.
Recent insider transactions have drawn attention. CEO Jacob DeWitte disposed of 140,000 shares in February at $75.18 per share, totaling approximately $10.5 million. CFO Richard Bealmear sold 72,090 shares in March at $60 per share. Collectively, insiders have sold over $50.8 million in stock during the past 90 days.
Among institutional investors, Sumitomo Mitsui Trust Group established a new stake in Q4, acquiring 222,510 shares valued at roughly $15.97 million. Institutional ownership now represents approximately 85% of outstanding shares.
Wall Street analysts remain divided. Citigroup reduced its price objective from $95 to $73.50 while maintaining a neutral stance. Canaccord Genuity lowered its target from $175 to $125 but retained a buy rating. The consensus rating stands at “Moderate Buy” with an average price target of $84.30.
OKLO began trading Friday at $66.92, within its 52-week range of $19.89 to $193.84.
Crypto World
Solana (SOL) Surges Past Ethereum in Transaction Volume as Network Adds 1.5M Monthly Users

Key Highlights
- SOL rallied 10% over a five-day period, reaching its highest level in three weeks on Friday
- Open interest in futures contracts increased from $3.5B to $4.2B within seven days
- The token has lagged behind the wider cryptocurrency market by 13% year-to-date in 2026
- The Solana network has attracted 1.5 million additional daily active users each month during Q1
- Several Solana-based memecoins surged over 40% from Wednesday through Friday
The price of Solana’s SOL token experienced a 10% increase across a five-day trading window, touching a three-week peak on Friday. This upward momentum followed announcements from the United States and Iran regarding an extended ceasefire agreement, which triggered an 8% decline in Brent crude oil valuations and boosted risk appetite throughout cryptocurrency markets.
Currently, SOL is changing hands in the $84–$85 range, with market participants monitoring whether the psychological $100 threshold represents the next significant price objective.
The aggregate open interest across SOL futures contracts expanded from $3.5 billion last Sunday to $4.2 billion by Friday—representing a 20% increase within a single week. This expansion signals heightened engagement from leveraged market participants spanning both institutional investors and retail traders.
However, despite this upward price action, the annualized funding rate for SOL perpetual futures contracts remains at approximately 3%. This figure falls short of the 5–10% neutral bandwidth, suggesting that bullish traders have yet to demonstrate overwhelming confidence. Nevertheless, it represents a substantial improvement from the extreme pessimism witnessed on April 7, when SOL traded beneath the $80 level.
Throughout 2026, SOL has delivered returns 13% below those of the broader cryptocurrency market. Reduced activity across decentralized applications (DApps) built on the network has contributed to this underperformance.
Weekly revenue generated by DApps on the Solana blockchain currently hovers around $16 million, representing a decline from previous peaks. To provide perspective, Ethereum-based DApps generated $10 million in revenue last week, while BNB Chain DApps produced $4 million—indicating that diminished DApp revenue represents an industry-wide phenomenon rather than a Solana-specific challenge.
Memecoin Trading Volume Accelerates
Numerous memecoins operating on the Solana blockchain recorded gains exceeding 40% during the Wednesday-to-Friday trading window. Historically, increased memecoin trading activity has correlated positively with SOL price appreciation, especially following the early 2025 memecoin boom that positioned Solana as the dominant platform for user engagement after the Official Trump memecoin deployment.
Solana maintains its leadership position in decentralized exchange (DEX) trading volume and currently ranks as the second-largest blockchain by Total Value Locked across all networks.
The Solana blockchain processed approximately 9 billion transactions during the previous month, significantly outpacing Ethereum’s 69 million transactions. Cumulatively, Solana has now settled over 500 billion transactions compared to Ethereum’s 3 billion. Its architectural design prioritizing speed, minimal fees, and high throughput positions it favorably for applications in gaming, trading platforms, and financial service offerings.
Additionally, Solana has established a stablecoin settlement collaboration with Visa, securing its presence within the developing blockchain-based payments sector.
Network User Base Expands Steadily
Throughout the previous quarter, the Solana ecosystem successfully onboarded 1.5 million new daily active users each month. This growth trajectory persisted even as SOL’s market price declined from $293 to approximately $83 during the period of heightened Middle East geopolitical tensions.
Data from prediction markets showed the April 16 price target of $110 trading at 100% YES probability, while the April 30 target of $150 remains active with approximately 15% implied probability. Trading volume within these prediction markets remains limited, meaning the probability estimates could experience rapid shifts following any substantial order flow.
As of Friday’s trading session, SOL was valued around $85, with total open interest standing at $4.2 billion as memecoin trading activity continues to generate upward momentum in futures market demand.
Key Takeaways
- California federal court dismissed securities fraud lawsuit targeting Caitlyn Jenner’s JENNER memecoin
- Token failed to satisfy Howey Test criteria required for security classification
- British investor Lee Greenfield reported losses exceeding $40,000 from token purchases
- Court determined absence of “common enterprise” among token purchasers
- Non-federal claims under California law transferred to state court jurisdiction
A federal court has delivered a legal victory to Caitlyn Jenner by dismissing a class-action lawsuit alleging her JENNER memecoin constituted an unregistered security.
A federal judge ruled Caitlyn Jenner’s $JENNER memecoin is not a security, dismissing a class action lawsuit from a buyer who lost $40K.
The court found the token failed the Howey Test’s “common enterprise” requirement. pic.twitter.com/UGQUs2YYzo
— Token Metrics (@tokenmetricsinc) April 17, 2026
The decision came Thursday from California federal judge Stanley Blumenfeld Jr., who determined the plaintiffs failed to demonstrate that the JENNER token satisfied the legal criteria for a security.
At the heart of the case was the Howey Test, a legal framework established by a 1946 Supreme Court decision. This test requires an investment contract to include capital invested in a collective venture with profit expectations derived from the efforts of others.
Judge Blumenfeld concluded that the token failed to satisfy two of the three Howey Test components. Specifically, he found insufficient evidence establishing a “common enterprise” linking JENNER token purchasers.
The primary plaintiff, Lee Greenfield from the United Kingdom, claimed losses surpassing $40,000 from purchasing the token across both Solana and Ethereum networks during May 2024.
Greenfield’s legal team contended that Jenner exploited her fame to promote the token. The filing cited an X platform post featuring an AI-created image depicting Jenner wearing a “JENNER ETH” shirt, used to market the cryptocurrency to potential buyers.
The initial legal action was brought in November 2024 against both Jenner and her manager Sophia Hutchins. Hutchins passed away in July 2025.
The revised complaint claimed investors had collectively pooled their resources based on Jenner’s promise that a 3% transaction fee would finance token repurchases, promotional activities, political donations to Donald Trump’s campaign, and fractional ownership shares in her Olympic gold medal.
Court Rejects Common Enterprise Claim
Judge Blumenfeld dismissed the pooling theory presented by plaintiffs. His ruling stated the allegations failed to establish that investors had agreed to share profits and losses or combine resources beyond the simple act of purchasing the cryptocurrency.
The Olympic medal ownership initiative was revealed in August 2024, occurring after Greenfield had already completed his token purchases, and ultimately never materialized.
The court further determined that Jenner’s promotional efforts alone were insufficient to constitute a common enterprise under securities law.
JENNER Token History
The JENNER token debuted on the Solana blockchain in May 2024 via the Pump.fun platform. Controversy erupted immediately when Jenner and other celebrity endorsers alleged they had been defrauded by a partner identified as Sahil Arora.
Jenner subsequently relaunched the token on the Ethereum network. Investors asserted this migration negatively impacted the original Solana version’s market value.
The cryptocurrency reached its peak market capitalization of approximately $7.5 million in June 2024. Since then, its value has collapsed, losing virtually all market worth.
Case Outcome and Future Proceedings
The court rejected the plaintiff’s motion to file a third amended version of their complaint. Claims based on California state law regarding contract violations and fraud were transferred to state court for potential further proceedings.

Key Highlights
- Shares of Boeing advanced more than 2% Friday following announcements that CH-47 Chinook helicopters will receive drone swarm deployment capabilities.
- A contract worth approximately $324M from the U.S. Army for Chinook helicopters strengthened Boeing’s defense order book.
- Millennium Space Systems and Boeing introduced a mid-class satellite platform with plans for approximately 26 units in 2026.
- Oak Harvest Investment Services expanded its Boeing position by 44.5% during Q4, bringing holdings to 28,933 shares valued at approximately $6.28M.
- Analysts maintain a “Moderate Buy” rating on BA stock with a consensus price target of $252.48.
Friday proved eventful for Boeing as shares gained more than 2% following several significant announcements across its defense and aerospace divisions.
The primary catalyst came from revelations that the CH-47 Chinook helicopter platform will receive substantial capability enhancements. Boeing is integrating what it describes as “launched effects” technology into the Chinook fleet — an umbrella term encompassing drones, electronic decoys, and loitering munitions. These capabilities can be deployed from both piloted and autonomous aircraft platforms.
The Chinook platform has maintained operational relevance for over 60 years and continues generating new orders. This technological enhancement aims to extend its strategic value. Reports indicate the U.S. Army has expressed substantial interest in these enhanced vertical-launch capabilities.
That interest translates into tangible financial commitments. The Army recently granted Boeing a contract valued at approximately $324 million for Chinook helicopters, bolstering the company’s defense sector pipeline. However, the program faces some uncertainty — congressional members have questioned the CH-47F Block II program’s trajectory, prompting Boeing to advocate for firmer Army commitments.
New Satellite Platform Unveiled
In aerospace developments, Boeing partnered with its Millennium Space Systems division to reveal a mid-class satellite platform designed for the “micro GEO” segment. The platform serves both defense and commercial markets, combining Boeing’s payload technology with Millennium’s accelerated manufacturing capabilities.
The initiative targets delivery of approximately 26 satellites throughout 2026. Boeing has been aggressively pursuing this market segment, and Millennium’s rapid production methodology provides competitive advantages as communications satellite demand accelerates.
Boeing’s most recent quarterly results exceeded market expectations considerably. The aerospace giant reported Q4 earnings per share of $9.92, substantially surpassing the consensus forecast of -$0.40. Quarterly revenue reached $23.95 billion — representing 57.1% year-over-year growth and exceeding the $22.41 billion analyst projection.
Despite the exceptional quarterly performance, Wall Street forecasts remain cautious with a projected -$2.58 EPS for the full fiscal year, creating a complex earnings outlook as the company approaches its April 22 Q1 earnings release.
On the manufacturing front, Boeing continues ramping workforce additions, hiring between 100 and 140 factory employees weekly to accelerate 737 MAX production and populate a newly established assembly line.
Institutional Activity Intensifies
Institutional stakeholders control 64.82% of Boeing’s outstanding shares. Oak Harvest Investment Services increased its position by 44.5% in the fourth quarter, elevating holdings to 28,933 shares with an approximate value of $6.28 million. Multiple additional institutional investors similarly expanded their Boeing allocations during Q3.
This institutional accumulation coincides with some insider divestment. Executive Vice President Howard McKenzie divested 10,497 shares in February at $233.99 each, while Senior Vice President Ann Schmidt sold 6,281 shares at $243.37. Collectively, company insiders have sold 21,012 shares totaling approximately $4.98 million over the past 90 days.
Boeing commenced Friday trading at $223.17. The stock’s 52-week trading range extends from $156.47 to $254.35. The 50-day moving average currently stands at $219.27.
Wall Street price targets span from the $252.48 consensus to $290.00 from Tigress Financial, which maintains a Buy rating. Susquehanna established a $280 target with a “positive” outlook, while Royal Bank of Canada elevated its target to $275 with an “outperform” designation.
Additionally, El Al expanded its 787 Dreamliner order by six aircraft this week, contributing incremental demand to Boeing’s widebody production backlog.
Key Highlights
- Russia’s dominant financial institution, Sberbank, has completed technical preparations to launch digital asset custody and trading platforms for its massive customer base of 110 million users, awaiting only regulatory clearance.
- Retail investors without qualified status will face annual purchase restrictions of approximately $4,000 in cryptocurrency transactions under proposed legislation.
- Privacy-oriented digital currencies including Monero, Zcash, and Dash face complete prohibition within the upcoming regulatory structure.
- The financial institution has already ventured into crypto-collateralized lending, providing a loan to mining operation Intelion last December with plans for program expansion.
- Russian authorities target June for finalizing comprehensive cryptocurrency regulations, with enforcement scheduled to begin July 1, 2027.
The dominant player in Russia’s banking sector is positioning itself to make a significant entrance into the digital asset industry, awaiting only regulatory authorization to begin providing cryptocurrency trading and custody solutions to its client base.
Russia’s Largest Bank Sberbank Prepares for Crypto Trading Rollout
According to TASS, Sberbank is ready to offer cryptocurrency trading services once regulation and organized exchange trading are introduced, Senior Vice President Ruslan Vesterovsky said at a Moscow Exchange… pic.twitter.com/CJxKym0lBx
— Wu Blockchain (@WuBlockchain) April 19, 2026
With a customer base exceeding 110 million retail clients, Sberbank operates under majority state ownership. According to bank officials, the necessary technological framework has been established and is operational. The institution stands ready to deploy margin trading capabilities, artificial intelligence-driven investment tools, and robust custody solutions immediately upon regulatory confirmation.
The announcement came from Senior Vice President Ruslan Vesterovsky during the Moscow Exchange forum. Vesterovsky stated that the bank anticipates organized exchange trading will deliver enhanced liquidity and competitive pricing to the marketplace. He emphasized the institution’s readiness to act swiftly once structured trading regulations receive approval.
While Russia’s Central Bank continues to designate cryptocurrencies as elevated-risk instruments, it has authorized restricted deployment of digital assets within certain financial operations. Sberbank’s current cryptocurrency initiatives demonstrate the institution is already functioning within the boundaries of existing permissions.
Last December, Sberbank extended one of Russia’s inaugural crypto-collateralized loans to Intelion, a cryptocurrency mining enterprise. Intelion operates over 300 megawatts of electrical capacity and maintains approximately 1,500 client relationships. Subsequently, Sberbank revealed intentions to extend comparable financing arrangements to additional corporations.
Framework Details for Cryptocurrency Trading
Russian legislative bodies are advancing toward completing a comprehensive digital asset regulatory structure by June. Should the timeline proceed as planned, implementation would commence on July 1, 2027.
The proposed framework would permit both certified and non-certified investors to participate in cryptocurrency purchases and sales. Non-certified investors would encounter annual acquisition caps of approximately 300,000 rubles, equivalent to roughly $3,934. Additionally, these investors must successfully complete a competency evaluation before gaining trading authorization.
Certified investors would operate without volume constraints, though mandatory risk evaluation procedures would remain required.
The approved asset roster is anticipated to encompass Bitcoin and Ethereum. However, the central banking authority strictly prohibits digital currency usage for domestic commercial transactions within Russian borders.
Prohibited Digital Assets
Anonymity-enhanced cryptocurrencies face total exclusion from both investor classifications. The proposed regulatory framework bans Monero, Zcash, and Dash completely, citing anti-money laundering protocols as justification.
The legislation additionally establishes sanctions for unauthorized intermediary operations within the cryptocurrency sector. These sanctions mirror existing penalties applied to unlicensed banking activities, providing licensed institutions such as Sberbank with enhanced legal clarity.
The regulatory approach establishes a two-tier classification system separating retail and certified investors. This framework design minimizes exposure for general investors while permitting greater latitude for sophisticated market participants.
Sberbank’s cryptocurrency market participation depends directly on the completion of regulatory guidelines drafted in December. The financial institution has already broadened its crypto-backed lending operations and continues developing its platform infrastructure to accommodate additional corporate clients.
Russian cryptocurrency regulation is projected to reach finalization by June, with comprehensive implementation targeted for mid-2027.
Crypto World
Why Marvell (MRVL) Stock Surged 55% YTD: Nvidia Partnership and AI Chip Demand Fuel Rally

Key Takeaways
- Shares of MRVL have climbed 55% since the start of the year and 168% over the trailing twelve months, fueled by AI data center infrastructure demand.
- On March 31, Nvidia made a $2 billion private placement investment in Marvell, establishing a strategic collaboration centered on NVLink Fusion technology.
- The semiconductor company closed two major acquisitions: $540 million for XConn Technologies and $1 billion for Celestial AI to strengthen AI interconnect capabilities.
- Marvell generated $1.5 billion from custom silicon sales in Fiscal 2026, with leadership targeting this segment to comprise at least 25% of total data center revenues.
- Management projects data center networking revenue will exceed $600 million in Fiscal 2027, representing a doubling from the prior fiscal year.
Marvell Technology has delivered exceptional performance throughout 2025 and into 2026. Shares have rallied over 55% year-to-date and posted gains of 168% across the past year. April proved particularly explosive, with MRVL climbing more than 50% during the month alone.
Marvell Technology, Inc., MRVL
Such extraordinary price action stems from a series of tangible business catalysts rather than speculation.
The March 31 announcement that Nvidia would invest $2 billion in Marvell via private placement marked a watershed moment. Alongside the capital infusion, the companies forged a strategic alliance to expand Nvidia’s NVLink Fusion infrastructure and collaborate on semi-customized AI solutions. The partnership solidifies Marvell’s position as a critical design collaborator within Nvidia’s expanding ecosystem.
Wall Street responded enthusiastically. Oppenheimer lifted its price objective for MRVL to $170 post-announcement. Barclays took an even more bullish stance, elevating the stock from Equal Weight to Overweight while raising its target from $105 to $150, highlighting momentum in Marvell’s optical components and port technologies.
Jim Cramer offered his perspective on the stock’s trajectory, describing Marvell as among the data center plays that “was good and then became unbelievable.” He highlighted CEO Matt Murphy’s prescient stock acquisitions around the $70 level and the company’s strategic purchase of optical assets at attractive valuations as catalysts behind the surge.
Custom Silicon Segment Generates Substantial Revenue Growth
Hyperscale cloud providers are pivoting from off-the-shelf GPUs toward application-specific custom silicon optimized for AI inference tasks. Marvell has emerged as a leading beneficiary of this architectural shift.
During Fiscal 2026, which concluded in January 2026, custom silicon operations delivered $1.5 billion in revenue. Company executives have established a target for this division to account for no less than 25% of aggregate data center sales moving forward. Marvell asserts that custom accelerators provide total cost of ownership advantages exceeding 40% compared to traditional GPU solutions, driving rapid customer adoption.
The firm has secured custom accelerator design partnerships with every major cloud infrastructure provider. Internal projections indicate that shipment volumes of custom accelerators will surpass GPU units by 2028.
To accelerate innovation in this domain, Marvell finalized a $1 billion all-cash acquisition of Celestial AI, which specializes in AI interconnect technology development.
Data Center Networking on Track to Double
Marvell’s data center networking operations are experiencing robust expansion. This segment generated over $300 million during Fiscal 2026. Leadership has provided guidance calling for networking revenue to surpass $600 million in Fiscal 2027.
The recently completed $540 million acquisition of XConn Technologies plays a central role in this growth trajectory. Marvell’s Structera S 60260 switching platforms now deliver double the lane density relative to rival offerings.
Demand for the company’s retimer products remains particularly strong. Alaska PCIe retimers from Marvell have become standard components in hyperscale server deployments. Management forecasts that combined revenue from retimers and active electrical cables will double during Fiscal 2027.
Consensus price targets from 27 Wall Street analysts currently average $126.12, suggesting approximately 9.7% downside from present trading levels.
The capital from Nvidia’s investment will support research and development initiatives at the 3nm and 5nm process nodes, where Marvell plans to manufacture its next-generation custom silicon portfolio.
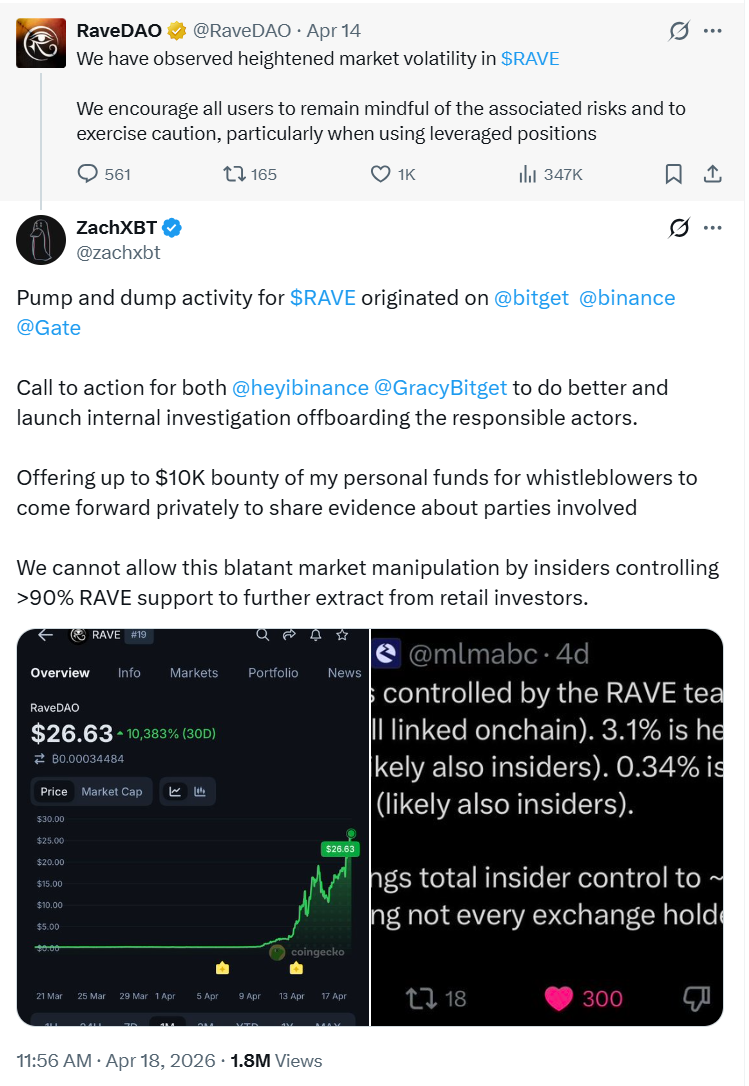
RaveDAO has denied any role in the recent surge and sharp collapse of its RAVE token, as major crypto exchanges open probes into trading activity following allegations of market manipulation.
In a thread posted on X, the project said it was “not engaged in, nor responsible for, recent price action,” responding to mounting scrutiny after RAVE soared from roughly $0.25 to nearly $28 within days before plunging more than 80%.
The denial comes as onchain investigator ZachXBT accused the project of orchestrating a pump-and-dump scheme, pointing to concentrated token holdings and suspicious exchange flows. He claimed that more than 90% of the token supply may be controlled by insiders, calling on exchanges to take action.

Both Binance and Bitget confirmed they are reviewing the situation. “We’re looking into it,” Binance CEO Richard Teng wrote, while Bitget CEO Gracy Chen said the exchange had “started investigating” RAVE trading activity.
Related: Study finds almost no crypto protocols disclose market-maker terms
RaveDAO plans token sales to fund growth
RaveDAO also outlined plans to sell portions of unlocked tokens to fund operations, marketing and hiring. The team said it is exploring “price-triggered or performance-triggered locks” to better align incentives.
“Building a movement requires resources,” the project wrote, adding it aims to do so “sustainably and transparently.”
RaveDAO is a Web3-based entertainment project that combines electronic music events with blockchain technology, aiming to onboard users into crypto through real-world experiences like festivals and parties. It operates as a decentralized community where attendees receive NFTs for participation, while its RAVE token is used for governance, ticketing and access to events.
At the time of writing, RAVE is trading at $1.36, down by 94.95% over the past day, according to data from CoinMarketCap.
Related: Stablecoins behave like FX markets as liquidity splits: Eco CEO
DeFi hacks surge in April
As Cointelegraph reported, more than a dozen DeFi protocols and crypto firms have been hit by exploits in just over two weeks, starting with the massive $280 million Drift Protocol attack on April 1.
Other affected projects include CoW Swap, Hyperbridge, Bybit, Silo Finance, Aethir and Rhea Finance, along with exchanges and liquidity pools across multiple chains. The attacks range from smart contract bugs and oracle manipulation to access control failures and liquidity pool exploits.
Magazine: Bitcoin may take 7 years to upgrade to post-quantum — BIP-360 co-author

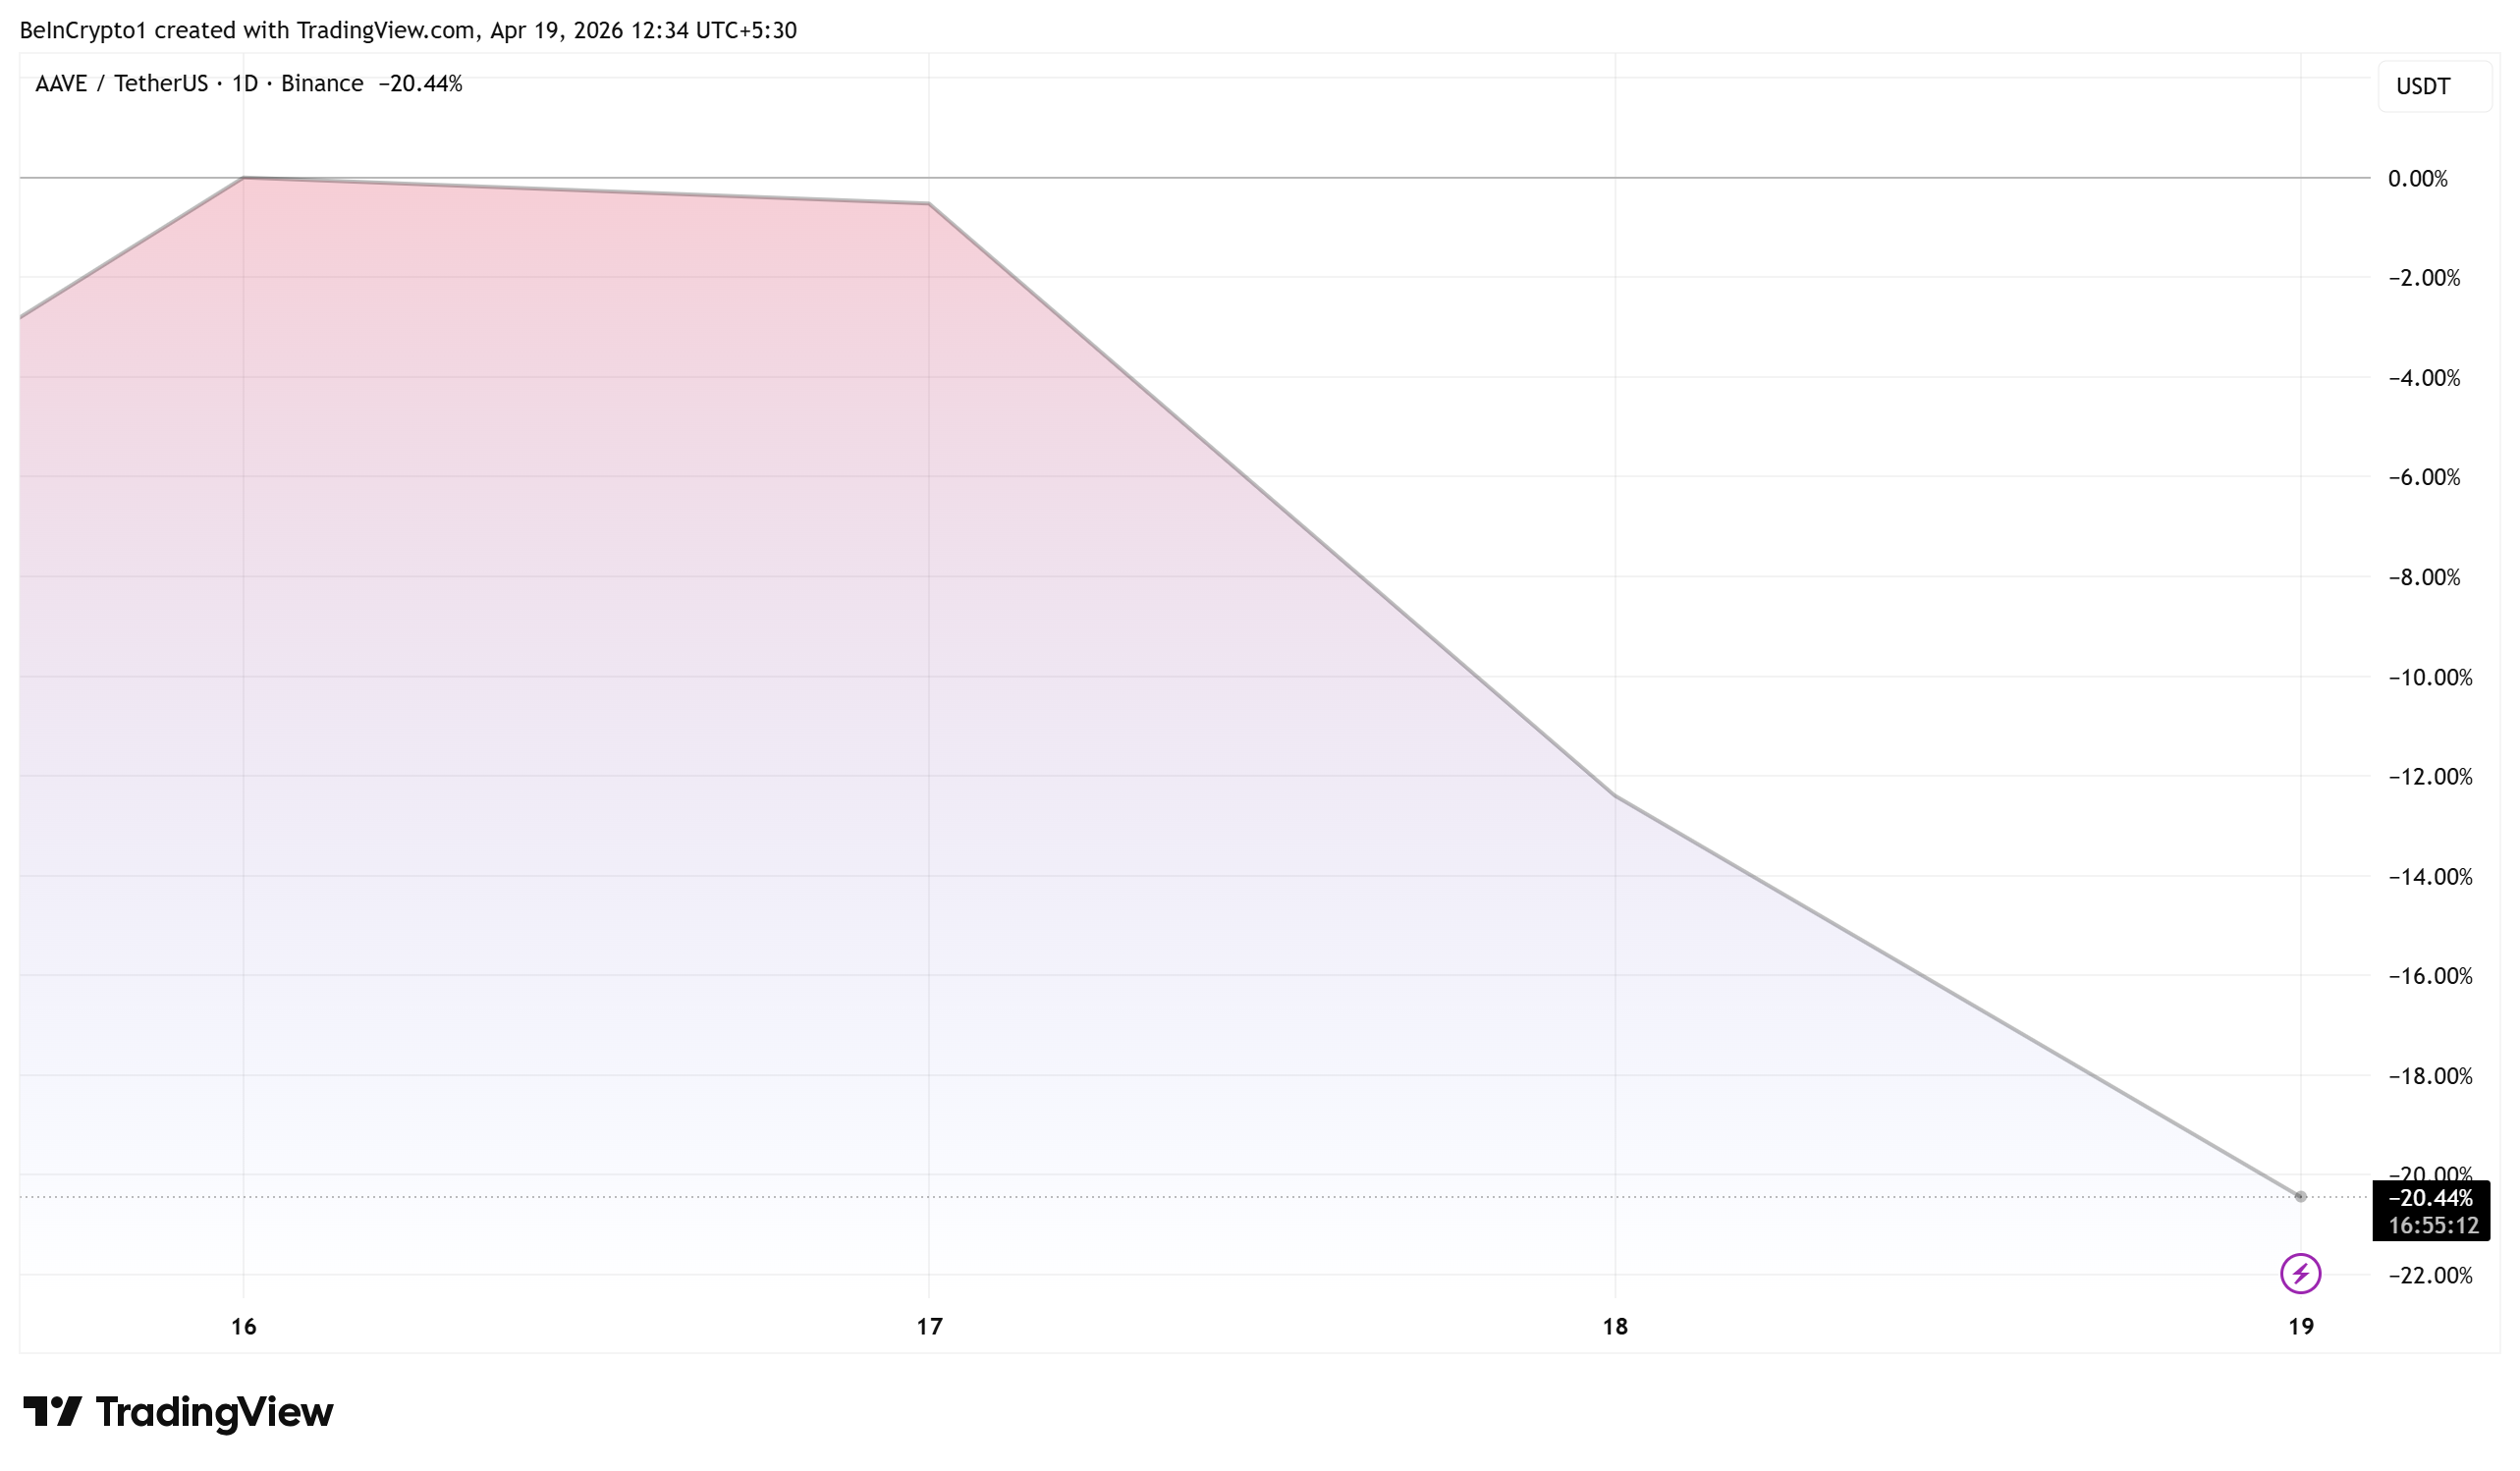
Aave (AAVE) fell over 20% on April 19 after the KelpDAO rsETH exploit triggered a wave of whale selling and a record spike in ETH utilization across the lending protocol.
The token dropped from roughly $115 to below $92 in hours as large holders rushed to exit positions. Aave’s ETH pool hit 100% utilization, effectively locking remaining depositors out of withdrawals.
Whales Offload Millions in AAVE
As of this writing, AAVE was trading for $91.89, down by 20.44% in the last 24 hours. With this, the altcoin has retested levels last seen on April 13.
On-chain data tracked by Lookonchain showed three major wallets selling AAVE within hours of the exploit becoming public.
- A wallet identified as smaugvision sold 20,015 AAVE for 2.06 million USDC at an average of $103 per token.
- A second whale at address 0xFC56 offloaded another 20,000 AAVE for 2.05 million USDC at the same average.
- A third wallet, 0xA2E4, sold 19,666 AAVE worth $1.95 million, converting the proceeds into 505.65 ETH and 10.11 WBTC at a lower $99 average.
Combined, the three wallets dumped nearly 60,000 AAVE tokens worth over $6 million.
$5.4 Billion ETH Exodus
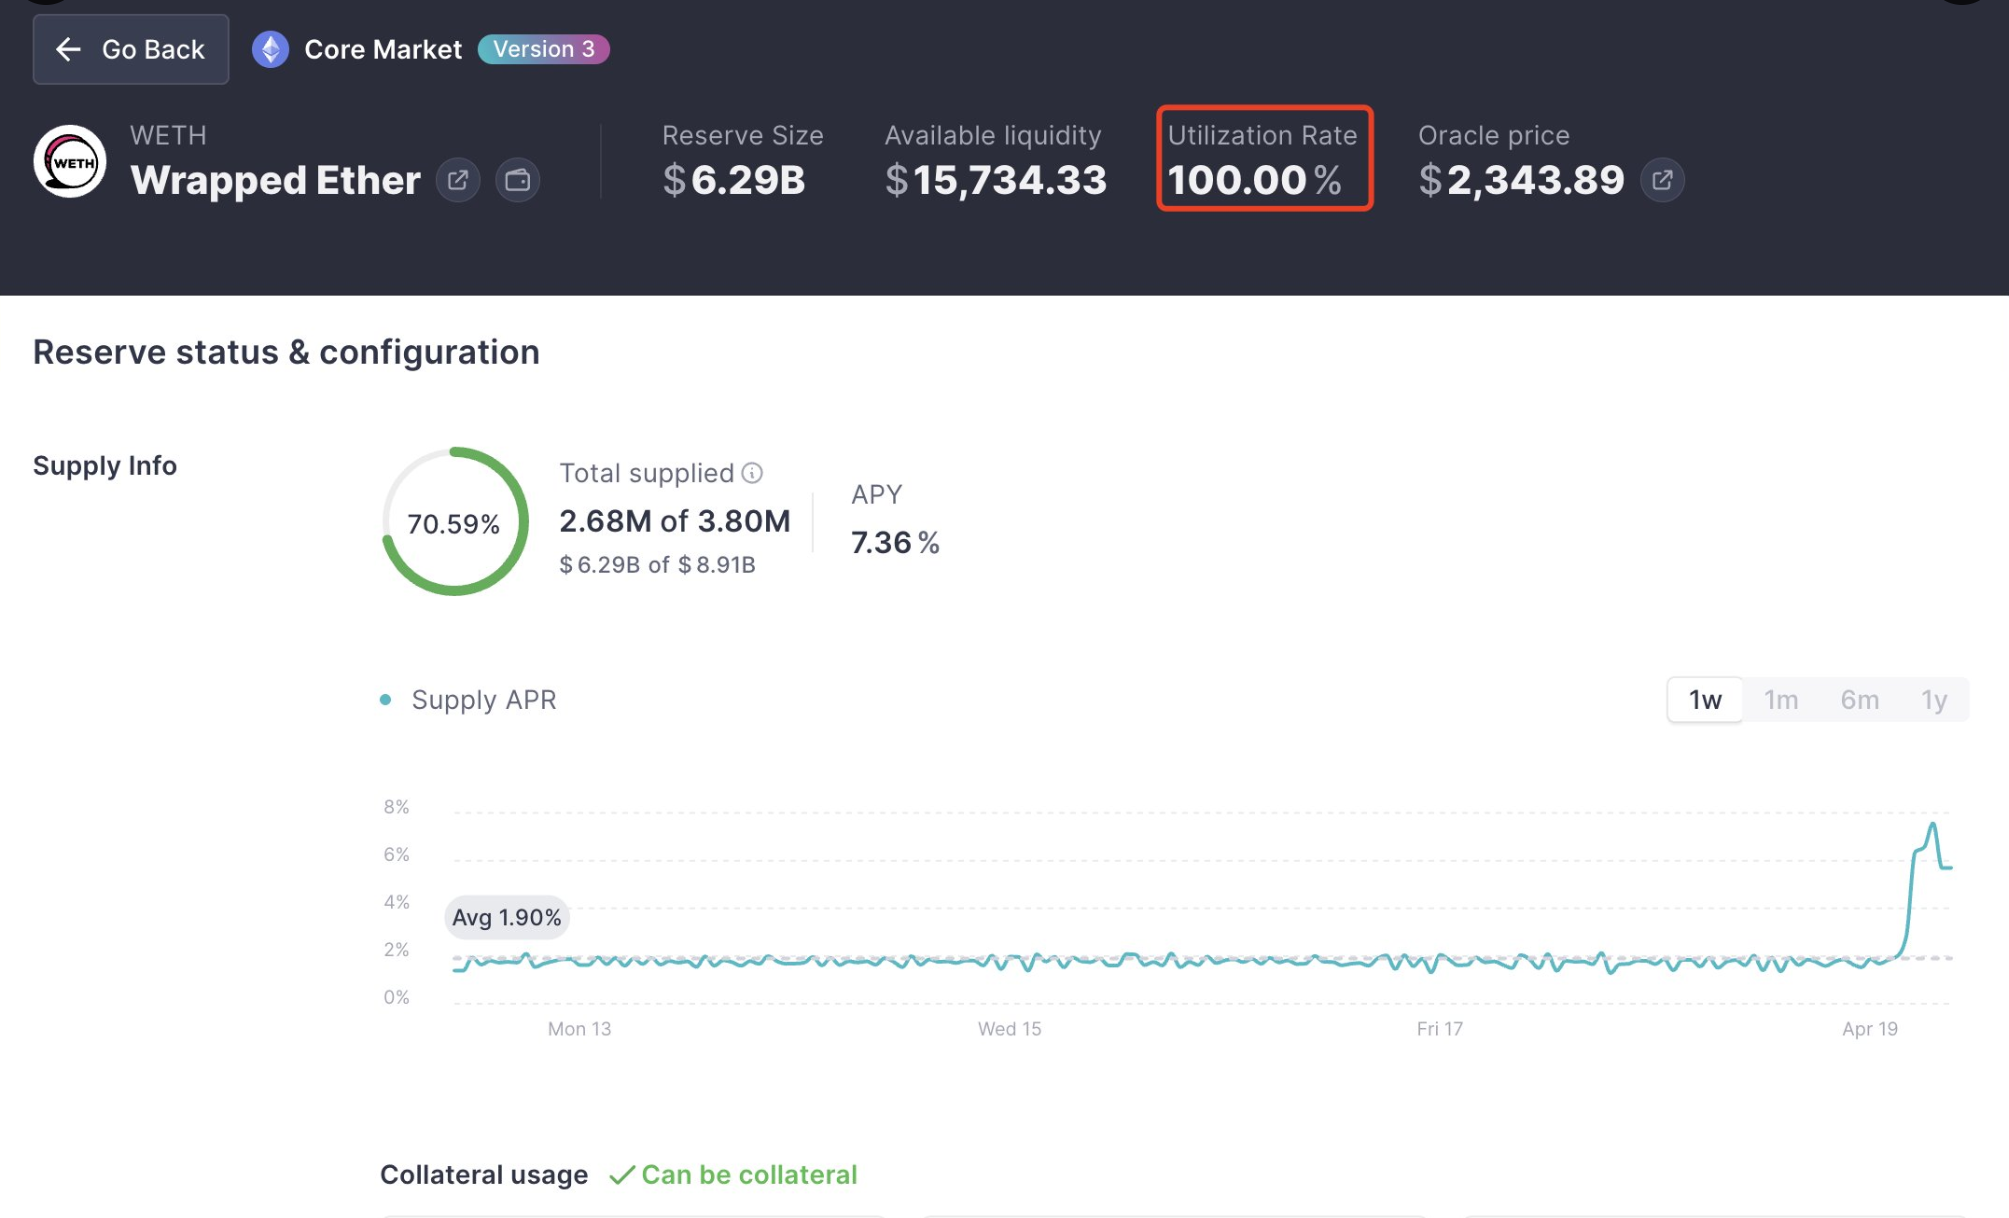
Beyond the AAVE sell-off, suppliers began pulling ether (ETH) from Aave at scale. Over $5.4 billion in ETH reportedly left the protocol within hours.
Tron founder Justin Sun withdrew 65,584 ETH worth approximately $154 million, adding to the liquidity drain.
The mass withdrawal pushed Aave’s ETH utilization rate to 100%, meaning the pool had no remaining liquidity for new withdrawals.
Borrowing rates are expected to spike sharply as the protocol’s interest rate curve penalizes high utilization.
Whether Aave’s Umbrella backstop and the rsETH market freeze can stabilize confidence remains the central question for depositors still locked in the pool.
Aave Says Impact Limited to V3 ETH Market
Aave told BeInCrypto that the situation is contained to the V3 ETH market only, with V4 completely unaffected.
“On Aave’s side, the situation is contained to the V3 ETH market only. V4 is completely unaffected,” the Aave team said in an email shared exclusively with BeInCrypto.
The team said it moved quickly with precautionary measures, freezing the rsETH reserve, removing its borrowing power, and temporarily reducing the loan-to-value ratio on ETH to zero.
Stablecoin reserves and all other assets are operating normally with no exposure to the event.
The post Whales Dump Over $6 Million in AAVE as KelpDAO Exploit Triggers 20% Aave Price Drop appeared first on BeInCrypto.
Intel (INTC) Stock Soars 220% to 25-Year Peak Under New Leadership

Noble Yeats death: Tributes paid to former Grand National winner after death aged 11
‘I’ve met all the senior royals and two things about Andrew made him different’


-
 NewsBeat6 days ago
Pep Guardiola and Gary Neville agree over Arsenal title problem that benefits Man City
-

 Crypto World6 days ago
The SEC Conditionalises DeFi Platforms to Be Avoided for Broker Registration
-

 Fashion2 days ago
Weekend Open Thread: Theodora Dress
-

 Politics7 days ago
World Cup exit makes Italy enter crisis mode
-

 Crypto World5 days ago
SEC Signals Exemption for Crypto Interfaces From Broker Registration
-

 News Videos4 days ago
Secure crypto trading starts with an FIU-registered
-

 Sports2 days ago
NWFL Suspends Two Players Over Post-Match Clash in Ado-Ekiti
-

 Crypto World5 days ago
SEC Proposes Certain Crypto Interfaces Don’t Need to Register as Brokers
-

 NewsBeat5 days ago
Trump and Pope Leo: Behind their disagreement over Iran war
-

 Politics1 day ago
Palestine barred from entering Canada for FIFA Congress
-

 Crypto World1 day ago
Russia Pushes Bill to Criminalize Unregistered Crypto Services
-

 Sports6 days ago
NWFL opens Pathway for new Clubs ahead of 2026 Season
-

 Crypto World6 days ago
Trump whales load up ahead of Mar-a-Lago luncheon.
-
 Business2 days ago
Creo Medical agree sale of its manufacturing operation
-
Business6 days ago
Kering slides after Morgan Stanley downgrade, Gucci woes loom
-
Crypto World6 days ago
Sei Network Enters Quiet Reset Phase as On-Chain Metrics Signal a Slowdown in 2026
-

 Tech6 days ago
Google adds E2E encryption to Gmail for iOS and Android enterprise users
-
 Entertainment5 days ago
Brand New Day’ Footage Reveals the Devastating Impact of ‘Now Way Home’
-

 Tech6 days ago
Apple glasses won’t go brand shopping like Meta did with Ray-Ban and Oakley
-
 Entertainment5 days ago
Karol G’s ‘Ultra Raunchy’ Coachella Set Gave ‘Satanic Vibes’
You must be logged in to post a comment Login