
Crypto World
Bitcoin’s ‘hopium’ for bulls is over and this weekend’s slide may be just the beginning
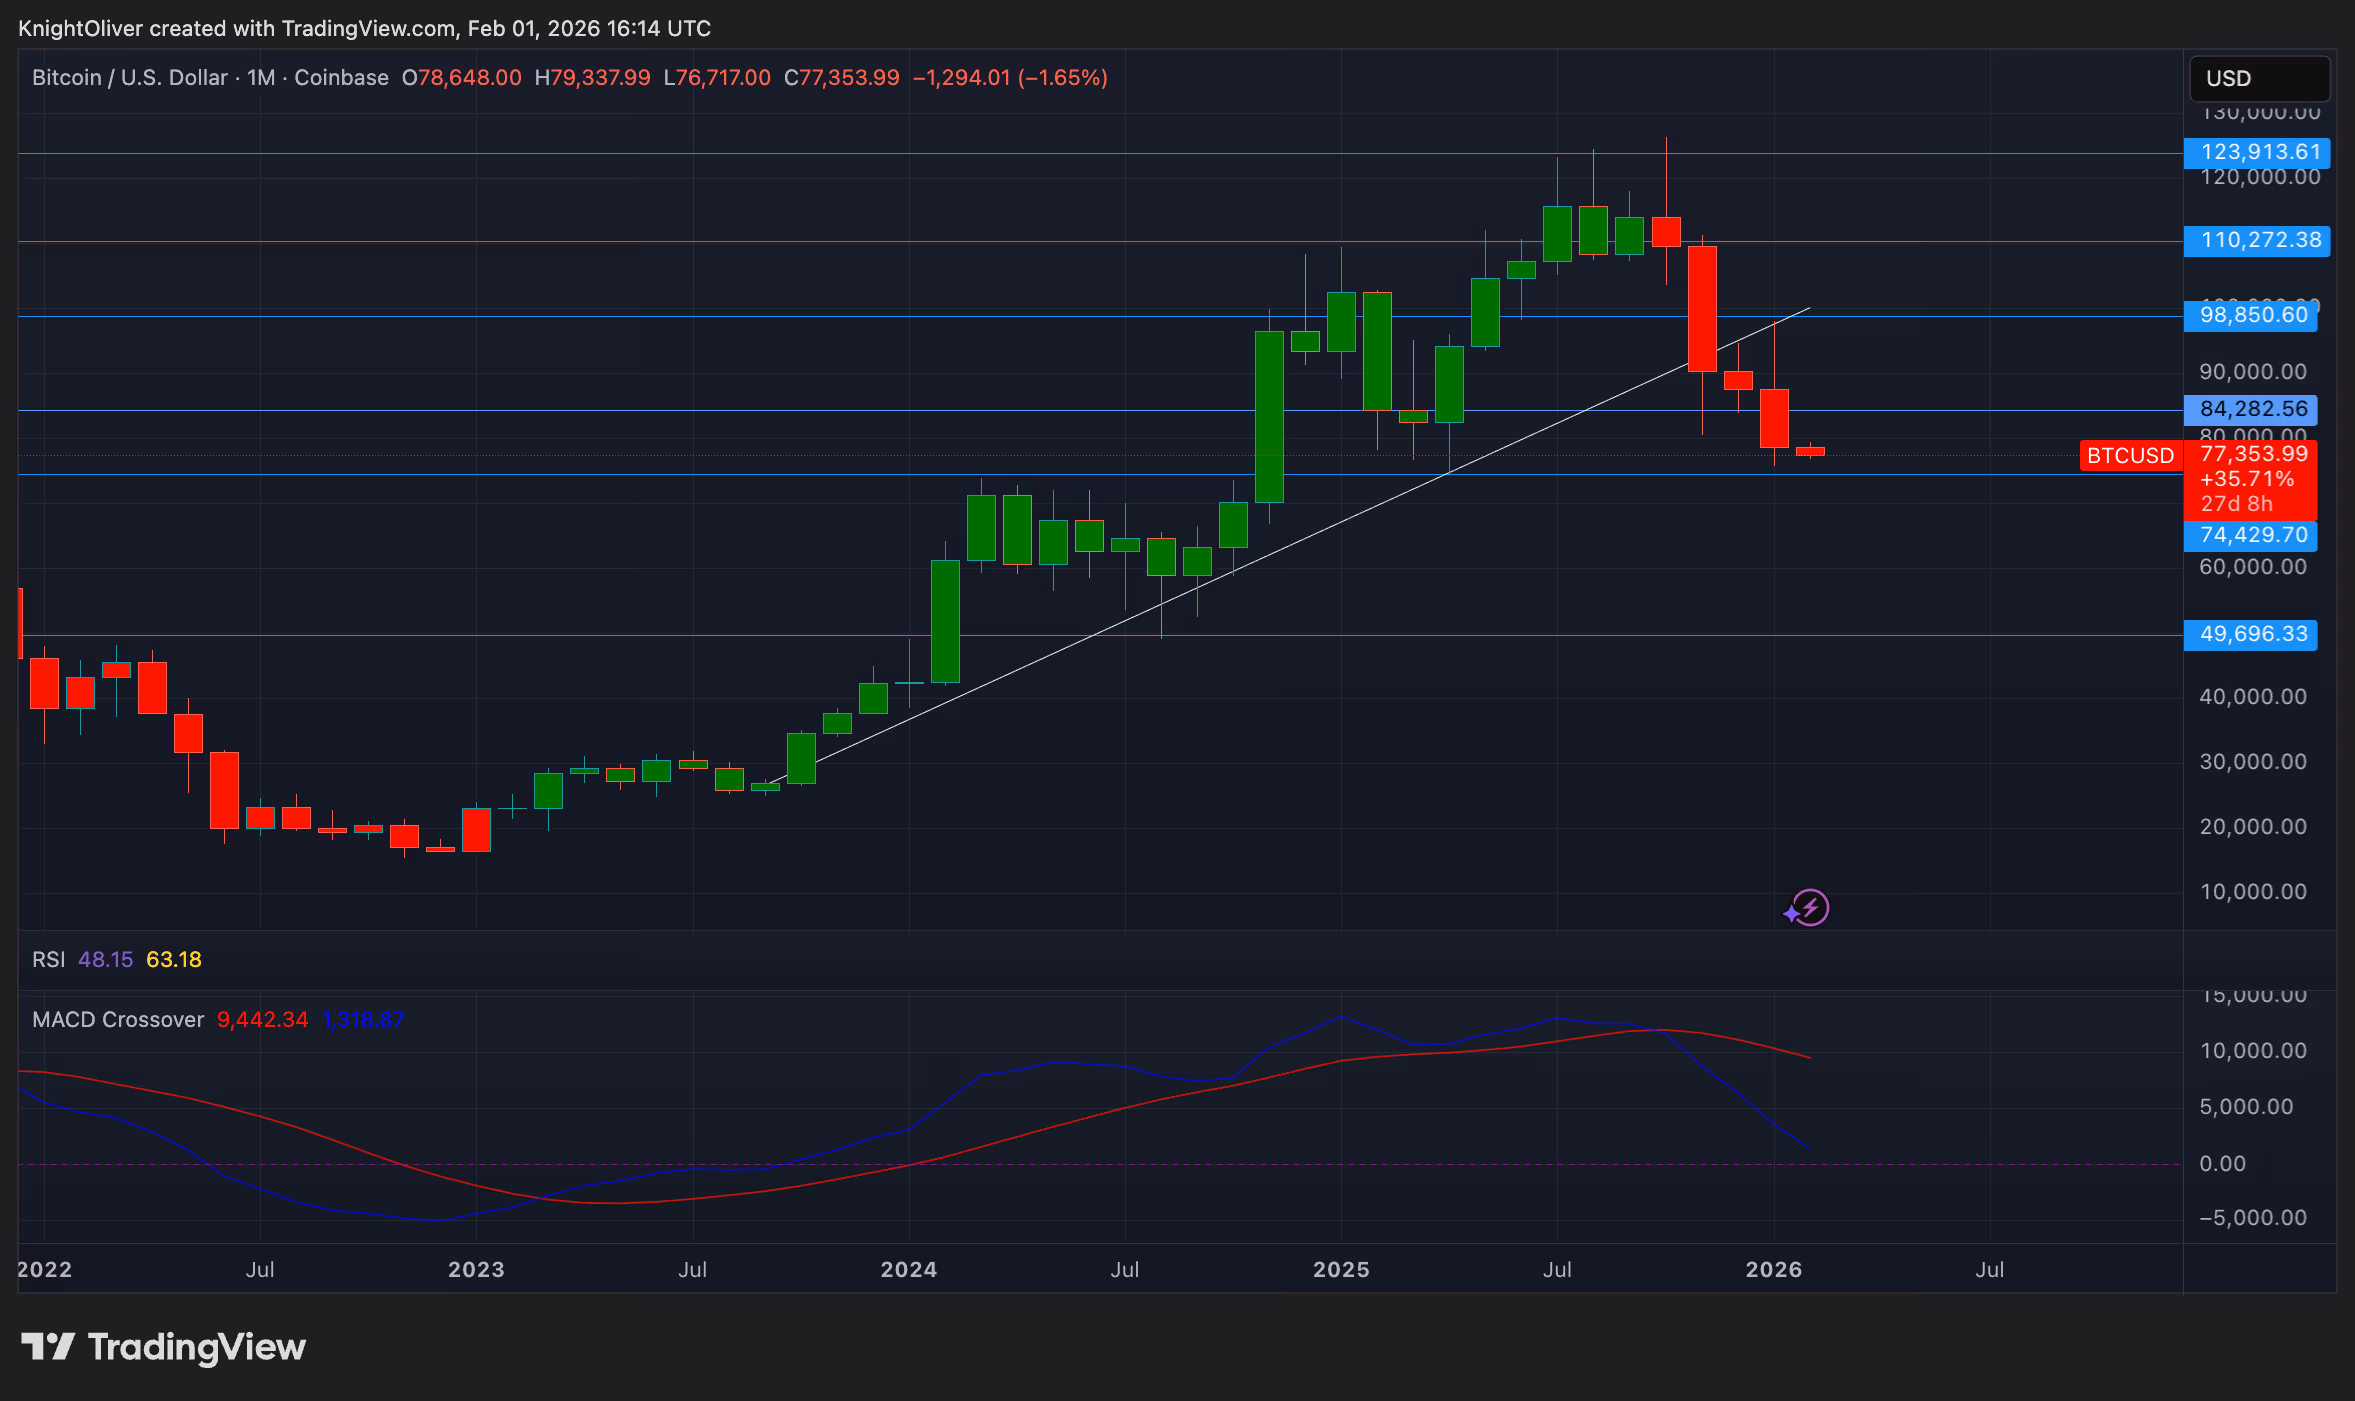
Bitcoin’s price sank sharply over the weekend, sliding below $78,000 — its lowest level since April — as profit-taking collided with thinning liquidity and a scarcity of fresh buyers.
Traders told CoinDesk that a rally once backed by corporate demand, particularly from Strategy’s (MSTR) bitcoin purchases, has run out of steam, leaving markets vulnerable to forced selling and derivative liquidations.
For some market analysts, Saturday’s slide fits into a broader bearish pattern that has been emerging for months. Eric Crown, a former options trader at NYSE Arca, has argued since late October that bitcoin is in a sideways-to-downside phase, and that the optimism around a return to new highs — or a rotation from metals back into crypto — is misplaced “hopium” for bulls.
“It’s been my view since [the] end of October that BTC is in a sideways and downside phase… I do not think 80K is a macro low for bitcoin,” Crown, who now posts updates on the crypto market with more than 200,000 subscribers, told CoinDesk, underlining that recent price action may be part of a larger corrective regime.
And the action in the options market backs up this bearish sentiment. Options traders are now increasingly betting that prices will fall below $75,000 and ditching their bullish bets of reaching $100,000. So much so that the dollar value of the number of active bitcoin put options contracts at the $75,000 level listed on Deribit platform now stands at $1.159 billion, almost matching the so-called notional open interest of $1.168 billion locked in the $100,000 call option.
Bearish signals
Crown points to several technical indicators that have historically foreshadowed deeper corrections.
The monthly MACD — a technical trading indicator — crossed down in November, a rare signal that has preceded extended downturns in previous cycles.
Additionally, the weekly 21 vs. 55 EMA (another technical indicator) recently crossed into bearish territory. When this happens, it is typically followed by multi-month losses. And the 2025 yearly chart closed as a “shooting star,” a candlestick pattern that often signals a medium-term reversal.

Bitcoin to $50,000?
Making matters worse for bulls, bitcoin has diverged from traditional markets since October, declining while equities and other risk assets held up — a pattern Crown sees as typical of late-cycle risk-off behavior.
“People generally sell the more speculative assets first,” he said.
Beyond technicals, Crown highlights the speculative wash-out from October’s crash, which eliminated many leveraged altcoin positions and left traders wary of re-entering at elevated levels.
While not as extreme as some cyclical bears, Crown suggests bitcoin may fall to even lower levels — potentially into the mid-$50,000 to low-$60,000 zone — before stabilizing.
In fact, he says that range represents an area he’s personally eyeing to add to his long-term positions, framing the current market as a potential value-accumulation phase rather than the end of crypto’s broader cycle.


Congress is calling for a Polymarket investigation after at least 50 newly created accounts placed bets on a US-Iran ceasefire in the minutes before President Trump announced it on social media on April 9.
Summary
- At least 50 brand-new Polymarket accounts placed winning ceasefire bets minutes before Trump’s announcement.
- Representative Ritchie Torres sent a letter to the CFTC demanding a formal review of the platform.
- Senator Richard Blumenthal called Polymarket “an illicit market” for exploiting national security secrets.
The prediction market platform Polymarket is at the center of a congressional firestorm after the US-Iran ceasefire announcement. At least 50 newly created accounts placed bets on the outcome in the hours and minutes before President Trump posted about the deal, and most made no other bets before or since.
According to NPR, at least 50 new accounts placed substantial bets on a US-Iran ceasefire in the hours and minutes before President Trump posted the deal on social media. The accounts had no prior betting history and made no other trades, raising immediate suspicion of insider activity.
Rep. Ritchie Torres sent a letter to the CFTC demanding a formal investigation. Sen. Richard Blumenthal went further, calling Polymarket “an illicit market to sell and exploit national security secrets unlike any in history.”
A Pattern Polymarket Cannot Escape
This is not the first time suspicious betting has preceded a major geopolitical event. As crypto.news reported, six Polymarket accounts were previously accused of using insider information to profit from the timing of earlier US strikes on Iran, earning roughly $1 million and triggering the so-called DEATH BETS Act from Senator Adam Schiff.
Analytics firm Bubblemaps had flagged newly created wallets placing timely bets just hours before those strikes commenced. The pattern has now repeated with greater speed: the latest bets were placed in the minutes before the announcement, not just hours.
Regulatory and Legal Exposure
The CFTC issued an advance notice of proposed rulemaking on prediction markets in March 2026, with the comment window set to close on April 30. More than 10 anti-prediction market bills have been introduced in Congress since January.
As crypto.news noted, six Democratic senators previously urged the CFTC to ban contracts that resolve on or correlate to an individual’s death. Polymarket, which operates outside US jurisdiction and requires only a crypto wallet to trade, has not commented on the latest congressional demands.


Bitcoin $73,000 has proven an impassable ceiling for the third time since the ceasefire, dragging ETH, SOL, and DOGE lower as analysts say the market needs a clean break above $75,000 before any sustained upside is possible.
Summary
- Bitcoin has failed to break $73,000 for the third time since the US-Iran ceasefire was announced.
- ETH, SOL, and DOGE have slid on the day as BTC stalls at a level that has capped every rally since the war began.
- Analysts say $75,000 must break before the market enters a genuine bullish phase.
Ethereum, Solana, and Dogecoin are sliding on April 10 as Bitcoin fails again to break above $73,000. The level has acted as a ceiling for every relief rally over the six weeks of the Iran conflict, and the third rejection in as many days has renewed pressure on the broader altcoin market.
Bitcoin reached an intraday high of $73,111 on April 10 before pulling back, according to crypto.news market data. The repeated failure at this level has weighed on altcoin momentum, with ETH, SOL, and DOGE each recording losses on the day as Bitcoin’s hesitation discourages broad risk-on positioning.
The level has “capped every rally during the six-week war,” according to CoinDesk’s April 10 market daybook, with analysts saying $75,000 must break before the market enters a genuine bullish phase. Even the brief relief from softer core CPI data this morning was not enough to push Bitcoin through.
Altcoins Bear the Brunt
Ethereum, Solana, and Dogecoin each declined on the day, tracking Bitcoin’s inability to convert the $73,000 test into a breakout. The altcoin market is structurally leveraged to Bitcoin’s directional moves; when BTC fails resistance, altcoins tend to sell off faster and recover slower.
The three consecutive rejections at $73,000 have reinforced the view that the ceasefire alone was not enough to end the war’s grip on market sentiment. Traders are still pricing persistent geopolitical risk from an only partially open Strait of Hormuz and a fragile, untested peace process.
What Could Break the Resistance
A full diplomatic resolution from the Islamabad talks this weekend, including an unconstrained reopening of the Strait of Hormuz, would remove one of the market’s largest macro headwinds. As crypto.news noted, oil falling sustainably below $100 would likely shift macro sentiment in favor of risk assets, potentially providing the catalyst needed to break above $73,000 and trigger the next leg of altcoin recovery.


XRP is holding at $1.34 as traders await Senate action on the XRP CLARITY Act, with Congress returning from Easter recess on April 13 and a Banking Committee markup expected in the second half of the month.
Summary
- XRP is trading in a tight $1.34 to $1.35 range with modest 0.8% to 1.0% gains over 24 hours.
- The Senate Banking Committee markup of the CLARITY Act is targeted for the second half of April.
- Analysts say passage could unlock $4 to $8 billion in additional XRP ETF inflows, per Standard Chartered.
XRP has been in a holding pattern on April 10, trading between $1.34 and $1.35 as institutional investors wait for the US Senate to act on legislation that could permanently define XRP’s regulatory status. The next window opens April 13.
According to FX Leaders, XRP held between $1.33 and $1.35 on April 10, posting modest gains of 0.8% to 1.0% over the prior 24 hours. The range trade reflects a market waiting for a binary legislative outcome rather than responding to technicals.
The Senate returns from Easter recess on April 13, with the Banking Committee markup of the CLARITY Act targeted for the second half of the month. As crypto.news reported, Polymarket currently gives the bill roughly a 63% to 66% probability of becoming law in 2026. Senator Bernie Moreno has warned publicly that missing the May window risks pushing the legislation off the calendar for the rest of the year.
What the CLARITY Act Means for XRP
The CLARITY Act would formally define XRP as a digital commodity under US law, giving banks and large asset managers the legal certainty they need to commit capital at scale. Standard Chartered analyst Geoffrey Kendrick has projected that Senate Banking Committee advancement could unlock $4 to $8 billion in additional XRP ETF inflows.
Seven US spot XRP ETFs already pulled in $1.44 billion since launching between September and December 2025, without the CLARITY Act as law. With formal legislation in place, analysts say institutional capital currently sitting on the sidelines would have permanent legal cover to enter at scale.
The Clock Is Narrowing Fast
Ripple CEO Brad Garlinghouse has already pushed his expected passage timeline from the end of April to the end of May. As crypto.news noted, TD Cowen and multiple legal analysts have warned the bill could slip off the congressional calendar entirely if it does not clear the Senate before summer, with midterm election dynamics making a post-August push nearly impossible.
Treasury Secretary Scott Bessent has publicly urged Congress to act, writing in a Wall Street Journal op-ed that “Senate floor time is scarce, and now is the time to act.” For XRP traders, the $1.34 floor may hold until the Senate shows its hand.

TLDR
- Hong Kong Monetary Authority issued its first stablecoin licences to Anchorpoint and HSBC Hong Kong.
- Anchorpoint plans to launch HKDAP, a Hong Kong dollar-backed stablecoin, in a phased rollout.
- The Stablecoins Ordinance requires HK$25 million capital and strict compliance standards.
- Authorities enforce penalties up to HK$5 million and seven years imprisonment for violations.
- Global stablecoin market exceeds $311 billion, dominated by US dollar-based tokens.
Hong Kong regulators have issued the first stablecoin licences under a new legal framework. Authorities approved Anchorpoint and HSBC Hong Kong as initial issuers. The move establishes a regulated path for Hong Kong dollar-backed digital tokens.
Standard Chartered, HSBC Secure Early Stablecoin Approval
The Hong Kong Monetary Authority granted licences to Anchorpoint and HSBC Hong Kong under its stablecoin rules. Anchorpoint operates as a joint venture involving Standard Chartered, Animoca Brands, and HKT. The approval allows both entities to issue regulated stablecoins within Hong Kong’s financial system.
Anchorpoint confirmed plans to introduce HKDAP, a Hong Kong dollar-backed stablecoin, in phases during the second quarter. The company will use a structured rollout strategy targeting institutional and commercial use cases. It aims to support digital payments and tokenized financial transactions within regulated channels.
Bill Winters, Group Chief Executive of Standard Chartered, emphasized the bank’s commitment to financial innovation.
He said, “The issuance of HKDAP provides a regulated medium of exchange for modern financial markets.” He added that the initiative supports evolving global trade systems and digital finance adoption.
Anchorpoint Chief Executive Dominic Maffei highlighted the firm’s operational focus and ecosystem goals. He said the company will provide “secure, accessible, and regulated tokenized money” for users. He stated that this approach will reshape financial transactions and infrastructure across institutions and individuals.
The firm plans to deploy a B2B2C distribution model to expand adoption across different market segments. Selected distributors will connect the platform to end users and business clients. The strategy also supports partnerships with financial and technology service providers.
HKMA Framework Defines Capital and Compliance Standards
Hong Kong introduced its Stablecoins Ordinance in August 2025 to regulate digital asset issuance. The law established a licensing system and defined operational standards for issuers. Regulators designed the framework to ensure oversight and financial stability.
The ordinance requires issuers to maintain at least HK$25 million in paid-up capital. It also mandates HK$3 million in liquid assets for operational resilience. These thresholds aim to ensure financial strength among licensed participants.
Authorities set strict penalties for unauthorized stablecoin issuance under the new rules. Violators face fines of up to HK$5 million and possible prison sentences of seven years. Enforcement measures aim to maintain compliance and deter unlicensed activity.
The Hong Kong Monetary Authority also released guidelines on supervision and risk management practices. These rules include anti-money laundering and counter-terrorism financing requirements. Issuers must follow strict reporting and operational controls under regulatory supervision.
Data from CoinGecko shows the global stablecoin market exceeds $311 billion in total value. Most transaction volumes remain concentrated in US dollar-based tokens like USDT and USDC. Hong Kong aims to expand regulated alternatives tied to its local currency.
Officials continue to develop the licensing system to support controlled innovation in digital finance. The framework focuses on practical use cases like cross-border settlement and tokenized banking services. Authorities maintain oversight while enabling stablecoin adoption in regulated financial environments.

Crypto World
TAO Tanks 20% as Major Subnet Developer Accuses Bittensor Founder of ‘Decentralization Theatre’
The founder of Covenant AI announced the project’s departure from Bittensor last night, kicking off public accusations from both sides, and sending the subnet ecosystem down 26%.
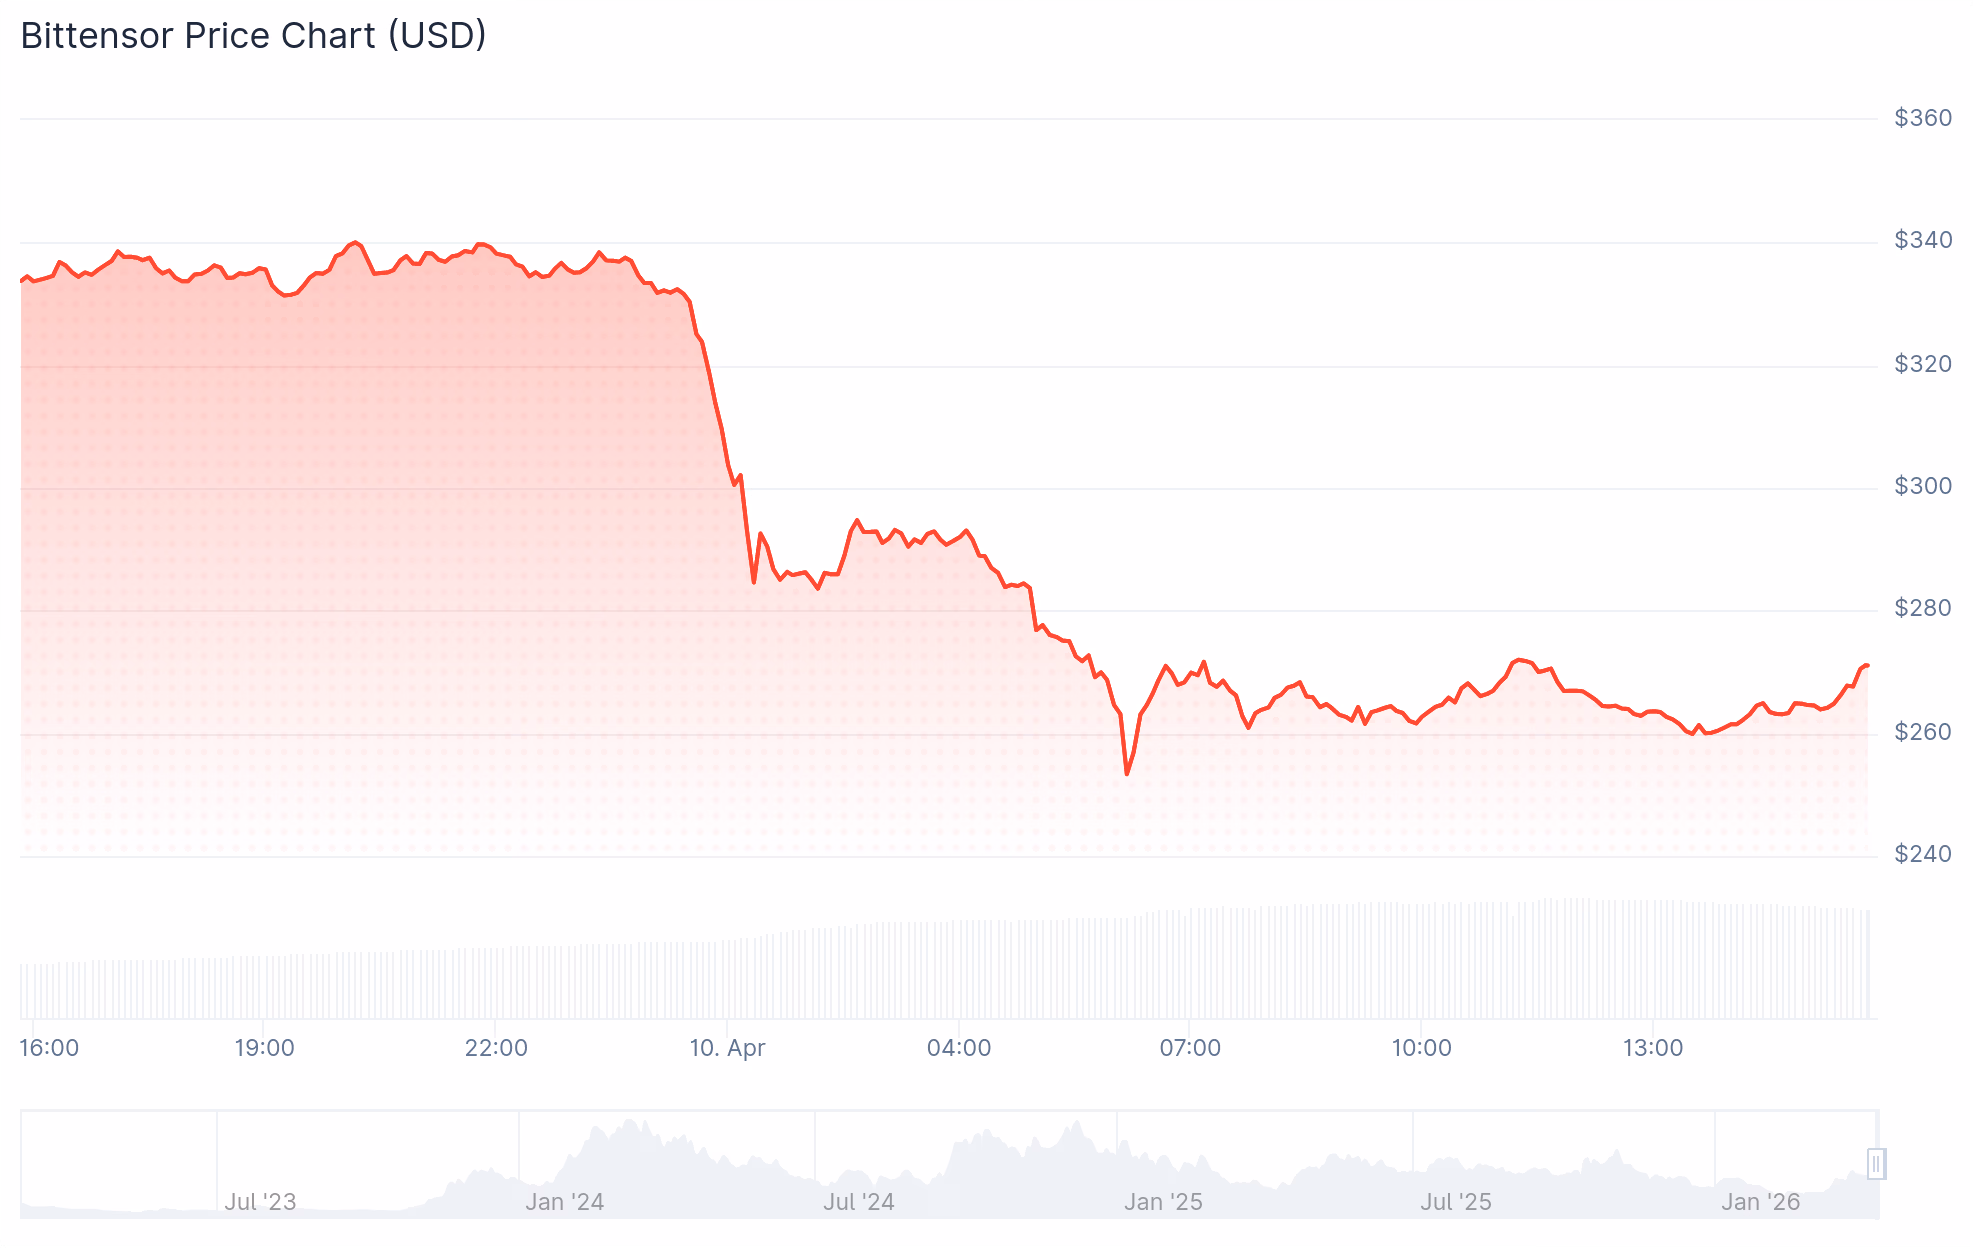
Bittensor’s TAO token is the worst performer among the top-100 large-caps today, April 10, after a major subnet operator announced their departure from the ecosystem.
Yesterday evening ET, TAO plunged from around $338 to a low near $253 — a drop of roughly 25% — erasing close to $900 million in market cap, per CoinGecko data. The asset is currently down 20% over the past 24 hours, trading near $270 at press time.

The sell-off was triggered by an extended X post from Sam Dare, founder of Covenant AI, announcing the project’s departure from Bittensor, a decentralized artificial intelligence (AI) protocol.
In his statement, posted on X yesterday evening ET, Dare accused Bittensor founder Jacob Steeves (known online as “Const”) of exercising unilateral control over a network that presents itself as decentralized, alleging Steeves suspended emissions to Covenant’s subnets, stripped their moderation capabilities, deprecated their infrastructure, and applied economic pressure through large, visible token sales timed to moments of operational conflict.
“The entire premise of Bittensor… is that no single entity controls it,” Dare wrote. “That promise is a lie.”
Covenant AI operated subnets SN3, SN81, and SN39 — specialized sub-networks dedicated to specific AI tasks — and was the team behind Covenant-72B: the model whose reveal catalyzed a 90% TAO rally after Nvidia CEO Jensen Huang and investor Chamath Palihapitiya endorsed Bittensor’s decentralized AI training model on the All-In Podcast, as The Defiant reported previously.
Steeves pushed back in an X response on April 10, disputing each claim. He acknowledged selling some of his alpha holdings across Covenant’s three subnets, but said it was because they “were not running, and were on near 100% burn code” — and that the sales amounted to less than 1% of his total investment in the project.
He also denied having any ability to unilaterally suspend emissions, said Dare deprecated his own channels, and noted that visibility in token sales is “impossible to avoid” given his position.
Not everyone in the community is sympathetic to Dare’s account. Prominent Bittensor community member @DreadBong0 alleged that Dare dumped 37,000 TAO worth of subnet alpha tokens across the Grail, Basilica, and Templar subnets on the way out — a move that “completely destroyed the investments of everyone who followed and trusted these guys.”
DreadBong0’s X post called the alleged move a “rug for max extraction,” adding: “Maybe that’s wrong but that’s exactly how it looks to me.” The dump allegation has not been independently verified, and Dare has not publicly addressed it.
Subnet Ecosystem Suffers
The Bittensor subnets sector more broadly is down nearly 26% on the day per CoinGecko, with τemplar (SN3) — which had surged around 400% over the prior month to an over $150 million market cap — now down almost 63% in the past 24 hours.
Nearly $10 million in TAO long positions were liquidated in the past 24 hours, per CoinGlass data.
The Defiant had covered the TAO rally last month, noting the surge in Bittensor subnet tokens and the outsized role Covenant AI’s model played in driving enthusiasm.
The network has also attracted a wave of institutional interest, with publicly traded companies building TAO treasuries and, more recently, the potential conversion of the Grayscale TAO Trust into a spot ETF on the horizon.
This article was written with the assistance of AI workflows. All our stories are curated, edited and fact-checked by a human.


Coinbase CEO Brian Armstrong publicly supported Treasury Secretary Scott Bessent’s call to pass the CLARITY Act, citing the urgency of crypto regulation.
Coinbase CEO Brian Armstrong backed Treasury Secretary Scott Bessent’s push to pass the CLARITY Act on Friday, April 10, 2026. Armstrong publicly agreed with the urgency around crypto regulation and thanked Bessent for advancing the issue forward with bipartisan support in the Senate.
The endorsement from Armstrong, one of crypto’s largest institutional figures, adds pressure on Congress to act on the cryptocurrency regulation framework. The CLARITY Act aims to provide regulatory clarity for digital assets and their classification across U.S. financial regulators.
Sources: Brian Armstrong
This article was generated automatically by The Defiant’s AI news system from publicly available sources.
Crypto World
Best Crypto to Buy Now as Polkadot Lands on Robinhood and Breaks Key Pattern While DOT and NEAR Fight Back
Best crypto to buy now gets a fresh spark as Polkadot just landed on Robinhood, breaking out of a falling wedge pattern that held DOT down for weeks, according to Crypto.news. NEAR Protocol climbs in AI search rankings as developer interest picks up. But while both coins fight for recovery from 90%+ drops, the smart play is locking into the entry that benefits most before the crowd arrives.
Highlighted as the best crypto to buy now, Pepeto raised $8.86 million with analysts calling for at least 100x after the Binance listing. The presale is ending and pricing closes for good when trading opens.
Best Crypto to Buy Now Gets a Boost as DOT Hits Robinhood and Staking Reforms Go Live
Polkadot landed on Robinhood this week, triggering a breakout from a falling wedge that had capped DOT for over a month, according to Crypto.news. The listing opens DOT to millions of retail traders who never held it before.
On top of that, staking reforms cut the unbonding period from 28 days to just 24 to 48 hours, making DOT far more liquid for holders, according to CoinMarketCap. The 53.6% emission cut from March 14 is already live, capping supply at 2.1 billion. The best crypto to buy now gains directly when new onramps open, and the exchange already live at presale pricing with a Binance listing confirmed is where that wave hits hardest.
Where the Presale Sits Before DOT’s Robinhood Wave Plays Out
Pepeto
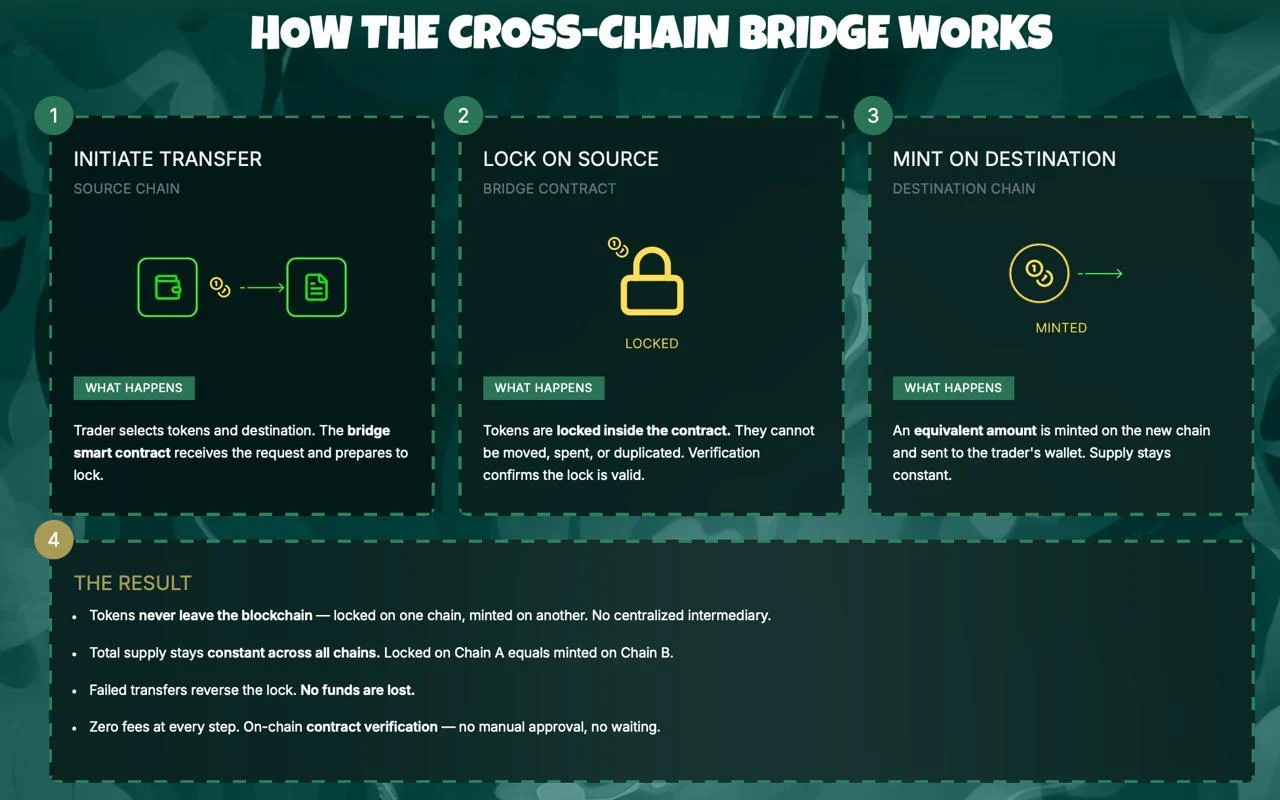
While DOT gets a fresh boost from Robinhood and NEAR draws developer buzz, the best crypto to buy now is not the large cap that needs trillions to move. Pepeto runs a contract scanner across Ethereum, BNB Chain, and Solana that catches dangerous tokens before your capital touches them. PepetoSwap handles trades with zero fees, and the bridge transfers assets between chains for free.
The presale pulled $8.86 million at $0.0000001863 during weeks of extreme fear. Staking pays 186% APY and keeps growing positions while each round fills. SolidProof went through the full codebase, the founder behind the original Pepe coin leads the build, and a senior Binance developer manages exchange operations. Analysts project 100x to 300x from one listing event, the kind of math that no large cap recovery can touch.
The Binance listing is the event that sends Pepeto from a fraction of a cent into open market trading where demand sets the price. Early holders who locked in at $0.0000001863 will be sitting on positions that the rest of the market pays multiples more to enter, and that gap is where the biggest returns of this cycle live.
Polkadot
DOT trades at $1.33 on April 10, down 98% from its $55 all-time high, according to CoinMarketCap.
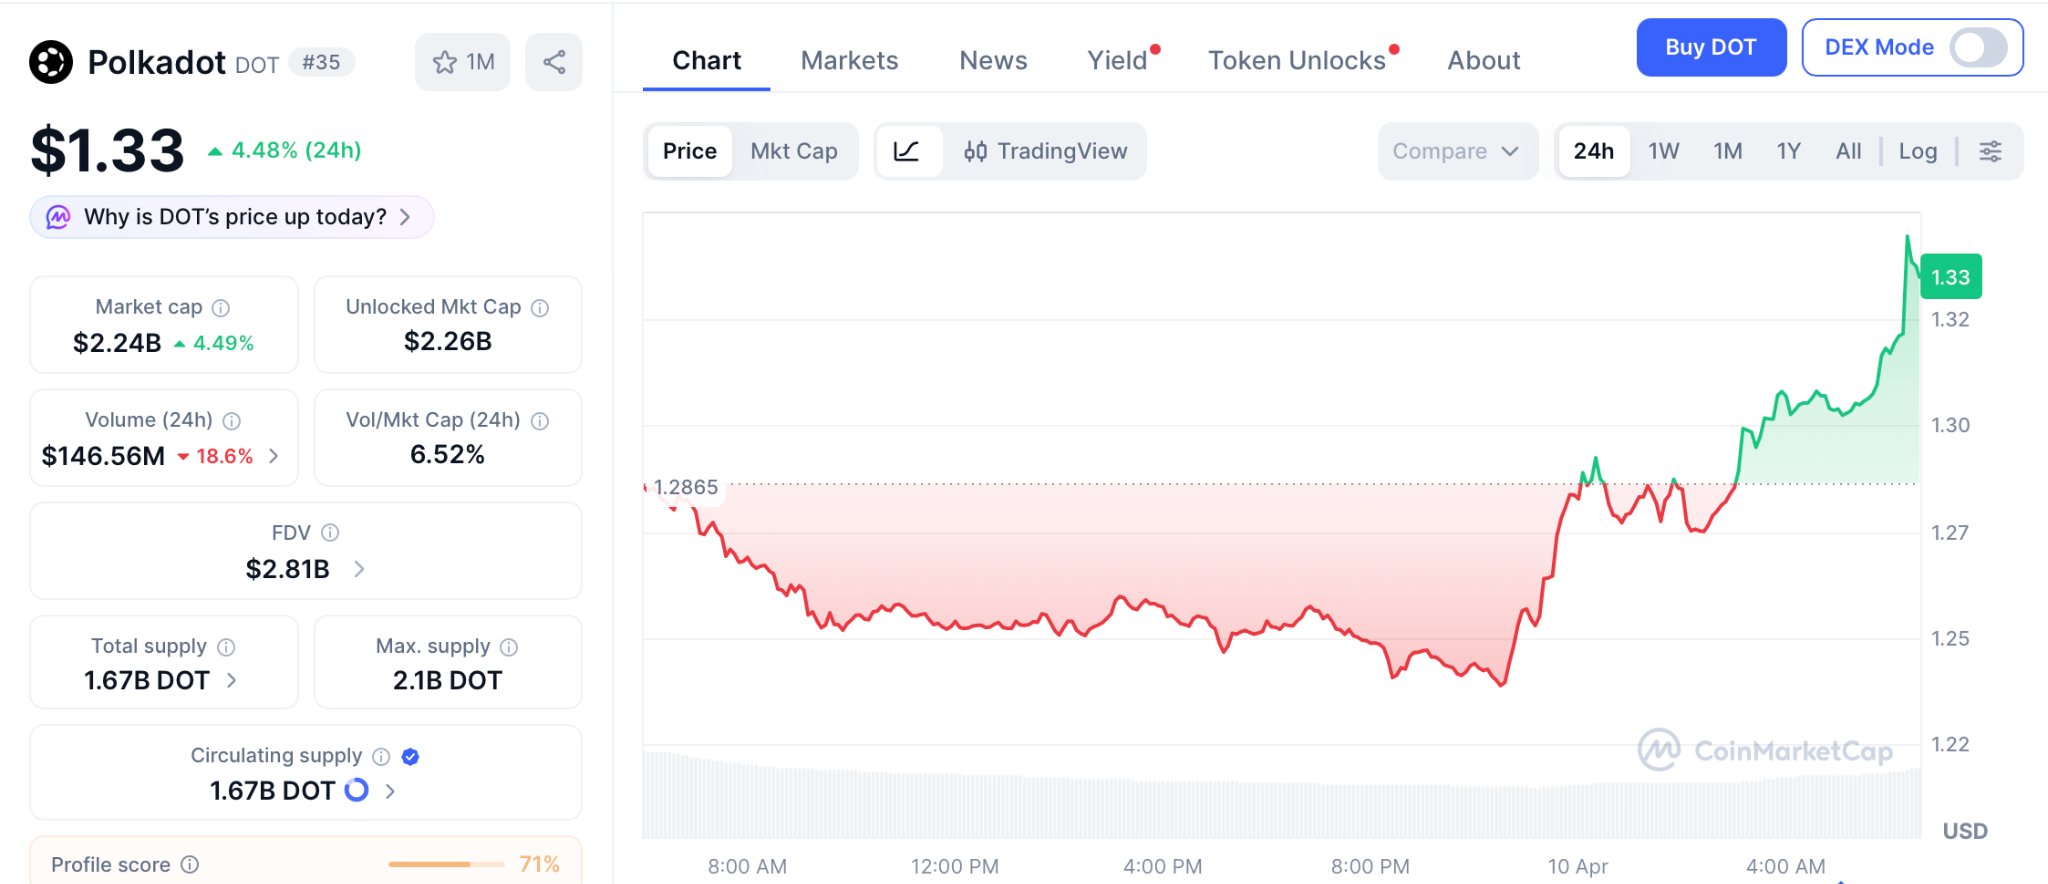
The first US spot Polkadot ETF launched in March, and a 53.6% emission cut went live on March 14, cutting new supply in half. Resistance sits at $1.40 with $1.15 as support. Strong tech, but the path from $1.33 needs months of buying, not one listing event.
NEAR Protocol
NEAR trades at $1.38 on April 10, down 93% from its $20.44 high, according to CoinMarketCap. The AI-native blockchain now bridges to Solana and TON through Chain Signatures, pulling developer attention.
Support holds at $1.00 with $1.50 as resistance. Good narrative, but the recovery from $1.38 takes quarters of steady demand.
Conclusion
With DOT now live on Robinhood and NEAR pulling developer attention through AI integration, both coins have a path forward, but recovery from 90%+ drops takes quarters of patience. The best crypto to buy now for fast, high returns is the presale where the product already works and the listing is the only event left. Analysts project 100x from the Binance listing, and this is the last window to get presale pricing before trading opens.
DOGE started at $0.007 and made early holders rich enough to never worry about money again, and Pepeto carries more tools, a stronger team, and a confirmed listing that DOGE never had at that stage. The Pepeto official website is where smart money is getting in before the listing sets a higher floor.
Click To Visit Pepeto Website To Enter The Presale

FAQs
What is the best crypto to buy now after Polkadot’s Robinhood listing opens DOT to millions of new traders?
Pepeto is the best crypto to buy now because it raised $8.86 million with a SolidProof audit, a live zero-fee exchange, and a Binance listing confirmed, giving it 100x to 300x upside that large caps like DOT and NEAR cannot offer from their current prices.
Is Polkadot or NEAR Protocol a better buy than a presale with 100x potential right now?
DOT at $1.25 sits 98% below its all-time high and NEAR at $1.38 is 93% below its peak. Both need billions in new capital for big moves, while Pepeto at presale pricing delivers triple-digit returns from one listing event with working tools already live.
Disclaimer: This is a Press Release provided by a third party who is responsible for the content. Please conduct your own research before taking any action based on the content.
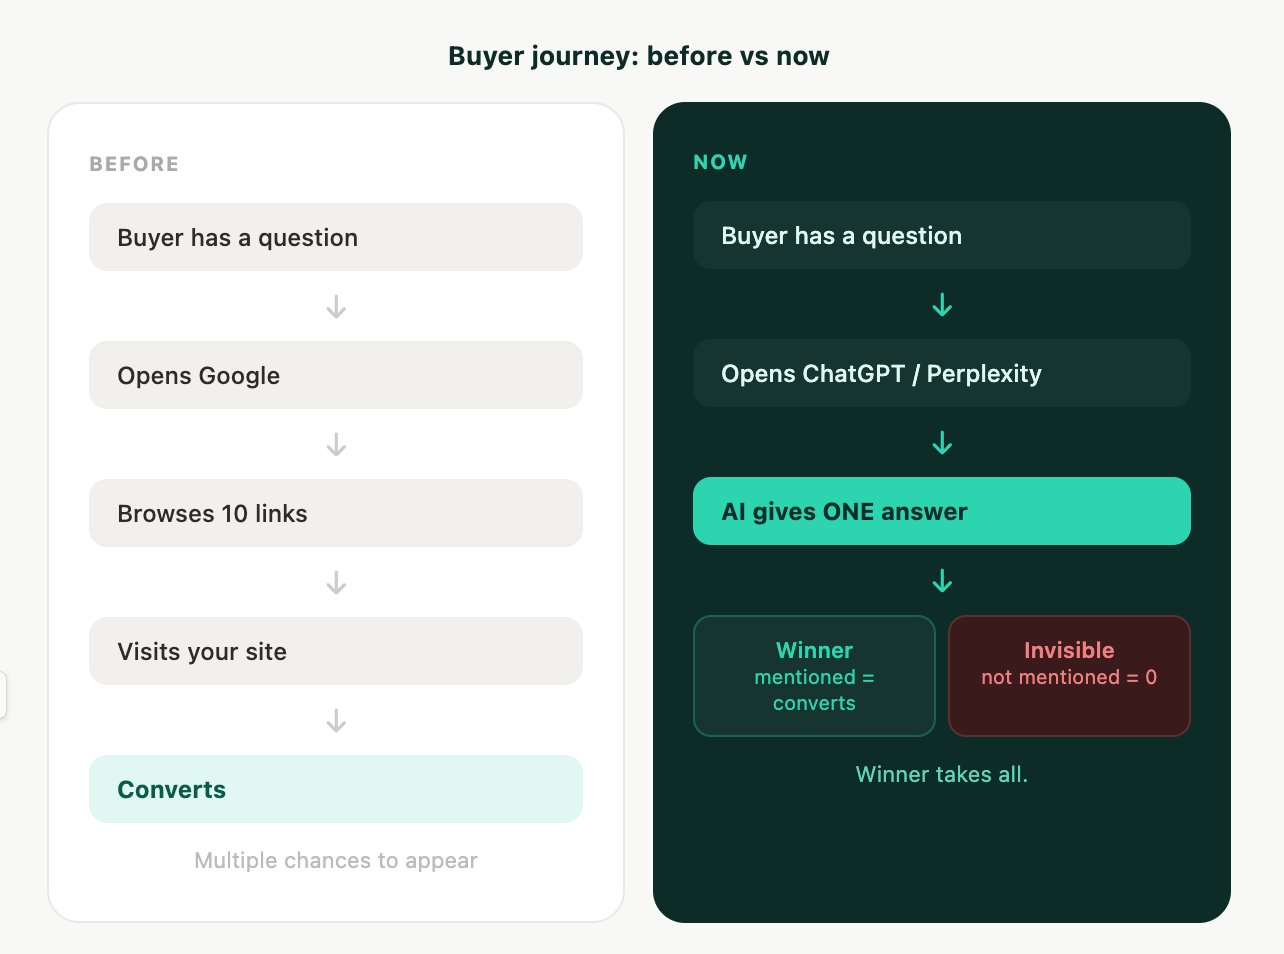
For two decades, the path to discovery in fintech was predictable: run ads, rank on Google, capture clicks, and convert traffic. The funnel was messy, but it was visible. Today, that funnel is breaking.
When a high-intent buyer – whether looking for a SaaS payment processor or a secure crypto custody solution – has a question, they no longer browse ten blue links. They open ChatGPT, Perplexity, or Gemini. The AI responds instantly, naming only two or three platforms and explaining why.
If your brand isn’t mentioned in that single answer, you never got a chance. You quietly lose deals you never knew you were in.

Your Analytics Dashboard Is Lying to You
The most dangerous part of this shift is that the problem is invisible.
- The Ghost Trend: Your Google rankings and paid traffic may look stable, while a growing percentage of your highest-intent buyers are asking AI systems for recommendations instead.
- Attribution Gap: ChatGPT and Perplexity don’t send referral traffic or show up in UTM reports the same way Google does.
- Market Share Shift: Traditional search now accounts for roughly 60% of queries, while AI search has already captured 40% and is growing every quarter.

The 3 Rules to Appear in AI Answers (AIO)
AI systems don’t pick favorites by chance – they cite those who align with their data extraction algorithms. For the crypto industry, where trust is built on code audits and transparency, this is critical.
Structured Content (The Machine Must Be Able to “Read”)
AI doesn’t cite what is “beautifully written”; it cites what is easy to extract.
- Technical Foundation: Use clear headers, FAQ schemas, and comparison tables.
- Shift in Focus: Instead of long, fluffy narratives, create “atomic” blocks of information that LLMs can easily synthesize into a direct answer.
Multi-Source Authority (Triangulation of Trust)
LLMs don’t take your website’s word for it – they cross-reference data.
- Cross-Verification: Your presence in industry-leading media (like BeInCrypto), analyst reports, and independent directories creates a “web of trust”.
- Social Proof: For crypto projects, this means being mentioned in relevant communities, GitHub discussions, and forums that are indexed by AI.
Entity Clarity
The AI must unequivocally understand who you are, what problem you solve, and for whom.
- Unified Message: Inconsistent positioning across different resources leads to the AI ignoring your brand due to data uncertainty.
- Specifics: Clearly define your niche (e.g., “An L2 protocol for scaling gaming dApps”) so the AI can accurately match you to a specific user query.

Real Results from AI Optimization
The results of treating AI search as a distinct channel are measurable and significant:
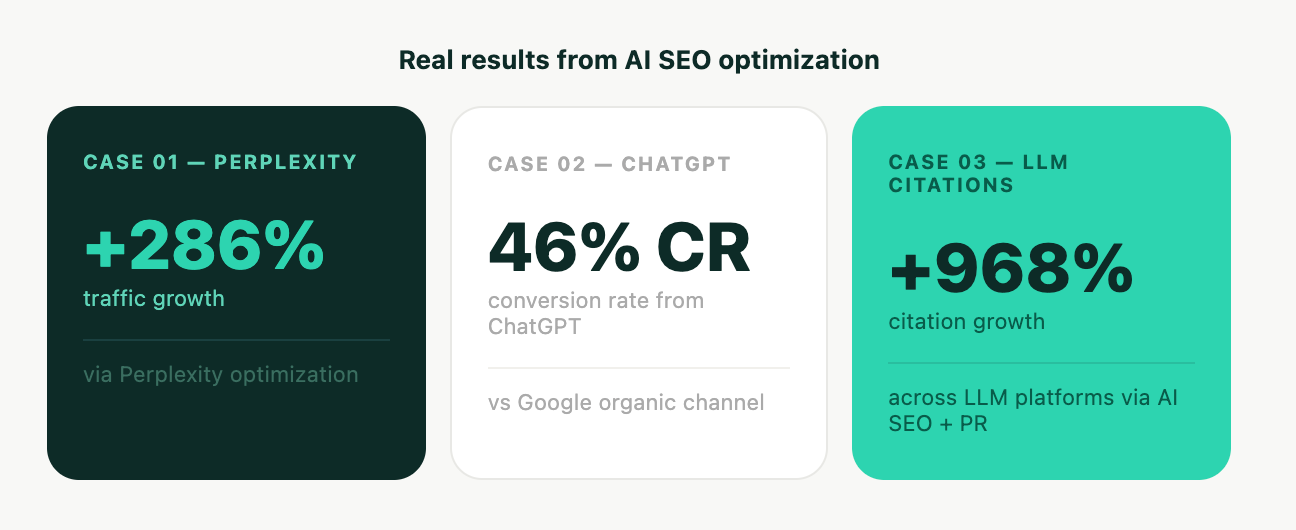
- Perplexity Optimization: +286% traffic growth.
- ChatGPT Recommendations: 46% conversion rate compared to traditional organic channels.
- LLM Citations: +968% growth in brand mentions across AI platforms.
2026: The End of the “Organic” Window
AI search is currently where Google was in the early 2000s – purely organic.
- The Opportunity: There are currently no paid placements in ChatGPT or sponsored slots in Perplexity. You earn your spot through authority.
- The Compounding Effect: Unlike Google Ads, AI presence compounds. Brands that establish their citation footprint now become harder to displace over time.
What to do Right Now
The fintech brands that show up in AI answers today didn’t get there by accident.
- Audit your visibility: Ask ChatGPT and Perplexity the questions your buyers actually ask.
- Close the gaps: Structure your site content for extraction and build your presence across the sources AI trusts.
- Clarify your entity: Make it impossible for an LLM to misunderstand your brand’s value proposition.
The window is open for now. Your buyers are already asking AI for recommendations – is your brand in the room when they do?
Editor’s note: These insights are based on data from STIVE, an AI visibility firm working with B2B and fintech brands.
The post Google Had Pages. AI Has One Answer. Is It You? appeared first on BeInCrypto.
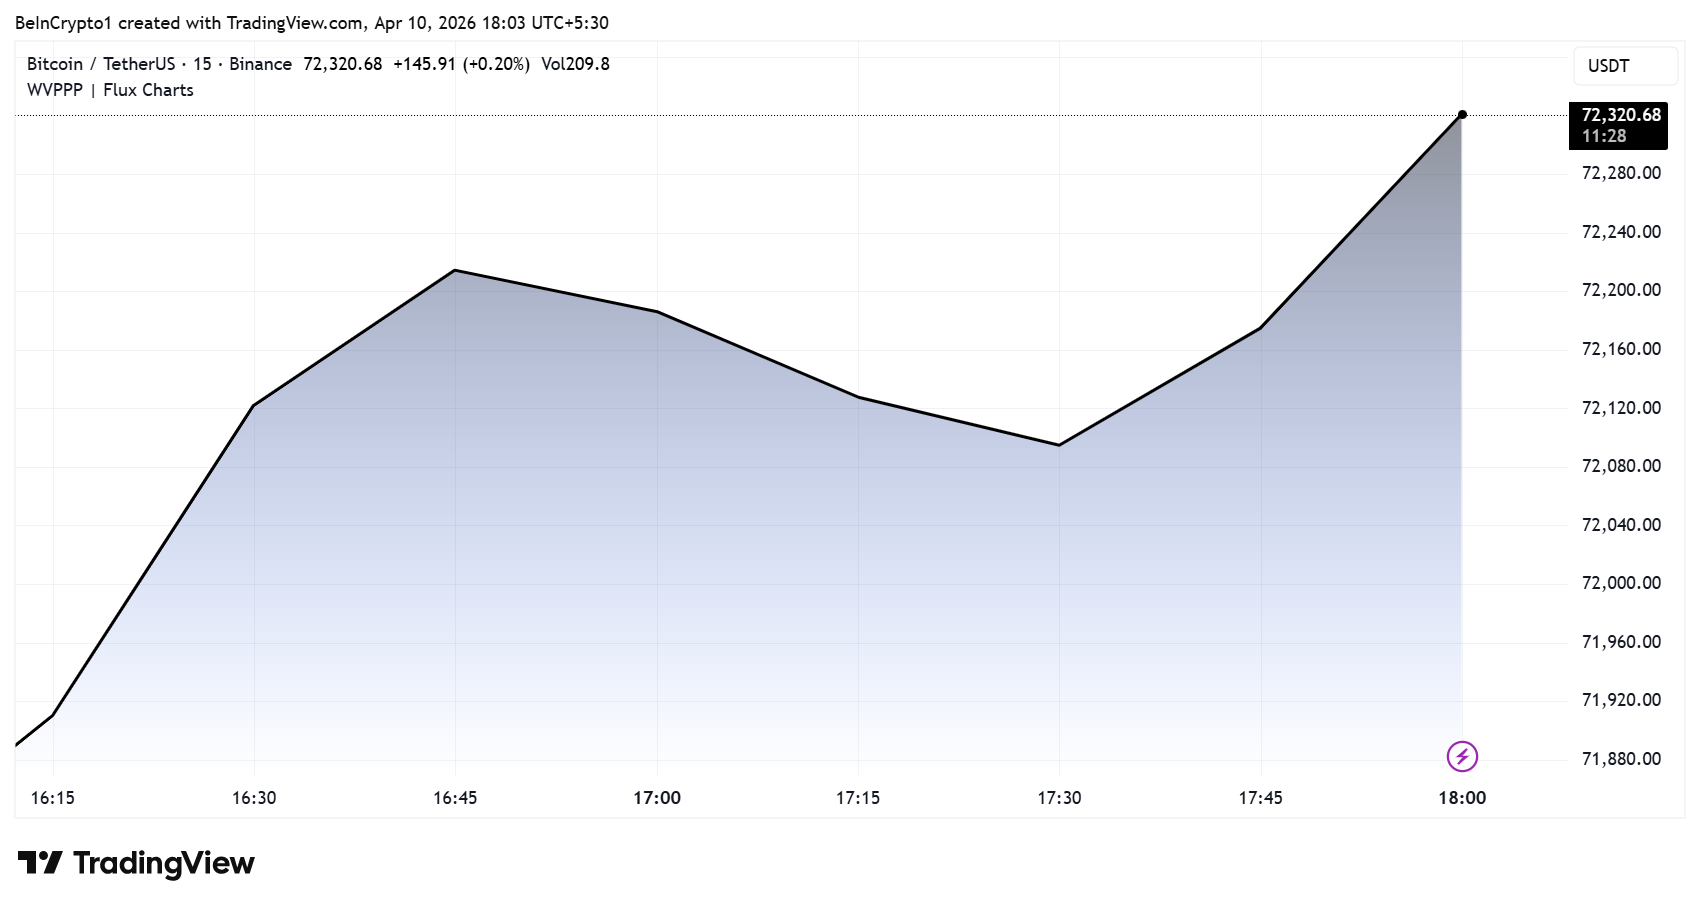
U.S. headline Consumer Price Index (CPI) for March rose 3.3% year-over-year, falling below the median Wall Street forecast of 3.4%. Bitcoin (BTC) responded immediately, climbing above $72,300.
Core CPI, which strips out volatile food and energy prices, printed at 2.6% annually versus the 2.7% consensus. The softer-than-expected readings sent a clear signal through risk markets.
Why Today’s CPI Print Matters More Than the Number
March marked the first inflation report to fully capture the oil price shock tied to the Iran conflict. Crude briefly topped $115 per barrel in early March, pushing U.S. gasoline prices above $4 per gallon for the first time since August 2022.
Wall Street banks, including Bank of America, JPMorgan, and Wells Fargo, had projected headline CPI of 0.87% to 0.99% month over month. The median forecast from Nick Timiraos’ survey sat at 0.90% monthly and 3.3% annually.
However, core inflation told a different story. At 0.26% month-over-month, it printed below most bank estimates, suggesting that the energy shock has not yet bled into broader consumer prices.
Core CPI prints came in cooler than expected despite what has been the biggest jump in energy prices since 2005.
BTC jumped from roughly $71,900 to $72,320 following the data release, with softer core reading reopening speculation that the Federal Reserve may have room to cut rates later in 2026.

However, investors must remain wary of chasing this jump, as the “sell-the-news effect” could see them fall amid exit liquidity driven by expected profit-taking.
Rate-Cut Narrative Shifts
Still, the CME FedWatch tool shows a 98.4% probability the Fed holds rates steady at 3.50%-3.75% at its April 29 meeting. Only 1.6% of traders expect a hike.
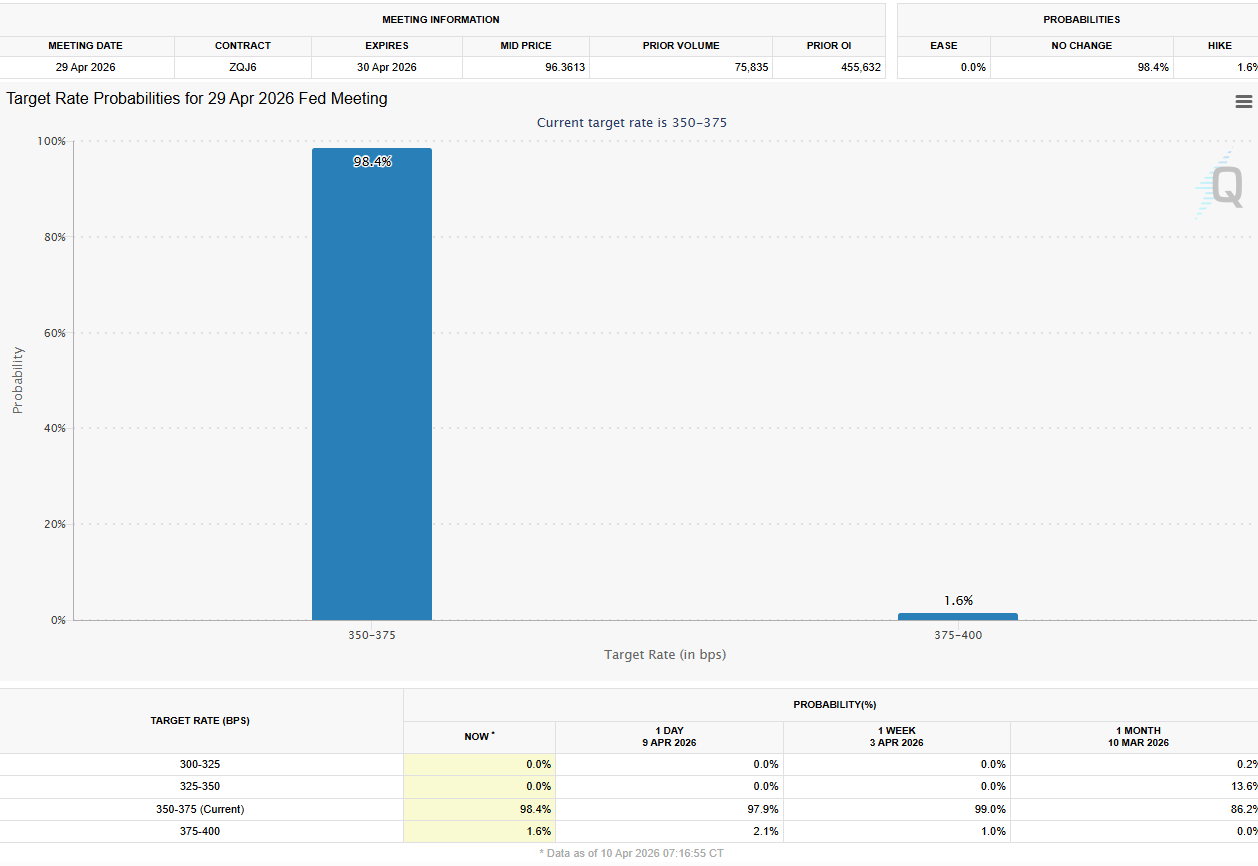
However, traders have added to bets on one Fed interest-rate cut in 2026.
The Fed raised its own 2026 inflation forecast to 2.7% at the March meeting. Seven of 19 policymakers now see zero rate cuts this year.
That hawkish tilt makes today’s cool core reading significant, as it challenges the re-acceleration narrative.
The real question from this print is not whether inflation hit 3.3% or 3.4%. It is whether price pressures are broadening beyond energy or settling into a temporary spike driven by oil.
If core continues to hold below 2.7%, it strengthens the case that the Iran-driven energy shock remains isolated. That distinction will likely determine whether BTC retests $75,000 or fades back toward $67,000 support in the coming weeks.
The post Bitcoin Surges Past $72,000 as U.S. Inflation Misses Wall Street Forecasts appeared first on BeInCrypto.


The DEX aggregator’s $415K treasury will be transferred to the protocol’s development company, along with future revenue.
Cross-chain DEX aggregator Velora has become the latest protocol to see its decentralized autonomous organization (DAO) vs. Labs structure come under pressure.
Today, April 10, Velora, formerly known as ParaSwap, passed PIP-77: Governance Evolution & Operational Alignment, a proposal to wind down its DAO and consolidate operations under Laita Labs, the development company that built the protocol. The proposal passed with 65.8% of voters for and 16.78% against the shift. 17.41% of voters abstained. Voting began on April 5, with Shutter shielding results until voting ended today.
The proposal transfers the roughly $415,000 remaining in the DAO treasury to Laita Labs to settle outstanding infrastructure costs. It also discontinues the DAO’s 20% protocol fee routing, retires the staking program with the exit lockup set to zero so stakers can withdraw immediately, and closes the futarchy governance pilot with approximately $19,000 remaining from its original $50,000 allocation.
Per the proposal, going forward, VLR becomes a governance-only token, with Snapshot reserved for structural decisions such as token migrations, new chain deployments, or activation of the contract’s 2% annual minting mechanism. Meanwhile, protocol operations, infrastructure, and revenue flow exclusively through Laita Labs.
Laita Labs framed the proposal as an alignment with existing reality: staking rewards and fee routing had already been inactive for months, governance participation had declined, and the DAO had primarily functioned as an off-chain signaling layer while the development team kept the protocol running.
Per DefiLlama data, Velora ranks eighth among DEX aggregators by 30-day volume at $2.06 billion, compared to category leader Jupiter’s $11.2 billion.
VLR, which launched in September of last year, is down 99% from its high of $0.06 just after launch.
Community Response
The proposal didn’t pass without community pushback. In the proposal discussion, community member VeloCryptor, who said they have been staking since day one, proposed three compromises, namely a smaller 5-10% revenue share, a treasury buyback reserve, or a conditional sunset tied to revenue staying low for another 6-12 months.
Laita responded by rejecting all three suggestions, saying even a partial share “brings back the same complexity we’re trying to move away from.”
Another community member, 12342, argued the proposal “shifts the token from something that had a clear economic alignment with the protocol’s success into a pure governance token with no direct value capture.” Supporter citizen42 backed the team, calling it “not a sunset, it will be a sunrise.”
Another community member, 12342, said in the proposal discussion that they are “strongly against this proposal,” arguing that it “shifts the token from something that had a clear economic alignment with the protocol’s success into a pure governance token with no direct value capture.”
A separate response to the proposal from citizen42 was more positive: “I have faith in Laita that when time comes value will return to token holders, in the meantime all in for operational simplicity.”
DAO vs Labs Model Under Pressure
The vote arrives as the DAO vs. Labs governance model shows cracks across DeFi. At Aave, a months-long dispute over fee distribution between tokenholders and Aave Labs spiraled into a full-blown contributor exodus. Most recently, Chaos Labs became the third core contributor to exit Aave in two months, following BGD Labs and the Aave-Chan Initiative, all citing governance misalignment.
At Balancer, a restructuring proposal published in March formalized the wind-down of Balancer Labs OÜ and consolidated all activity under a BVI entity operating as a direct agent of the DAO, slashing the team and cutting the annual operating budget by 34%.
Meanwhile, last month, DAO governance platform Tally shut down after six years, with its CEO citing reduced demand for DAO tooling as regulatory pressure eased.
This article was written with the assistance of AI workflows. All our stories are curated, edited and fact-checked by a human.

IREN Stock Surges 8% as Bitcoin Miner Turns AI Cloud Powerhouse With 150,000 GPU Expansion Push

Usher, Chris Brown Excite Fans With Joint Tour: ‘OMG’
Colm Cavanagh: Tyrone are suffering from an identity crisis and will need A-game to beat Armagh


-

 Business5 days ago
Three Gulf funds agree to back Paramount’s $81 billion takeover of Warner, WSJ reports
-

 Sports6 days ago
India men’s 4x400m and mixed 4x100m relay teams register big progress | Other Sports News
-

 Politics5 hours ago
US brings back mandatory military draft registration
-

 Business7 days ago
Expert Picks for Every Need
-

 Tech3 days ago
How Long Can You Drive With Expired Registration? What Florida Law Says
-

 Fashion5 hours ago
Weekend Open Thread: Veronica Beard
-

 Business6 days ago
No Jackpot Winner, Prize to Climb to $231 Million
-

 Fashion5 days ago
Massimo Dutti Offers Inspiration for Your Summer Mood Board
-
 Sports6 hours ago
Man United discover Nico Schlotterbeck transfer fee as defender reaches Dortmund agreement
-

 Fashion3 days ago
Let’s Discuss: DEI in 2026
-

 Crypto World2 days ago
Bitcoin recovers as US and Iran Agree a Ceasefire Deal
-

 Business6 days ago
Akebia Therapeutics, Inc. (AKBA) Discusses Pipeline Progress and Strategic Focus on Kidney Disease Treatments at R&D Day – Slideshow
-

 Business2 hours ago
Tesla Model Y Tops China Auto Sales in March 2026 With 39,827 Registrations, Beating Cheaper EVs and Gas Cars
-

 Crypto World1 day ago
Canary Capital Files SEC Registration for PEPE ETF
-

 Politics7 days ago
The UK should not pay a penny in slavery reparations
-

 Business11 hours ago
OpenAI Halts Stargate UK Data Centre Project Over Energy Costs and Copyright Row
-

 Tech5 days ago
Samsung just gave up on its own Messages app
-

 Tech5 days ago
Haier is betting big that your next TV purchase will be one of these
-

 Tech5 days ago
The Xiaomi 17 Ultra has some impressive add-ons that make snapping photos really fun
-

 Tech5 days ago
Gamer Restores the Original PlayStation Portal From Two Decades Ago
You must be logged in to post a comment Login