
Crypto World
Bitcoin’s Next Move May Hinge on U.S. Credit and Debt Conditions

Bitcoin (CRYPTO: BTC) dipped below $73,000 on Tuesday as a confluence of tightening credit conditions and elevated debt costs test market nerves. The macro backdrop shows a paradox: credit spreads remain compressed even as debt levels and borrowing costs stay elevated, a dynamic some analysts say could define BTC’s trajectory over the coming months. In this environment, an intriguing pattern emerges: the gap between credit pricing and actual credit-market stress has become a potential predictor for Bitcoin’s next move, echoing how similar dislocations played out in prior cycles.
Key takeaways
- The ICE BofA US Corporate Option-Adjusted Spread is at 0.75, its lowest level since 1998.
- US debt stands at about $38.5 trillion, while the 10-year Treasury yield is hovering near 4.28%.
- Bitcoin whale inflows to exchanges have risen, but on-chain profit-taking is easing despite the higher turnover on centralized venues.
- Historical cycles show BTC often forms a local bottom several months after credit spreads widen, a pattern that could repeat if liquidity tightens further.
- Analysts have signaled that a renewed accumulation phase could unfold in the months ahead, potentially after a period of market stress becomes more visible.
Market context: The current setup places Bitcoin at a crossroads where tight credit conditions and escalating debt costs contrast with a risk-off tilt in broader markets. The macro backdrop remains complex: while spreads compress, signaling relatively contained credit risk by some measures, the debt burden and the path of yields continue to constrain liquidity and appetite for risk assets, including BTC. This divergence—cheap-ish credit against a backdrop of financial strain—has historically preceded pronounced price moves for Bitcoin, underscoring why market participants are watching the bond and credit markets as a leading indicator for crypto trajectories. For reference, the data point often cited is the ICE BofA Corporate OAS, which has been moving in a way that ties into Bitcoin’s price rhythms during stress episodes.
In previous cycles—2018, 2020 and 2022—Bitcoin tended to bottom after credit spreads began to widen, with the delay ranging roughly three to six months. The suggestion of a lag between financial-market stress and crypto-price bottoms has resurfaced as traders parse the current dislocation. Some analysts have argued that if liquidity tightens further and spreads rise, Bitcoin could enter another phase of accumulation before broader market stress becomes fully evident. For instance, commentary from Alphractal founder Joao Wedson highlighted the potential for an accumulation phase if liquidity conditions deteriorate and credit spreads widen in the months ahead, a scenario that could set the stage for a multi-month consolidation before fresh directional moves. Argued.
Bitcoin whale activity and on-chain dynamics
Over the past few days, on-chain data show a spat of activity that peers at broad selling pressure yet also hints at longer-term fatigue among holders. Analysts have observed intensified transfers of BTC from large wallets to centralized exchanges, including a notable spike when wallets holding more than 1,000 BTC deposited roughly 5,000 BTC on a single day—an amount that mirrors a similar spike seen in December. The pattern of inflows from high-value wallets has raised questions about near-term selling pressure, especially amid a broader market lull.
In parallel, a broader cohort—holders in the six- to twelve-month age category—also moved 5,000 BTC to exchanges, marking the largest inflow from this segment since early 2024. Yet despite these near-term inflows, a counterpoint is evident: long-term holder behavior appears less aggressive, with spending output profit ratio (SOPR) sliding toward 1, its lowest reading in a year as BTC tested a year-to-date low near $73,900.
The tension between supply-side selling signals and longer-term holder exhaustion is a focal point for traders trying to gauge whether price weakness will endure or consolidate into a base. SOPR’s retreat toward equilibrium suggests fatigue among sellers in the longer horizon, a sign that a more durable bottom might require additional macro catalysts or clearer liquidity signals. The data, including real-time movement patterns and on-chain profitability metrics, remains a key input for analysts weighing the likelihood of a new accumulation window amid ongoing macro stress.
In the broader lens, the trend of exchange inflows paired with mixed on-chain signals mirrors what happened in prior cycles: weakness in price often coincides with attempts at price discovery amid shifting risk sentiment. The bond market’s stress indicators—how spreads widen or compress—tend to precede or align with crypto-market inflection points in ways that traders have tracked for years. As yields remain elevated and debt continues to accrue, the path of least resistance for Bitcoin may hinge on whether liquidity tightens enough to widen credit spreads, thereby unlocking a new phase of accumulation that could endure into the latter half of the year.
Looking ahead, investors will be watching two intertwined channels: the projected movements in credit-spread dynamics, and the cash-flow environment that governs risk appetite more broadly. If spreads begin a sustained widening trend, and liquidity tightens toward the 1.5%–2% range in coming weeks and months, BTC could see more pronounced bottom-building dynamics. Conversely, if credit conditions stay contained while yields drift higher, the downside might be tempered, and the market could pivot toward a range-bound phase that emphasizes accumulation rather than rapid sell-offs. The narrative remains contingent on macro developments, but the structural data—ranging from the debt mountain to the nuanced behavior of large BTC holders—provides a framework for parsing the next leg of the BTC story.
Why it matters
The observed disconnect between credit pricing and underlying market stress matters because it feeds into a broader risk-management framework for crypto investors. When traditional markets signal rising caution through widening stress or tighter liquidity, crypto assets can behave as a leveraged proxy—at times drawing demand from hedging flows, at other times succumbing to capitulation. The current data set—debt totals, yield levels, and evolving on-chain activity—offers a lens into how Bitcoin might respond as macro signals evolve. For users and builders in the ecosystem, the takeaway is to monitor liquidity proxies alongside price action, recognizing that a sustained shift in credit conditions could precede meaningful regime changes for BTC and related assets.
At the same time, the data remind market participants that crypto markets are not isolated from macro forces. Central bank policy expectations, debt dynamics, and financial-market stress indicators continue to weave a complex tapestry that shapes capital allocation. Understanding these interconnections can help traders anticipate whether the coming months will favor accumulation, consolidation, or renewed volatility as global liquidity conditions adapt to shifting fiscal and monetary landscapes.
What to watch next
- Watch credit-spread movements toward the 1.5%–2% range through April, which could precede renewed BTC downside or a gradual bottoming process.
- Monitor the trajectory of US debt and the 10-year yield, especially any sustained retreats or surprises that could alter liquidity dynamics.
- Track on-chain SOPR levels and exchange-inflow patterns, especially among holders in the six- to twelve-month window, for signs of seller exhaustion or renewed demand.
- Look for a potential accumulation window after July 2026, as suggested by macro-cycle analyses that link credit stress to longer-term price basins.
Sources & verification
- ICE BofA US Corporate Option-Adjusted Spread data and related macro signals (BAMLC0A0CM) from the Federal Reserve’s data repository.
- U.S. debt levels and the 10-year Treasury yield data points reflecting the January-end totals and current yields.
- CryptoQuant insights on whale and holder activity and SOPR trends used to interpret near-term market dynamics.
- Analyst commentary on liquidity and bond-market stress scenarios that inform Bitcoin’s potential accumulation phase.
Market reaction and macro signals shaping BTC trajectory
Bitcoin (CRYPTO: BTC) has moved to test new support near the lower end of its recent range as macro indicators paint a mixed picture for risk assets. The corporate credit market continues to offer a strange juxtaposition: spreads are tight on the surface, yet the debt landscape remains heavy, and yields persist in a tight corridor. This bifurcation creates a testing ground for BTC, where a failure to sustain prices could reflect broader risk-off dynamics, while a stabilization or rebound could indicate the onset of an accumulation period as liquidity conditions slowly improve, or at least stop deteriorating.
Historical context provides a framework for interpretation. In past cycles, periods of widening credit stress often preceded a trough in BTC prices by a few months, followed by a phase of quiet accumulation as investors waited for clearer macro direction. The present discussion centers on whether current signals will produce a similar pattern or whether a new regime will emerge where BTC acts more as a hedge against macro risk rather than a tradable risk-on asset. The ongoing debate among market observers highlights a spectrum of possible outcomes, with some arguing that the next leg could hinge on how the bond market absorbs liquidity stress, while others point to on-chain signals that may foretell a more durable bottom forming in the months ahead.
The conversation also touches upon practical implications for market participants. If liquidity tightens and spreads widen, Bitcoin could see renewed volatility as traders reposition portfolios to weather the stress. If, on the other hand, the stress signals abate and the price finds support, the market could shift toward gradual accumulation—a phase that has historically offered a quieter backdrop for long-term investors to build positions. The data and commentary from industry analysts keep bridging macro indicators with on-chain realities, providing a nuanced view of the evolving crypto-market landscape.

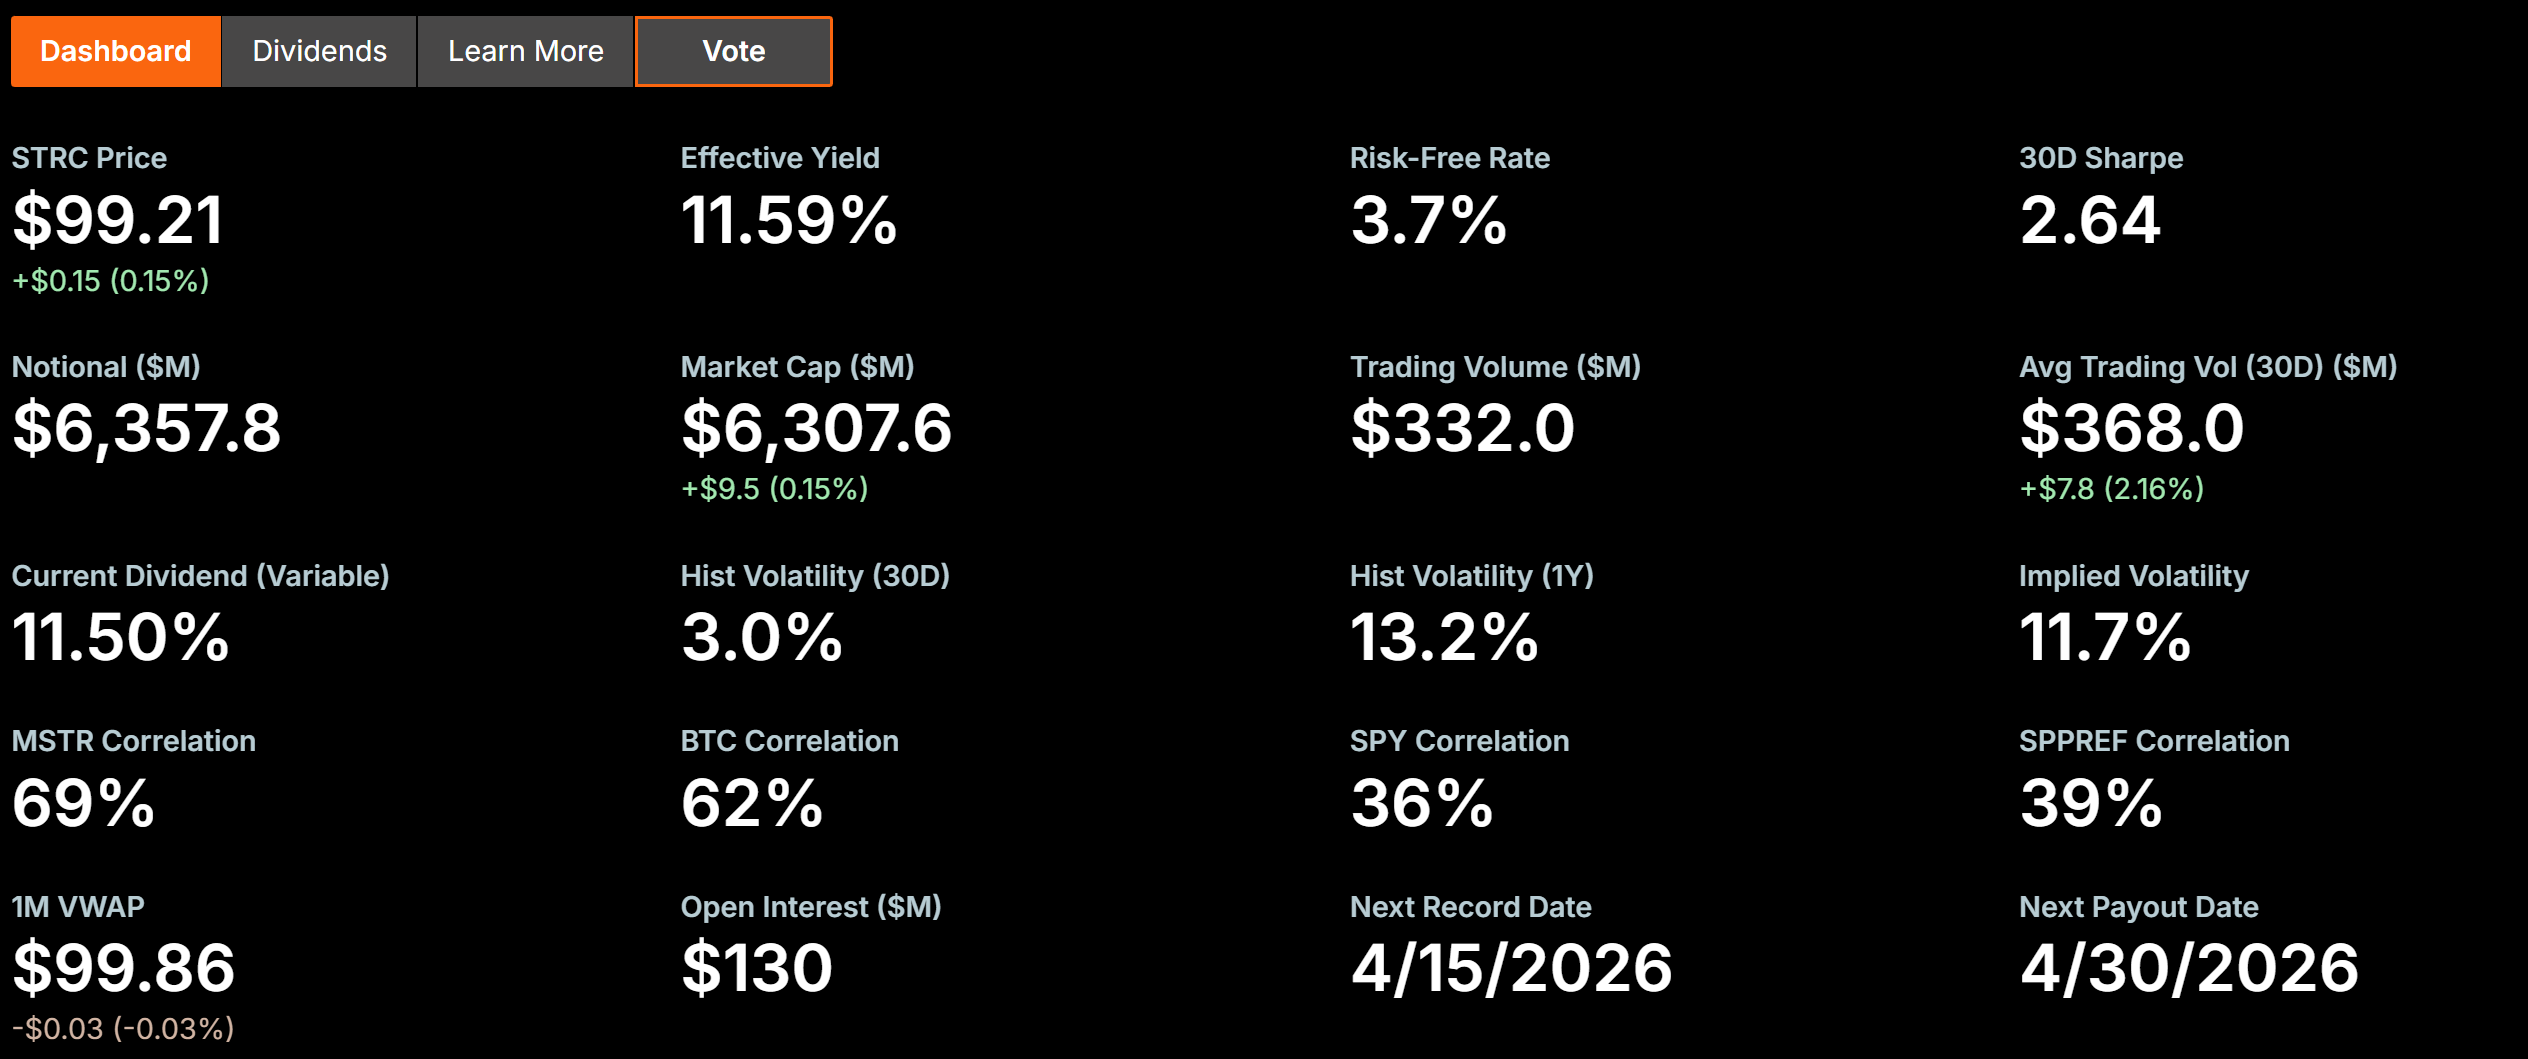
MicroStrategy (now Strategy) has proposed switching its Stretch preferred stock (STRC) from monthly to semi-monthly dividend payments. The change would double payout frequency while keeping the annualized 11.5% rate unchanged.
The company filed a preliminary proxy on April 17, 2026. Shareholders will vote at the annual meeting on June 8.
Why MicroStrategy Wants to Pay STRC Semi-Monthly Dividends
Under the current monthly schedule, STRC experiences predictable ex-dividend price drops. Each cycle creates a dip as holders sell after receiving payments. A recovery follows as buyers chase the next yield window.
Semi-monthly payouts would cut each individual dividend in half. Smaller, more frequent distributions should reduce those swings.
Strategy says the move is designed to stabilize price near $100 par, dampen cyclicality, and improve liquidity.
STRC has already shown declining volatility since its July 2025 launch. The 30-day measure dropped from roughly 13% in its early months to about 2.1% recently.
The stock traded near $99.21 with an effective yield of approximately 11.59%.
What STRC Holders Should Know
If approved, the first semi-monthly record date would be June 30, 2026. The first payment under the new schedule is expected on July 15. Total annual dividend obligations remain identical.
Strategy currently has about $6.35 billion in outstanding STRC notional value. The company uses STRC proceeds to purchase Bitcoin (BTC), adding to its treasury of more than 762,000 coins.

Voting opens around April 28. Shareholders of record as of April 17 can participate through the definitive proxy materials on Strategy’s website.
The post MicroStrategy Pushes 2x Monthly Payouts for STRC Holders appeared first on BeInCrypto.

Wrapped XRP went live on Solana on Friday, issued by custodian Hex Trust and bridged through LayerZero, making the token available inside Solana’s DeFi apps for the first time.
XRP holders can now use the wrapped asset on Jupiter, Phantom, Titan Exchange, and Meteora without selling their underlying position.
Each wXRP is backed 1:1 by native XRP held in segregated custody accounts and is redeemable at any time, according to Hex Trust.
The Solana launch is one leg of a broader rollout Hex Trust disclosed in December 2025, which also targets Ethereum, Optimism, and HyperEVM. The move fits a pattern that has accelerated through 2025 and 2026, where tokens that started their life on one chain are being bridged to others to capture yield and liquidity that did not exist at launch.
XRP has historically functioned as a payment-rail token settled directly on the XRP Ledger. Solana has built the opposite use case, a throughput-optimized smart contract platform where the DeFi and memecoin activity actually lives.
The piece of infrastructure underneath this deal is LayerZero, the cross-chain messaging protocol that has quietly won most of the bridge volume that used to flow through Wormhole, Nomad, and Ronin before those protocols were exploited for more than $1 billion combined between 2022 and 2024.
Whether XRP generates meaningful DeFi volume on Solana is a separate question. The wrapped asset is live, but the test is whether holders actually use it.
Crypto World
co-founder Joseph Lubin warns of the dangers of AI being controlled by a few big tech firms


Crypto’s next major inflection point is coming from artificial intelligence (AI).
That’s according to Consensys CEO and Ethereum co-founder Joseph Lubin. He told CoinDesk that autonomous or semi-autonomous agents can transact, coordinate and verify one another on decentralized networks, using crypto rails as a foundation for machine-driven activity.
Lubin, who will be speaking at Consensus Miami 2026 next month, said he is “sympathetic to the idea that blockchain is for machine intelligences,” but does not see humans being displaced. Instead, increasingly intelligent interfaces will abstract away complexity, allowing users to interact with crypto systems through intent rather than manual inputs. In that model, AI becomes the intermediary layer between people and protocols.
That vision comes with risks. If AI infrastructure remains concentrated among large technology firms, “we could be in trouble,” Lubin warned. He argued that decentralized systems and cryptography will be essential in ensuring accountability, enabling machines to “check on one another” in transparent, verifiable environments.
Within that broader shift, products like MetaMask — a Consensys product — are evolving to reflect the change. Lubin said the wallet is being rebuilt as “a new kind of neobank that you own and control,” part of a transition toward what he described as a “personal money operating system.” AI-powered agents could act on behalf of users, managing assets, executing transactions and navigating a growing decentralized economy. “You can walk around with your personal financial system in your pocket,” he said.
The rise of corporate chains on Ethereum
Beyond interfaces, Lubin pointed to structural changes across the Ethereum ecosystem. The architecture of the blockchain is also shaping how institutions approach adoption. Lubin expects “corporate chains” to become more common as companies seek higher throughput and greater control over their infrastructure. Still, he argued that assets are best issued on Ethereum’s base layer, saying “the best way to ensure that an asset is durable… is to mint it on Ethereum layer one,” even if the asset is later used across other networks.
Stablecoins, one of crypto’s fastest-growing sectors, are part of that transition, but not the endpoint. Lubin described them as a “stepping stone” toward more fully decentralized financial systems, noting that current models remain heavily reliant on centralized issuers. Over time, he expects growth in decentralized collateral to enable more robust, crypto-native forms of money.
On tokenization more broadly, Lubin suggested that traditional finance and decentralized finance are entering a period of convergence, combining centuries of financial innovation with newer blockchain-based systems. The result, he said, will be a more granular and programmable global economy.
Even as these shifts accelerate, Lubin struck a measured tone on longer-term technical risks like quantum computing. While not an immediate concern, he said Ethereum developers have been preparing for years.
“A lot of us just see it as being folded into the natural evolution of Ethereum,” Lubin said.
Read more: Joe Lubin claims DeFi is as safe as traditional finance, adding that bitcoin is in crisis
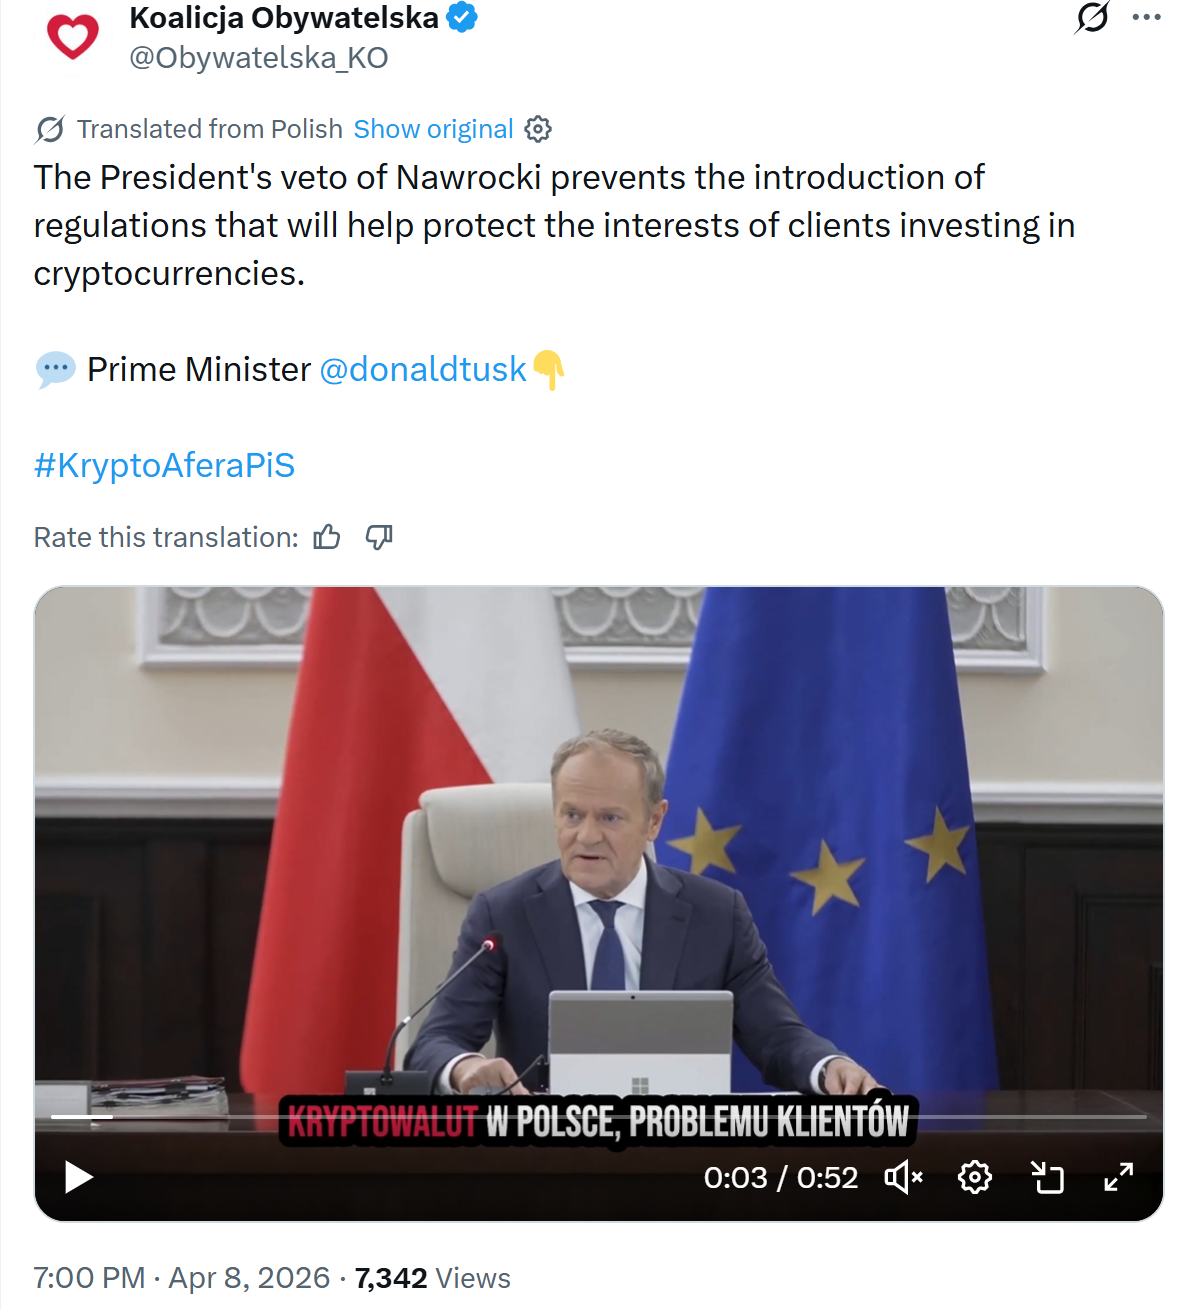
Poland’s parliament has once again failed to overturn a presidential veto blocking a key crypto regulation bill, extending the political standoff over how the country should oversee digital assets.
In a vote held Friday, lawmakers fell short of the 263 votes required to override the veto issued by President Karol Nawrocki, local outlet TVP World reported. A total of 243 MPs voted against the veto, while 191 supported it, per the report.
The bill, backed by Prime Minister Donald Tusk, aims to align Poland with the European Union’s Markets in Crypto-Assets Regulation (MiCA), introduced in 2024 to govern the issuance and custody of crypto assets. Poland remains the only EU member state yet to implement the bloc’s framework.
Nawrocki has defended his decision, citing concerns over excessive regulation, limited transparency and the potential burden on small businesses, according to the TVP World report.
However, government officials warn that delaying regulation leaves investors exposed. Finance Minister Andrzej Domański reportedly said the absence of clear rules risks turning the market into an “El Dorado for fraudsters,” adding that both consumers and businesses remain vulnerable to abuse.
Related: Zonda exchange says 4.5K BTC wallet inaccessible amid withdrawal crisis
Poland’s crypto bill faces repeated defeats
The failed overturn of the presidential veto marks the second unsuccessful attempt by the government to push the legislation through after a similar rejection in December.
However, despite the failure, Polish lawmakers reintroduced the regulation within days in December last year. They claimed that the new draft was an “improved” version, though critics said it was virtually unchanged from the original.

President Nawrocki vetoed the bill again in February this year. “I will not sign a wrong law just because it was passed again by the parliamentary majority. A wrong law that passed a hundred times still remains a wrong law,” he said at the time.
Related: Poland president vetoes MiCA bill again as crypto companies look to license abroad
Zonda caught in Poland crypto political row
The dispute has also drawn in Zonda, the country’s largest crypto exchange, which has reportedly lobbied against the bill. Tensions escalated after Tusk accused the platform of links to illicit funding, citing intelligence reports that allegedly connect its origins to Russian criminal networks.
“Attempts to drag me and Zonda into the current political squabbles are as absurd as they are harmful to the Polish innovation market,” Zonda CEO Przemysław Kral wrote on X, adding that he is “compelled to take appropriate legal steps to protect my personal rights.”
Last week, he also said he does not control access to a crypto wallet reportedly holding $330 million, which he claims remained with former CEO Sylwester Suszek prior to his disappearance in 2022.
Magazine: Bitcoin may take 7 years to upgrade to post-quantum — BIP-360 co-author

Ethereum’s ether (ETH) continued its ascent, trading near $2,400 after a rally that lifted the token about 38% from a swing low around $1,750. The move appears to be accompanied by a notable shift in on-chain activity and a growing cohort of long-term holders, prompting questions about whether this is a momentum bounce or the start of a structural shift in ETH demand.
On-chain data underpinning the move show a broad set of signals aligning with a more persistent bullish thesis. Daily active addresses surged 89% to 730,278 on April 5, up from 384,763, indicating heightened user interaction with the network as prices moved higher. In accumulation, inflows have intensified since mid-2025, reaching an all-time high of about 1.14 million ETH in November 2025. In 2026, daily inflows have averaged around 200,000 ETH, with a single-day spike surpassing 358,000 ETH on a recent Thursday. The stock of ETH held by accumulation addresses has grown by 6.5 million ETH to 26.16 million from 19.64 million on Jan. 1, a roughly 33% increase, suggesting rising conviction among long-horizon holders.
In parallel, staking dynamics reinforce the longer-term outlook. Data from Dune Analytics indicate that the total value of ETH staked stands at about 39.2 million ETH, reflecting a sizable base of capital committed to Ethereum’s proof-of-stake roadmap. At the same time, the supply of ETH on centralized exchanges has declined to multi-year lows, tightening liquidity on order books and potentially amplifying upside momentum if demand persists.
Key chart patterns point to higher targets
From a technical standpoint, ETH has formed a cup-and-handle pattern that could resume a bullish trajectory. A 12-hour close above the cup’s neckline near $2,400 would keep the uptrend intact, with the measured target defined by adding the cup’s depth to the breakout point approaching around $2,960 — roughly a 22% gain from current levels. A larger, ongoing cup-and-handle formation suggests a more ambitious target near $3,150, about 30% higher than present prices. The relative strength index has risen to around 68, indicating bulls are back in control without the market yet entering overbought territory.
“If the cup and handle pattern continues, I think we get to the golden zone next.”
Analysts have highlighted that this broader formation could signal a substantial move if it remains intact. The Skayeth, a trader known for chart observations on X, has noted that ETH appears to be setting up for a massive move as the pattern unfolds, adding fuel to the bullish narrative for traders watching the cup-and-handle geometry unfold in real time.
In practical terms, bulls will want to defend the $2,350–$2,400 zone to confirm a sustained breakout. If price action can close decisively above $2,400, the path toward higher targets becomes more credible, with market observers pointing to potential moves toward the $2,800 level and beyond toward roughly $3,050 if momentum remains with buyers.
These on-chain and technical signals align with the broader narrative that on-chain accumulation, rising staking activity, and tightening exchange liquidity could underpin a more durable ETH bid in the weeks ahead. The convergence of these data points—sustained address activity, persistent inflows into accumulation wallets, and a sizable stake base—helps explain why many market participants are framing this rally not merely as a bounce, but as part of a broader re-pricing of ETH’s risk premium and growth trajectory.
Still, the path forward hinges on several open questions. Will ETH maintain the breakout above the critical neckline, and how will macro liquidity and regulatory developments influence demand for staking and on-chain activity? While the current data paint a constructive picture, investors should watch for how the pattern holds in the face of shifting market risk sentiment and evolving market structure in the crypto ecosystem.
According to Cointelegraph, a close above the $2,400 level could bolster the case for ETH advancing to around $2,800 and later toward $3,050 if the momentum persists. As such, eyeing the $2,350–$2,400 region for sustained strength will be a key near-term signal for traders assessing risk and potential upside.
What to watch next is whether ETH can sustain a breakout beyond the neckline amid the interplay of on-chain accumulation, staking flows, and macro liquidity. If price action falters, the same signals that foreshadowed the rally—rising DAA, growing accumulation, and a tightening liquidity profile—will be the first to deteriorate and could limit upside in the near term.
Looking ahead, the crucial question remains: can ETH hold above the immediate support zone and carry the momentum into the next phase of the pattern, or will the market retreat test the strengths of the accumulation and staking thesis that underpins this rally?

TLDR:
- XRP’s SuperTrend flip signals a trend shift, with traders watching the $1.55 resistance level closely.
- Spot XRP ETFs lead in AUM, showing stronger investor demand compared to futures-based products.
- Franklin Templeton offers the lowest ETF fee at 0.19%, increasing competition among issuers.
- The XRP ETF market remains open, with no dominant leader as inflows are spread across providers.
XRP is gaining renewed market attention as technical indicators turn positive and institutional products expand. Recent data shows an improving price structure alongside growing ETF activity, with capital flows and fee competition shaping an early-stage market still searching for clear leadership.
XRP Trend Shift Meets Key Resistance
A recent post by Ali Charts noted a change in XRP’s technical outlook. The SuperTrend indicator flipped bullish on the daily chart for the first time since January 17. This shift follows months of sustained selling pressure.
The signal points to a possible trend reversal, although price confirmation remains essential. According to the same update, the $1.55 level stands as the immediate resistance. XRP has struggled to break above this zone in recent attempts.
A clean daily close above $1.55 could open the path toward a relief rally. The projected upside target sits near $1.90 if momentum continues. At the same time, the SuperTrend now acts as a trailing support level.
Price movement across XRP-linked exchange-traded products supports this trend. Most ETFs recorded gains between 1.3% and 2.6% during the same period. This alignment suggests consistent tracking and reflects broader market direction.
While the bullish signal is clear, the resistance level remains a short-term test. Market participants are watching closely for confirmation before positioning for further upside.
ETF Competition Builds as Fees and Structure Shape Flows
Alongside price action, XRP’s ETF ecosystem is expanding with multiple issuers entering the market. The current landscape shows a close race among providers, especially in assets under management.
Bitwise and Canary Capital lead the segment, each managing close to $287 million. Their near-equal standing shows that investor flows are still divided. No single issuer has taken control of the market.
Franklin Templeton follows with about $233.9 million, while 21Shares holds roughly $157.4 million. These firms remain competitive but trail the leading pair. Differences in timing and distribution may explain the gap.
Futures-based ETFs, including Teucrium and Volatility Shares, hold smaller shares of the market. Their assets stand at $114.6 million and $106.9 million, respectively. These products rely on derivatives rather than direct exposure.
Investor preference appears to favor spot ETFs over futures structures. Spot funds provide direct price exposure, which tends to attract long-term capital. Futures products often face higher operational costs.
Fees also play a central role in shaping demand. Franklin Templeton offers the lowest fee at 0.19%, positioning itself aggressively. Bitwise and 21Shares remain in a competitive range at 0.34% and 0.30%.
In contrast, Canary Capital charges 0.50%, while futures products carry higher costs. Teucrium’s fee reaches 1.89%, making it the most expensive option. These differences can influence long-term investor decisions.
The ETF market remains open, with no dominant leader yet. Capital continues to rotate as investors compare cost structures and exposure types. At the same time, participation from established asset managers signals broader institutional engagement.
XRP now sits at the intersection of technical recovery and expanding financial products. Price levels and ETF flows will likely guide the next phase of market direction.


Supreme Court news broke Friday as sources close to both justices confirmed to CBS News that neither Justice Samuel Alito nor Justice Clarence Thomas plans to retire this year, ending months of speculation that Trump might be able to lock in a fourth Supreme Court appointment before the November midterms.
Summary
- Alito, 76, has already hired all four law clerks for the upcoming annual term and intends to continue serving into at least 2027, sources close to the justice told ABC News, while Thomas, 77, the court’s longest-serving current member, is also expected to remain on the bench.
- The decision removes from the table what would have been a high-profile, high-stakes confirmation battle in an already compressed pre-midterm legislative calendar where Republicans are managing reconciliation, FISA, and multiple other priorities simultaneously.
- Trump told Fox Business this week that he is “prepared” to name two or three replacements if vacancies open, adding: “It could be two, could be three, could be one. I don’t know. I’m prepared to do it.”
Supreme Court news that both Alito and Thomas will remain on the bench removes the single biggest potential variable from the 2026 political calendar. A vacancy would have triggered a confirmation battle before a Senate that is already managing a compressed schedule and a hostile midterm environment. Republican leaders would have had to move through hearings, floor debate, and a party-line vote while simultaneously advancing the Big Beautiful Bill reconciliation package, the CLARITY Act markup, a full FISA reauthorization, and multiple other priorities.
Alito briefly had a health scare in March when he was hospitalized for dehydration after falling ill at a Philadelphia event. That episode renewed speculation he might step down. Sources told ABC News that despite that episode, he has remained active in the court’s work and hired his full complement of clerks for next term.
Trump raised the Ruth Bader Ginsburg comparison explicitly this week in his Fox Business interview, noting that she had declined to retire when she might have been replaced by a like-minded justice and then died while Trump was president, enabling the appointment of a conservative successor. “She really hurt herself within the Democrat Party,” he said.
The political logic is direct: Alito is 76 and Thomas is 77, both within four years of the average retirement age of 80 for justices since 2000. If Republicans lose the Senate in November, the next time they would likely hold both the White House and the Senate could leave both men well into their 80s. Stephen Breyer faced the same argument and ultimately retired in 2022 at 83 under Democratic pressure.
What Staying Put Means for the Court’s Balance
The 6-3 conservative supermajority remains intact regardless of what either justice decides. No replacement appointment changes the court’s ideological composition. What a vacancy would have done is extend Trump’s personal imprint on the court from three appointments to four or five, locking in that influence for potentially another generation.
The absence of a vacancy also matters for the Senate majority’s focus. Every week consumed by a confirmation battle is a week not available for the CLARITY Act markup, stablecoin legislation, or any other major crypto policy milestone that depends on Senate floor time. The compressed legislative gridlock that has already stalled crypto reform repeatedly would have become significantly worse under the weight of a Supreme Court confirmation.


Circle launched CPN Managed Payments on April 8, a fully managed stablecoin settlement solution that makes the Circle Payments Network accessible to banks, payment service providers, and fintechs without requiring them to manage digital assets, custody infrastructure, or blockchain operations directly.
Summary
- Partners interact entirely in fiat while Circle manages the complete digital asset lifecycle including USDC minting and burning, payment orchestration, compliance controls, and blockchain infrastructure, reducing the adoption barrier for institutions that lack crypto licenses or technical capacity.
- USDC has supported more than $70 trillion in total on-chain settlement since inception, with on-chain transaction volume approaching $12 trillion in the final quarter of 2025 alone, giving the network a scale foundation that new entrants join rather than build.
- Launch partners exploring the settlement use cases include global payment companies Veem, Thunes, and Worldline, with Circle managing the technical and regulatory complexity that has blocked most banks from accessing stablecoin rails directly.
Circle Payments Network’s new CPN Managed Payments offering solves the adoption problem that has kept most financial institutions on the sidelines of stablecoin settlement. Banks want faster, cheaper cross-border payments. They do not want to apply for crypto licenses, build custody systems, manage USDC wallets, or navigate compliance frameworks they do not yet have. CPN Managed Payments takes all of that off their plate.
“With CPN Managed Payments, we’re simplifying how institutions adopt and scale stablecoin payments,” said Nikhil Chandhok, Circle’s chief product and technology officer. “By combining issuance, liquidity, compliance, and programmable infrastructure into a unified solution, we are enabling financial institutions to embed stablecoin settlement into their existing payment stacks with enterprise-grade reliability and operational readiness.”
A payment service provider or fintech connects to the Circle Payments Network through a single integration. From that point, it sends and receives in fiat. Circle converts on the backend: minting USDC on the sending side, routing it across the blockchain, and burning it on the receiving side, with the beneficiary institution receiving local currency. The entire digital asset lifecycle, including compliance checks, chain routing, and liquidity management, runs inside Circle’s infrastructure.
The platform is composable by design. Institutions can begin with the fully managed model and gradually take on more direct ownership of USDC wallets and settlement infrastructure as their internal capabilities develop. The product is licensed through Circle Internet Financial, LLC, a registered Money Transmitter and BitLicense holder in New York. Circle holds money transmission licenses in 46 US states along with electronic money institution authorizations in Europe and Singapore.
Why the Timing Matters
The launch landed alongside White House and congressional activity on stablecoin regulation. The GENIUS Act and ongoing CLARITY Act discussions have both addressed how stablecoin yield and reserve backing should be structured, with CPN’s launch providing regulators with a functioning institutional settlement product as a reference point for what compliant stablecoin infrastructure actually looks like in practice.
Circle has positioned USDC explicitly as a compliance-first stablecoin, distinguishing it from offshore issuers like Tether. That positioning is central to its institutional pitch: banks and payment companies operating inside regulatory frameworks need a counterparty that shares the same operating environment. Thunes deputy CEO Chloé Mayenobe said the partnership allows the company to “seamlessly bridge traditional banks, mobile wallets, and digital assets,” creating what she described as “interoperability at scale.”
What It Means for the US Stablecoin Market
CPN Managed Payments arriving alongside Payward’s move to lock up US crypto USDC settlement infrastructure signals a structural consolidation of institutional-grade crypto payment and settlement rails in the United States under regulatory-compliant entities ahead of the legislative frameworks that will define the sector. The combination of Circle’s payment network, Payward’s derivatives clearing stack, and the CFTC’s expanding mandate creates the regulated infrastructure layer the US institutional market has been building toward since the first spot Bitcoin ETFs launched in 2024.
Key Highlights
- X rolled out Cashtags this Tuesday, enabling iPhone users across the US and Canada to access real-time stock and cryptocurrency information directly within the app
- Within 48 hours of going live, the tool reportedly generated approximately $1 billion in trading activity
- Wealthsimple, a Canadian investment platform, remains the sole integrated trading partner — no American brokerages have joined yet
- X has clarified it won’t facilitate actual trades; its role is limited to providing financial information and platform connections
- X Money, a peer-to-peer transaction platform featuring debit cards and interest-earning accounts, is currently under development
The social media platform X has witnessed approximately $1 billion in trading activity stemming from its recently introduced Cashtags functionality, according to a statement from Nikita Bier, the company’s product chief.
Bier shared this milestone on Friday through a post revealing aggregated metrics from X’s trading pilot program. The capability went live late Tuesday evening.
The Cashtags tool enables users to interact with stock or cryptocurrency symbols embedded in posts, providing immediate access to live pricing graphs and relevant discussion threads. Access is presently restricted to [[LINK_START_0]]iPhone[[LINK_END_0]] users located in the United States and Canada.
The rollout occurred just 24 hours following Bier’s post on X suggesting that cryptocurrency had experienced “a rough year” while teasing an upcoming solution.
X has made clear that it won’t function as a brokerage firm or handle trade execution. The platform’s strategy focuses on delivering financial information resources and establishing connections to external trading services.
“X has always been the best source of financial news for traders and investors,” Bier said. “Billions of dollars are allocated every day based on what people read on Timeline.”
Wealthsimple, the Canadian investment platform, stands as the inaugural and currently exclusive trading service with Cashtags integration. Canadian users can tap a Cashtag symbol and seamlessly transition to Wealthsimple’s mobile trading application.
As of now, no American brokerage firms have established partnerships with X.
Bier serves as an advisor to Solana Labs and became part of the X team in June 2024.
X Money Platform in Development Pipeline
X is simultaneously building X Money, a digital payment solution designed for peer-to-peer transactions. The planned features include a rewards-based debit card, interest-generating account options, and direct user-to-user money transfers.
An external testing phase for X Money commenced in early March, demonstrating a transaction between Elon Musk and entertainment icon William Shatner.
X has obtained money transmission authorizations in over 40 American states and maintains registration with the Financial Crimes Enforcement Network.
Whether cryptocurrency transactions will be incorporated into X Money remains undetermined. Financial analysts from Mizuho indicated this week that implementing crypto payment capabilities might encounter regulatory obstacles.
Building Toward the Everything App
The Cashtags capability represents a component of Musk’s broader ambition to transform X into a comprehensive “everything app,” integrating payment processing, online commerce, and financial information services.
With a user base exceeding 550 million monthly active participants, X possesses significant reach to challenge established financial data companies.
Cashtags functionality enables users to associate particular assets or smart contract identifiers with their posts. Selecting these tags reveals current market prices and aggregated discussions from throughout the platform.
Musk announced in March that X Money would become accessible to early public participants in April 2026.
Mizuho’s financial analysts highlighted possible regulatory challenges regarding cryptocurrency payment integration on the platform earlier this week.
Key Highlights
- Payward, Kraken’s parent entity, has entered an agreement to purchase Bitnomial for as much as $550 million through a combination of cash and equity
- Payward’s valuation stands at $20 billion following this transaction
- Bitnomial holds the distinction of being the first cryptocurrency-focused company to possess the complete trio of CFTC licenses required for operating a comprehensive U.S. derivatives operation
- American customers will gain access to spot margin trading, perpetual futures contracts, and options products under CFTC regulatory supervision
- Transaction completion is anticipated during the initial six months of 2026
Payward, the entity behind cryptocurrency exchange Kraken, has struck a deal to purchase Bitnomial, an American crypto derivatives trading platform, in a transaction worth up to $550 million. The acquisition involves both cash and stock components and establishes Payward’s valuation at $20 billion.
Bitnomial has been operating for more than ten years. The platform achieved a historic milestone by becoming the first cryptocurrency-focused enterprise to obtain the complete set of three Commodity Futures Trading Commission licenses essential for conducting a comprehensive derivatives operation in the United States — specifically, an exchange designation, clearinghouse registration, and broker-dealer authorization.
Developing these three critical licenses independently would have required Payward to invest many years of effort and resources. This strategic acquisition essentially accelerates that timeline dramatically.
Arjun Sethi, Co-CEO of Payward, stated: “This isn’t simply a company acquisition. We’re integrating the foundational infrastructure that enables the future of derivatives trading in America.”
Dave Ripley, CEO, shared via X: “This strategic combination broadens our operational capabilities to include the complete suite of CFTC regulatory licenses, enabling significant product diversification for U.S. markets across both conventional and digital asset finance.”
Upcoming Product Offerings
Kraken revealed on X that spot margin capabilities, perpetual futures instruments, and options contracts will become available on its platform under CFTC regulatory oversight. American clients will have direct access to these trading products.
The acquisition simultaneously strengthens Payward Services, the organization’s enterprise-focused division. Financial institutions, fintech companies, and brokerage firms will gain the ability to tap into regulated American derivatives markets through a unified application programming interface.
Bitnomial’s technological framework will merge with Payward’s worldwide reach and market liquidity across its portfolio of brands, encompassing both Kraken and NinjaTrader.
Payward’s Track Record of Strategic Acquisitions
This transaction represents another significant move in Payward’s expansion strategy. Earlier in 2025, the company completed a $1.5 billion acquisition of NinjaTrader, an American retail futures trading platform. Industry observers characterized that deal as the most substantial transaction bridging traditional finance and cryptocurrency sectors to date.
Prior to that landmark deal, Kraken purchased BCM during 2023 and subsequently acquired Small Exchange to strengthen its derivatives trading capabilities.
Payward’s acquisition history also includes purchasing a British cryptocurrency futures platform in 2019 and introducing a European Union derivatives product suite in 2025.
The Bitnomial acquisition continues this established approach — leveraging strategic purchases to secure regulatory approvals and operational infrastructure instead of developing these capabilities organically.
Public Offering Timeline Postponed
Kraken had been advancing preparations for a stock market debut. Payward filed a preliminary S-1 registration document with the Securities and Exchange Commission on November 19 of last year.
Nevertheless, the organization has temporarily suspended these public offering preparations citing challenging capital market conditions. Industry sources indicate the company remains receptive to pursuing a public listing when market dynamics become more favorable.
The Bitnomial acquisition encompasses complete ownership of Bitnomial’s equity and is projected to finalize during the first two quarters of 2026, subject to obtaining necessary regulatory clearances.

Ardagh Metal Packaging: Execution Holds, Tailwinds Build, Valuation Undemanding

MicroStrategy Pushes 2x Monthly Payouts for STRC Holders

Jio Financials Q4 Results 2026 | jio financial services latest news, jio financial services share

Why Israel is blocking foreign journalists from entering

Bitcoin: We’re Entering The Most Dangerous Phase

Alan Cumming Brands Baftas Ceremony A ‘Triggering S**tshow’
Jio Financials Q4 Results 2026 | jio financial services latest news, jio financial services share

Arjun Rampal faced 14 flops & financial struggles before making a strong comeback with ‘Dhurandhar’

They Were Burned by a Bad Financial Advisor. Can They Recover?
-
 NewsBeat6 days ago
Pep Guardiola and Gary Neville agree over Arsenal title problem that benefits Man City
-

 Crypto World5 days ago
The SEC Conditionalises DeFi Platforms to Be Avoided for Broker Registration
-

 Politics6 days ago
World Cup exit makes Italy enter crisis mode
-

 Crypto World5 days ago
SEC Signals Exemption for Crypto Interfaces From Broker Registration
-

 Fashion19 hours ago
Weekend Open Thread: Theodora Dress
-

 News Videos3 days ago
Secure crypto trading starts with an FIU-registered
-

 Sports1 day ago
NWFL Suspends Two Players Over Post-Match Clash in Ado-Ekiti
-

 Crypto World4 days ago
SEC Proposes Certain Crypto Interfaces Don’t Need to Register as Brokers
-

 NewsBeat4 days ago
Trump and Pope Leo: Behind their disagreement over Iran war
-

 Business7 days ago
Ireland Fuel Protests Enter Day 5 as Blockades Spark Shortages and Government Prepares Support Package
-

 Politics17 hours ago
Palestine barred from entering Canada for FIFA Congress
-
 NewsBeat6 days ago
JD Vance announces ‘no agreement’ with Iran over nuclear weapons fear
-

 Crypto World15 hours ago
Russia Pushes Bill to Criminalize Unregistered Crypto Services
-
Sports6 days ago
Dexter Lawrence, Stefon Diggs, Trading for De’Von Achane
-

 Crypto World5 days ago
Trump whales load up ahead of Mar-a-Lago luncheon.
-
 Business2 days ago
Creo Medical agree sale of its manufacturing operation
-
Crypto World6 days ago
Sei Network Enters Quiet Reset Phase as On-Chain Metrics Signal a Slowdown in 2026
-

 Sports5 days ago
NWFL opens Pathway for new Clubs ahead of 2026 Season
-
Business5 days ago
Kering slides after Morgan Stanley downgrade, Gucci woes loom
-
 Entertainment5 days ago
Karol G’s ‘Ultra Raunchy’ Coachella Set Gave ‘Satanic Vibes’
You must be logged in to post a comment Login