
Crypto World
Bitcoin’s Worst Relative Performance Since FTX Era Raises Eyebrows


Since late August, Bitcoin has broken from equities in what appears to be its weakest stock correlation since the chaos of 2022.
Bitcoin’s recent performance differs from its long-standing pattern of moving with stocks. Over the past six months, it has lagged while equities stayed stable and gold rose.
The trend created an unusually weak correlation and recalled rare periods when crypto briefly moved independently from broader financial markets.
Rare Market Divergence
For many years, Bitcoin has frequently moved in the same direction as traditional equity markets, especially the S&P 500. During periods of low interest rates and strong economic growth, such as in 2021 and again in parts of 2024, BTC and many altcoins performed well alongside rising stocks.
On the other hand, during periods of increased fear and tightening monetary policy, including aggressive Federal Reserve rate hikes, crypto markets tended to decline in tandem with equities, as seen in 2018 and 2022.
A clear example occurred in November 2022, when rising interest rates combined with the collapse of FTX pushed Bitcoin down to approximately $15,700. This is one of the most extreme cases of crypto markets falling far more sharply than equities.
Over the past six months, however, Bitcoin has started to move very differently from stocks. Since late August, gold has risen by 51%, the S&P 500 has gained 7%, while Bitcoin has fallen 43%, creating the weakest correlation between BTC and stocks since the market chaos of late 2022.
Rather than moving in step with equities, Bitcoin has significantly underperformed as traditional markets have remained relatively stable and gold has seen strong gains. According to Santiment, such dramatic deviations from long-standing correlations do not typically continue indefinitely.
You may also like:
Previous instances clearly show that markets rotate as sentiment and macroeconomic conditions evolve, which results in changing capital flows over time. Within this context, Santiment added that if BTC eventually returns to its historical tendency of tracking equities during economic expansions, particularly in a scenario involving three interest rate cuts in the second half of 2025, there could be significant room for Bitcoin and altcoins to catch up.
Bearish Pressure
Bitcoin saw a modest rebound on Wednesday as it briefly climbed above the $66,000 level before giving back part of its gains and stabilizing above $65,000.
But data suggests bearish pressure in the BTC futures market, as funding rates remained largely negative across the $62,000-$68,000 range. Additionally, CryptoQuant stated that Bitcoin may not have formed a true bottom yet. Short-term holders have been consistently selling at a loss for nearly 30 days, and multiple large sell spikes have been absorbed without triggering a sustained rebound.
Despite brief price pumps, selling pressure has remained dominant. These rallies are acting as exit liquidity, and a meaningful trend reversal is unlikely until short-term holder profits turn positive and remain there, the report added.
Binance Free $600 (CryptoPotato Exclusive): Use this link to register a new account and receive $600 exclusive welcome offer on Binance (full details).
LIMITED OFFER for CryptoPotato readers at Bybit: Use this link to register and open a $500 FREE position on any coin!

Crypto World
South Korea Introduces Comprehensive Regulatory Framework for Stablecoins and Tokenized Assets

Key Highlights
- Stablecoins designated as foreign exchange payment mechanisms
- Enhanced regulatory monitoring for international stablecoin transactions
- Interest-bearing stablecoin products prohibited nationwide
- Real-world asset tokens require regulated trust custody backing
- Digital asset framework harmonized with conventional financial regulations
South Korean regulators are introducing a comprehensive framework that incorporates stablecoins and tokenized assets into the nation’s current financial regulatory system. The upcoming regulations represent a significant move toward enhanced supervision of international payment flows and blockchain-based asset instruments. Authorities seek to maintain consistency between emerging digital assets and established financial market protocols while mitigating systemic vulnerabilities.
Cross-Border Payment Oversight Anchors Stablecoin Strategy
Regulatory authorities in South Korea intend to designate stablecoins as foreign exchange payment vehicles under current legislation. This classification enables oversight bodies to supervise international stablecoin transfers without establishing new licensing categories. The strategy incorporates stablecoin operations into proven regulatory frameworks already governing financial transactions.
South Korea will carve out specific exceptions for domestic transactions from foreign exchange disclosure obligations. These carve-outs apply to purchases of goods and services within predetermined thresholds. International transfers will remain subject to comprehensive foreign exchange monitoring protocols.
Authorities propose eliminating all interest-generating mechanisms for stablecoin deposits regardless of structure. This prohibition prevents issuers from providing return-generating features that could attract users seeking investment opportunities. The regulations position stablecoins exclusively as transaction mediums rather than wealth-building instruments.
The Financial Services Commission will establish technical interoperability benchmarks under the proposed framework. These benchmarks facilitate smooth operations across diverse blockchain infrastructures. The approach balances technological flexibility with regulatory oversight requirements.
Asset-Backed Tokens Face Trust Custody Mandates
South Korean authorities plan mandatory trust-based custody for all tokenized representations of physical assets. These requirements draw authority from the Capital Markets Act. Token issuers must place underlying assets within approved custodial arrangements subject to regulatory supervision.
South Korea is working to incorporate blockchain-based assets into current financial product taxonomies. This incorporation enforces transparency, auditing, and regulatory compliance obligations parallel to conventional securities. Asset tokens would operate under well-established financial governance structures.
Regulators prioritize asset security through formalized custody arrangements. Managed trust structures provide token holders with legally enforceable claims on backing assets. The framework minimizes exposure to custodial failures or fraudulent asset representation.
This regulatory draft addresses specific gaps while leaving broader cryptocurrency policy questions unresolved. Topics including exchange ownership concentration and banking access remain outside the current proposal’s scope. Nevertheless, the framework advances systematic oversight of digital financial instruments.
National Policy Mirrors International Regulatory Evolution
South Korea’s regulatory direction parallels worldwide initiatives targeting stablecoins and tokenized instruments. International regulators increasingly apply existing financial statutes to blockchain-based products. This methodology circumvents prolonged legislative processes associated with developing entirely new legal codes.
The approach reflects previous warnings from South Korea’s monetary authority concerning financial system stability. Officials have identified domestic stablecoins as potential factors affecting capital movement patterns and currency valuation. Enhanced regulatory control supports macroeconomic policy objectives.
South Korea is responding to markets where tokenized assets have experienced substantial valuation growth. Worldwide implementation spans government securities, property holdings, and commodity markets. Defined regulatory parameters could enable controlled expansion domestically.
The nation reinforces an emerging global pattern of incorporating distributed ledger technology within supervised financial systems. The regulatory structure demonstrates that blockchain-based instruments will conform to traditional financial oversight standards. South Korea establishes its position within a compliance-oriented digital asset environment.


MEXC has named Vugar Usi as its new chief executive, signaling a sharpened push for global licensing as the exchange pursues a MiCA authorization in the European Union. The leadership shift appears to be part of a broader brand refresh and a strategic pivot toward an “everything exchange” model in a competitive landscape that spans centralized venues and decentralized rivals.
Usi joined MEXC as chief operating officer in late 2025 after previously serving in the same role at rival Bitget. In a conversation with Cointelegraph, he outlined plans to preserve the exchange’s low-fee trading ethos while expanding multi-asset access and reinforcing regulatory compliance across jurisdictions. “The MiCA license application is a top strategic priority for the company,” he said, adding that MEXC is actively preparing to establish a fully compliant business entity within the EU.
Key takeaways
- MEXC elevates COO Vugar Usi to CEO, aligning leadership with a concerted push for global licensing, including MiCA in the EU.
- MiCA licensing is described by Usi as a top strategic priority, with proactive steps under way to build an EU-compliant entity.
- Regulatory headwinds persist: Dutch authorities flagged MEXC in September 2025 for offering crypto services without a licensed footprint in the Netherlands.
- Market position and growth: CoinGecko places MEXC among fast-rising exchanges with reported daily volumes around $2.2 billion, while CryptoQuant counts it in the top tier of growth alongside peers like Gate and Coinbase.
- Strategic partnerships and ventures: MEXC has collaborated with Hacken for monthly proof-of-reserves audits and has ties to The Open Network (TON) via MEXC Ventures, dating back to late 2023.
A strategic leadership move amid a global licensing push
The leadership transition signals MEXC’s intent to accelerate its evolution from a high-velocity trading venue into a regulated, compliant platform with broader access to assets and markets. In speaking with Cointelegraph, Usi reframed the move as part of a long-term effort to balance growth with responsible oversight, especially as the industry faces intensified scrutiny in Europe and beyond.
Beyond the EU, Usi indicated that MEXC monitors regulatory developments worldwide, aiming to position the exchange to operate under a mosaic of license regimes rather than rely on a single jurisdiction. This approach aligns with the company’s public emphasis on expanding regulatory compatibility while maintaining cost-efficient trading for users.
EU licensing path and regulatory background
The EU’s Markets in Crypto-Assets Regulation (MiCA) represents a comprehensive licensing framework for crypto-asset service providers. MEXC’s leadership frames MiCA enrollment as a strategic necessity to unlock ongoing access to European users, though the company has not disclosed granular timelines or the exact structure of its EU entity. In recent conversations, Usi affirmed that MiCA licensing remains a top priority and that MEXC is actively preparing to operate as a compliant EU entity when the process unfolds.
Contextually, the EU licensing race is already crowded. Binance, the largest global exchange by reported volume, applied for a MiCA license in Greece in January as part of the broader regulatory push across member states. The landscape is politically sensitive and highly competitive, with exchanges weighing compliance costs and the potential benefits of a formal green light to operate across multiple EU jurisdictions.
However, EU regulators have not granted blanket approval to all applicants. MEXC has been labeled non-compliant by European authorities after the Dutch Authority for the Financial Markets (AFM) flagged the platform in September 2025 for offering crypto services without the required license in the Netherlands. The regulatory status highlights the ongoing friction between rapid global expansion and the compliance moat that MiCA seeks to establish.
As part of the broader regulatory narrative, industry coverage has underscored tensions around centralized exchanges, licensing, and cross-border operations. A related discussion in crypto policy circles has examined how jurisdictions like Malta interact with ESMA oversight, illustrating the broader geopolitical dynamics shaping the licensing race.
Related reading: Centralizing crypto: Why Malta’s clash with ESMA is about more than one small state.
MEXC’s growth trajectory and partnerships
Even as regulatory questions flow, MEXC has demonstrated rapid growth and expanding partnerships. CoinGecko tracks daily trading volumes for MEXC at approximately $2.2 billion, underscoring the exchange’s scale in active crypto markets. CryptoQuant places MEXC among the top three exchanges in its Exchange Leader Index, alongside Binance and Gate, and notes strong growth trajectories for MEXC and its peers.
The exchange has also pursued strategic collaborations to bolster transparency and governance. Notably, MEXC partnered with the blockchain security firm Hacken for monthly proof-of-reserves audits to enhance transparency for users. On the venture side, MEXC Ventures has supported The Open Network (TON), with TON securing funding in late 2023 as part of the broader push to align traditional exchanges with Web3 ecosystems.
Brand evolution in a crowded market
The leadership transition accompanies a broader brand reset that mirrors an industry-wide shift toward “everything exchange” models. As competitors accelerate diversification—spanning spot, derivatives, staking, and decentralized alternatives—the market is watching how operators balance nimble execution with rigorous compliance. Coverage of industry moves, including the Arkham Exchange pivot toward a decentralized model, illustrates the tension between centralized platforms and decentralized alternatives in shaping future user experiences.
Looking ahead, the path to MiCA approval will be a pivotal determinant of MEXC’s EU footprint. The ongoing regulatory dialogue in Europe will influence not only licensing timelines but also how exchanges design governance, compliance programs, and cross-border operations. For investors and users, the unfolding strategy offers a lens into how fast-growing exchanges navigate a more consolidated and regulated crypto landscape.
Readers should watch how MEXC negotiates MiCA readiness—whether an EU entity is established, how licensing milestones progress, and what this means for offerings across Europe. The regulatory climate remains fluid, and the ultimate outcome will shape competitive dynamics across global crypto markets in the months ahead.


Arkham Intelligence is discontinuing support for the TON blockchain on its platform effective April 8 at 12pm EST.
Arkham Intelligence announced it will remove support for the TON blockchain from its Arkham Intel platform on Wednesday, April 8 at 12pm EST. The decision follows a periodic review of chain integrations, with Arkham citing user demand and the blockchain’s importance to the crypto ecosystem as key evaluation factors.
Arkham regularly evaluates its chain integrations to determine which blockchains warrant continued maintenance and support on the platform. The removal of TON comes as Arkham maintains its intelligence and on-chain analytics services across other major blockchain networks.
Sources: Arkham
This article was generated automatically by The Defiant’s AI news system from publicly available sources.
Crypto World
U.S. Treasury to propose demands that stablecoin firms be set to police bad transactions

A firm issuing stablecoins in the U.S. would have an array of new duties to head off criminals and keep government watchdogs informed about malicious actors, according to rules poised for proposal by the U.S. Department of the Treasury that were reviewed by CoinDesk.
A joint proposal from the Treasury’s Financial Crimes Enforcement Network (FinCEN) and Office of Foreign Assets Control (OFAC) will outline the deep controls that stablecoin businesses would have to put in place, including abilities to “block, freeze and reject” transactions and internal protections to comply with the Bank Secrecy Act that governs most of the U.S. financial system.
In one of the most significant moves yet to implement last year’s Guiding and Establishing National Innovation for U.S. Stablecoins (GENIUS) Act — the first major crypto-sector law for the U.S. — the two arms of the Treasury Department that police illicit finance are setting out a tailored approach for stablecoin firms, which will be opened for a public comment period and potential revisions before it’s finalized. But the agencies are also sending a message of deference to the industry, suggesting the companies understand their own hazards best.
A summary of the joint proposal reviewed by CoinDesk said it’s focused on effectiveness “and that financial institutions are best positioned to identify and evaluate their money laundering, terrorist financing and illicit finance risks.” The department’s effort contends that a firm that’s running appropriate money-laundering preventions is generally safe from enforcement actions unless it’s showing “a significant or systemic failure to maintain that program.”
On that money-laundering front, FinCEN would expect stablecoin issuers’ programs to be able to halt specifically flagged transactions and to know where to devote “more attention and resources toward higher-risk customers and activities.” When the U.S. authorities are pursuing a specific target, the regulated issuers subjected to this proposed rule would have to scour their own records for any activity tied to individuals or entities flagged by FinCEN.
Also, the issuers will be expected to act as allies in the agency’s pursuit of entities identified as “primary money laundering concerns.” As recently as 2023, the agency had sought to tag crypto mixers such as Tornado Cash under that label, though earlier this year, the Treasury Department reversed course to suggest that mixers could serve legitimate and legal privacy uses.
On the sanctions front, OFAC would require stablecoin issuers run risk-based safeguards for stablecoin activity on primary or secondary markets, and the policies must spot and reject transactions “that may violate or would violate U.S. sanctions.” Sanction missteps — including past flagrant violations — have been a critical concern of crypto industry detractors, including recent scrutiny focused on the world’s biggest exchange, Binance.
Treasury Secretary Scott Bessent said in a statement that his department’s latest efforts “will protect the U.S. financial system from national security threats without hindering American companies’ ability to forge ahead in the payment stablecoin ecosystem.”
The crypto industry and its stablecoin leaders — including Tether, Circle, Ripple and the firm partially owned and controlled by the family of President Donald Trump, World Liberty Financial — have been awaiting regulation that helps further establish their bespoke assets as safe and reliable. Some tensions remain in the wider crypto community, which has had a tumultuous relationship with governments since its beginnings, when its founding principles aimed to keep cryptocurrencies outside of government control.
The decentralized finance (DeFi) sector remains a space that seeks to cut away intermediaries and maintain direct interactions, but the illicit-finance controls for that arena are still unresolved in the ongoing negotiations among the industry, securities sector and lawmakers over the Digital Asset Market Clarity Act in the U.S. Senate. While the Treasury’s stablecoin proposal and others from U.S. financial regulators are beginning to sketch out the guardrails, wide swaths of crypto activity still need to be addressed.
Earlier this year, a third arm of the Treasury — the independent Office of the Comptroller of the Currency that regulates national banks and trusts — proposed its standards and procedures for issuers it’ll watch as the primary federal regulator. This week, its sister regulator, the Federal Deposit Insurance Corp. did the same with a largely parallel proposal.
The GENIUS Act is meant to go into full effect by 2027. Well before that, firms have been pursuing charters and partnerships to get involved in stablecoins. The Trump-tied World Liberty, for instance, applied for a charter as a trust bank in January and manages the USD1 stablecoin.
The company is under fresh scrutiny this week after reportedly being unaware that its AB DAO partner was involved in a project with potential ties to Cambodia’s Prince Group, the target of major U.S. investigations, sanctioning and the seizure last year of a record $14 billion in bitcoin . Those types of business relationships at stablecoin issuers would be under stringent new industry-managed controls in the Treasury Department’s pending proposal.


Disclosure: This article does not represent investment advice. The content and materials featured on this page are for educational purposes only.
AI trading apps reshape investing in 2026 as beginners adopt automated stock and crypto strategies.
Summary
- AI trading apps surge in 2026, helping beginners automate stock and crypto strategies for passive income
- MoneyFlare leads with fully automated AI trading across stocks and crypto, requiring no manual setup
- Platforms like Pionex and 3Commas offer flexible AI tools as demand for hands-free trading grows
In 2026, the world of investing is being transformed by artificial intelligence (AI). Whether someone is looking to trade stocks or cryptocurrencies, AI-powered trading apps have made it easier than ever for beginners to get started with automated trading.
These platforms are designed to eliminate the complexity of traditional trading, offering hands-off solutions that allow users to generate passive income with minimal effort. For those who are beginners and are looking to dive into AI trading, this guide is an introduction to the top 8 AI stock and crypto trading apps for 2026.
1. MoneyFlare – Best fully automated AI Trading system for stocks and crypto
Overview:
MoneyFlare stands out as the top choice for beginners looking for a truly automated trading experience. This platform uses AI-driven quantitative strategies to handle both stock and cryptocurrency trading, eliminating the need for manual intervention.
Key Features:
- Fully managed AI quant trading system for both stocks and cryptocurrencies
- No setup required, pre-built strategies
- Works seamlessly across both asset classes
- Continuous optimization of strategies without user management
Why choose it:
Perfect for those who want a completely hands-off trading experience, MoneyFlare operates 24/7, ensuring that users don’t need to monitor the market actively, whether in stocks or crypto.
Click to visit and register to receive a free $10 real reward and a $50 trial credit!
2. Pionex – Best for no-code crypto trading automation
Overview:
Pionex is a crypto trading app that offers AI-powered automation without the need for APIs. Pionex integrates its trading bots directly into its exchange, making it simpler for beginners to start trading cryptocurrencies.
Key Features:
- Built-in trading bots (16+ options)
- No API integration required
- Automatic grid trading and DCA
- User-friendly interface
Why choose it:
With Pionex, there is no need for technical knowledge to use the bots, making it an ideal choice for crypto newbies looking to automate their trading.
3. TradeSanta – Best for entry-level crypto trading automation
Overview:
TradeSanta is an AI trading platform designed for beginners who want to automate their crypto trading with minimal complexity. It provides a straightforward setup and allows users to get started quickly with cryptocurrency trading.
Key Features:
- 24/7 automated trading for crypto
- Smart trading terminal with customizable settings
- Cloud-based platform for easy access
- Affordable pricing and demo options
Why choose it:
TradeSanta is great for entry-level users, offering an intuitive interface and access to both grid and DCA bots without the need for complex configuration, making it perfect for crypto beginners.
4. 3Commas – Best for flexible stock & crypto trading strategies
Overview:
For those who want a little more control over their strategies while still benefiting from automation, 3Commas provides a flexible AI platform. Users can fine-tune their strategies while letting the AI handle execution, whether for stocks or cryptocurrencies.
Key Features:
- SmartTrade terminal with advanced features
- Customizable trading strategies for both stocks and crypto
- Multiple integrations with popular exchanges
- Backtesting for strategy optimization
Why choose it:
3Commas is a versatile choice for beginners who want to move beyond basic bots and explore more tailored trading approaches in both stock and crypto markets.
5. Cryptohopper – Best for copy trading in crypto and stocks
Overview:
Cryptohopper is a top-rated platform for beginners interested in copy trading. With its marketplace of pre-built strategies, even beginners can follow successful traders’ strategies without needing to know the intricacies of trading in either stocks or cryptocurrencies.
Key Features:
- Copy trading and marketplace for stocks and crypto
- AI-powered optimization of strategies
- Supports stocks and cryptocurrencies
- Mobile-friendly interface for on-the-go trading
Why choose it:
Cryptohopper allows beginners to harness the expertise of professional traders, making it an easy entry point into AI trading for those who prefer to follow established strategies in both asset classes.
6. Coinrule – Best for no-code strategy building in crypto
Overview:
Coinrule offers an intuitive, no-code interface for building personalized trading strategies. It’s great for beginners who want to customize their approach to cryptocurrency trading without needing to learn how to code.
Key Features:
- No-code strategy builder for crypto trading
- Pre-built templates for easy setup
- Automatic execution of strategies
- Supports a wide range of exchanges
Why choose it:
Coinrule is a fantastic option for beginners who want to experiment with their own strategies without needing technical expertise in crypto trading. Its ease of use makes it ideal for users who prefer a DIY approach.
7. HaasOnline – Best for advanced automation in stocks and crypto
Overview:
HaasOnline is a powerful platform that caters to beginners and experienced traders alike, offering advanced automation features without requiring technical expertise. Its AI-powered system enables users to set up automated trading strategies for both stocks and cryptocurrencies.
Key Features:
- Advanced technical analysis tools
- AI-powered trading strategies for both asset classes
- Customizable bots for stocks and crypto
- Supports a wide range of exchanges
Why Choose It:
HaasOnline is ideal for those who want both simplicity and powerful trading features. It’s great for beginners who want to explore advanced automation without a steep learning curve in both stocks and crypto markets.
8. Botcrypto – Best for simple crypto trading automation
Overview:
Botcrypto is a beginner-friendly AI trading app designed for those looking to automate their cryptocurrency trading with minimal setup. It’s perfect for those who want a straightforward approach to crypto trading.
Key Features:
- Drag-and-drop interface for strategy creation
- Integration with multiple crypto exchanges
- Cloud-based for easy access
- Pre-set strategies available
Why choose it:
Botcrypto offers an easy way to get started in crypto trading with automated strategies. Its drag-and-drop feature makes it one of the simplest platforms for beginners to use, especially for crypto.
Conclusion
As AI continues to reshape the financial landscape, these 8 AI stock and crypto trading apps are at the forefront of helping beginners get started with automated trading. Whether someone is looking to trade stocks or cryptocurrencies, these platforms offer user-friendly interfaces, AI-driven automation, and risk management features that make it easier to generate passive income.
For beginners in 2026, there’s no better time to take advantage of AI-powered trading tools. Start with platforms like MoneyFlare or Pionex for a completely hands-off experience in stocks and crypto, or explore more customizable options like 3Commas or Coinrule to fine-tune trading strategies.
Whichever platform someone chooses, make sure to start with small investments, understand the risks involved, and adjust their strategies as needed to maximize profits. Happy trading!
Disclosure: This content is provided by a third party. Neither crypto.news nor the author of this article endorses any product mentioned on this page. Users should conduct their own research before taking any action related to the company.
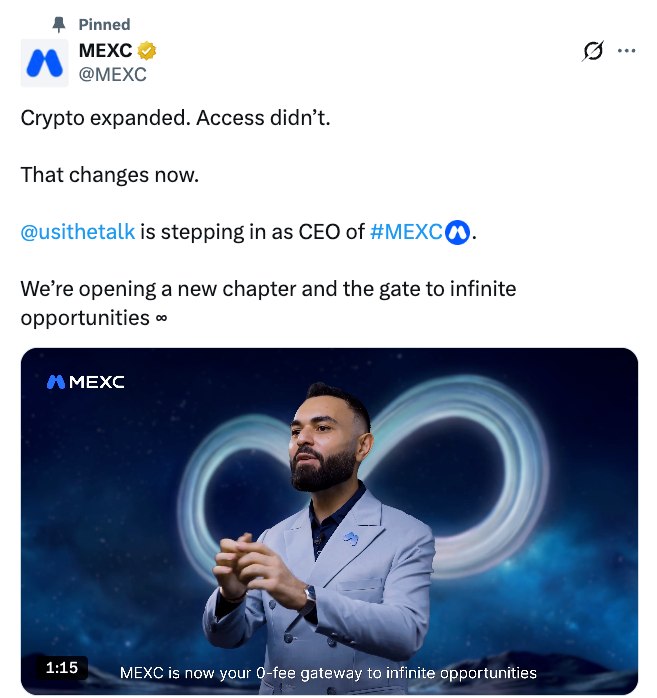
MEXC appointed Vugar Usi as CEO on Wednesday, elevating the executive as the exchange steps up its push for global licensing, including under the European Union’s Markets in Crypto-Assets Regulation (MiCA) framework.
MEXC said Usi joined the company as chief operating officer in late 2025 after previously serving in the same position at rival exchange Bitget.
In his new role, Usi said MEXC plans to preserve its low-fee trading focus while expanding broader multi-asset access on the platform.
The CEO told Cointelegraph that MEXC is actively pursuing licensing opportunities globally, including a MiCA license in the EU.
MEXC’s changes come alongside a broader brand update, highlighting an industry-wide shift toward “everything exchange” models amid growing competition from decentralized rivals.
MiCA license a “top strategic priority”
Operating across multiple regions worldwide, MEXC “consistently maintains a close watch” on the global regulatory landscape, Usi told Cointelegraph.
“The MiCA license application is a top strategic priority for the company,” he said, adding that the company is engaged in proactive preparations to establish a fully compliant business entity within the EU.

MEXC did not provide additional details on its MiCA licensing plans. The company is currently labeled non-compliant by European regulators after Dutch authorities flagged the platform in September 2025 for providing crypto services in the Netherlands without holding the required license.
Related: Centralizing crypto: Why Malta’s clash with ESMA is about more than one small state
Some major exchanges are still working through Europe’s MiCA process, showing how competitive and politically sensitive the licensing race has become. Binance, the world’s largest exchange by reported volume, applied for a MiCA license in Greece in January.
MEXC posts rapid growth in crypto market
Founded in April 2018, MEXC has emerged as one of the fastest-growing CEXs globally, with reported daily trading volumes of around $2.2 billion, according to CoinGecko.
Crypto analytics platform CryptoQuant named MEXC as one of the top three exchanges in its Exchange Leader Index alongside Binance and Gate, with the exchange also ranking among those with the strongest growth alongside Gate and Coinbase.
Related: Binance led Q1 crypto derivatives as Hyperliquid cracked top 10: CoinGlass
The company has scored major partnerships, including an auditing collaboration with the blockchain security platform Hacken. MEXC also closely collaborated with The Open Network (TON), which secured funding from its venture arm, MEXC Ventures, in late 2023.
Magazine: AI agents will kill the web as we know it: Animoca’s Yat Siu
Crypto World
BeInCrypto Institutional 100 Awards Nomination: Fireblocks for Best Digital Asset Custody Provider

The digital asset market has officially outgrown its era of speculation. The real story of 2026 isn’t about price swings; it’s about the quiet, massive re-engineering of global finance happening behind the scenes. At the heart of this shift is Fireblocks.
While others focused on the hype, Fireblocks focused on the plumbing, creating the secure, high-velocity rails that now allow the world’s largest institutions to move value at the speed of the internet.
Fireblocks is the infrastructure layer behind many of the largest names in digital finance. Its MPC-based custody technology powers wallets and transactions for Robinhood, Revolut, Wintermute, Bybit, BtcTurk, BNY Mellon, BNP Paribas, Galaxy, Bakkt, FalconX, among others. While its NYDFS-chartered Trust Company, granted in August 2024, now provides direct qualified custody for institutional clients.
In July 2025, the platform routed an estimated 15-20% of all global on-chain stablecoin volume through its Network for Payments product alone (Fortune, Sep 2025; denominator via Dune Analytics). [BIC Verified]
Fireblocks submitted a formal memo to the SEC Crypto Task Force in February 2025 and was invited as a panelist alongside Fidelity, Anchorage, and Kraken at the SEC’s custody roundtable.
Enter the BeInCrypto Institutional 100 Awards.
On-chain forensics from Arkham Intelligence identify 59 entities and 999+ addresses tied to its infrastructure; a fraction of its reported client base. 26 SEC filings in 2026 year-to-date reference the company by name.
Beyond Storage: The Case for Fireblocks
Fireblocks is nominated for Best Digital Asset Custody Provider because they have successfully bridged the gap between “Bank-Grade Security” and “Fintech Speed.” During an exclusive interview with BeInCrypto’s Global Head of News, Brian McGleenon, Varun Paul, Senior Director for Financial Markets at Fireblocks, outlined how the company is moving beyond mere storage to facilitate the massive movement of institutional value.
Discussing the shifting demands of the industry, Paul noted to McGleenon that the challenge of custody has evolved from simple protection to complex, high-velocity scalability:
“Security is the first requirement… but it goes beyond that. It’s about the integrations, the connectivity, and the scalability because the market is growing so rapidly that we now need to be prepared for a financial system on these rails.”
In 2025 alone, Fireblocks processed $5 trillion in transactions, with nearly half of that volume in stablecoins, a metric that underscores their role as the primary engine for global value transfer. Their defense-in-depth approach provides the “governance and security upfront” that has allowed institutions to scale securely into the digital asset space.
Looking toward an agentic future, Paul emphasized to McGleenon that Fireblocks is already building the necessary guardrails. While AI agents and programmable ledgers are set to drive the next wave of institutional adoption, they require a sophisticated governance layer to prevent risk. As Paul explained: “
You need the smart contracts to be able to work between these blockchains… Interoperability becomes critically important.”
By providing the connectivity that prevents “fragmented islands” of liquidity, Fireblocks is ensuring that by 2030, the $30 trillion in projected tokenized assets will have a secure, high-velocity home. Through their collaboration with institutions and their commitment to building the rails of the future, Fireblocks is not just participating in the market, they are defining the next decade of finance.
The post BeInCrypto Institutional 100 Awards Nomination: Fireblocks for Best Digital Asset Custody Provider appeared first on BeInCrypto.


Stabble, a decentralized crypto exchange on Solana, shed 62% of its total value locked in a single trading session Tuesday after the protocol’s new management team issued an emergency withdrawal notice – cutting TVL from approximately $1.75 million to less than $663,000 within hours, according to DeFiLlama data.
The drawdown was protocol-directed rather than attacker-driven, making it an unusual but measurable risk event in its own right.
The triggering condition: on-chain investigator ZachXBT identified an alleged North Korean operative, working under the name Keisuke Watanabe, as Stabble’s former chief technology officer – a role the individual reportedly held through 2025.
The new management team, which assumed control of the protocol approximately four weeks prior, posted an unambiguous alert to X at 9:34 a.m. ET, roughly seven hours after ZachXBT’s identification surfaced publicly.
- Stabble’s TVL collapsed 62% – from $1.75 million to under $663,000 – within hours of the emergency alert on April 7, 2026.
- On-chain investigator ZachXBT identified Stabble’s former CTO, operating under the name Keisuke Watanabe, as an alleged North Korean operative.
- No exploit or fund breach has been confirmed; the new Stabble team is conducting audits while urging full liquidity withdrawal as a precautionary measure.
- The alert follows a pattern of DPRK-linked IT worker infiltration documented across the DeFi sector for at least seven years.
Explore: The best pre-launch token sales with asymmetric upside potential
Former CTO Flagged as DPRK Operative – What the Architecture Exposure Actually Means
The structural risk in this scenario is not a live exploit – it is the possibility of dormant backdoors, compromised key management infrastructure, or embedded logic in smart contracts written or audited by a state-linked actor with undisclosed access.
A former CTO would have had direct write access to core protocol code, administrative keys during the development phase, and visibility into the full contract architecture.
Stabble’s new team has not disclosed whether smart contract upgradability mechanisms were in place, nor whether the former CTO retained any multi-sig signing authority post-transition.
Those details are material: upgradeable proxy contracts controlled even partially by a compromised key represent an active vector, not a historical one. The team confirmed it is conducting audits to assess the full scope of the exposure.
The developer also reportedly worked on Elemental, a related Solana DeFi project – a detail that extends the potential attack surface beyond Stabble’s own liquidity pools and into connected protocol infrastructure. No exploit has been disclosed on either platform as of publication.
This infiltration model – DPRK-linked IT workers securing developer roles at crypto firms under false identities – represents a documented operational pattern spanning at least seven years, with increasing operational sophistication in targeting DeFi protocols specifically.
The Solana ecosystem has faced sustained pressure from state-linked actors, and the pace of confirmed incidents is accelerating through early 2026.
New Stabble Crypto Team Issues Emergency Alert
The Stabble team’s public response was direct and unambiguous. Posted to X, the alert read: “EMERGENCY! Guys, please temporarily withdraw your liquidity instantly! Better safe than sorry.”
The statement carries operational weight precisely because it came from the new management – quants and early DeFi participants by their own description, not communications professionals managing narrative.
A follow-up post clarified the team’s posture: “We received a message and are acting on it, our primary focus is the safety of our LPs. We’re not PR people, we’re quants and early DeFi degens. We hear you, and your feedback matters.”
The messaging prioritized LP capital protection over protocol optics – a defensible position given the confirmed identity of the former CTO.
The seven-hour gap between ZachXBT’s public identification and the official emergency alert suggests the team spent that time assessing internal exposure before going public. Whether that assessment produced actionable findings has not been disclosed.
Discover: The Best Crypto Presales Live Right Now
The post Stabble Crypto Urges Liquidity Withdrawal After North Korean Hacker Scare appeared first on Cryptonews.


Key takeaways
- HYPE is up 10% in the last 24 hours, outperforming the other major cryptocurrencies.
- The coin could surge towards the $50 psychological level in the near term.
Hyperliquid (HYPE) nears $40 as US-Iran ceasefire boosts market sentiment
HYPE, the native coin of the Hyperliquid DEX, is approaching the $40 mark on Wednesday, extending its recovery linked to the US-Iran ceasefire.
Retail demand for HYPE continues to rise, driving increased futures Open Interest amid a broader market rally. Technically, HYPE has broken out of a falling channel pattern on the 4-hour chart, signaling a bullish near-term outlook.
Throughout the US-Iran conflict, Hyperliquid showed resilience, with its 24/7 trading platform for crude oil and other commodities gaining traction during the crisis. The ongoing recovery in the crypto market, driven by the ceasefire, has increased anticipation for HYPE’s recovery.
According to CoinGlass data, HYPE futures Open Interest (OI) reached $1.64 billion on Wednesday, marking a 9% increase in the last 24 hours. Typically, such an OI expansion during a spot market rally signals growing demand entering the leverage market.
Liquidations in the last 24 hours totaled $4.49 million, led by $4.28 million in short liquidations, indicating a sell-side weakness. Additionally, the OI-weighted funding rate remains positive at 0.0082%, showing sustained bullish sentiment among traders.
Will HYPE rally towards the $50 mark?
The HYPE/USD 4-hour chart is bullish and efficient as Hyperliquid is the best performer among the leading cryptocurrencies.
HYPE is trading above the 50- and 200-period Exponential Moving Averages (EMAs) on the 4-hour chart, reflecting a potential trend reversal.
At the time of writing, HYPE trades around $39.00, extending the breakout gains of a falling channel pattern.
The Moving Average Convergence Divergence (MACD) line is above its signal and the zero line, suggesting strengthening upside momentum.

The Relative Strength Index (RSI) at 66 remains below overbought territory, suggesting firm buying pressure without clear exhaustion at this stage.
If the rally persists, HYPE would likely surge towards the first major resistance level at $43. A daily candle close above this level would pave the way for further rally towards the $50 psychological zone.
However, if the market reverses, HYPE could test the 200-period EMA at $37.10. A drop below this support zone would nullify the bullish breakout and deepen the downside risk.
TLDR
- President Trump announced on Truth Social that nations providing military equipment to Iran will face immediate 50% tariffs on all exports to America.
- The declaration followed shortly after Washington and Tehran reached a two-week ceasefire agreement, including Iran’s temporary reopening of the Strait of Hormuz.
- Constitutional scholars are questioning the president’s legal authority to enact such tariffs following a Supreme Court decision in February that eliminated his primary enforcement mechanism.
- Beijing emerges as the principal target, given its supply of drones and military-capable components to Iran, complicating an upcoming Trump-Xi meeting scheduled for next month.
- Both Iranian and Israeli officials have accepted the ceasefire terms, with Tehran presenting a comprehensive 10-point framework to guide future diplomatic discussions.
President Donald Trump issued a warning on Wednesday that any nation providing military armaments to Iran would face a 50% tariff penalty on all goods exported to the United States.
The president issued his statement via Truth Social, declaring: “A Country supplying Military Weapons to Iran will be immediately tariffed, on any and all goods sold to the United States of America, 50%, effective immediately. There will be no exclusions or exemptions!”
This announcement arrived mere hours following the conclusion of a two-week ceasefire arrangement between Washington and Tehran. The diplomatic breakthrough occurred just before Trump’s previously established deadline for military escalation.
Under the ceasefire terms, Iranian officials consented to temporarily lifting their blockade of the Strait of Hormuz, a critical waterway for international petroleum shipments. The White House verified that Israeli authorities also endorsed the agreement.
Tehran submitted a comprehensive 10-point diplomatic proposal that now serves as the foundation for continued bilateral discussions.
Celebrating the diplomatic achievement on Truth Social, Trump proclaimed it “a big day for World Peace!”
Questions Over Legal Authority
Despite the forceful rhetoric, legal analysts remain uncertain whether Trump possesses the constitutional authority to implement such sweeping tariff measures.
This past February, the Supreme Court struck down the president’s primary enforcement mechanism — an emergency statute from 1977 — which had previously enabled him to impose tariffs rapidly without extensive justification.
The remaining tariff instruments available to Trump demand more precise legal justification and comprehensive investigations before implementation. The White House has declined to clarify which statutory authority the administration intends to invoke.
Among Trump’s available options is Section 338 of the Tariff Act of 1930, which permits tariffs reaching 50%. Nevertheless, this statute was crafted to counter discriminatory foreign trade barriers against American products, not weapons transactions with third-party nations.
The president’s most legally defensible tariff approach — grounded in comprehensive investigations into unfair commercial practices spanning multiple nations — remains under development and is not yet operational.
China in the Crosshairs
Beijing stands as the primary target of this tariff warning. The Chinese government provides Iran with unmanned aerial vehicles, replacement components, and various dual-purpose materials that Tehran converts for military applications.
Reuters revealed last month that Iranian officials were nearing completion of negotiations to acquire Chinese-manufactured anti-ship cruise missiles.
Trump retains access to a China-focused trade investigation from his initial presidential term, which could theoretically justify targeted tariffs against Beijing.
Nevertheless, any decision to penalize China for its Iranian commerce could strain relations before the scheduled summit between Trump and Chinese President Xi Jinping in Beijing next month.
The Chinese diplomatic mission in Washington has not provided commentary on the matter.
Previously in February, Washington had imposed sanctions on over 30 individuals, organizations, and maritime vessels linked to Iran’s petroleum exports and weapons manufacturing operations.
Those enforcement actions were structured to compel international businesses to select between maintaining Iranian partnerships or preserving their access to American markets.

Ford reportedly seeks aluminum tariff relief after factory fires

Stephen King’s R-Rated Netflix Original Will Haunt Your Darkest Thoughts
I’m A Celebrity South Africa’s Seann Walsh reveals shocking Gemma Collins trial moment


-

 NewsBeat6 days ago
Steven Gerrard disagrees with Gary Neville over ‘shock’ Chelsea and Arsenal claim | Football
-

 Business6 days ago
No Jackpot Winner and $194 Million Prize Rolls Over
-

 Fashion5 days ago
Weekend Open Thread: Spanx – Corporette.com
-

 Crypto World7 days ago
Gold Price Prediction: Worst Month in 17 Years fo Save Haven Rock
-

 Business4 days ago
Expert Picks for Every Need
-

 Business3 days ago
Three Gulf funds agree to back Paramount’s $81 billion takeover of Warner, WSJ reports
-

 Sports4 days ago
India men’s 4x400m and mixed 4x100m relay teams register big progress | Other Sports News
-

 Business7 days ago
Login and Checkout Issues Spark Merchant Frustration
-

 Tech18 hours ago
How Long Can You Drive With Expired Registration? What Florida Law Says
-
Business3 days ago
No Jackpot Winner, Prize to Climb to $231 Million
-

 Tech6 days ago
Commonwealth Fusion Systems leans on magnets for near-term revenue
-

 Fashion2 days ago
Massimo Dutti Offers Inspiration for Your Summer Mood Board
-

 Crypto World7 days ago
Ripple rolls out enterprise crypto treasury platform for corporates
-

 Tech7 days ago
Drawing Tablet Controls Laser In Real-Time
-

 Fashion23 hours ago
Let’s Discuss: DEI in 2026
-
Politics5 days ago
Wings Over Scotland | The quality of mercy
-

 Crypto World7 days ago
Why It’s Partnering, Not Issuing
-
 Sports7 days ago
Steal Gary Woodland’s subtle power move for longer drives
-
Sports7 days ago
Tom Pelissero Drives the Final Nail in the Coffin
-
 Tech7 days ago
Battery Tester Outperforms Cheaper Options
You must be logged in to post a comment Login