
Crypto World
BlackRock snaps up BTC as US spot ETFs see $507m inflow


BTC ETFs saw ~+$507m net inflow Feb. 25 as BlackRock bought thousands of BTC from Coinbase Prime, but BTC still slipped on profit‑taking.
Summary
- BlackRock shifted multiple 300 BTC batches plus a 108.6 BTC transfer from Coinbase Prime to IBIT wallets around 5:45 PM UTC on Feb. 26.
- U.S. spot BTC ETFs booked about $507m net inflows on Feb. 25, the strongest single‑day inflow in roughly two weeks, led by IBIT’s ~$297m.
- BTC traded near recent highs but dipped on profit‑taking, with on‑chain data showing sellers capping price below key resistance despite renewed ETF demand.
BlackRock purchased a substantial amount of bitcoin during the strongest single-day inflow for U.S. spot bitcoin exchange-traded funds in two weeks, according to market data.
Data showed BlackRock transferred thousands of bitcoin to its iShares Bitcoin Trust wallets on Feb. 26, according to blockchain analytics firms. The transfers originated from Coinbase Prime hot wallets and occurred in several batches within the same hour, the data showed. Blockchain analytics firms shared logs showing multiple transfers of approximately 300 bitcoins to addresses linked to the iShares trust. The timestamp for these transfers was recorded at approximately 5:45 PM UTC.
BlackRock had purchased additional bitcoin days earlier and had transferred bitcoin to Coinbase the day before, according to transaction records. Market analysts tracked the activity as other ETFs reported outflows during the same period.
U.S. spot bitcoin ETFs recorded strong net inflows on Feb. 25, marking the highest one-day inflow in two weeks, according to data from SoSoValue. Total cumulative inflows have reached tens of billions of dollars across all issuers, the data showed. BlackRock’s iShares Bitcoin Trust led inflows for the day. Fidelity’s bitcoin ETF, Grayscale’s trust and Bitwise also reported inflows, according to the data. Other issuers recorded smaller inflows, while some smaller ETFs reported no net flows that day.
Bloomberg ETF analyst Eric Balchunas noted the renewed inflows followed weeks of withdrawals. Balchunas stated the rise in interest was well timed for the market but that it remained unclear whether the trend would mark a sustained rebound.
Bitcoin traded near recent highs but declined that day, falling even as ETF inflows increased, according to market data. Charts showed bitcoin briefly declined during the trading session. On-chain data indicated recent profit-taking kept bitcoin below certain resistance levels, with demand slowing near that range and recovery attempts in February meeting resistance at similar levels, according to blockchain analysts.


Retail investors became net sellers of stocks last week, making a bearish shift in positioning since late November 2025.
The selling came amid a notable rally in US equities, with the S&P 500 rebounding to recover nearly all of its war-driven losses.
Retail Capitulation Meets Renewed Rally
Mom-and-pop investor participation has slowed sharply. Global Markets Investor reported that retail stock purchases have declined approximately 70% from January highs.
“Retail investors turned bearish at the worst possible time: Retail SOLD stocks last week for the first time since November 2025,” Global Markets Investor wrote.
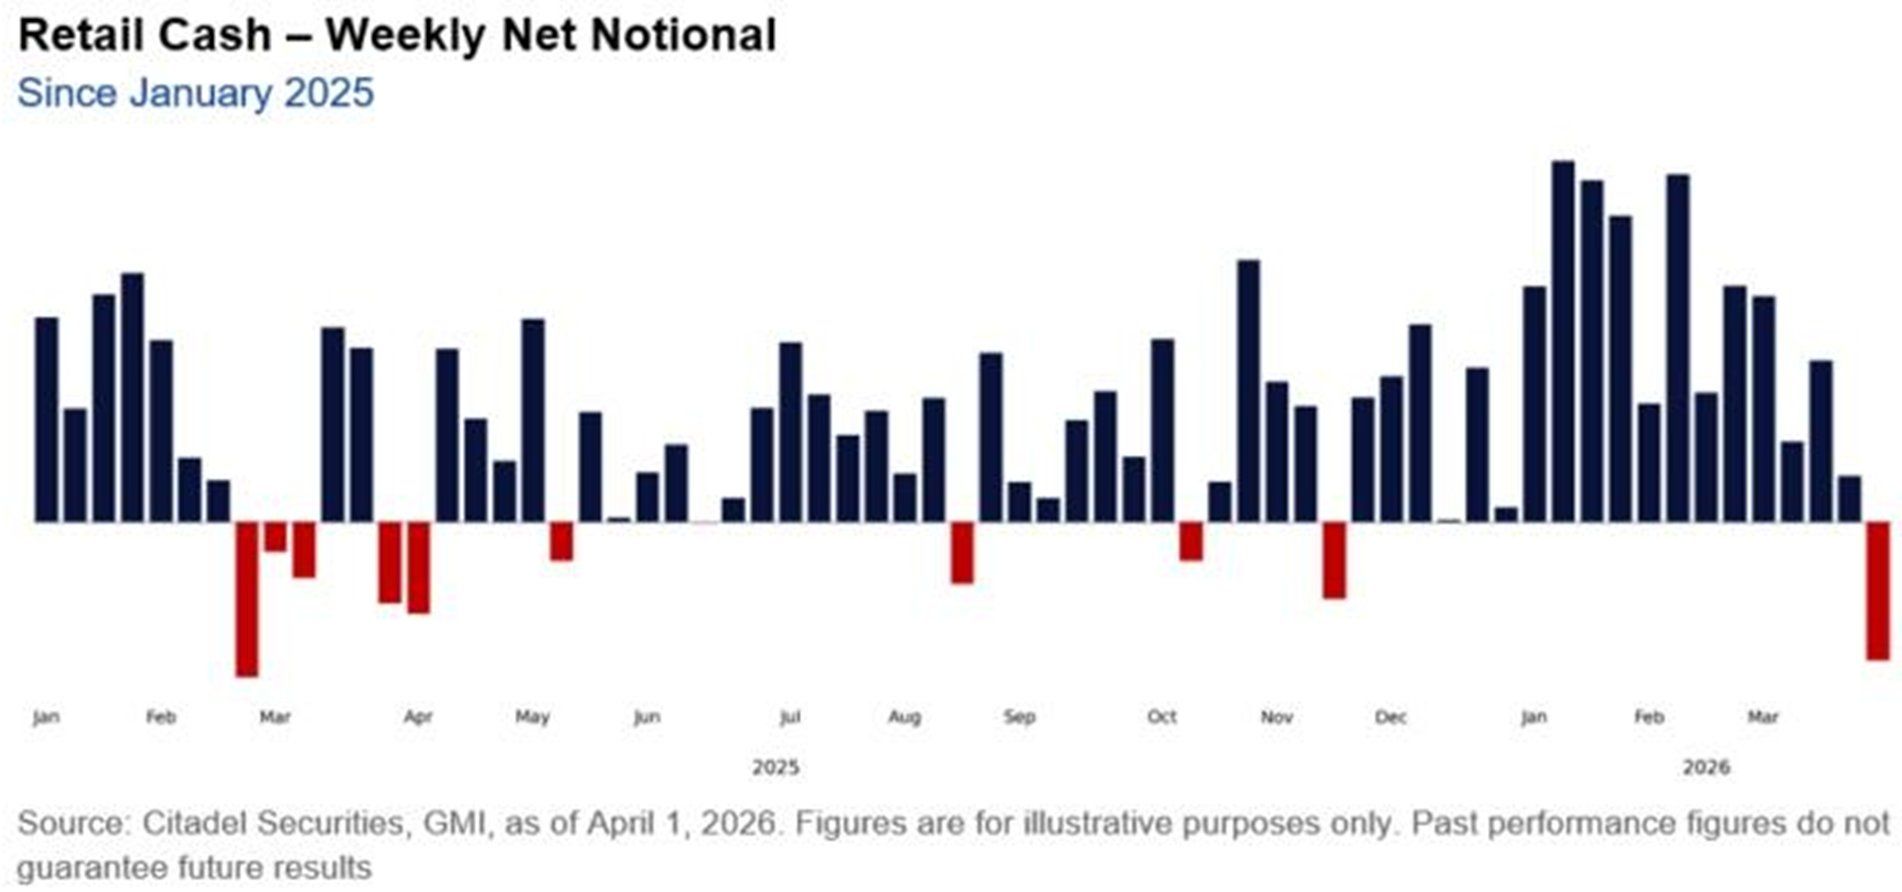
Between March 27 and April 2, retail traders also spent a record $275 million in net put options premium, the largest five-day total in nearly a year.
The defensive positioning stands in direct contrast to the index’s sharp recovery, fueled by the US-Iran ceasefire announcement that sent oil prices lower and reignited risk appetite.
Scott Rubner, head of equity and equity derivatives strategy at Citadel Securities, noted that retail net selling has occurred just 18 times since January 2020. That rarity carries a contrarian signal.
Following similar episodes, the S&P 500 has risen approximately 82% of the time within the subsequent two months, delivering an average gain of 4.1%.
Follow us on X to get the latest news as it happens
History Favors A Stock Market Rally
Meanwhile, the Kobeissi Letter noted that the S&P 500 posted seven consecutive green sessions, gaining roughly 7.6%, its longest winning streak since October 2025.
The analysts explained that since the 1950s, the S&P 500 has recorded a similar winning run with at least a 7.0% gain only nine other times.
In eight of those nine instances, the index was higher one month later, with an average return of +4.4%. Over the following three months, it gained in seven cases, with an average return of +10.2%.
“History says market momentum is set to continue,” the post read.
Breadth has also improved. Roughly 65% of stocks in the Invesco QQQ Trust (QQQ) now trade above their 10-day moving averages, a 40-point jump in just five sessions.
Seasonal patterns add another tailwind. April has historically been one of the strongest months for equities. The MSCI World Index has posted gains roughly 75% of the time, with an average return of about 2% over the past 25 years.
Taken together, the divergence between cautious retail positioning and strengthening market internals suggests the current rally may still have room to run.
If historical patterns hold, retail capitulation could once again act as a contrarian signal, supporting further upside in equities over the near term.
Subscribe to our YouTube channel to watch leaders and journalists provide expert insights
The post Retail Investors Sold US Stocks for the First Time Since November appeared first on BeInCrypto.

March’s U.S. jobs report showed the economy adding 178,000 payrolls, a modest gain that left the overall pace of hiring largely unchanged from the prior month, according to the Bureau of Labor Statistics. The broader employment landscape unfolded against a backdrop of policy shifts, rising energy costs tied to geopolitical tension, and fresh research suggesting AI could be reshaping how work gets done even if it isn’t translating into uniform job expansion across sectors.
While proponents of artificial intelligence tout an era of productivity-driven growth, the latest numbers underscore a complex reality: the promised boom may be uneven, and the link between AI adoption and net hiring remains nuanced. In March, while healthcare and construction led the job gains, the tech sector showed little net acceleration and even registered some cutbacks in related services. That divergence highlights a broader dynamic as businesses experiment with AI tools while reassessing roles and staffing needs.
Key takeaways
- March posted 178,000 new jobs, with healthcare adding 76,000, construction 26,000, transportation and warehousing 21,000, and social assistance 14,000; the tech sector saw muted growth and declines in some related services (computer systems design down 13,000).
- Openings in technology roles have risen in reported counts—Business Insider cites data from TrueUp showing tech job openings doubling to about 67,000 since 2023—yet this hasn’t necessarily translated into equivalent hires.
- Industry analyses suggest AI-driven displacement could be real and lingering: Goldman Sachs, cited by Fortune, has estimated that AI-related job cuts could amount to roughly 16,000 roles per month across the economy.
- Executive optimism about AI persists even as workers report growing frustration: 80% of leaders use AI weekly with 74% noting positive early returns (Harvard Business Review), while Mercer finds 43% of workers say their jobs are more frustrating due to AI adoption, and only 14% report net-positive AI outcomes (Workday).
- OpenAI has released policy proposals intended to address the workforce transition, emphasizing that policy must keep pace with technology to preserve safety nets and social supports (Industrial Policy for the Intelligence Age).
AI’s mixed signal in the March payrolls
The March Labor Department figures show a broad distribution of gains across industries, with healthcare leading the charge and other non-tech sectors contributing significantly. Specifically, 76,000 new healthcare jobs were added, followed by 26,000 in construction, 21,000 in transportation and warehousing, and 14,000 in social assistance. By contrast, demand in computing-related services wasn’t as robust; related services like computer systems design contracted by about 13,000 jobs, and computing infrastructure providers registered a modest decline of around 1,500 positions.
These patterns matter because they illustrate how AI adoption is translating into real-world labor needs. While automation and AI are often pitched as accelerants of hiring through productivity gains, the March data point to a more uneven distribution of impact—where some sectors still rely on human labor to deliver growth while others grapple with substitution dynamics.
Hiring resilience vs. openings and the AI disruption debate
Beyond the headline payroll gain, job-market research paints a more complicated picture. Tech job openings have reportedly surged in recent periods—Business Insider cites TrueUp data indicating openings rose to about 67,000, up from 2023 levels—but that doesn’t automatically imply immediate increases in hiring. The discrepancy between openings and actual hires underscores a tension at the core of the AI transition: firms may be signaling demand for tech capabilities while tightening headcounts elsewhere or delaying new hires as they test AI-enabled workflows.
On the broader disruption front, Goldman Sachs has estimated that AI-driven displacement could be meaningful and persistent, highlighting the potential of ongoing shifts in entry-level hiring and routine tasks. Fortune’s coverage of the bank’s analysis notes a roughly 16,000-jobs-per-month impact, a rate that could exert lasting pressure on early-career pathways. These dynamics come as executives weigh the productivity benefits of AI against the costs of retraining, redeploying, or replacing workers over time.
Industry observers also point to historical patterns: the tech sector’s expansion has often been tied to cycles of funding, team growth, and shifts in job mix. A 2025 SignalFire study found that new-graduate hiring fell by about half from pre-pandemic levels, suggesting a structural recalibration in how and where early-career talent enters the labor market—an environment where AI-enabled processes may further alter talent pipelines.
Executive optimism, worker experience, and the policy front
There is a marked optimism among corporate leaders about AI’s strategic value. The Harvard Business Review reports that about 80% of leaders say they use AI on a weekly basis, with 74% indicating positive returns on early deployments. Yet the same period reveals a more febrile sentiment among workers. Mercer’s survey found that 43% of workers felt their jobs were more frustrating amid AI implementation, a sentiment echoed by broader productivity data.
One practical source of friction is the uneven quality of AI outputs in day-to-day work. Workday’s findings indicate that for every 10 hours of time saved through AI, nearly four hours are consumed by correcting outputs, undermining net efficiency gains. The problem isn’t limited to accuracy; researchers have highlighted phenomena like “workslop”—AI-generated content that looks polished but carries little substantive value, shifting cognitive workload onto colleagues and eroding trust and collaboration.
In parallel, OpenAI has signaled a willingness to engage policy-makers and industry players in shaping the transition. The organization released a set of policy proposals described as intentionally early and exploratory, aimed at sparking discussion around healthcare coverage, retirement savings, and a broader industrial-policy framework for the AI era. The document emphasizes a core warning: without policy alignment with technological advancement, the institutions and safety nets designed to guide workers through the transition could fall behind.
Taken together, the data point to a paradox: AI tools are increasingly central to strategic decision-making at the executive level, yet the benefits at the frontline depend on how well organizations manage implementation, training, and governance. The tension between the high-level potential of AI and the realities of day-to-day workflows remains a defining feature of the current labor market landscape.
For readers tracking industry shifts, the questions remain: will AI-led productivity spur durable employment gains across more sectors, or will displacement and upskilling needs slow the path to broad-based adoption? How quickly will policy, corporate strategy, and worker retraining align to maximize benefits while mitigating costs?
OpenAI’s policy framework and the evolving workplace experiments with AI will likely shape the answers in the months ahead. Investors and builders should watch for sector-specific hiring trends, the pace of AI-driven efficiency gains in core operations, and how firms respond to workers’ concerns about job quality and stability as automation deepens across the economy.
Additionally, the March data and related analyses underscore a broader market frame: technology-driven transformations are real and ongoing, but their immediate impact on hiring is heterogeneous. As institutions refine AI implementations and policymakers weigh timely safeguards, the next set of official payroll numbers and corporate earnings updates will be critical barometers of how quickly the labor market can adapt to an AI-enabled economy.
What’s next to watch: the next Bureau of Labor Statistics release, further employer surveys on AI integration, and policy developments around industrial strategy and social safety nets. These signals will help determine whether AI accelerates a broader, sustainable job-creating cycle or reinforces a gradual reallocation of labor toward higher-skill tasks while placing pressure on entry-level hiring.
Crypto World
Crypto TradFi perpetuals are predicting the direct of Wall Street’s Monday open with 89% accuracy
Crypto exchanges are starting to take on a new role: pricing traditional assets while Wall Street is closed.
The growing market for perpetual futures contracts tied to traditional financial instruments including commodities like gold and oil that runs around the clock on cryptocurrency exchanges is responsible.
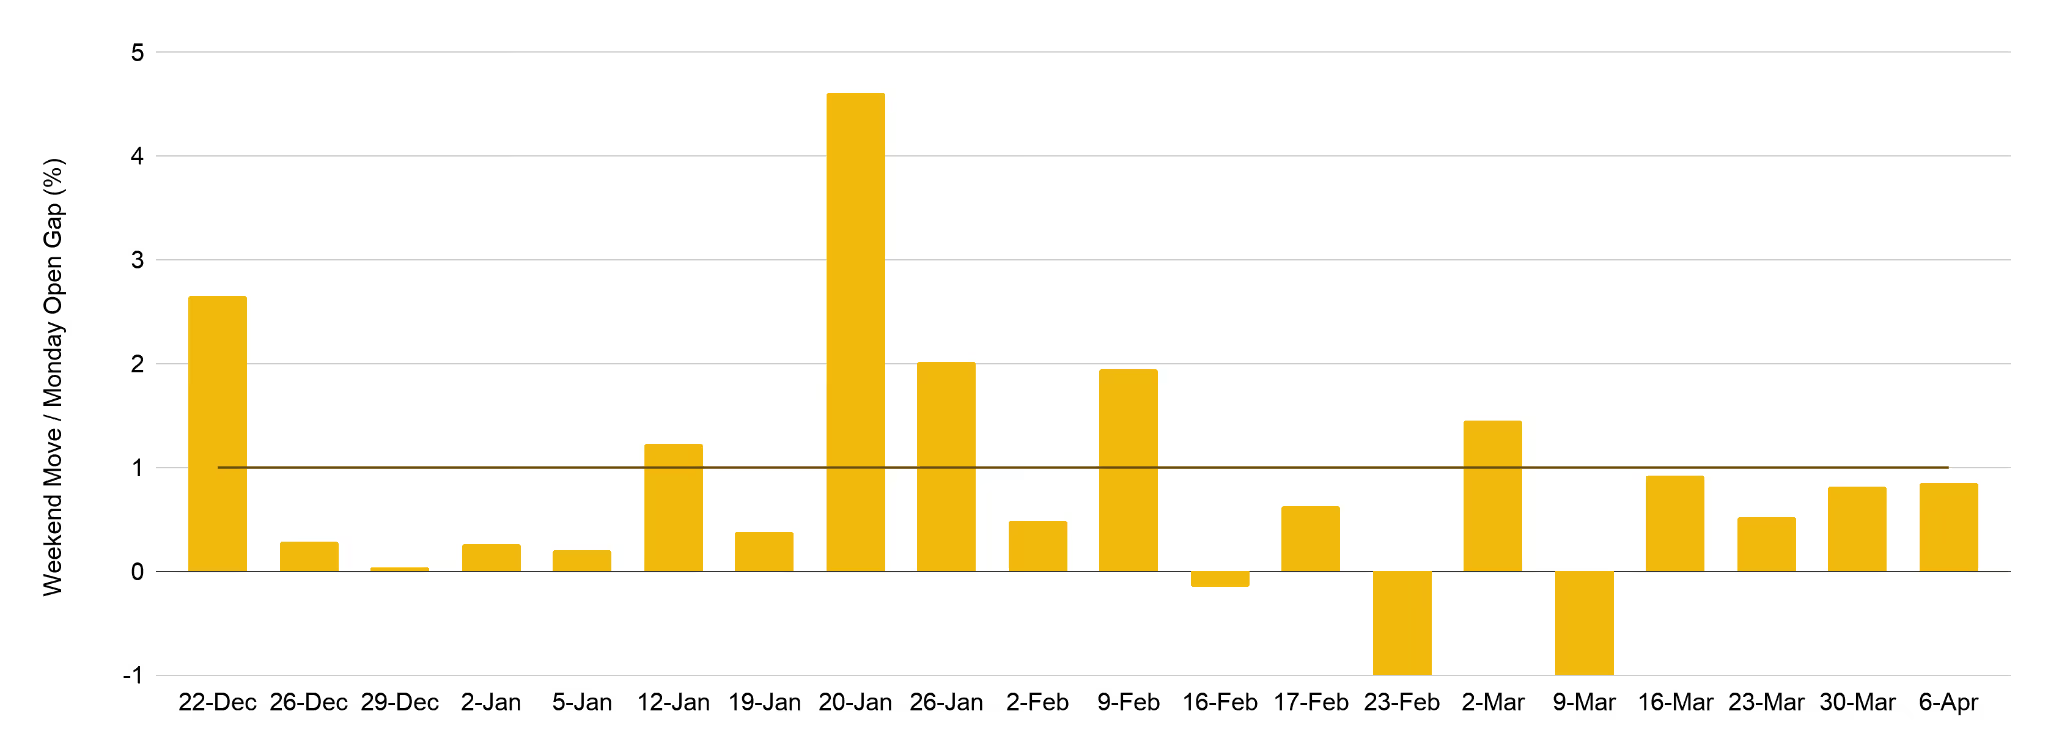
Data from Binance Research suggests these markets, which hit $31 billion in weekly trading volume on commodities volatility, are doing more than filling idle hours. Weekend price moves in gold-linked perps correctly predict the direction of Monday’s opening in traditional futures about 89% of the time, Binance found. The correlation between the two sits near 0.80, indicating a strong relationship.
The report finds a median “capture ratio” of 57%, meaning more than half of the expected move is already reflected in crypto markets before traditional exchanges open.

The extreme volatility seen over the war in Iran serves as an example. As tensions rose over the weekend of February 28 to March 1, trading volume in these contracts surged to $8.1 billion, far above typical levels. Traders used the market to hedge and react in real time while traditional venues were closed.
Weekend activity has grown steadily over the past month as volumes now average about 38% of weekday levels, according to Binance’s data.
“While the magnitude of price discovery still has room for improvement, directional accuracy is already compelling,” the firm wrote. “Weekend perpetual price movements correctly predict the direction of Monday’s opening gap 89% of the time. For traders seeking to position ahead of Monday’s open or manage weekend risk, this level of directional reliability makes TradFi-perps a valuable signal source.”
These products also offer other advantages by bringing financial instruments that would otherwise have forced crypto holders to off-ramp to access directly into their platfforms.
Read more: Traders are the big winners as 24/7 stocks will finally end the after-hours price ‘manipulation’

Key Highlights
- Citigroup downgraded DocuSign from Buy to Neutral, reducing its price target dramatically from $99 to $50
- Shares declined approximately 6% following the announcement, continuing a multi-day slide
- The company’s fiscal 2026 revenue expansion of only 8% raised valuation concerns
- Emerging AI-powered competitors pose potential disruption threats to traditional SaaS business models
- Year-to-date performance shows DOCU down approximately 34.5%, trading more than 54% below its peak
DocuSign experienced a particularly challenging week as shares tumbled following a significant analyst downgrade. On April 10, Citigroup shifted its rating on the digital signature provider from Buy to Neutral while simultaneously slashing its price objective from $99 down to $50. The dramatic reduction caught investor attention and triggered immediate selling.
The downgrade centered on a fundamental concern: revenue expansion. DocuSign reported fiscal 2026 revenue growth of merely 8%. For a technology company that historically traded at premium multiples, such modest single-digit expansion creates a challenging narrative for investors anticipating stronger performance.
Citi’s research analyst emphasized that the decelerated growth trajectory makes the stock’s previous valuation levels difficult to support. The revised $50 price objective signals a substantially more conservative outlook on the company’s near-term potential.
The Citigroup rating cut didn’t occur in isolation. One trading session prior, DOCU shares had already declined 4.4% as market-wide nervousness intensified.
Some of that previous session’s weakness stemmed from geopolitical developments — news surrounding a ceasefire collapse in Middle Eastern regions unsettled markets and prompted investors to reduce exposure to growth-oriented technology names.
However, another catalyst hit particularly close to the software sector. Anthropic’s introduction of Managed Agents — autonomous artificial intelligence systems capable of executing sophisticated, multi-stage workflows — sparked concerns that conventional SaaS applications might face meaningful competition from AI-first platforms.
Artificial Intelligence Rivals Create Uncertainty
The concern carries substance. Should AI-powered agents successfully replicate functionality currently delivered by specialized software platforms like DocuSign, the total addressable market for such solutions could contract significantly over time.
Notable short seller Michael Burry contributed to the apprehension with a social media comment (later deleted) suggesting Anthropic[[/LINK_END_3]] was undermining Palantir’s business. Though the post was swiftly removed, market participants took notice — amplifying broader concerns regarding established SaaS providers.
It’s notable that DOCU has experienced 16 separate trading sessions with single-day price movements exceeding 5% throughout the past year. The equity clearly responds sharply to developments, with investors rapidly adjusting their valuations.
Current Trading Position
At a price of $42.49 per share, DocuSign currently trades 54.7% beneath its 52-week peak of $93.84, which the stock reached in June 2025.
Since the beginning of the calendar year, shares have declined approximately 34.5%. That represents a substantial contraction in barely more than a fiscal quarter.
For perspective: an investor who allocated $1,000 to DocuSign stock five years ago would currently hold a position valued at roughly $199.
The technical analysis also presents challenges. Daily trading volume has averaged north of 5 million shares, while technical momentum indicators currently flash a Sell signal.
The company’s market capitalization now stands at approximately $8.86 billion, representing a meaningful decrease from levels reached during periods of stronger growth expectations.
Citigroup’s $50 price objective represents the most recent Wall Street analyst adjustment for the security.


Key Points
- Super Micro Computer shares rallied approximately 9% Friday following the Gold Series server announcement.
- The new Gold Series features more than 25 ready-to-deploy server configurations designed for AI, cloud computing, and data storage applications.
- All systems ship within a three-business-day window and arrive fully equipped with processors, graphics cards, RAM, and storage drives.
- Company CEO Charles Liang emphasized the platform reduces delivery timelines and speeds up customer implementation.
- Despite Friday’s rally, SMCI remains down 18.3% in 2025 and trades 58.3% beneath its 52-week peak of $60.71.
Super Micro Computer (SMCI) posted a roughly 9% gain Friday after introducing its Gold Series enterprise server portfolio, a ready-to-ship platform designed to accelerate deployment timelines for business clients.
Super Micro Computer, Inc., SMCI
The Gold Series encompasses more than 25 distinct server models selected from Super Micro’s current product catalog. The lineup includes both single-socket and dual-socket architectures, each engineered for artificial intelligence, cloud infrastructure, and storage operations.
Every configuration arrives fully integrated with central processing units, graphics processing units, memory modules, and storage components. According to the company, all orders leave distribution centers within three business days of placement.
CEO Charles Liang positioned the initiative as a velocity-focused strategy. “We make our industry-leading server portfolio available to our customers even faster, significantly shortening lead times and accelerating their time-to-online,” he stated.
Another Significant Swing for a High-Volatility Equity
SMCI has experienced 48 single-day movements exceeding 5% during the past twelve months. Friday’s advance continues this established volatility pattern — notable in magnitude, yet not necessarily indicative of shifting sentiment on the company’s fundamental outlook.
The most recent substantial decline occurred eleven days prior when shares dropped 5.4%. That selloff coincided with escalating geopolitical tensions that pushed both the Dow Jones Industrial Average and Nasdaq Composite into correction territory, each declining over 10% from recent peaks. Climbing crude oil prices and inflation concerns triggered widespread equity market weakness.
Friday’s positive session doesn’t reverse those losses. SMCI continues trading down 18.3% year-to-date.
Current Valuation Context
Trading at $25.30 per share, SMCI sits 58.3% below its 52-week high of $60.71, established in July 2025.
Despite recent volatility, investors with longer holding periods maintain substantial appreciation. A $1,000 investment in Super Micro five years ago would currently be valued at approximately $6,321.
The Gold Series introduction arrives as Super Micro expands its presence in the enterprise artificial intelligence infrastructure market. The emphasis on rapid fulfillment and turnkey configurations indicates the company is pursuing customers prioritizing deployment speed and operational simplicity over customized solutions.
The company did not release revised revenue projections or earnings estimates alongside Friday’s product unveiling.

Key Takeaways
- Citi Research moved six software companies from Buy to Neutral ratings: Similarweb, Docusign, Autodesk, Nice, CCC, and Veeva
- Price target reductions exceeded 40% for multiple companies in the downgrade sweep
- Piper Sandler identifies Anthropic’s Claude Managed Agents as existential risk to legacy software providers
- Investment firms pivot toward cloud hyperscalers Microsoft and Oracle instead of traditional enterprise software
- CNBC’s Jim Cramer confirms hardware-over-software thesis has returned with staying power
In a sweeping move that sent shockwaves through technology markets, Citi Research slashed ratings on six application software companies Friday, moving them from Buy to Neutral. The affected firms include Similarweb, Docusign, Autodesk, Nice, CCC Intelligent Solutions, and Veeva Systems. Share prices declined across the board following the announcement.
Tyler Radke, analyst at Citi, attributed the downgrades to an absence of meaningful near-term catalysts combined with mounting evidence that artificial intelligence is beginning to erode traditional software revenue models. “While we view most of these as quality enterprises potentially well-positioned for the future, they lack compelling 12-month drivers,” Radke explained in his research note.
The firm simultaneously delivered brutal price target cuts. Docusign’s target plummeted from $99 to $50. Veeva experienced a reduction from $291 to $176. Similarweb absorbed the most severe blow, with its target collapsing from $8.50 to just $3.
Radke highlighted a troubling competitive dynamic: privately-held AI enterprises are projected to capture more than $100 billion in incremental revenue in upcoming years. This dwarfs the estimated $50 billion expected from conventional application software providers. Additional headwinds include escalating software optimization expenses and accelerating vendor consolidation trends.
Anthropic’s Agent Platform Intensifies Industry Concerns
Piper Sandler analyst Billy Fitzsimmons identified another catalyst accelerating the software sector’s decline. Anthropic recently unveiled Claude Managed Agents, a preconfigured, customizable agent framework engineered for extended-duration and asynchronous workflows.
Fitzsimmons noted this development fuels apprehension that Anthropic’s agent technology will directly challenge solutions developed by incumbent software vendors. He anticipates sustained negative sentiment toward the software industry extending through year-end at minimum.
Piper Sandler reduced ratings on multiple sector names while expressing preference for businesses that monetize AI computational resources directly. The firm highlighted Microsoft and Oracle as preferred investments, emphasizing their Azure and Oracle Cloud Infrastructure platforms respectively.
Microsoft currently trades at a forward price-to-earnings multiple of 20x based on 2027 projections while producing $77.4 billion in levered free cash flow. Despite a 27% contraction over the preceding six months, Piper Sandler characterizes the valuation as attractive.
Infrastructure Players Benefit from Software Sector Exodus
CNBC’s Jim Cramer drew attention to the expanding performance gap between hardware and software equities Thursday. He observed that the “buy hardware, sell software” positioning that dominated early 2026 trading has made a decisive comeback.
Salesforce declined nearly 3% while Adobe surrendered approximately 4% Thursday. The IGV software ETF, serving as a primary sector benchmark, tumbled more than 4%. CrowdStrike dropped 7.5% despite its cybersecurity focus, primarily due to its inclusion in the fund.
Conversely, hardware manufacturers rallied. Marvell Technology and Intel each advanced close to 5%. Corning, a supplier of data center materials, appreciated 2.85%.
Cramer characterized the dynamic as AI infrastructure providers commanding premium valuations while enterprise software faces treatment as a contracting industry. He suggested this pattern shows limited signs of reversing soon.
Piper Sandler separately highlighted Global-e Online as a favored selection. The company’s business model ties to ecommerce transaction volumes rather than software license counts, with management projecting 29% revenue expansion this year.

Key Points
- Authorities apprehended a 20-year-old suspect following an incendiary attack on Sam Altman’s San Francisco residence early Friday morning
- An exterior gate caught fire from the explosive device, though no casualties were reported
- Approximately 60 minutes after the initial incident, the individual made threatening statements about burning OpenAI’s Third Street facilities
- According to OpenAI representatives, structural damage remained “minimal” and San Francisco operations continued without disruption
- The incident occurred shortly following a comprehensive New Yorker exposé questioning Altman’s leadership credibility
Law enforcement officials arrested a suspect in his early twenties on Friday following an incendiary assault on the residence of OpenAI’s chief executive, Sam Altman, in San Francisco, coupled with menacing statements directed at the artificial intelligence company’s main offices.
The assault took place during the early morning hours, specifically around 4 a.m. Pacific time, in San Francisco’s prestigious Russian Hill district. The individual launched an improvised incendiary weapon at Altman’s property, igniting flames at an external gate structure.
Fortunately, no individuals sustained injuries during the incident. Representatives from OpenAI acknowledged the attack through an official statement provided to Forbes, characterizing the resulting property damage as “minimal.”
Law enforcement personnel responded to a subsequent emergency call approximately one hour following the initial attack. An individual had issued verbal threats about setting ablaze a structure located on the 1400 block of Third Street. The artificial intelligence company maintains its primary headquarters at 1455 Third Street.
Authorities determined the person responsible for the threats matched the description of the individual from the earlier residential attack. The suspect was taken into custody with criminal charges currently under consideration. Investigative procedures remain active.
OpenAI distributed an internal communication to employees acknowledging both security incidents. The organization confirmed all San Francisco facilities maintained normal operations on Friday, noting enhanced law enforcement and private security measures around company properties.
“During the early hours today, an individual threw a Molotov cocktail targeting Sam Altman’s residence and subsequently issued threats directed at our San Francisco headquarters location,” a company representative stated. “We are grateful that no injuries occurred.”
CEO’s Public Statement Following the Incident
Altman published remarks regarding the attack through his personal blog platform on Friday. He recognized that public skepticism surrounding the artificial intelligence sector frequently stems from “genuine apprehension about the extraordinarily significant implications of this technology.”
“As we engage in this critical discussion, we must reduce inflammatory language and aggressive approaches and aim for fewer explosions affecting fewer residences, both metaphorically and in reality,” he stated.
The violent incident transpired merely days following the New Yorker’s publication of an extensive year-long investigative report examining Altman. The journalistic piece characterized the executive as an ethically questionable figure leading the competitive AI development landscape.
Mounting Scrutiny on OpenAI’s Leadership
The timing coincides with escalating public scrutiny and legal challenges confronting Altman. Elon Musk has initiated legal efforts aimed at removing Altman from his OpenAI position based on allegations of fraudulent conduct.
OpenAI representatives confirmed complete collaboration with ongoing law enforcement inquiries. The San Francisco Police Department indicated that formal charges against the detained individual remained pending as of Friday evening.
The suspect successfully accessed Altman’s residential property without documented security intervention prior to deploying the incendiary device. Law enforcement has withheld public disclosure of the suspect’s identity or any potential motivations behind the attacks.

Fears of a private credit crisis are rising as firms at the heart of the growing, but less liquid and less transparent, bond market face investor redemptions. That stress test has arrived just as private loans became more prevalent in the ETF market. It was a little over a year ago that the Securities and Exchange Commission approved the first ETF branded as a private credit fund.
For ETF investors, the good news it that the risks represented by the asset class are showing up in a more controlled way, as ETFs invest directly in private credit issues are still limited in how much exposure they can have to the asset class — up to, but not exceeding 35%.
Some other, older ETF products that are tied to private credit get indirect exposure only, according to Todd Rosenbluth, head of research at VettaFi, said on CNBC’s “ETF Edge. They use vehicles like business development companies and closed end funds that primarily invest in the private credit sector. While that adds liquidity compared to holding private loans directly, it is not without investor concern in the current environment.
The VanEck BDC Income ETF (BIZD), which has roughly $1.5 billion in assets and dates back to 2013, is down 13% since the start of the year. The reason is clear: among BIZD’s top holdings are publicly traded shares of some of the private credit managers in the news, including Blue Owl Capital and Ares Capital. Blue Owl shares are down over 46% this year.
The Simplify VettaFi Private Credit Strategy ETF (PCR) is down around 20% in the past year and also focused its investments in business development companies and closed end funds.

PCR YTD
Liquidity remains the main concern for investors, and private credit is not meant for daily trading the way ETFs are, which has resulted in issues between private credit managers and investors wanting to pull out their funds. But in the ETF space, daily liquidity and trading always give investors the option to sell, though it may come at a cost.
“You can get out, you’re just going to pay or you’re going to sell at a discount to net asset value,” Rosenbluth said.
BIZD closed at a discount to its net asset value 37 times in calendar year 2025, and so far, 12 times this year.
Private credit funds, meanwhile, often restrict withdrawals during times of stress. “You’re gating because you said we can’t have a run on the bank,” Rosenbluth said.
Limits on redemptions help prevent forced selling and instability, though they don’t necessarily help to calm market fears.
State Street‘s private credit ETFs, developed with alternative investments manager Apollo Global and which included the first private credit branded ETF approved by the SEC, are examples of how access is being structured within ETFs. The State Street IG Public & Private Credit ETF (PRIV) was the first of its kind, approved by the SEC in February 2025. The State Street Short Duration IG Public & Private Credit ETF (PRSD) launched later in 2025.
These funds are meant to outperform standard bond benchmarks by including investment-grade private credit, and can both hold as much as 35% in private credit issues, or at times less than 10%. According to the State Street ETF web site, only one of PRIV’s current top 10 holdings is private credit, with treasury and mortgage-backed securities dominating in the top 10. PRSD’s top holdings are a mix of government, mortgage and currency holdings.
Performance of State Street’s private credit ETF, the first approved by the SEC, over the past year versus the aggregate bond index.
PRIV has $831 million assets under management; PRSD is much smaller, at $48 million in assets under management. Both have seen relatively flat performance since the beginning of the year. Both PRIV and PRSD hold slightly over 20% of assets in Apollo-sourced investments, according to State Street data.
Jeffrey Rosenberg, systematic fixed income senior portfolio manager at BlackRock, who runs a long-short strategy in an ETF wrapper, says the private credit investing issues are one example of how much ETFs have changed fixed income markets. As active portfolio managers in the bond market meet more investors through ETFs, it allows them more precision in targeting specific parts of the credit market. “They’ve just completely changed how liquidity provisioning, price discovery … how the ecosystem of credit market-making functions in a modern credit market,” he said on “ETF Edge.”
Money has been on the move during the recent market volatility, according to Rosenbluth, with ETF investors “taking some risk off” and moving from longer-duration bond funds into shorter-duration funds.
The biggest systemic risk in private credit markets comes from the asset-liability mismatch. “The run on the bank,” Rosenburg said. But it is his view that this type of risk is less pronounced today since many private credit vehicles limit liquidity by design. That cannot eliminate risk, but can make the risks surface more gradually, Rosenburg explained, saying impact could take place over longer time horizons as companies face refinancing at higher rates.
Both Rosenbluth and Rosenburg explained that the result of this is a system that absorbs shock differently. Private credit funds may restrict redemptions and ETFs allow for continuous trading with real-time price adjustments — allowing markets to keep functioning while reflecting stress as it develops. Both approaches, they say, aim to prevent disorderly outcomes.
Sign up for our weekly newsletter that goes beyond the livestream, offering a closer look at the trends and figures shaping the ETF market.


Crypto asset manager Bitwise has filed an amended registration statement with the U.S. Securities and Exchange Commission for a proposed exchange-traded fund (ETF) tied to Hyperliquid’s HYPE
The updated S-1 for the fund, which would hold HYPE directly and list on NYSE Arca, said it would trade under the ticker BHYP. The fund aims to track the token’s price, offering investors exposure to it without leveraging crypto exchanges or wallets.
The proposed product includes a staking component. Bitwise said the fund would stake a portion of its holdings to earn additional tokens, with about 85% of staking rewards retained after fees.
The filing also details a 0.67% annual management fee and custody arrangements with Anchorage Digital, a federally chartered crypto bank.
The price of Hyperliquid’s HYPE token has surged over the past year. The token is up around 200% over the last 12 months, as it became the go-to decentralized trading platform for perpetual contracts, including those tied to traditional financial products.
Other asset managers have also moved to list HYPE-linked exchange-traded funds. These include Grayscale, which filed last month to list under the ticker GHYP on Nasdaq, as well as 21Shares and VanEck.


Ron Hammond, head of policy at crypto market maker Wintermute, has a cautious outlook on the Clarity Act, putting its chances of passage this year at around 30% even as momentum builds in Washington.
“There are a lot of moving parts,” Hammond said, pointing to a legislative process that is advancing, but unevenly. The Clarity Act aims to create rules around crypto market structure regulation in the U.S., including codifying how the Securities and Exchange Commission and Commodity Futures Trading Commission can oversee digital assets in the U.S.
Hammond’s estimate broadly aligns with other signals in the market. A recent Punchbowl survey of lobbyists and staffers put the odds at 26%, while prediction market Kalshi has hovered just above even odds. The spread underscores how uncertain the bill’s trajectory remains.
Still, Hammond, who will be speaking at CoinDesk’s Consensus Miami conference next month, sees incremental progress. Lawmakers are pushing to move the bill through committee, with some aiming for a vote as early as April 20, though he cautioned that such timelines have been fluid for months.
“These dates are moving,” he said. “There’s light at the end of the tunnel, but there are hurdles along the way.”
Passage of the Clarity Act is widely seen as a key unlock for institutional adoption of crypto because it would establish clear rules around which digital assets are securities versus commodities, and define how they can be traded, custodied and otherwise regulated in the U.S.
Today’s fragmented and uncertain framework has kept many large asset managers, banks and pension funds on the sidelines due to legal and compliance risks. A comprehensive market structure law would reduce that ambiguity, giving institutions the confidence to scale exposure, launch new products, and integrate crypto more fully into traditional financial systems.
Hurdles
At the center of those hurdles: banks.
According to Hammond, traditional financial institutions remain the biggest obstacle, particularly around the issue of whether stablecoins should offer yield. A recent report from the Council of Economic Advisers has pushed back on bank opposition, but negotiations remain stuck.
“There have been attempts from a number of sides: Coinbase (COIN), the White House, the bill’s drafters, to find a solution,” Hammond said. “But at every turn, the banks refuse to give way.”
The dispute has already derailed at least one compromise. Hammond said a proposed “yield deal” floated roughly two weeks ago failed to satisfy either side, sending negotiators back to the drawing board. A new version is now circulating, but expectations are tempered.
“Even with broader macro pressures, it’s hard to see how the banks get happy here,” he said.
Democrats
That resistance is shaping the politics around the bill, particularly for Democrats. Hammond noted that some lawmakers who have accepted crypto industry funding are now navigating a difficult balancing act.
“If you’re a Democrat who took crypto money, where do you stand on this issue?” he said, pointing also to unresolved concerns around decentralized finance (DeFi) and anti-money laundering compliance.
Additional political headwinds could emerge in the coming months. Hammond flagged ongoing scrutiny around former President Donald Trump’s crypto-related dealings as a potential flashpoint that could complicate Democratic support if it intensifies around June.
“All of that becomes another headache,” he said.
Despite the friction, Hammond believes the bill still has a viable, if narrow, path forward. Progress in committee and continued negotiations could keep it alive into midyear, when political incentives may shift.
“There will be some progress soon,” he said.
U.S. expansion
For Wintermute, the stakes are high. The firm, one of the largest crypto market makers globally with roughly $10 million in daily trading volume, is expanding its U.S. footprint, and growing its New York team.
Hammond said that reflects a broader industry commitment to the U.S. market, particularly under what firms see as a more favorable regulatory environment. “Wintermute has expanded operations since the election by establishing a U.S. office in NYC and we have been actively hiring,” he added.
That makes the outcome of the Clarity Act all the more consequential. While Hammond sees “light at the end of the tunnel,” he emphasized that passage in 2026 will require breakthroughs that have so far proved elusive.
For now, 30% remains his number, and a reminder that progress in Washington does not always translate into results.
Read more: Bitcoin is stuck in a rut but JPMorgan says new legislation could be the ultimate spark

CSK vs DC LIVE Score, IPL 2026: Sanju Samson Slams 115 Not Out, CSK Post 212/2 vs Delhi Capitals

‘Crimson Desert’ Is a Cat Dad Simulator

Fury vs Makhmudov LIVE: Start time, fight stream, latest updates and results


-

 Business6 days ago
Three Gulf funds agree to back Paramount’s $81 billion takeover of Warner, WSJ reports
-

 Sports7 days ago
India men’s 4x400m and mixed 4x100m relay teams register big progress | Other Sports News
-

 Politics21 hours ago
US brings back mandatory military draft registration
-

 Fashion22 hours ago
Weekend Open Thread: Veronica Beard
-

 Tech4 days ago
How Long Can You Drive With Expired Registration? What Florida Law Says
-

 Business6 days ago
No Jackpot Winner, Prize to Climb to $231 Million
-

 Fashion5 days ago
Massimo Dutti Offers Inspiration for Your Summer Mood Board
-
 Sports22 hours ago
Man United discover Nico Schlotterbeck transfer fee as defender reaches Dortmund agreement
-

 Fashion4 days ago
Let’s Discuss: DEI in 2026
-

 Crypto World3 days ago
Bitcoin recovers as US and Iran Agree a Ceasefire Deal
-

 Crypto World2 days ago
Canary Capital Files SEC Registration for PEPE ETF
-

 Business7 days ago
Akebia Therapeutics, Inc. (AKBA) Discusses Pipeline Progress and Strategic Focus on Kidney Disease Treatments at R&D Day – Slideshow
-

 Business19 hours ago
Tesla Model Y Tops China Auto Sales in March 2026 With 39,827 Registrations, Beating Cheaper EVs and Gas Cars
-

 Business1 day ago
OpenAI Halts Stargate UK Data Centre Project Over Energy Costs and Copyright Row
-

 Tech5 days ago
Haier is betting big that your next TV purchase will be one of these
-

 Tech5 days ago
Gamer Restores the Original PlayStation Portal From Two Decades Ago
-

 Politics1 day ago
Malcolm In The Middle OG Turned Down ‘Buckets Of Money’ To Appear In Reboot
-

 Tech5 days ago
The Xiaomi 17 Ultra has some impressive add-ons that make snapping photos really fun
-

 Tech5 days ago
Samsung just gave up on its own Messages app
-

 Tech5 days ago
Save $130 on the Samsung Galaxy Watch 8 Classic: rotating bezel, sleep coaching, and running coach for $369
You must be logged in to post a comment Login