

Crypto World
Break of Structure Theory: Meaning and Use

Market structure gives traders a way to read price behaviour beyond indicators and short-term noise. One of the tools within Smart Money Concept analysis is the Break of Structure, a framework used to assess whether a trend is continuing or losing control.
Rather than focusing on individual candles, a BOS looks at swing points, closes, and context across timeframes to build a clearer directional picture. Used correctly, it may support market analysis and trade alignment. This article explores what a Break of Structure is, how it’s identified, and how traders use it in practice.
Takeaways
- A Break of Structure refers to the Smart Money concept, confirming a trend continuation. It appears when the price breaks a key swing level in the direction of the existing trend, confirming that market structure remains aligned with that direction rather than signalling a reversal.
- To identify a Break of Structure, traders analyse swing highs and lows within a clear trend and look for a decisive close beyond them.
- A Break of Structure is commonly used as a confirmation tool. It may help traders frame directional bias and filter setups that align with higher-timeframe structure.
- A Break of Structure on a lower timeframe may sit within a pullback on a higher timeframe, so market structure is always relative to the chart being analysed.
Strong and Weak Swing Points
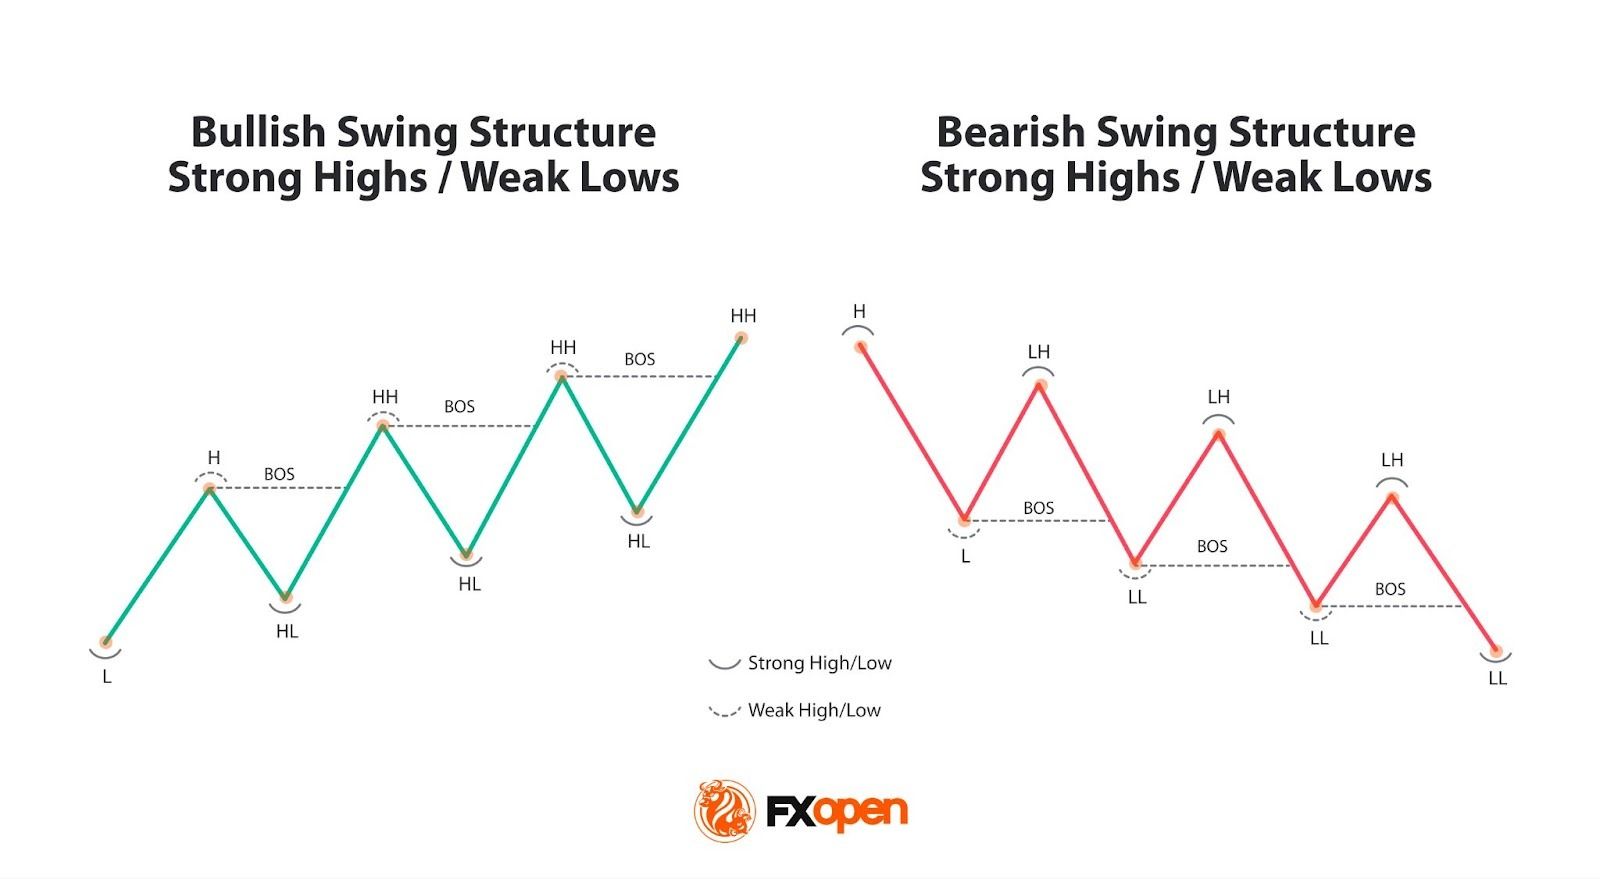
In Smart Money Concept trading, understanding the basics of market structure may be important, particularly when discerning between strong and weak swing points. These points are pivotal in analysing the current trend and play a significant role in identifying potential breaks in structure.
A strong swing point, whether it be a high in a downtrend or a low in an uptrend, is considered to be likely to hold if the price revisits the area. A bullish trend, for example, is denoted by a series of higher highs and higher lows. For the trend to remain, traders typically watch that the last higher low is not breached.
Conversely, a weak swing point is seen as vulnerable and more likely to be breached. In an uptrend, a peak or area of resistance is expected to be traded through, continuing the trend.
Recognising these points is not just about spotting highs and lows; it’s about understanding their context within the market’s narrative. They illuminate the path for traders, indicating where the market might head next and highlighting potential areas for a Break of Structure.
What Is a Break of Structure?
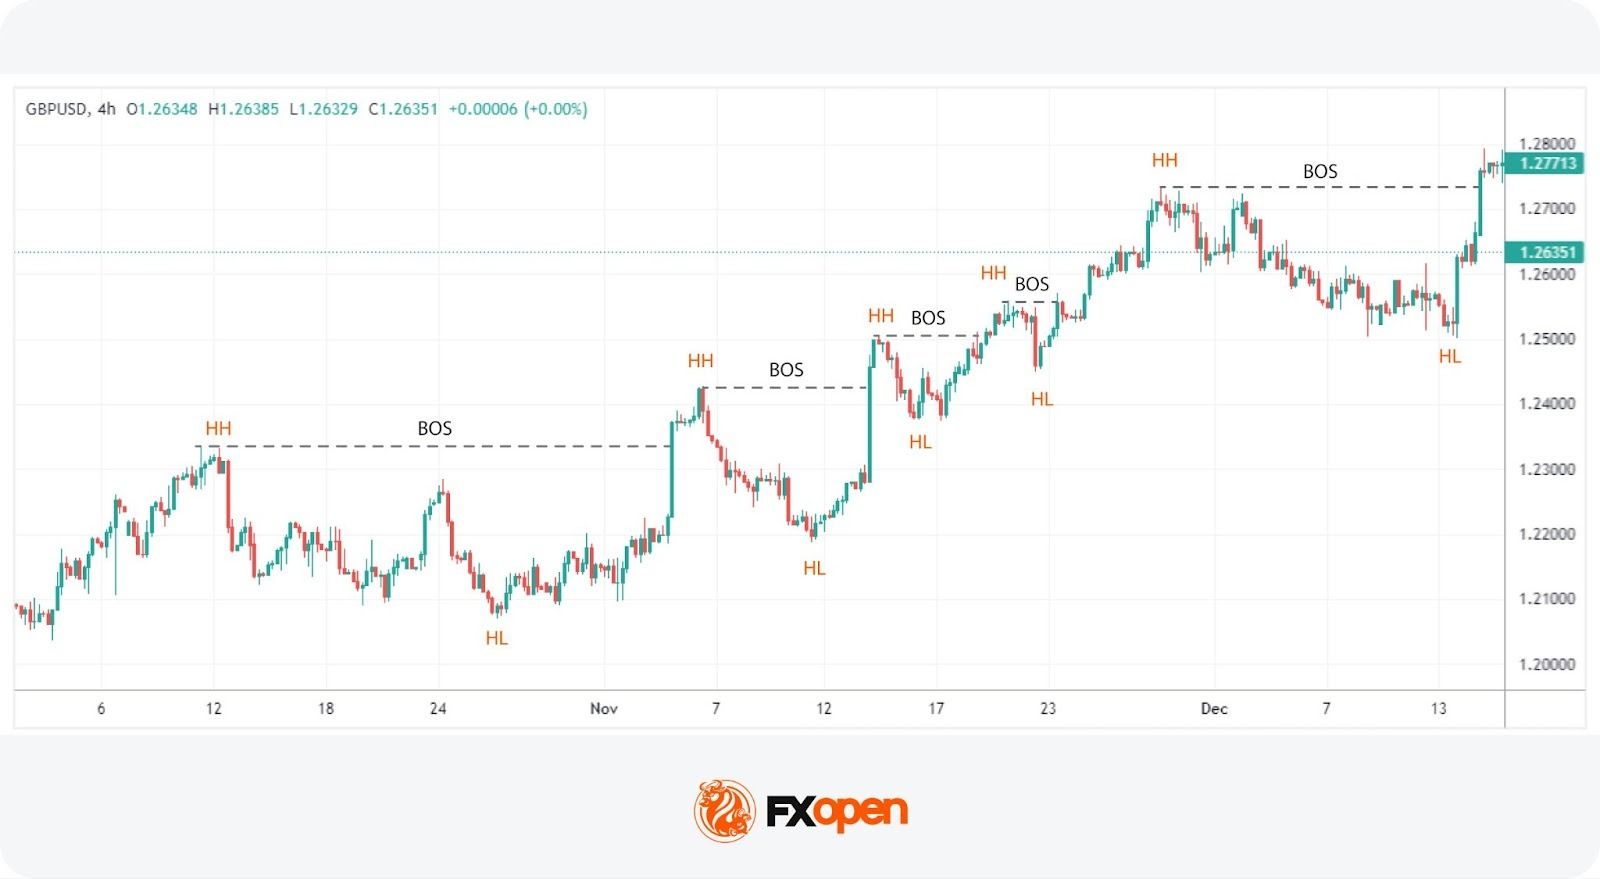
A Break of Structure (BOS) is a concept used to determine a trend continuation. It forms when the price breaks a key swing level in the direction of the existing trend, signalling that market structure remains intact. In an uptrend, this means price pushes beyond the most recent swing high while the prior higher low remains untouched.
That break shows buyers are still in control and that demand has been strong enough to absorb selling pressure at previous highs. Similarly, in a downtrend, a BOS is identified when a new low is established lower without moving beyond the prior high, showing sellers are in control. Rather than hinting at a reversal, a BOS reflects continuation, with structure confirming that the current directional bias is still valid.
How Traders Identify a Break of Structure
Identifying a BOS, as dictated by the Break of Structure theory, starts with discerning the current trend through an analysis of existing peaks and troughs. This involves observing whether there are consecutive higher highs and higher lows in an uptrend or lower highs and lower lows in a downtrend.
It’s crucial to recognise that structure can vary across different timeframes; a pattern appearing bullish in one may be just a corrective phase within a broader bearish movement on another.
To accurately identify a BOS, traders focus on pinpointing key swing points: the strong swing point, which shouldn’t be breached for the trend to remain valid, and the weak swing point, which is expected to be surpassed if the trend continues.
A genuine BOS is confirmed when the price not only trades through but also closes convincingly past the weak swing point, marking a new high or low in the trend. While a wick beyond this point can suggest a BOS, it’s considered less reliable and might simply be an attempt at a liquidity grab.
To have a go at identifying your own Break of Structure examples, you can consider using FXOpen’s TickTrader platform to access real-time forex, commodity, stock, and crypto* CFD charts.
Break of Structure Trading Strategy
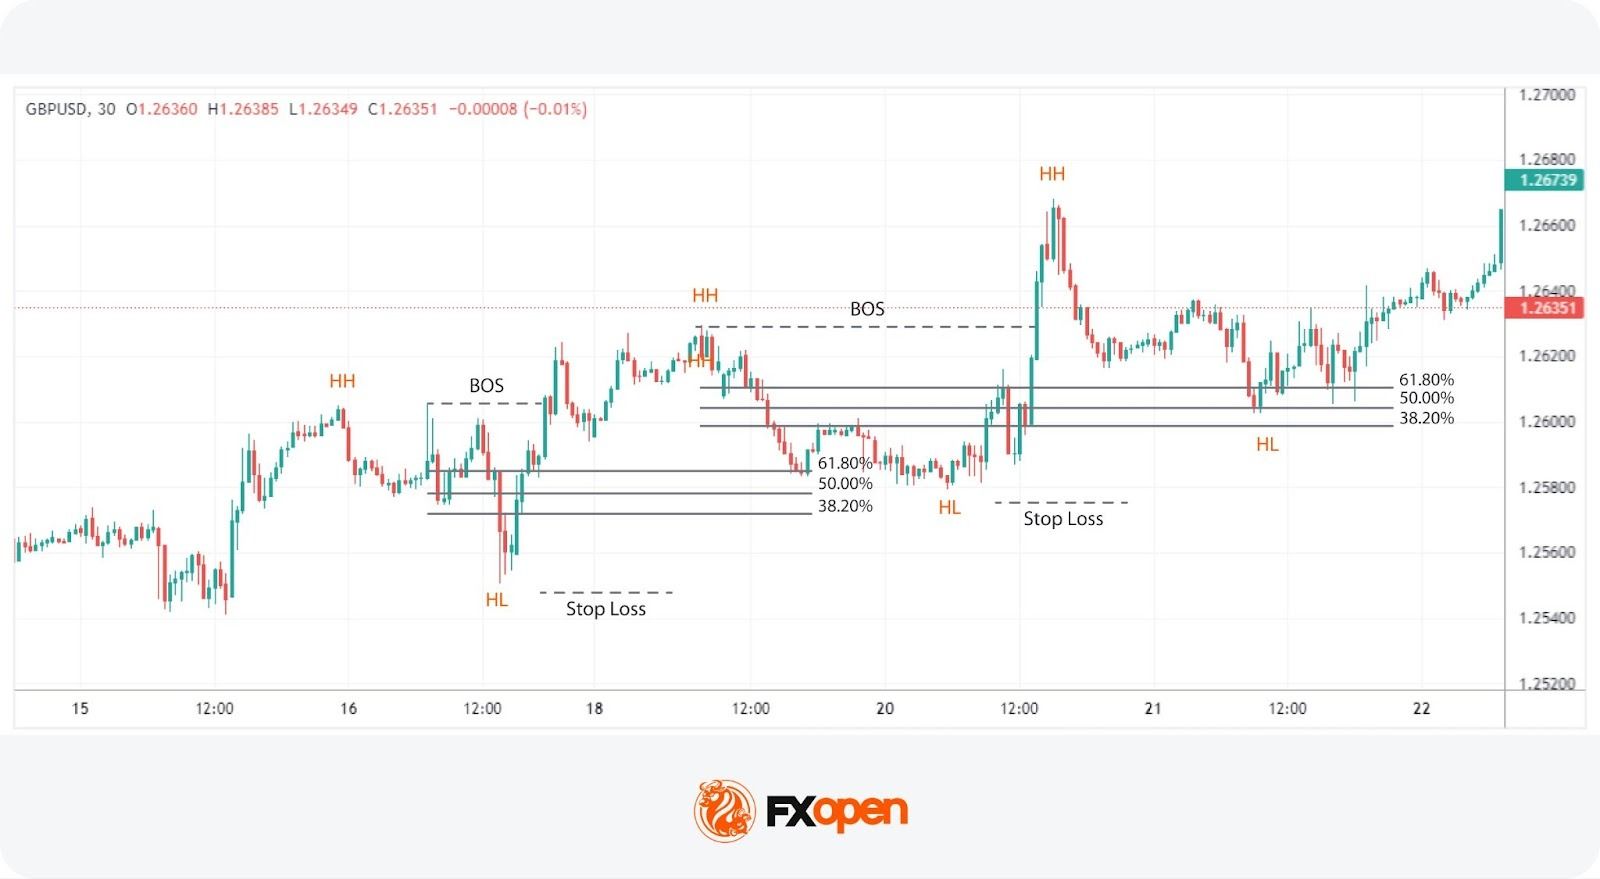
This BOS strategy leverages the natural ebb and flow of trends, capitalising on the continuation patterns that emerge. This approach hinges on the identification of a BOS, followed by strategic positioning to take advantage of the expected trend continuation.
Utilising tools like the Fibonacci retracement between significant points allows traders to pinpoint potential entry zones within the context of a BOS, aligning with key levels where price retracements often stall and reverse back in favour of the prevailing trend.
Entry
- Traders typically identify a BOS in line with the current trend, employing a Fibonacci retracement tool between the high and low (in an uptrend) or low and high (in a downtrend) of the range the BOS originated from.
- They look for potential retracement to the 61.8%, 50%, or 38.2% levels, areas where the price is likely to retrace before continuation. The 50% level serves as a common medium for entry if the retracement depth is uncertain.
Stop Loss
- A stop loss might be placed just below the trough (in an uptrend) or above the peak (in a downtrend) of the swing that prompted the BOS.
Take Profit
- Take-profit orders might be placed at the previous high or low that initiated the retracement or at another strategic point, like an order block that aligns with the current momentum.
Within the SMC framework, tools like order blocks and imbalances/fair value gaps can complement this strategy. Specifically, if an imbalance exists, there’s a decent probability it’ll be filled before the trend continues. Likewise, the price will often meet an order block before continuing a trend.
In this context, a trader might prefer to set an order at one retracement level, particularly if it aligns with an imbalance fill or order block.
Difference Between a Break of Structure, Change of Character, and Market Structure Shift
Understanding the differences between a Break of Structure (BOS), Change of Character (ChoCh), and Market Structure Shift (MSS) is pivotal for navigating structure.
Break of Structure (BOS)
A BOS indicates a continuation of the current trend. It occurs when the market forms a new top in an uptrend or a new bottom in a downtrend, reinforcing the existing directional momentum. This action signifies strength in the prevailing trend without suggesting a reversal.
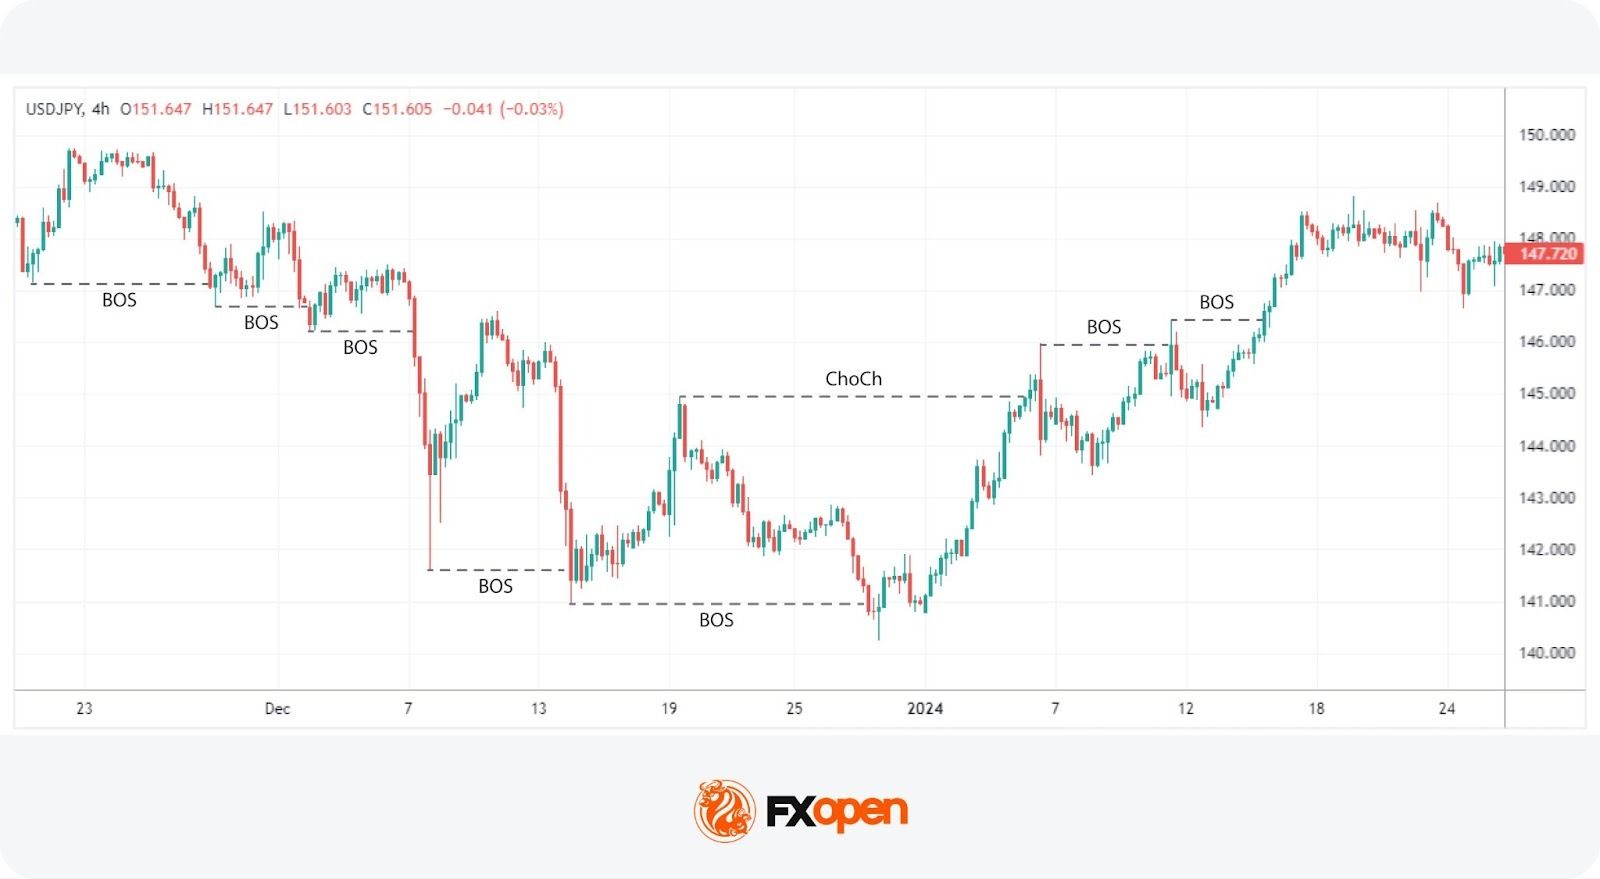
Change of Character (ChoCh)
While a BOS aligns with the trend’s direction, a Change of Character (ChoCh) represents a break in the opposite direction. It happens when a previously strong swing point, which should act as a barrier to protect the trend, is breached. This breach, especially if it involves a significant swing point, might suggest the onset of a new trend, challenging the current trajectory.
Market Structure Shift (MSS)
A Market Structure Shift (MSS) embodies the principles of a ChoCh but with additional confirmation of a potential trend reversal. Before a strong swing point is decisively broken, the market first fails to continue the trend by plotting a higher low (bull) or lower high (bear) but failing to create a higher high or lower low.
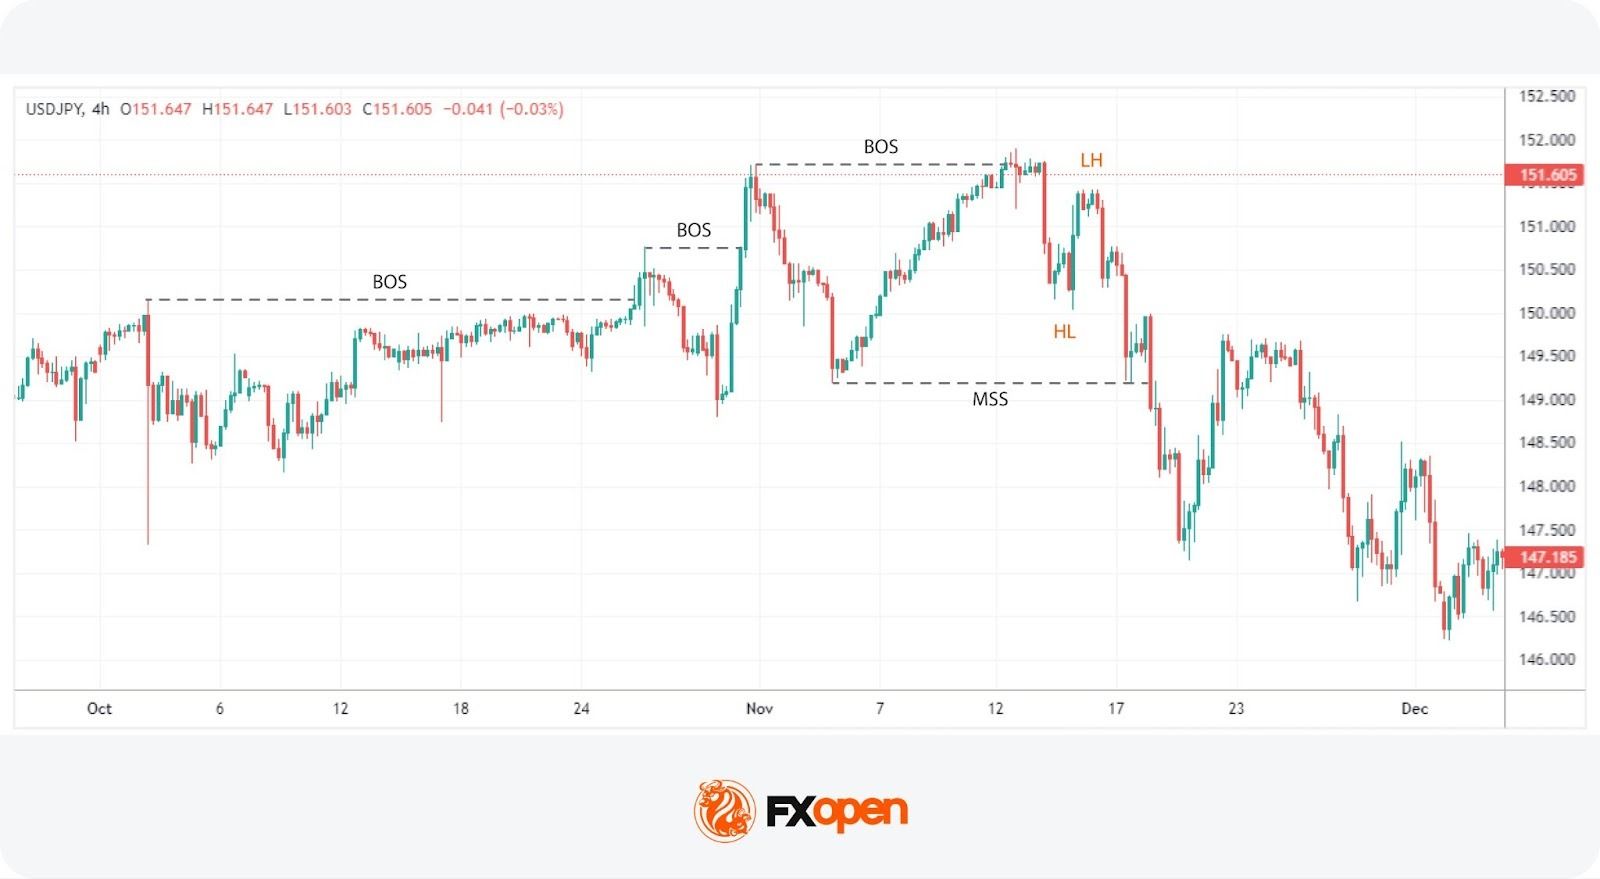
It then proceeds to break a strong swing point with a ‘displacement’ (a strong impulse move) that significantly penetrates through this point. Essentially, an MSS is a comprehensive indication that not only has the trend paused, but a new trend in the opposite direction has begun to establish itself, marked by lower highs in an uptrend or higher lows in a downtrend before the break.
In summary, a BOS aligns with the current trend, a ChoCh hints at a reversal by moving against the trend, and an MSS is a ChoCh that has already started plotting a new direction before strongly breaking through the current trend.
The Bottom Line
Navigating the complexities of market structure—particularly concepts like Break of Structure—may help traders interpret trend dynamics. Applying these principles may contribute to informed trading and strategy development. By focusing on how price reacts to key levels, traders can align their analysis with prevailing market conditions and reduce reliance on isolated signals.
If you want to test the Break of Structure concept, you can consider opening an FXOpen account to access over 700 instruments, tight spreads, and low commissions (additional fees may apply).
FAQs
What Is the Break of Structure in Trading?
A Break of Structure (BOS) in trading refers to a scenario where the market surpasses a previous peak in an uptrend or falls below a previous bottom in a downtrend, indicating the continuation of the current trend. It serves as a signal that the momentum may still be in favour of the prevailing trend direction.
How Can Traders Identify a Break of Structure?
Identifying a BOS involves observing the formation of new highs or lows within the context of a relevant trend. Traders look for a conclusive move past the most recent significant swing point that aligns with the current direction, often confirmed by a strong closing beyond this point.
What Is the Difference Between BOS and ChoCh?
While a BOS signifies trend continuation by producing new highs or lows, a Change of Character (ChoCh) occurs when the market breaks a significant swing point in the opposite direction of the current trend, potentially indicating the start of a new trend or reversal.
What Is the Difference Between BOS and MSS?
Both BOS and Market Structure Shift (MSS) involve breaking significant points, but an MSS is generally associated with a step further. It not only indicates a potential trend reversal, like a ChoCh, but also establishes the beginnings of a new trend by setting a lower high or higher low before breaking through the existing trend’s strong swing point, signalling a more definitive shift in market direction.
*Important: At FXOpen UK, Cryptocurrency trading via CFDs is only available to our Professional clients. They are not available for trading by Retail clients. To find out more information about how this may affect you, please get in touch with our team.
This article represents the opinion of the Companies operating under the FXOpen brand only. It is not to be construed as an offer, solicitation, or recommendation with respect to products and services provided by the Companies operating under the FXOpen brand, nor is it to be considered financial advice.


Doctor Profit compared Saylor’s approach to the 2000 dot-com bubble, and added that buying blindly without strategic selling is a “reckless” trading approach.
Strategy has spent years aggressively buying Bitcoin, pitching the move as a long-term, high-conviction bet, but critics say that the approach has crossed from bold into reckless.
Popular analyst Doctor Profit, for one, drew parallels to the dot-com bubble, while warning that the firm risks repeating history amid today’s AI-fueled frenzy.
Blind Faith vs Market Timing
In a recent post on X, Doctor Profit stated that he repeatedly expressed his concerns with Strategy’s co-founder, Michael Saylor, that nonstop Bitcoin accumulation, financed and backed by issuing company shares, was “playing with fire.” According to the analyst, those warnings were dismissed and even mocked.
He pointed out that since then, Strategy’s share price has fallen by roughly 75% from its highs, while Bitcoin itself is down 50% from its peak. With Saylor’s reported average BTC entry around $76,000 and the asset trading near $63,000, the position sits roughly 17% below cost.
Doctor Profit also argued that, despite accumulating since 2020, the company has never realized meaningful profits or executed serious strategic selling. Meanwhile, its stock has suffered a substantial drawdown, exposing shareholders to extreme volatility with little relief.
Looking back at past cycles, Doctor Profit said Saylor’s experience during the 2000 dot-com collapse offers a warning. He explained that intense excitement surrounding AI today may be creating a similar late-cycle setup, increasing the chance of history repeating itself by 2026.
Rather than de-risking as these signals emerged, Doctor Profit claimed that the executive chairman doubled down, increasing exposure while ignoring red flags.
You may also like:
“I truly wish MSTR and Saylor the best, but I cannot understand how reckless this trading approach is in such a late-cycle environment. Markets reward discipline, not blind belief in Bitcoin. There is always time to buy and time to sell. I hope he will listen next time instead of mocking my warnings.”
The fresh concerns come against the backdrop of Strategy’s latest Bitcoin purchase, which is smaller than its past billion-dollar buys but consistent with its long-standing accumulation plan. The firm spent just under $40 million to acquire 592 BTC at an average price of $67,286, which pushed its total holdings to 717,722 BTC.
The purchase was funded through equity sales. Nearly 298,000 Class A shares were sold via the firm’s at-the-market program over the past week, according to an update cited by Walter Bloomberg. Strategy still has substantial capacity to raise more capital through future ATM sales, as $37.4 billion in securities remain available, including MSTR and STRK stock.
Billions at Risk
As Bitcoin’s price decline deepened, earlier warnings from Michael Burry and Zac Prince drew fresh attention to the fragility of BTC treasury business models. For instance, Burry recently said BTC’s drop increases the risk of broader stress across crypto and related financial markets. “The Big Short” investor had said that further downside could severely impact companies that accumulated Bitcoin at higher prices, potentially leaving firms like Strategy billions underwater and cut off from capital markets.
Former BlockFi CEO, Prince, also questioned the sustainability of BTC treasury models, saying they rely on financial engineering rather than core business fundamentals and may struggle to justify valuations without real operating revenue.
Binance Free $600 (CryptoPotato Exclusive): Use this link to register a new account and receive $600 exclusive welcome offer on Binance (full details).
LIMITED OFFER for CryptoPotato readers at Bybit: Use this link to register and open a $500 FREE position on any coin!
Hong Kong-based stablecoin payments company RedotPay is reportedly weighing a US initial public offering (IPO) that could raise more than $1 billion and value the company at over $4 billion.
The company is working with JPMorgan Chase, Goldman Sachs and Jefferies on a potential New York listing that may occur as early as this year, Bloomberg reported on Tuesday, citing people familiar with the matter. Terms remain under review and could change, while additional banks may join the underwriting group, per the report.
Founded in April 2023, RedotPay provides stablecoin-linked payment cards, multicurrency wallets and international payout services. According to its website, the company has 6 million users and handles about $10 billion in annualized payment volume.
RedotPay declined to comment on the matter.
Related: Binance stablecoin reserves have sunk 19% since November
RedotPay raised $194 million in 2025
The US IPO plans follow a year of fundraising for RedotPay, which raised a total of $194 million in 2025 across three rounds. In March, it closed a $40 million Series A funding round led by Lightspeed, with participation from HSG and Galaxy Ventures.
In September, the stablecoin payment company said it became a fintech unicorn after closing a $47 million strategic round that saw investment from Coinbase Ventures, alongside continued backing from Galaxy Ventures and Vertex Ventures and participation from an undisclosed global technology entrepreneur.
It later closed a $107 million Series B in December. The round was led by Goodwater Capital, with participation from Pantera Capital, Blockchain Capital and Circle Ventures, as well as continued support from HSG.
Related: Standard Chartered sticks to $2T stablecoin call but trims T-bill impact
Stablecoin sector attracts significant funding
Stablecoin-focused companies drew significant investment in 2025 as venture capital continued flowing into payment and infrastructure providers. In August, investors committed almost $100 million to the sector, including a $40 million Series B for Switzerland-based M0 led by Polychain Capital and Ribbit Capital, and a $58 million raise by US startup Rain to build tools enabling banks to issue regulated stablecoins.

Funding activity continued through the year. In October, Chicago-based Coinflow secured $25 million in a Series A led by Pantera Capital to expand cross-border settlement services, while CMT Digital later launched a $136 million fund with allocations for stablecoin startups, including Coinflow and Codex.
Big Questions: Is China hoarding gold so yuan becomes global reserve instead of USD?

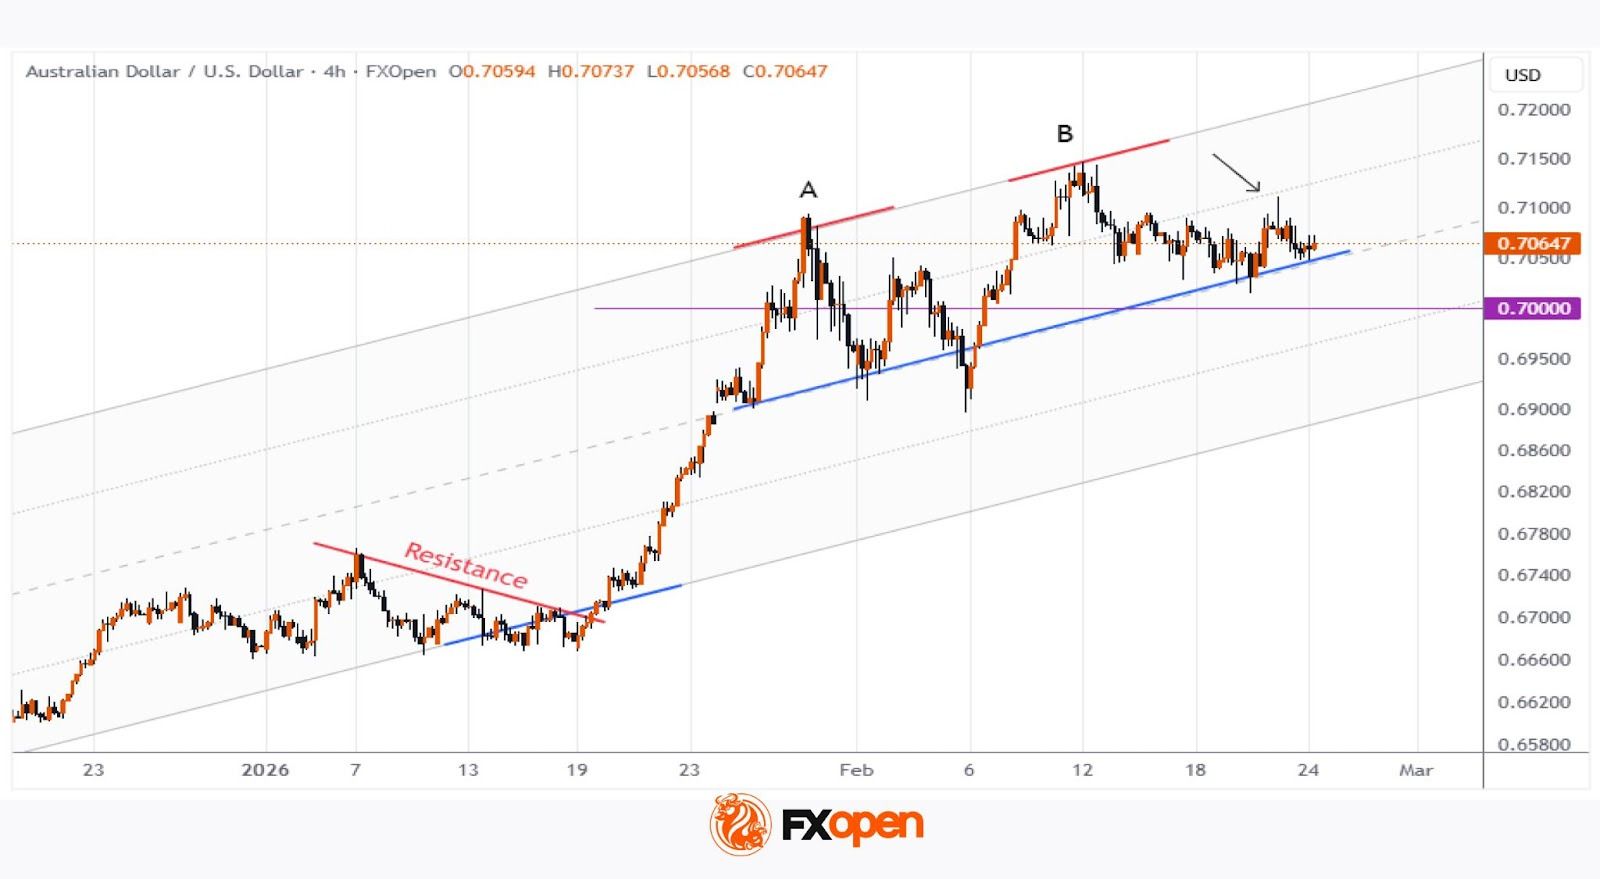
As the AUD/USD chart shows, the Australian dollar posted strong performance in January and February. Since the start of the year, the “Aussie” has gained nearly 6% against the US dollar.
Among the bullish drivers:
→ The policy stance of the Reserve Bank of Australia (RBA), which raised its cash rate to 3.85% in February 2026, while many other central banks are considering rate cuts.
→ A resilient labour market. Australia’s unemployment rate remains at 4.1%, giving the RBA room to keep interest rates elevated.
→ Commodity markets. High prices for gold, iron ore and energy exports continue to support Australia’s trade balance.
However, an important CPI report is due tomorrow. Inflation data could inject additional volatility into the market and test the strength of the Australian dollar.
Technical Analysis of the AUD/USD Chart
In early January, we identified an ascending channel that remained valid through February 2026, as bulls managed to break above resistance line R. Note that:
→ The upper boundary of the channel acted as resistance (resulting in the formation of peaks A–B).
→ The median line served as support.
An important observation is that after forming peak B, the market quickly fell back below the level of peak A. This suggests insufficient buying pressure to sustain the advance.
At the same time, the recent candlestick with a long upper wick — a potential bull trap and a bearish signal — may indicate that the AUD/USD reaction to the CPI report could be negative.
In that case, a break below the channel’s median line cannot be ruled out, opening the way for a test of the psychological 0.7000 level.
Trade over 50 forex markets 24 hours a day with FXOpen. Take advantage of low commissions, deep liquidity, and spreads from 0.0 pips (additional fees may apply). Open your FXOpen account now or learn more about trading forex with FXOpen.
This article represents the opinion of the Companies operating under the FXOpen brand only. It is not to be construed as an offer, solicitation, or recommendation with respect to products and services provided by the Companies operating under the FXOpen brand, nor is it to be considered financial advice.

Canaan (EXCHANGE: CAN) has expanded its Texas footprint by snapping up Cipher Mining’s 49% stake in three existing mining operations, broadening its exposure to low-cost, scalable power assets and reinforcing its strategic tilt toward utility-scale mining. The deal covers Alborz LLC, Bear LLC, and Chief Mountain LLC—collectively known as the ABC Projects—and elevates Canaan’s stake to 49% while WindHQ maintains a 51% majority. The trio of facilities already operates with about 120 megawatts of grid-supplied power and delivers roughly 4.4 exahashes per second (EH/s) of Bitcoin (CRYPTO: BTC) mining capacity. In addition to the equity transfer, Canaan acquired 6,840 Avalon A15Pro mining rigs from Cipher, which had been deployed at Cipher’s Black Pearl site, earmarked for conversion into an AI-HPC data center. This move aligns with a broader industry trend of miners diversifying into AI and cloud-based services as margins tighten.
The deal was financed through a significant equity issuance. Canaan issued 806,439,900 Class A shares, equivalent to 53,762,660 American Depositary Shares (ADS), priced at $0.7394 per ADS, with a six-month lockup period. The consideration signals a deliberate capital-structure adjustment to support the expansion of the Texas sites and the ongoing transition of Cipher’s Black Pearl asset. According to the filing, the Texas facilities benefit from electricity costs below 3 cents per kilowatt-hour and include wind-powered generation plus grid-demand response within the ERCOT market. The price tag attached to the acquisition reflects both the tangible hardware upgrade and the strategic value of anchoring a low-cost power profile in a state known for competitive energy economics.
Executive Chairman and CEO Nangeng Zhang framed the move as a step to “align proprietary technology with critical infrastructure to drive long-term efficiency and scale.” The strategic emphasis is clear: gain control of high-quality, affordable power assets that can sustain increased mining activity while positioning the business to capitalize on future opportunities in AI-enabled data center services. The ABC Projects bring with them a proven operational footprint in Texas, a state that remains central to miners’ growth plans given its energy mix, regulatory environment, and capacity constraints elsewhere. While Cipher’s stake transfers to Canaan, WindHQ’s stake remains, ensuring continued governance in the ventures’ direction.
Beyond the specific transaction, Canaan’s financials for the fourth quarter of 2025 augmented the narrative of a company navigating a higher-capacity, higher-visibility mining cycle. The firm reported a 121.1% year-over-year rise in revenue to $196.3 million as hardware shipments and mining activity improved. Bitcoin (BTC) mining revenue reached $30.4 million, contributing to a treasury that expanded to 1,750 BTC. The company shipped a record 14.6 EH/s of computing power during the quarter, lifting installed hashrate to 9.91 EH/s—an uptick buoyed by a large institutional order in the United States. The results underscore a sector that remains sensitive to hashprice dynamics but is able to leverage scale, efficiency improvements, and strategic site selection to sustain growth during a period of consolidation.
Canaan’s foray into AI and broader industry dynamics
As margins compress, several Bitcoin mining firms have started to pivot toward AI, cloud services, and data-center operations. The market has seen a wave of moves where traditional mining capacity is repurposed or expanded to serve AI workloads and HPC tasks. For instance, the company MARA Holdings recently took a 64% stake in Exaion, a move that signaled a broader appetite for AI-enabled infrastructure within the ecosystem. Other players, including Hive, Hut 8, TeraWulf, and Iren, have similarly explored converting mining power into AI-ready capacity, with CoreWeave having already transitioned to a broader AI-infrastructure model. These shifts reflect a strategic emphasis on building diversified, resilient revenue streams alongside traditional block rewards.
In this environment, Canaan’s acquisition strategy and the associated asset mix—low-cost Texas power, wind generation, and ERCOT grid-demand responsiveness—position the company to weather price volatility while scaling operations. The combination of tangible capacity (120 MW, 4.4 EH/s) and tangible assets (6,840 Avalon A15Pro rigs) provides a foundation for longer-term efficiency gains as the AI-HPC data-center conversion progresses at the Black Pearl site and potentially beyond. The emphasis on stabilizing power grids amid rising data-center demand also speaks to a broader industry concern: how miners can contribute to, and benefit from, grid reliability and demand-response programs while maintaining competitive economics.
As the sector evolves, investors are watching how these capital-intensive expansions translate into sustainable cash flow, given the cyclical nature of crypto markets and the sensitivity of mining economics to electricity prices, hardware costs, and BTC price movements. The Texas projects’ economics—anchored by sub-3-cent per kWh power and wind-assisted generation—could provide a durable edge if energy costs remain favorable and the broader demand for AI infrastructure accelerates. In this context, Canaan’s blend of mining capacity with AI-ready hardware represents a notable example of how traditional crypto mining players are recalibrating to operate as diversified data-center operators.
What to watch next
- Close of the Cipher Mining stake transfer and the resulting governance arrangements within the ABC Projects.
- Deployment and operational ramp of the 6,840 Avalon A15Pro rigs within the ABC Projects and the Black Pearl AI-HPC conversion timeline.
- Updates on electricity pricing, ERCOT capacity commitments, and any new wind- or grid-support arrangements affecting Texas operations.
- Canaan’s ongoing quarterly results and how the ABC Projects contribute to revenue, hash rate, and treasury growth going into 2026.
Sources & verification
- Press release: Canaan Inc. acquires Cipher Mining’s interest in multiple operational mining projects totaling 4.4 EH/s in West Texas (PR Newswire).
- Financial performance notes referencing Q4 2025 results, including revenue, BTC mining revenue, and hash rate milestones (as reported and summarized by industry coverage).
- Details of the ABC Projects’ capacity (120 MW) and hash rate (4.4 EH/s) as described in the acquisition announcement.
- Notes on the financing structure, including the share issuance and lockup terms described in the press materials.
Strategic expansion in Texas: Canaan’s ABC projects and AI ambitions
The acquisition of Cipher Mining’s minority stake in the ABC Projects marks a deliberate push by Canaan to anchor its growth in a high-visibility, cost-efficient energy corridor. By taking 49% of the three facilities and leaving WindHQ with 51%, the company gains operational influence while preserving a clear minority stakeholder structure that can support scale without over-leveraging the venture. The combined 120 MW of capacity and 4.4 EH/s of hashrate position the ABC Projects as a meaningful contributor to Canaan’s overall production capacity, particularly as the firm expands use cases for its hardware in AI and HPC environments.
The 6,840 Avalon A15Pro rigs acquired from Cipher bring additional compute power into the fold, with deployment tied to Cipher’s Black Pearl site’s AI-HPC conversion. This move exemplifies a broader miner-led shift from pure crypto mining toward diversified data-center capabilities that can power AI workloads, cloud services, and other compute-intensive tasks. The rationale is grounded in the long-run economics of power efficiency and load diversification, where operators can monetize flexible power usage through grid-demand-response programs while maintaining a robust hardware base to support both mining and AI tasks.
From a market perspective, the deal underscores how miners are reinterpreting their assets in a world where energy costs and hashprice fluctuations can materially affect profitability. Texas remains an attractive destination not only for its competitive electricity rates but also for the regulatory and market infrastructure that supports demand-response programs. The ABC Projects’ wind-powered generation and grid integration through ERCOT are notable features that can help stabilize operating costs even as the broader crypto ecosystem faces cyclical pressures. For investors and builders, the move signals a continued emphasis on scalable, asset-light expansions that couple hardware with strategic power arrangements and diversified data-center economics.


Terraform Labs’ court-appointed bankruptcy administrator has filed a lawsuit against market maker Jane Street for allegedly using non-public information to profit from the 2022 collapse of the Terra ecosystem.
Summary
- Terraform’s bankruptcy administrator has sued Jane Street, alleging the trading firm used material non-public information to front-run trades during the May 2022 collapse.
- The complaint names co-founder Robert Granieri and traders Bryce Pratt and Michael Huang.
- A Jane Street spokesperson has denied all allegations.
The lawsuit was filed on Monday and accused Jane Street insiders, including its co-founder Robert Granieri, and employees Bryce Pratt and Michael Huang of “misappropriating confidential information and manipulating market prices.”
According to the heavily redacted complaint, Jane Street front ran Terraform’s liquidity moves around the Curve 3pool withdrawal and used the information it acquired to unwind hundreds of millions of dollars in UST exposure “that hastened the collapse of Terraform.”
The suit claims that Jane Street and Terraform first connected for over-the-counter trading in 2018, but that trading “did not take off until February 2022” when Jane Street deployed Bryce Pratt, a former Terraform intern, to establish lines of communication with his former colleagues at Terraform.
Pratt allegedly helped set up those channels due to his history as a former Terraform intern, which allowed him to “seamlessly pass information from Terraform to Jane Street.”
“Given Jane Street’s interest in cryptocurrency, Pratt leveraged the relationships he had developed at Terraform to feed material non-public information to Jane Street’s crypto desk,” the complaint said.
“Jane Street abused market relationships to rig the market in its favor during one of the most consequential events in crypto history,” Terraform’s court-appointed administrator, Todd Snyder, said in a statement to the Wall Street Journal.
The lawsuit seeks damages and an order requiring Jane Street to disgorge the profits it allegedly made through insider trading and market manipulation, along with interest, and calls for a jury trial.
In response, a Jane Street spokesperson has denied all allegations and told WSJ that the suit was a “desperate” attempt to “extract money,” and the firm will defend against these “baseless, opportunistic claims.”
“[..] It is well-established that the losses suffered by Terra and Luna holders were the result of a multibillion-dollar fraud perpetrated by the management of Terraform Labs,” the spokesperson said.
Terraform collapsed in May 2022 after its algorithmic stablecoin TerraUSD lost its dollar peg, which resulted in one of the crypto industry’s largest meltdowns as roughly $40 billion vanished from the market. Subsequently, Terraform filed for bankruptcy in 2024, while co-founder Do Kwon pleaded guilty to fraud charges and was sentenced to 15 years in prison.
The bankruptcy administrator also launched a lawsuit against Jump Trading in December and claims the firm entered into secret agreements with Kwon.
XRP price continues to trade under pressure as a persistent downtrend shapes short-term momentum. The token has struggled to break above descending resistance since the beginning of the month. This prolonged weakness has created uncertainty across the broader crypto market.
Despite the downturn, some investors view current levels as strategic entry points, forming the base for a potential recovery.
XRP Bottom In Sight
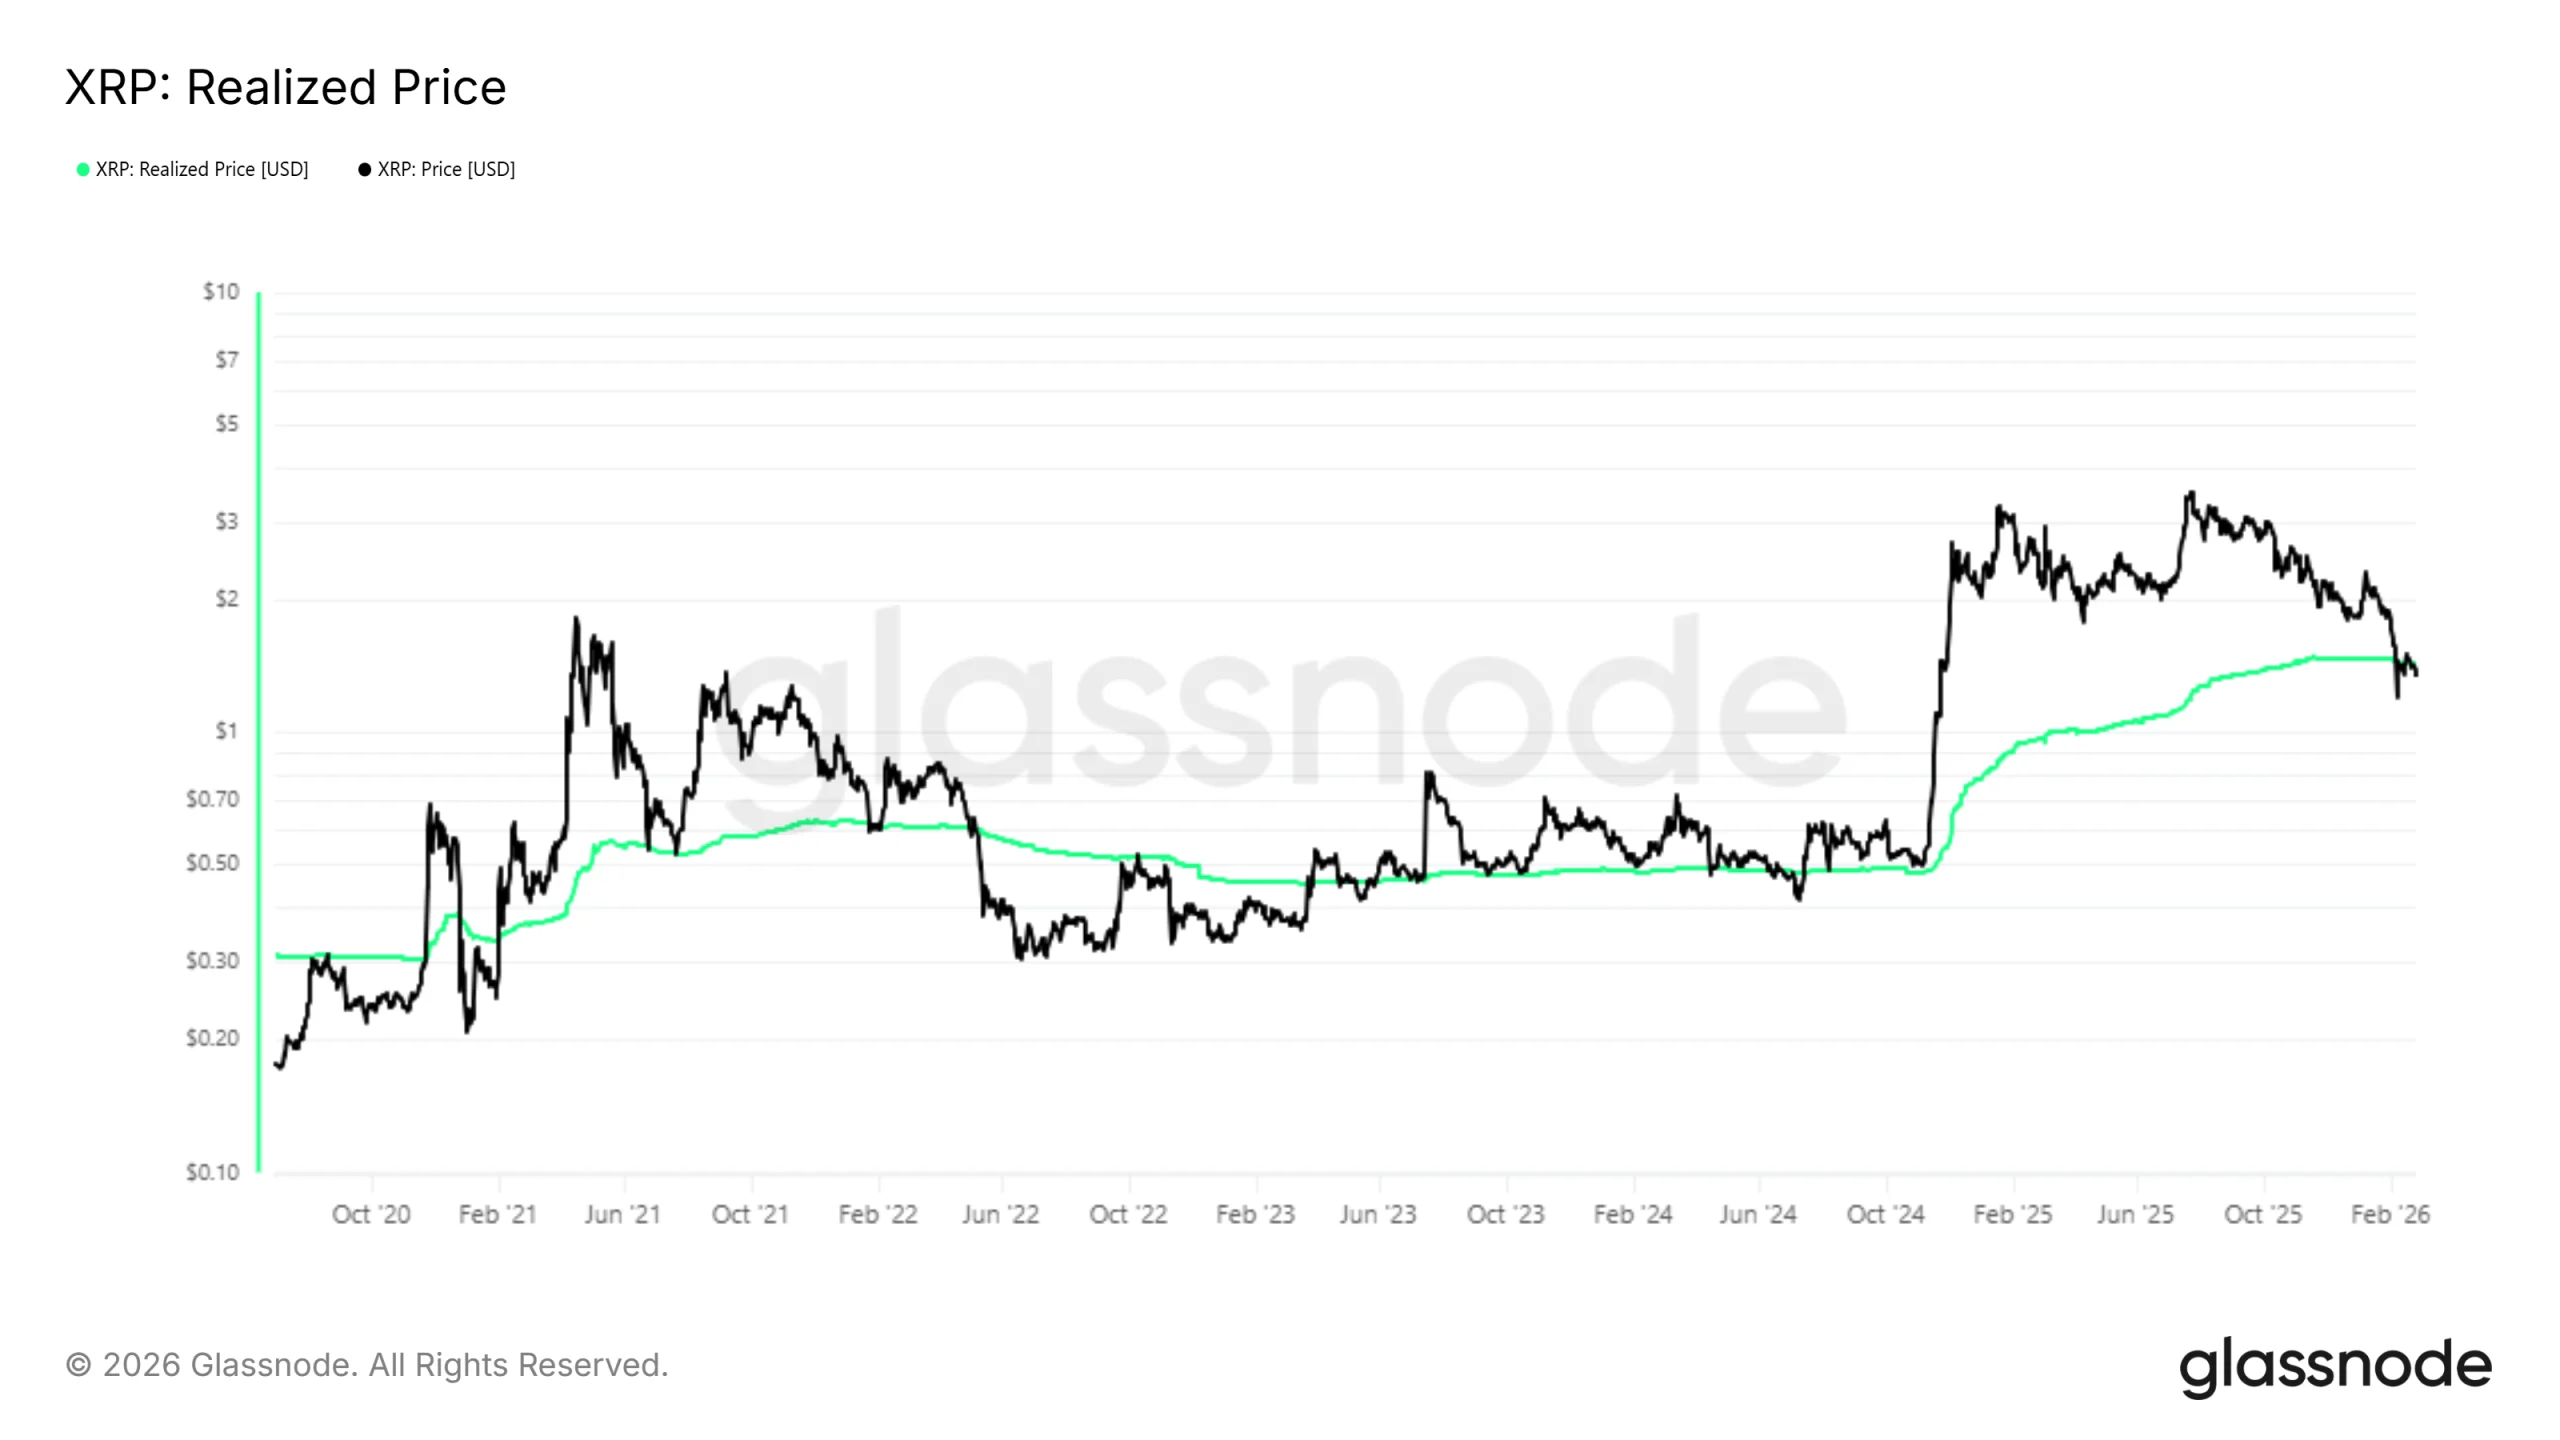
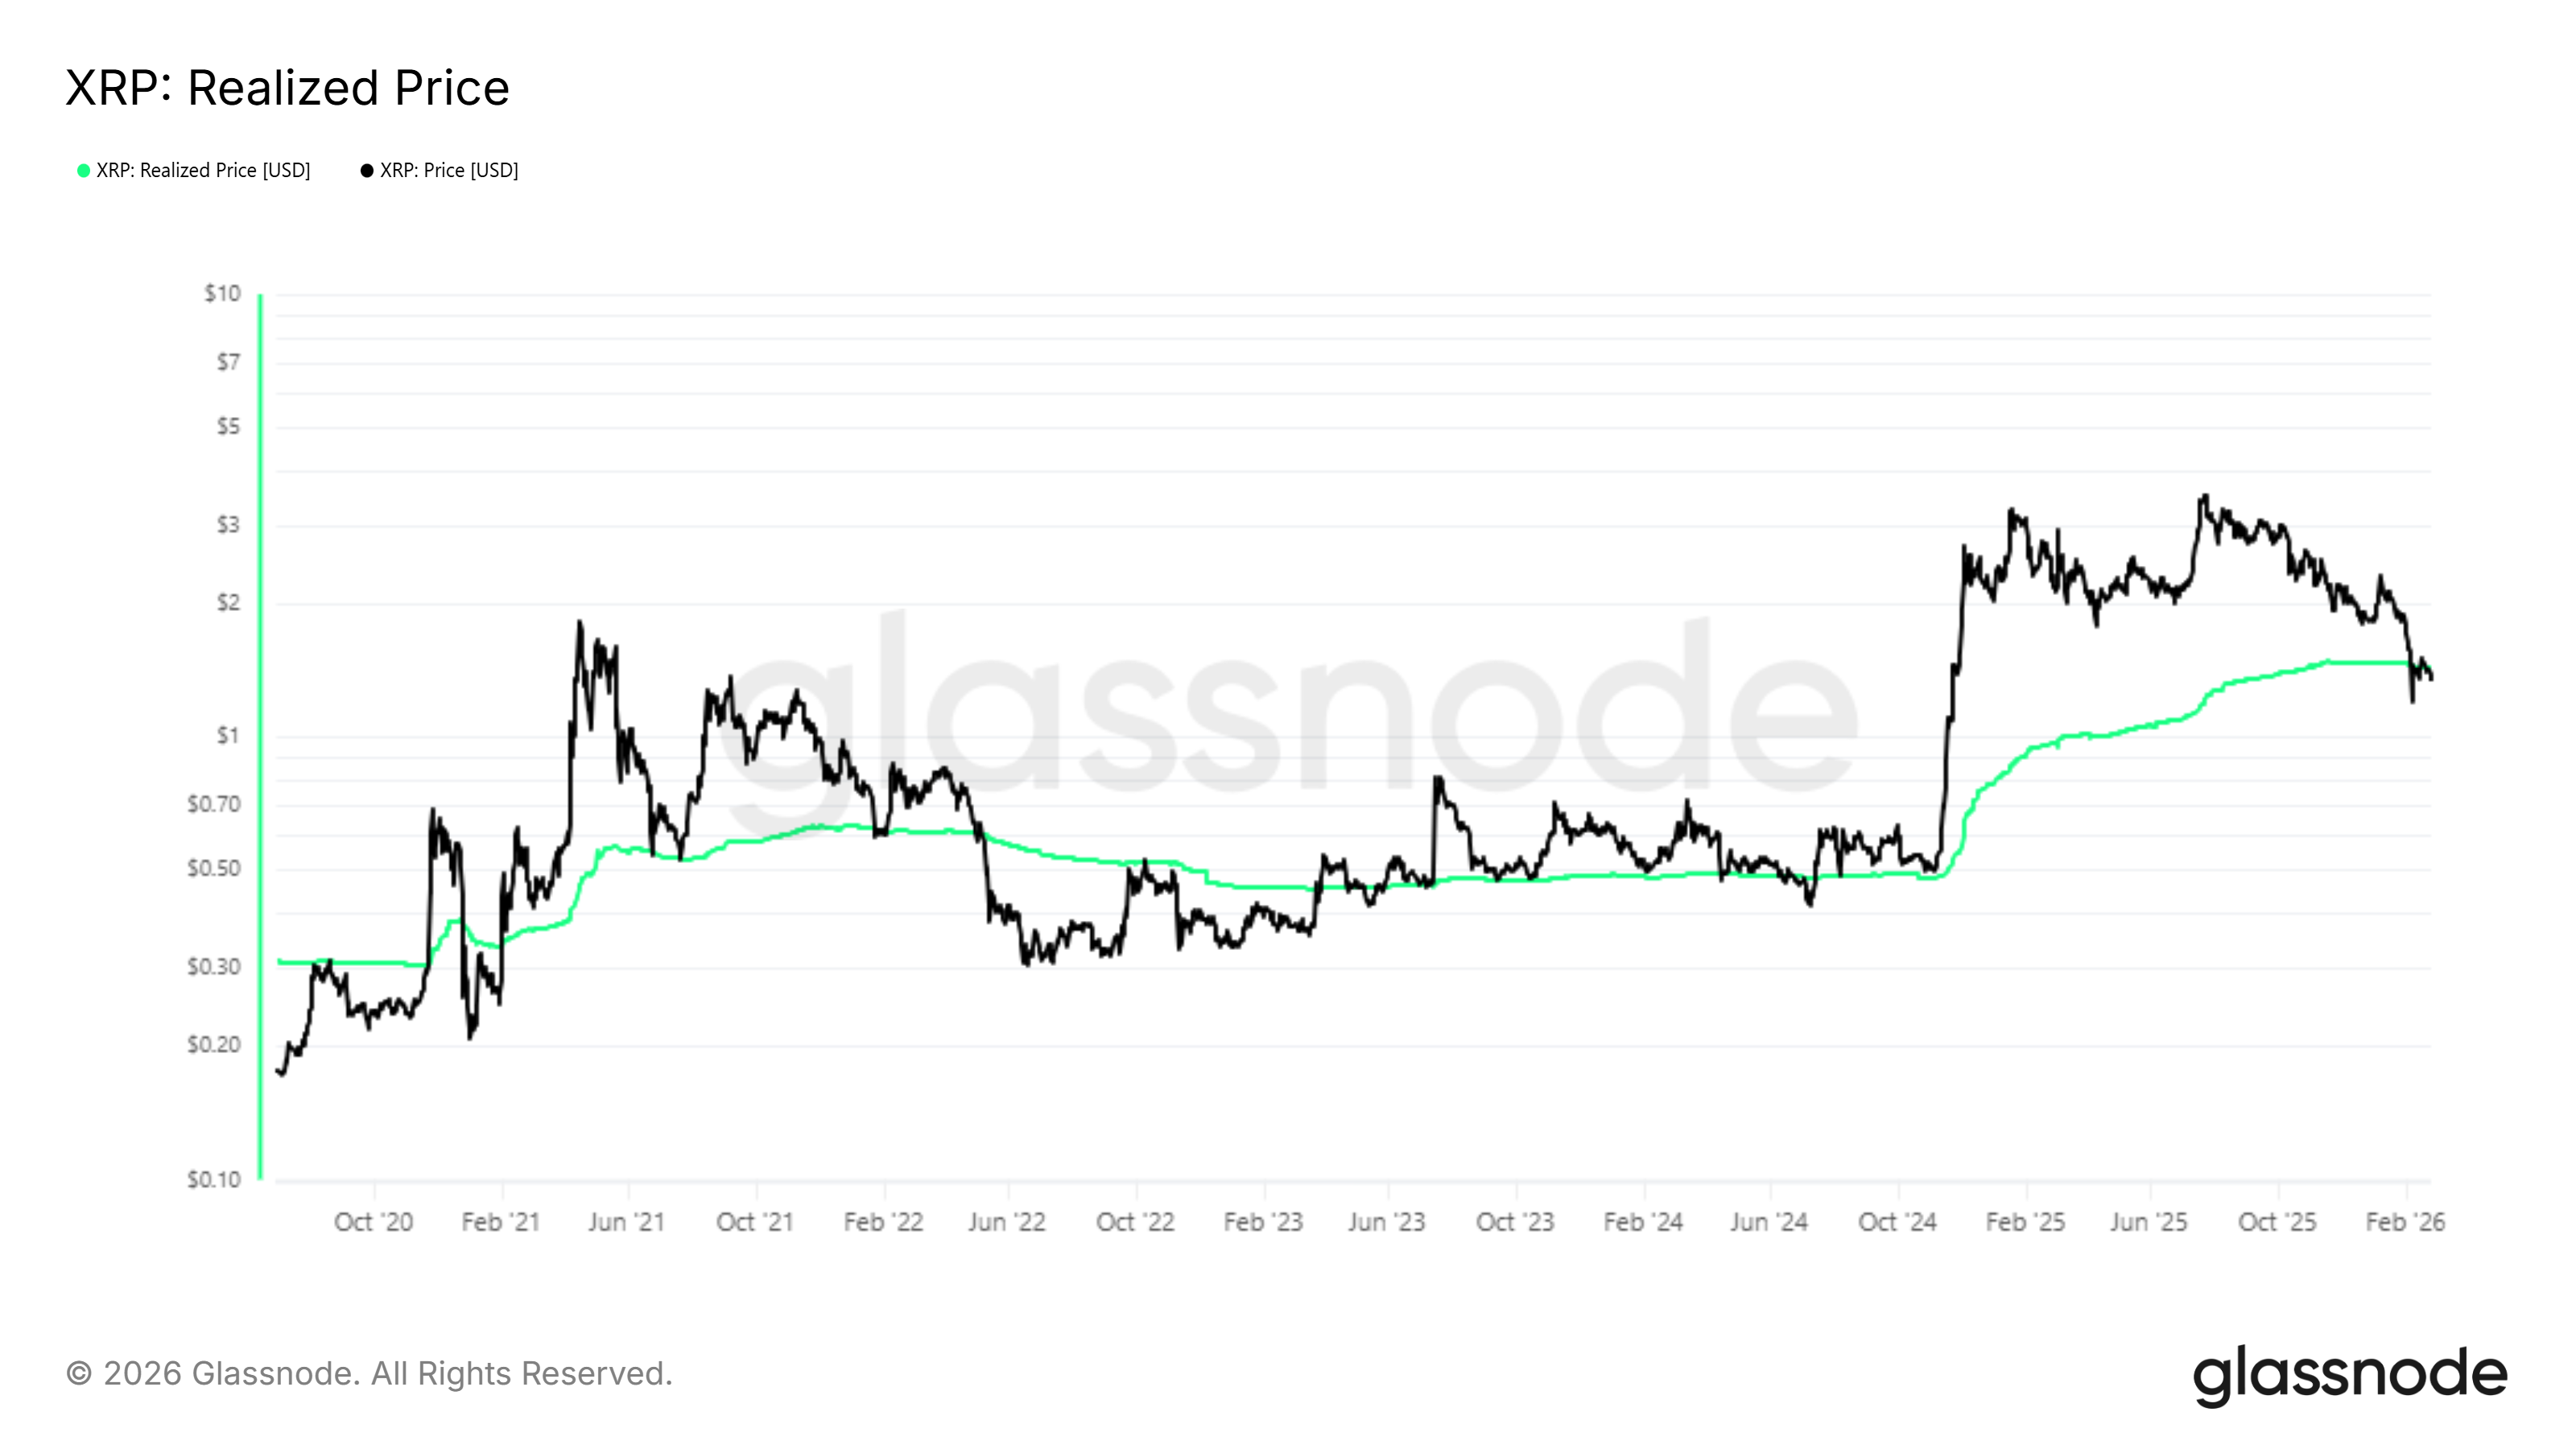
On-chain data shows XRP’s realized price now sits above the current market price. This metric indicates that the average holder is at a loss. When the market price falls below the realized price, assets are often considered undervalued from a historical perspective, marking a potential bottom.
Past cycles reveal that XRP rarely remains in this zone for extended periods. Similar conditions have preceded swift price rebounds. While no outcome is guaranteed, historical patterns suggest that undervaluation phases often attract accumulation and renewed buying interest.
Want more token insights like this? Sign up for Editor Harsh Notariya’s Daily Crypto Newsletter here.
How Are XRP Investors Acting?
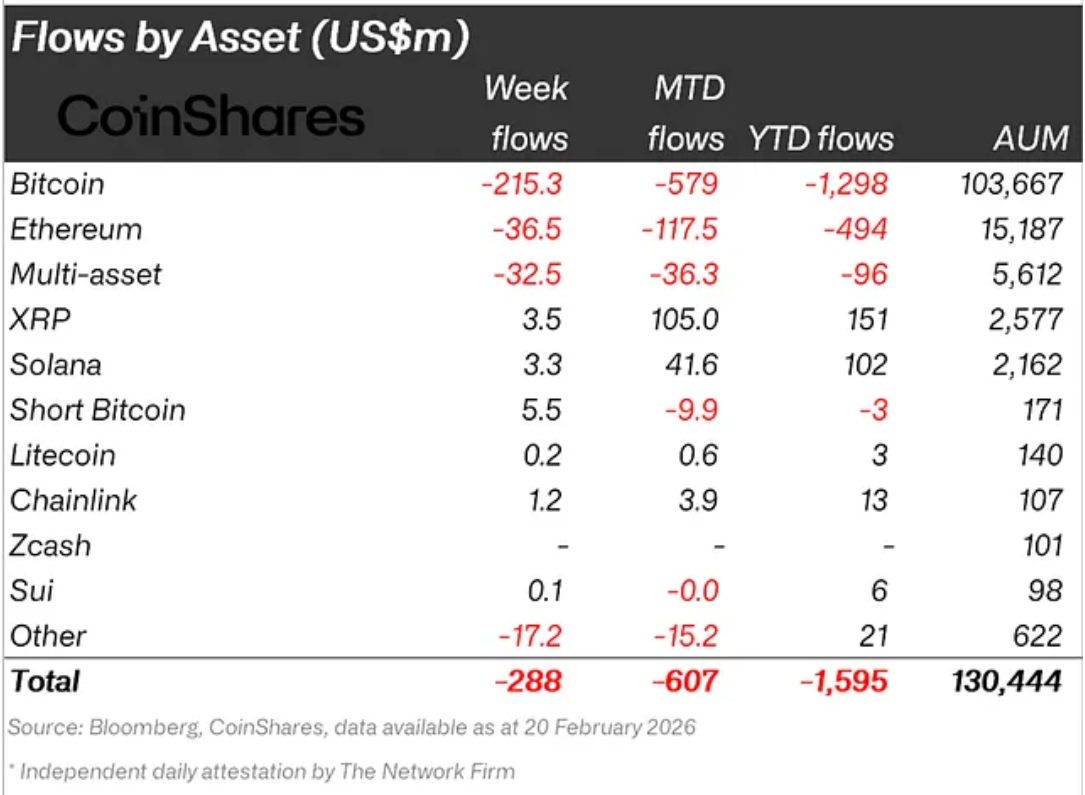
Institutional investors remain notably active despite broader market caution. For the week ending February 20, institutions added $3.5 million worth of XRP exposure. This brought month-to-date inflows to $105 million, a figure unmatched by Bitcoin or Ethereum, which both recorded net outflows.
Sustained institutional demand reflects strategic positioning rather than speculative trading. Professional investors often deploy capital during periods of weakness. Continued inflows may provide liquidity support and strengthen the structural foundation for XRP price stabilization.
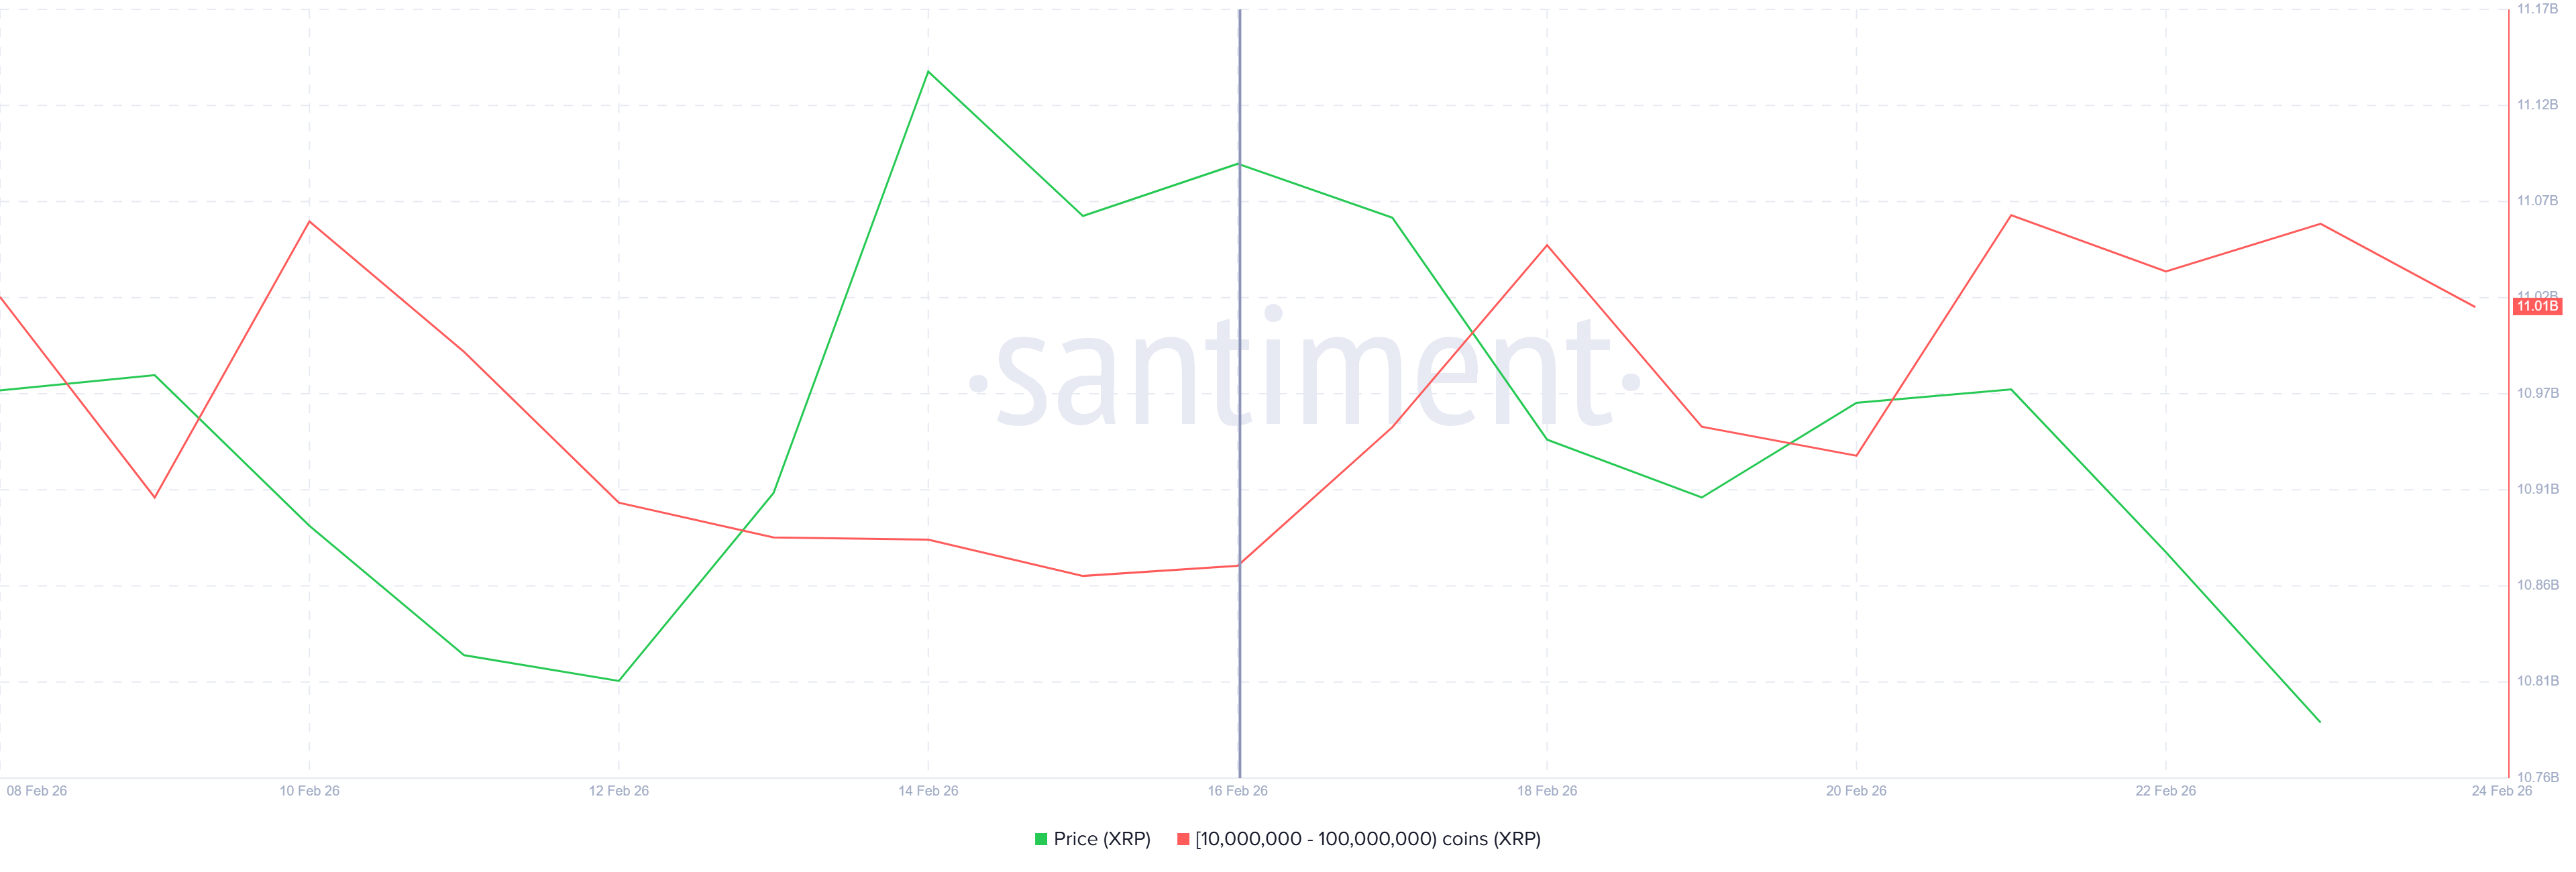
Large XRP holders also appear confident in the asset’s long-term outlook. Addresses holding between 10 million and 100 million XRP accumulated more than 170 million tokens over the past week. This buying activity occurred during a 9% price decline.
Accumulation during falling prices signals conviction among influential wallet holders. While the increase is not historically extreme, timing remains significant. Coordinated accumulation from whales and institutions may reduce circulating supply pressure and contribute to eventual upward momentum.
XRP Price Levels To Watch
XRP price is trading at $1.32 at the time of writing, remaining below a descending trendline established earlier this month. The asset continues to face technical resistance along this barrier. Without a clear improvement in broader market sentiment, XRP may struggle to break higher in the near term.
After losing support at $1.36, XRP now looks toward $1.28 as the next key level. Macro conditions worsened following US President Donald Trump’s 15% global tariff hike. Risk-off sentiment may weigh on digital assets. Continued pressure could push XRP toward $1.28 or even $1.21.
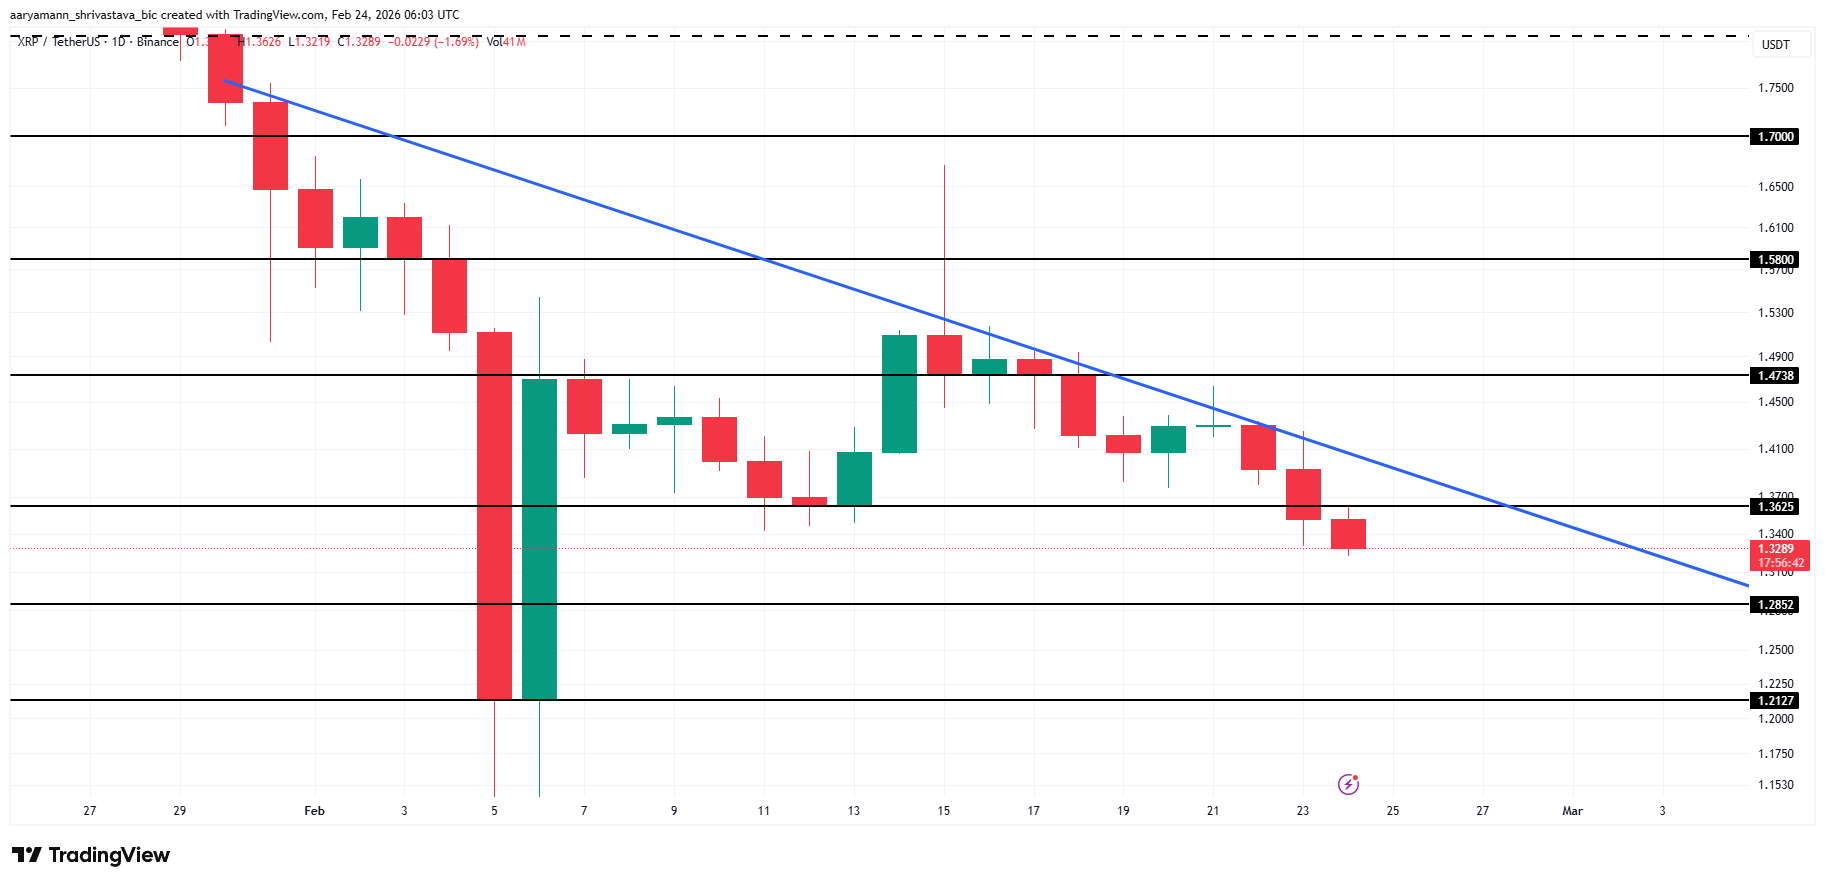
However, stabilization in global markets could shift momentum. Ongoing whale accumulation and institutional inflows may support recovery attempts. A breakout above the descending trendline would signal structural improvement. If XRP clears $1.47 resistance, the bearish thesis would be invalidated, and bullish momentum could reemerge.

Digital asset manager Grayscale Investments has increased its allocation to Cardano in its diversified crypto holdings, signalling institutional interest in the smart contract platform even as broader market sentiment weakens.
Summary
- Grayscale Investments boosted its allocation to Cardano to about 20.2%, making ADA its third-largest holding.
- The move comes as Bitcoin fell below $65,000 following new tariff measures announced by Donald Trump, dragging the broader crypto market lower.
- Technically, ADA is trading near $0.257, with resistance at $0.30–$0.31 and key support at $0.24, while momentum indicators remain in bearish territory.
According to the latest portfolio breakdown, Cardano (ADA) now accounts for roughly 20.20% of the fund’s holdings, making it the third-largest allocation behind Solana (28.53%) and Ethereum (28.39%).
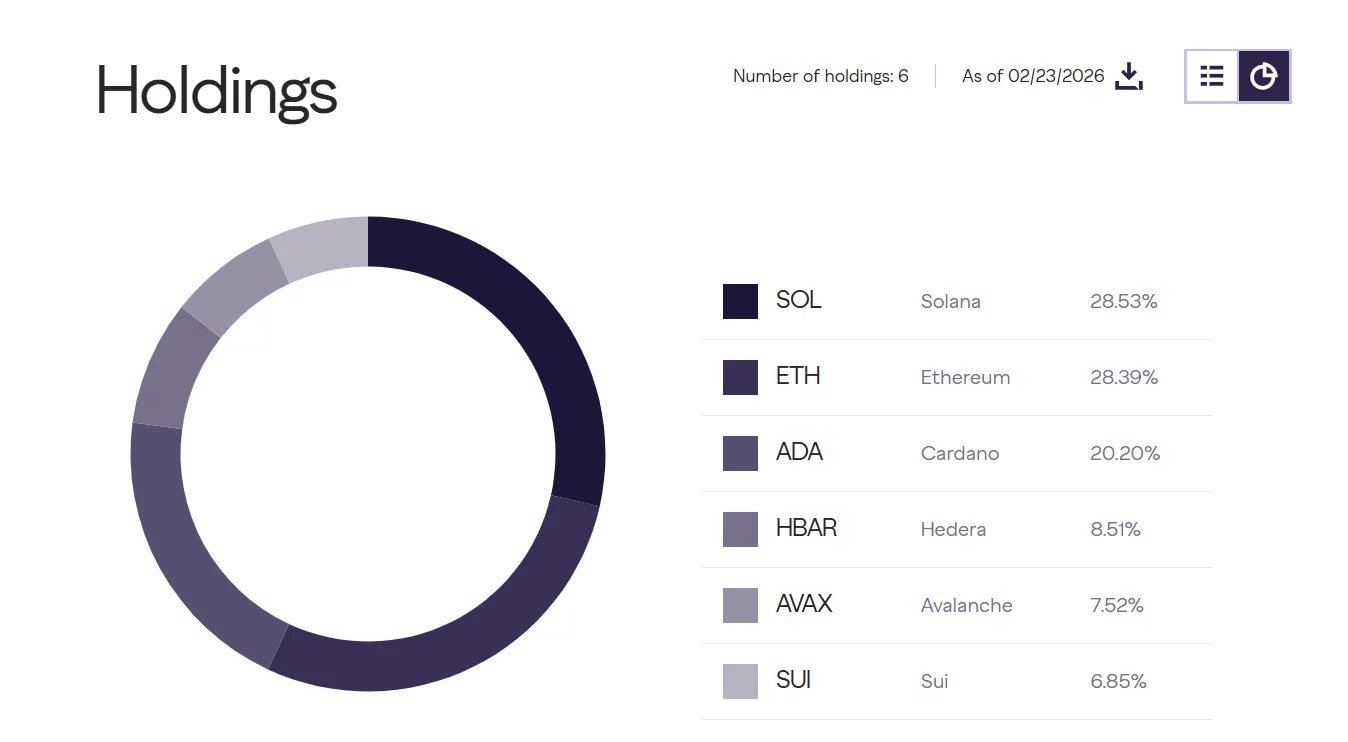
The adjustment highlights Grayscale’s growing confidence in Cardano’s long-term fundamentals at a time when digital assets are facing macro-driven volatility.
The rebalancing comes amid sharp turbulence across crypto markets. Bitcoin recently plunged below the $65,000 mark following fresh tariff measures announced by Donald Trump, triggering a broad risk-off move.
The sell-off spilled into altcoins, with Ethereum, Solana and Cardano all trading lower on the week.
ADA price analysis
Despite the institutional tailwind, ADA’s technical structure remains fragile. On the daily chart (ADA/USDT), the token is trading around $0.257, down nearly 2% on the session.
Price action shows a clear downtrend from January highs near $0.42, followed by a series of lower highs and lower lows into February.
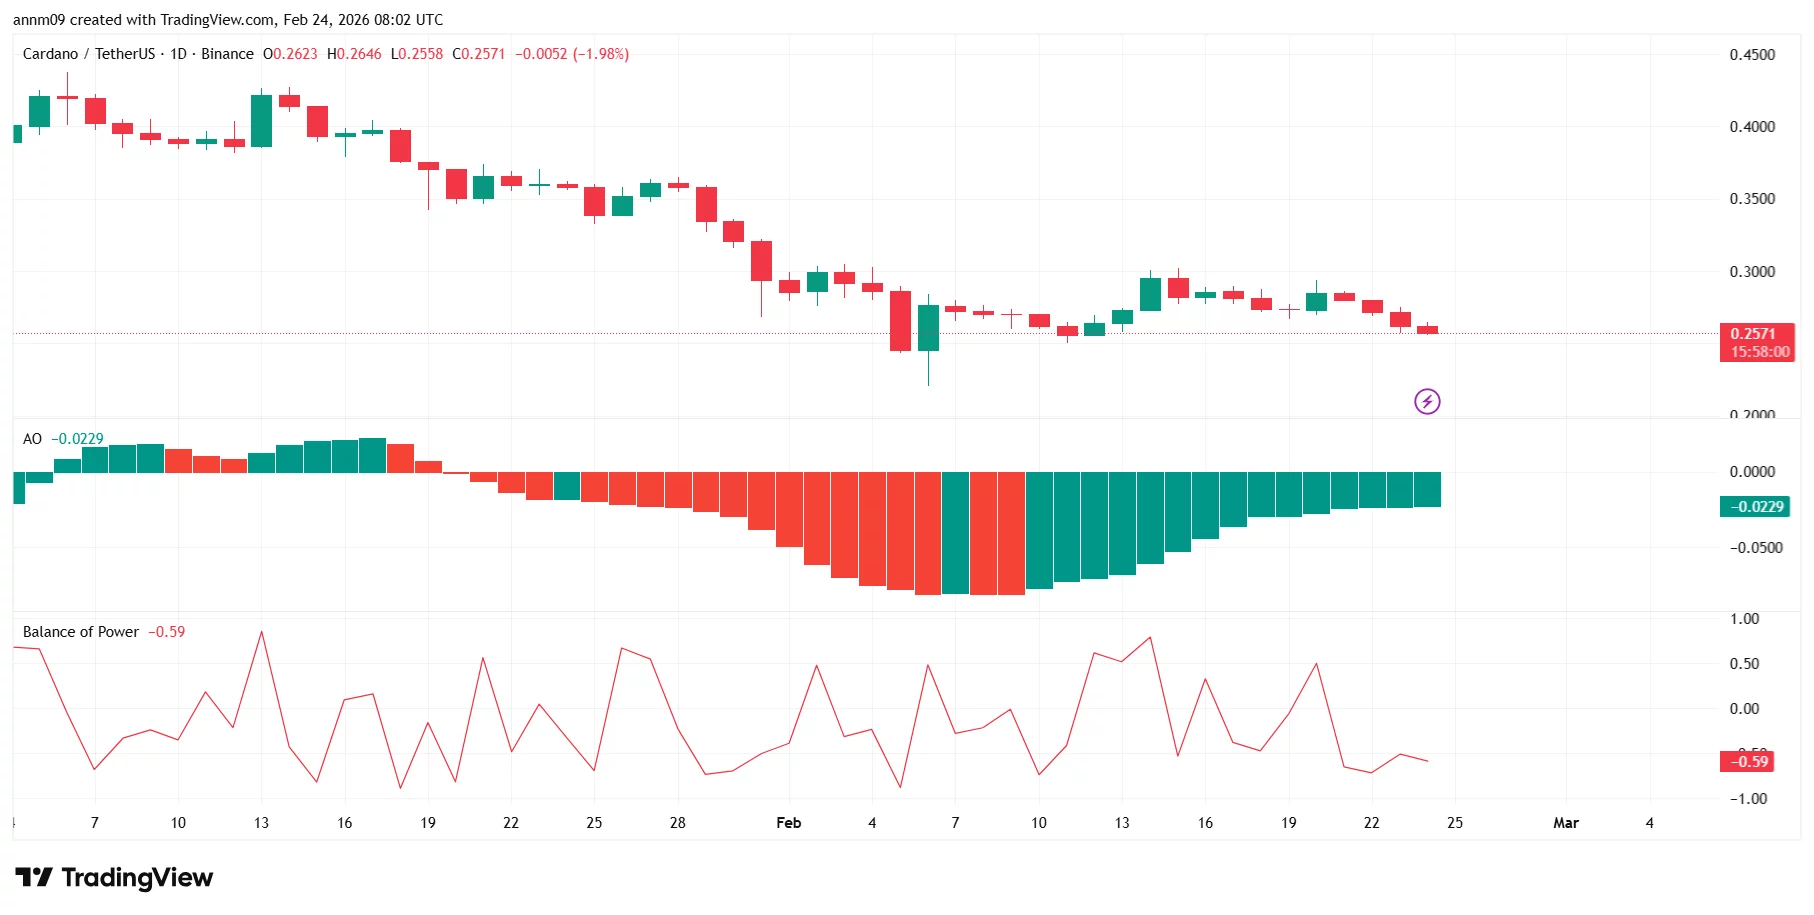
After a sharp sell-off in early February that pushed ADA toward the $0.23–$0.24 zone, bulls managed a modest rebound toward the $0.30 level. However, that recovery stalled, establishing $0.30–$0.31 as immediate resistance. A sustained break above that zone would be needed to shift short-term momentum.
On the downside, $0.24 remains key support, with stronger structural support seen near $0.22, the recent swing low. A decisive break below $0.24 could open the door to a retest of that lower range.
Momentum indicators remain cautious. The Awesome Oscillator is still in negative territory, though the histogram shows fading bearish momentum as green bars gradually build. Meanwhile, the Balance of Power reading sits below zero, suggesting sellers retain near-term control.
While Grayscale’s increased allocation underscores long-term institutional conviction, ADA’s short-term trajectory will likely depend on whether broader market sentiment stabilizes following Bitcoin’s tariff-driven drop.
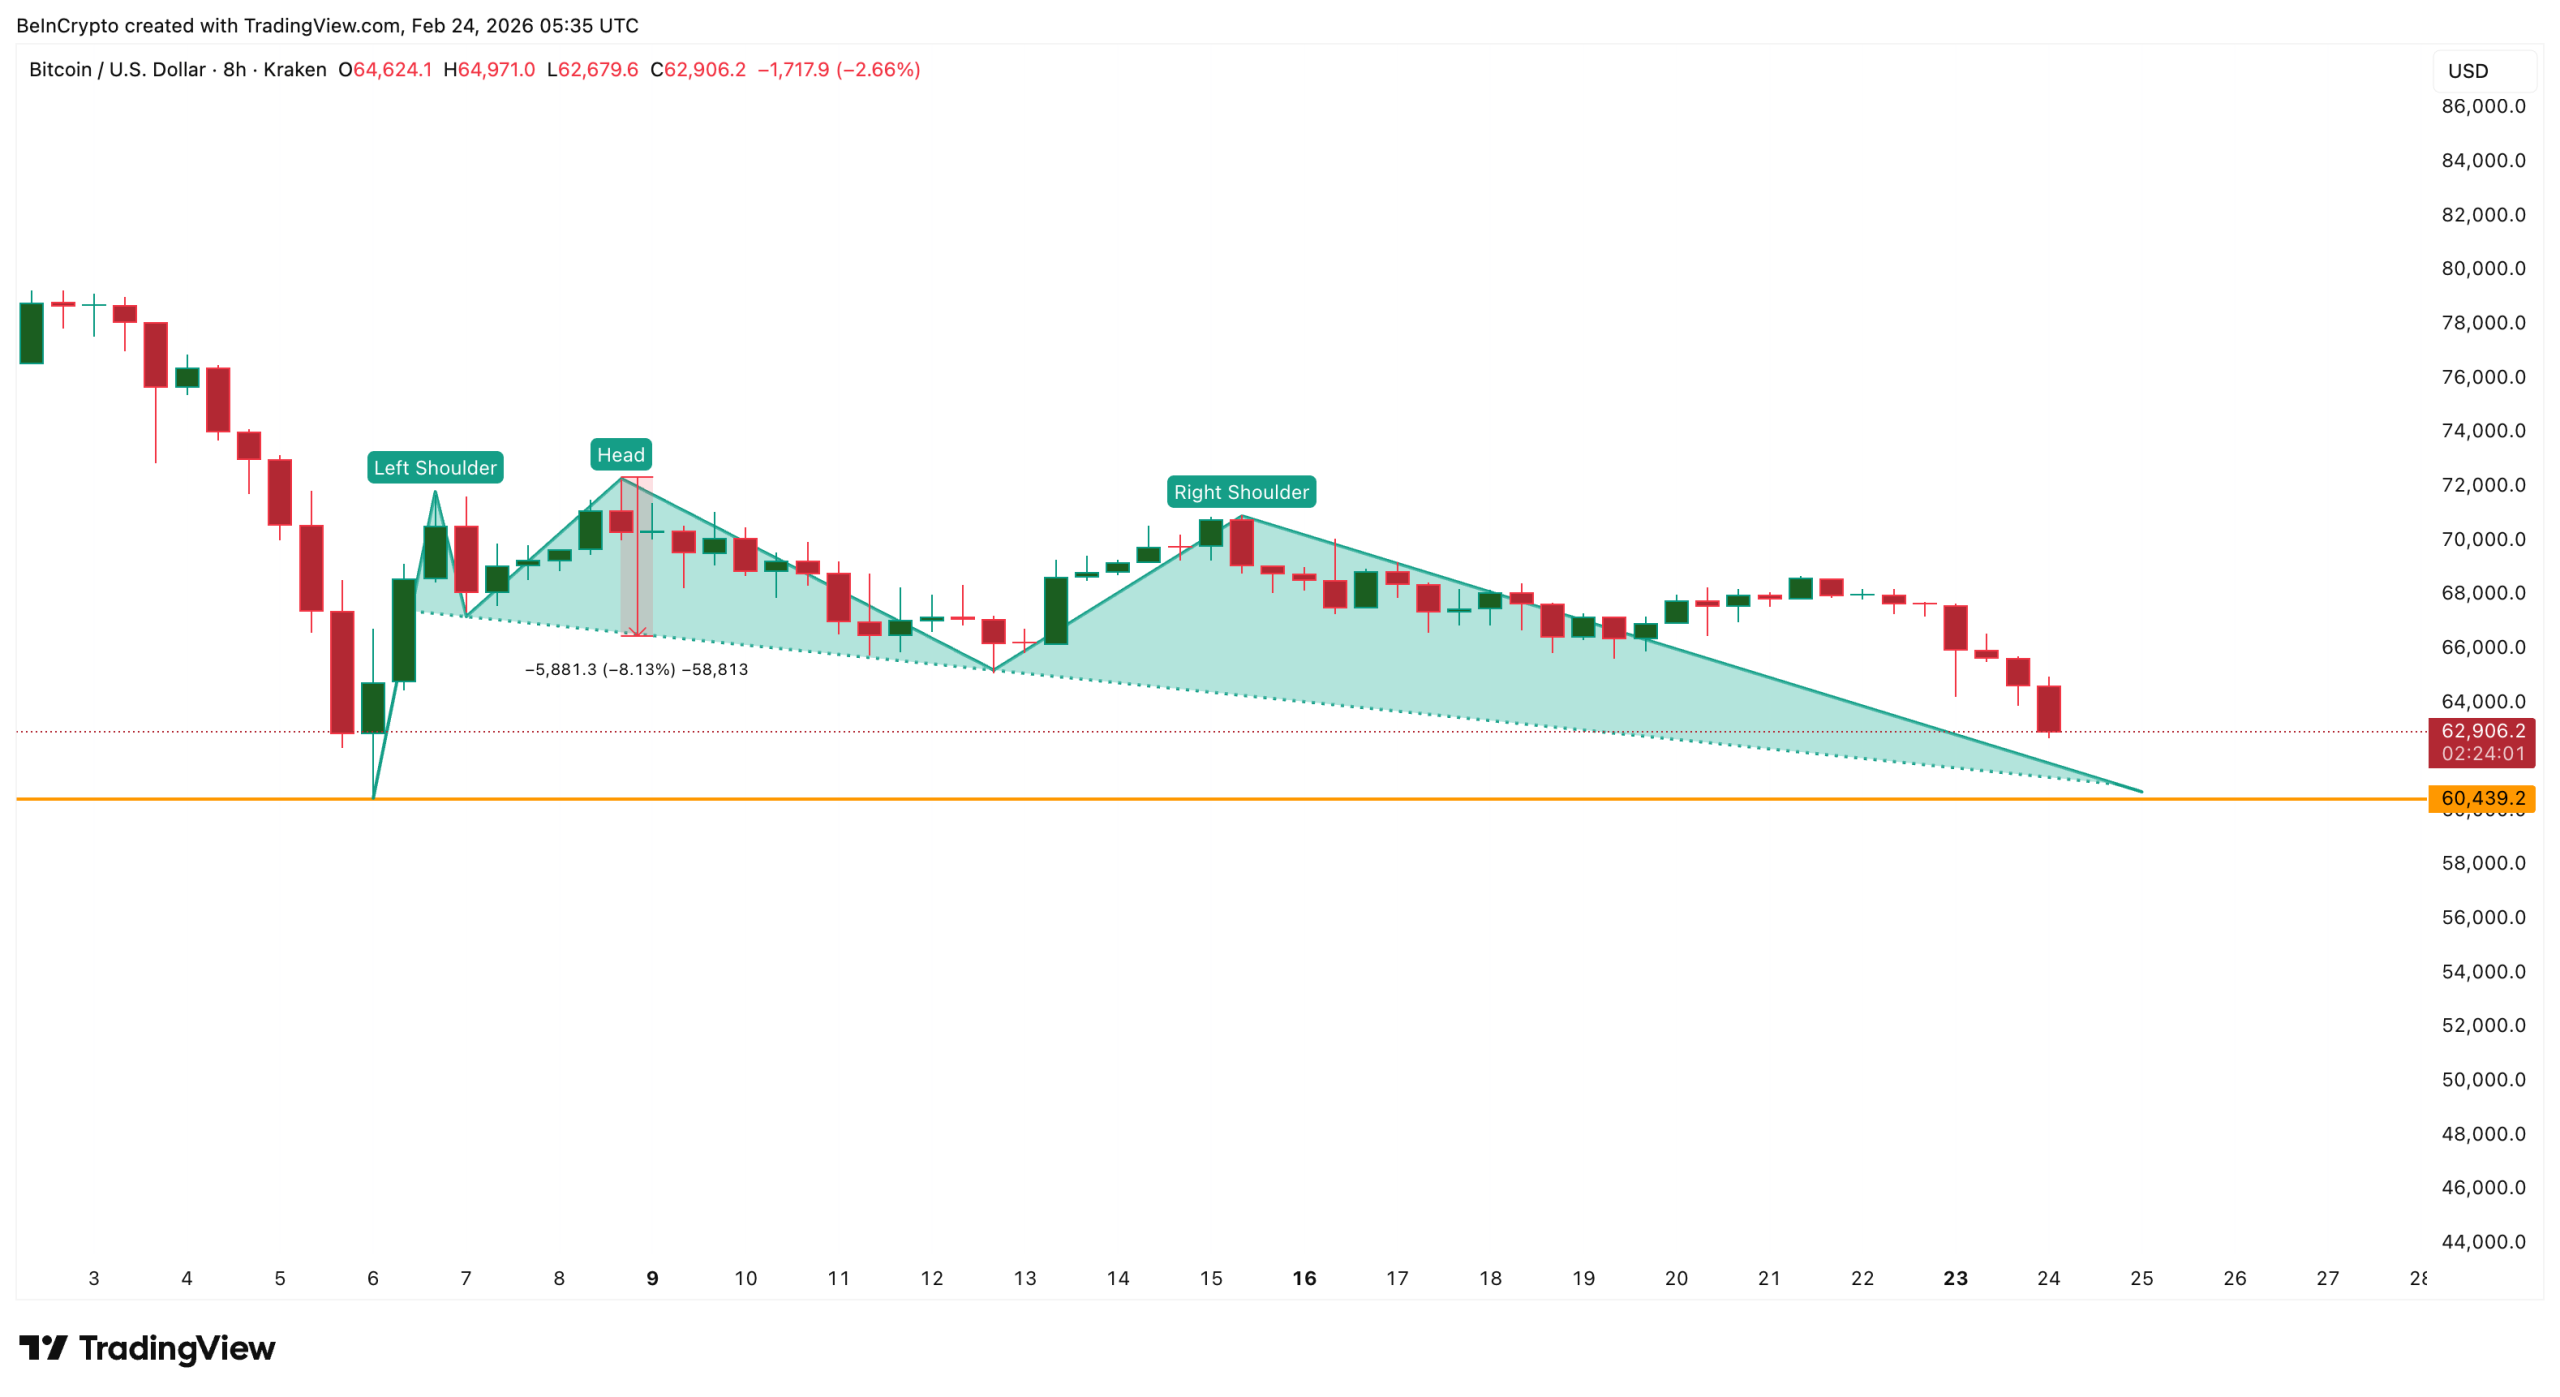
Bitcoin has slipped below the $63,000 level, extending its monthly decline to nearly 30%. The drop reflects more than short-term volatility. It shows deeper structural weakness building across the network and institutional flows.
This weakness is appearing even as Bitcoin enters its longest miner capitulation phase, year-on-year. At the same time, institutional demand through ETFs continues to deteriorate. Together, these forces are now pushing Bitcoin toward one of its most important support zones this cycle.
Bearish Pattern And Miner Income Collapse Explain Weakness
Bitcoin’s price structure has started to break down on the 8-hour chart. A head-and-shoulders pattern has formed, and the neckline of this pattern now sits near the $60,000 zone, making this level the most important short-term support.
Want more token insights like this? Sign up for Editor Harsh Notariya’s Daily Crypto Newsletter here.
This technical weakness comes as miners continue selling aggressively. Glassnode data shows the miner net position change metric has remained negative continuously from January 9 through February 23. This 46-day stretch marks the longest uninterrupted miner capitulation phase in the year-on-year timeframe. The peak of this stretch was seen on February 6, two days after the BTC price bottomed around $60,400.
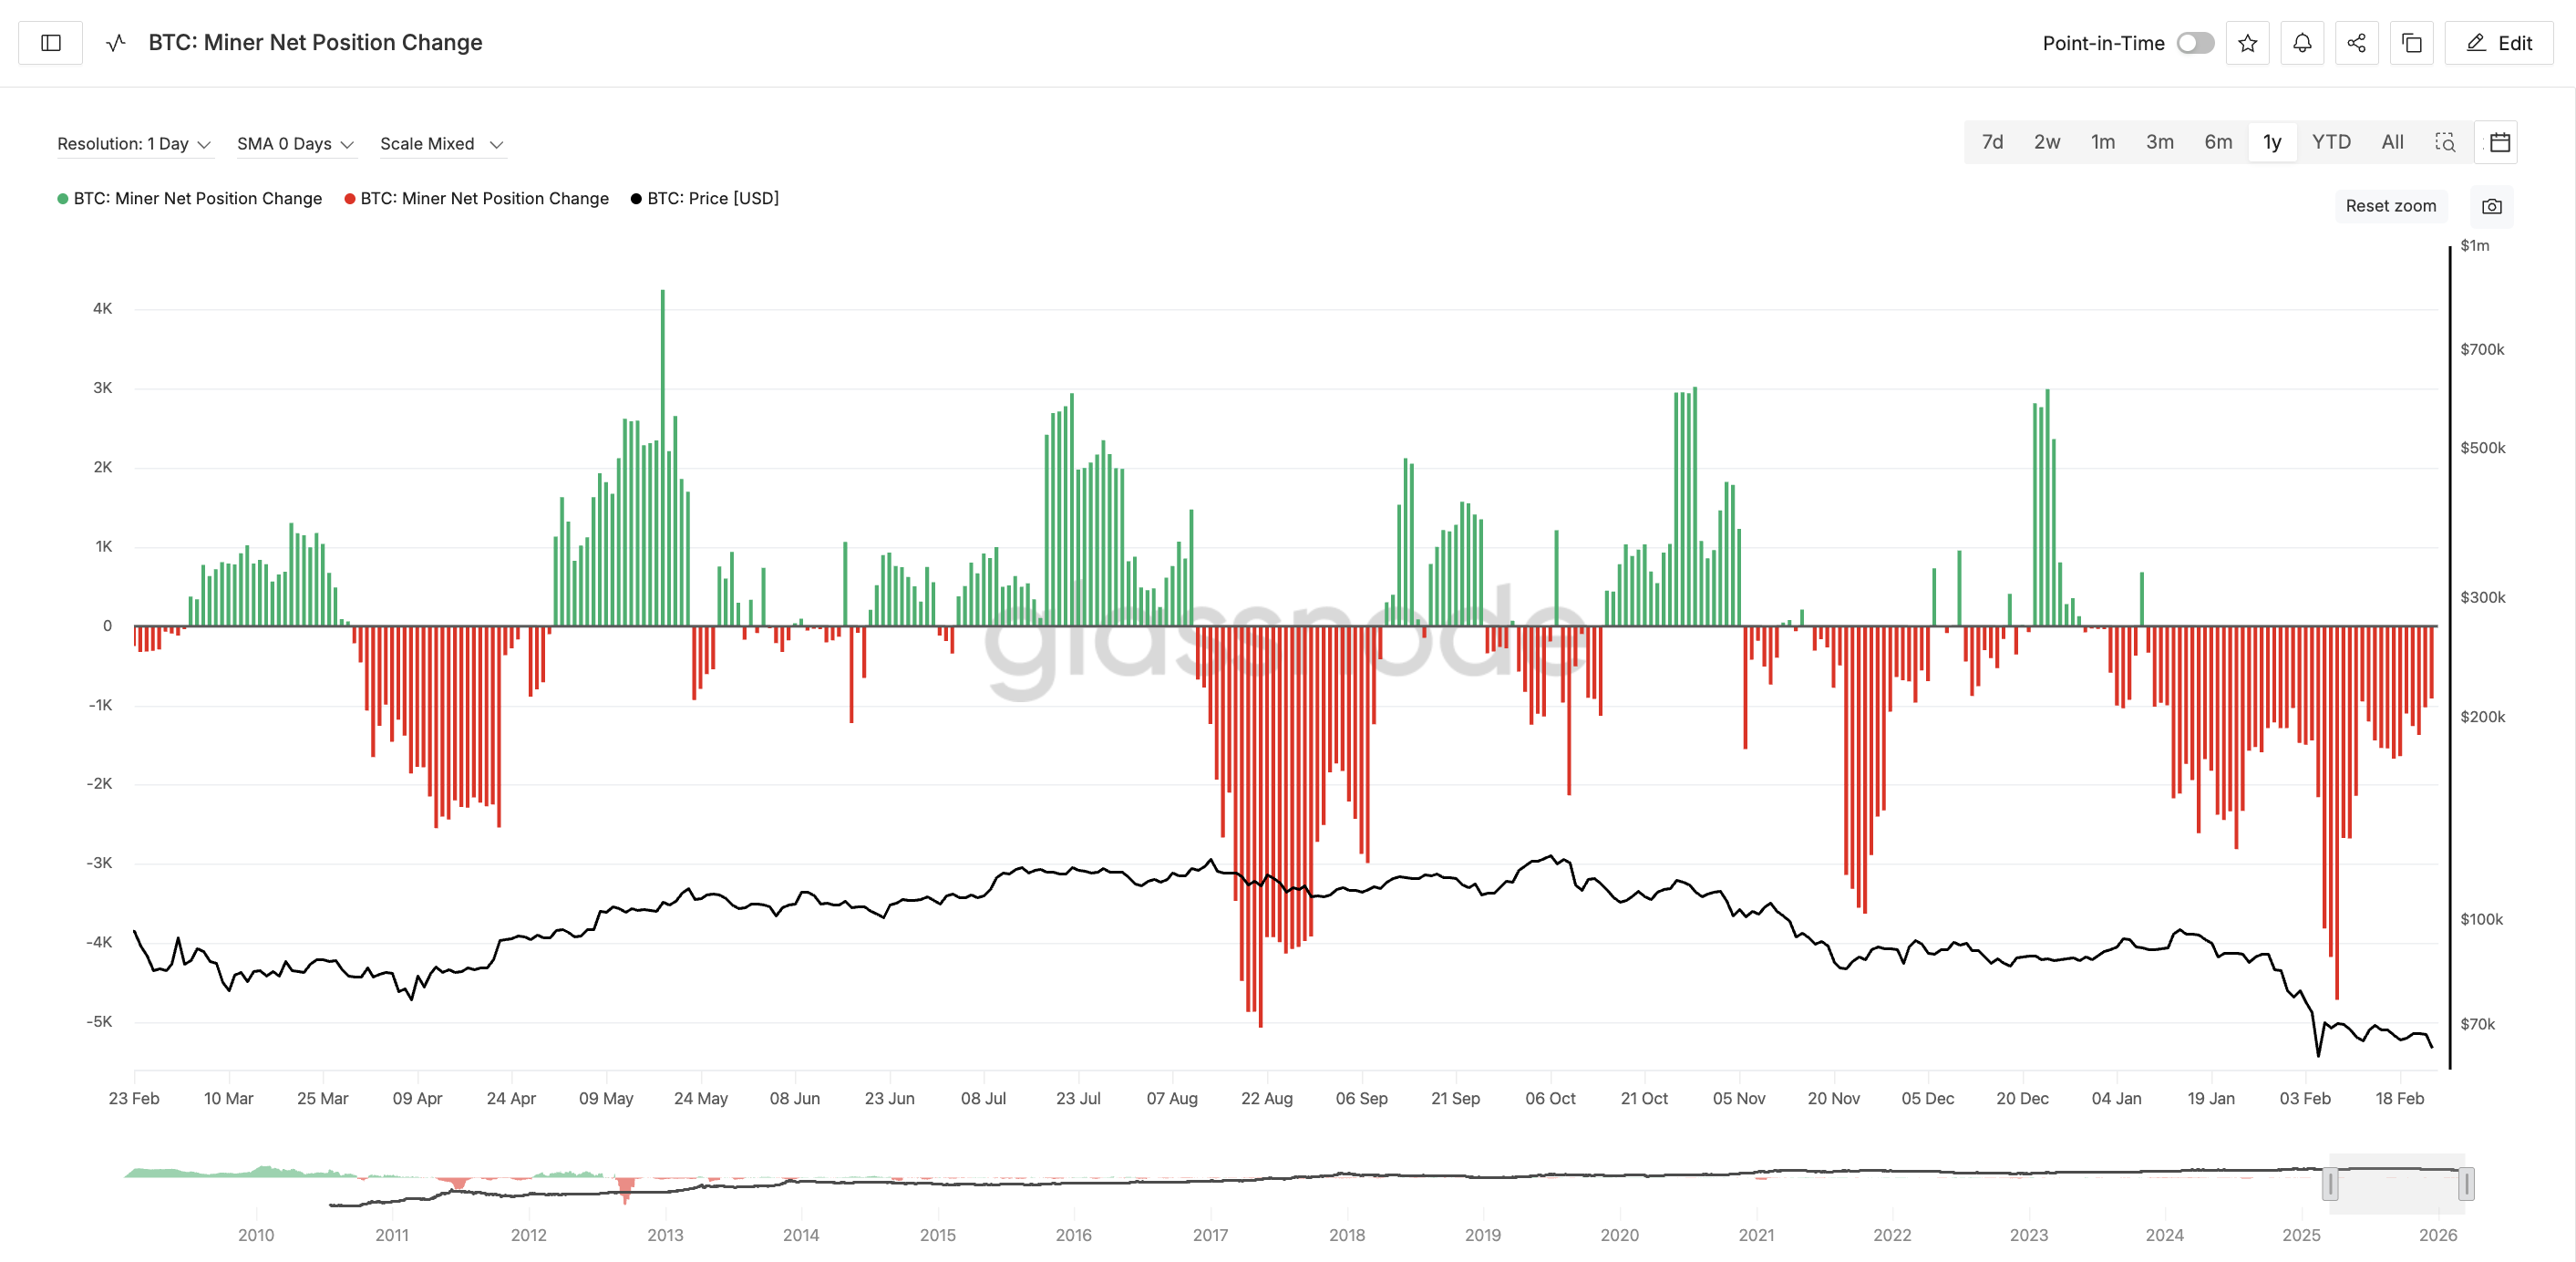
Miner capitulation happens when miners sell more Bitcoin than they accumulate. This usually reflects financial pressure rather than profit-taking.
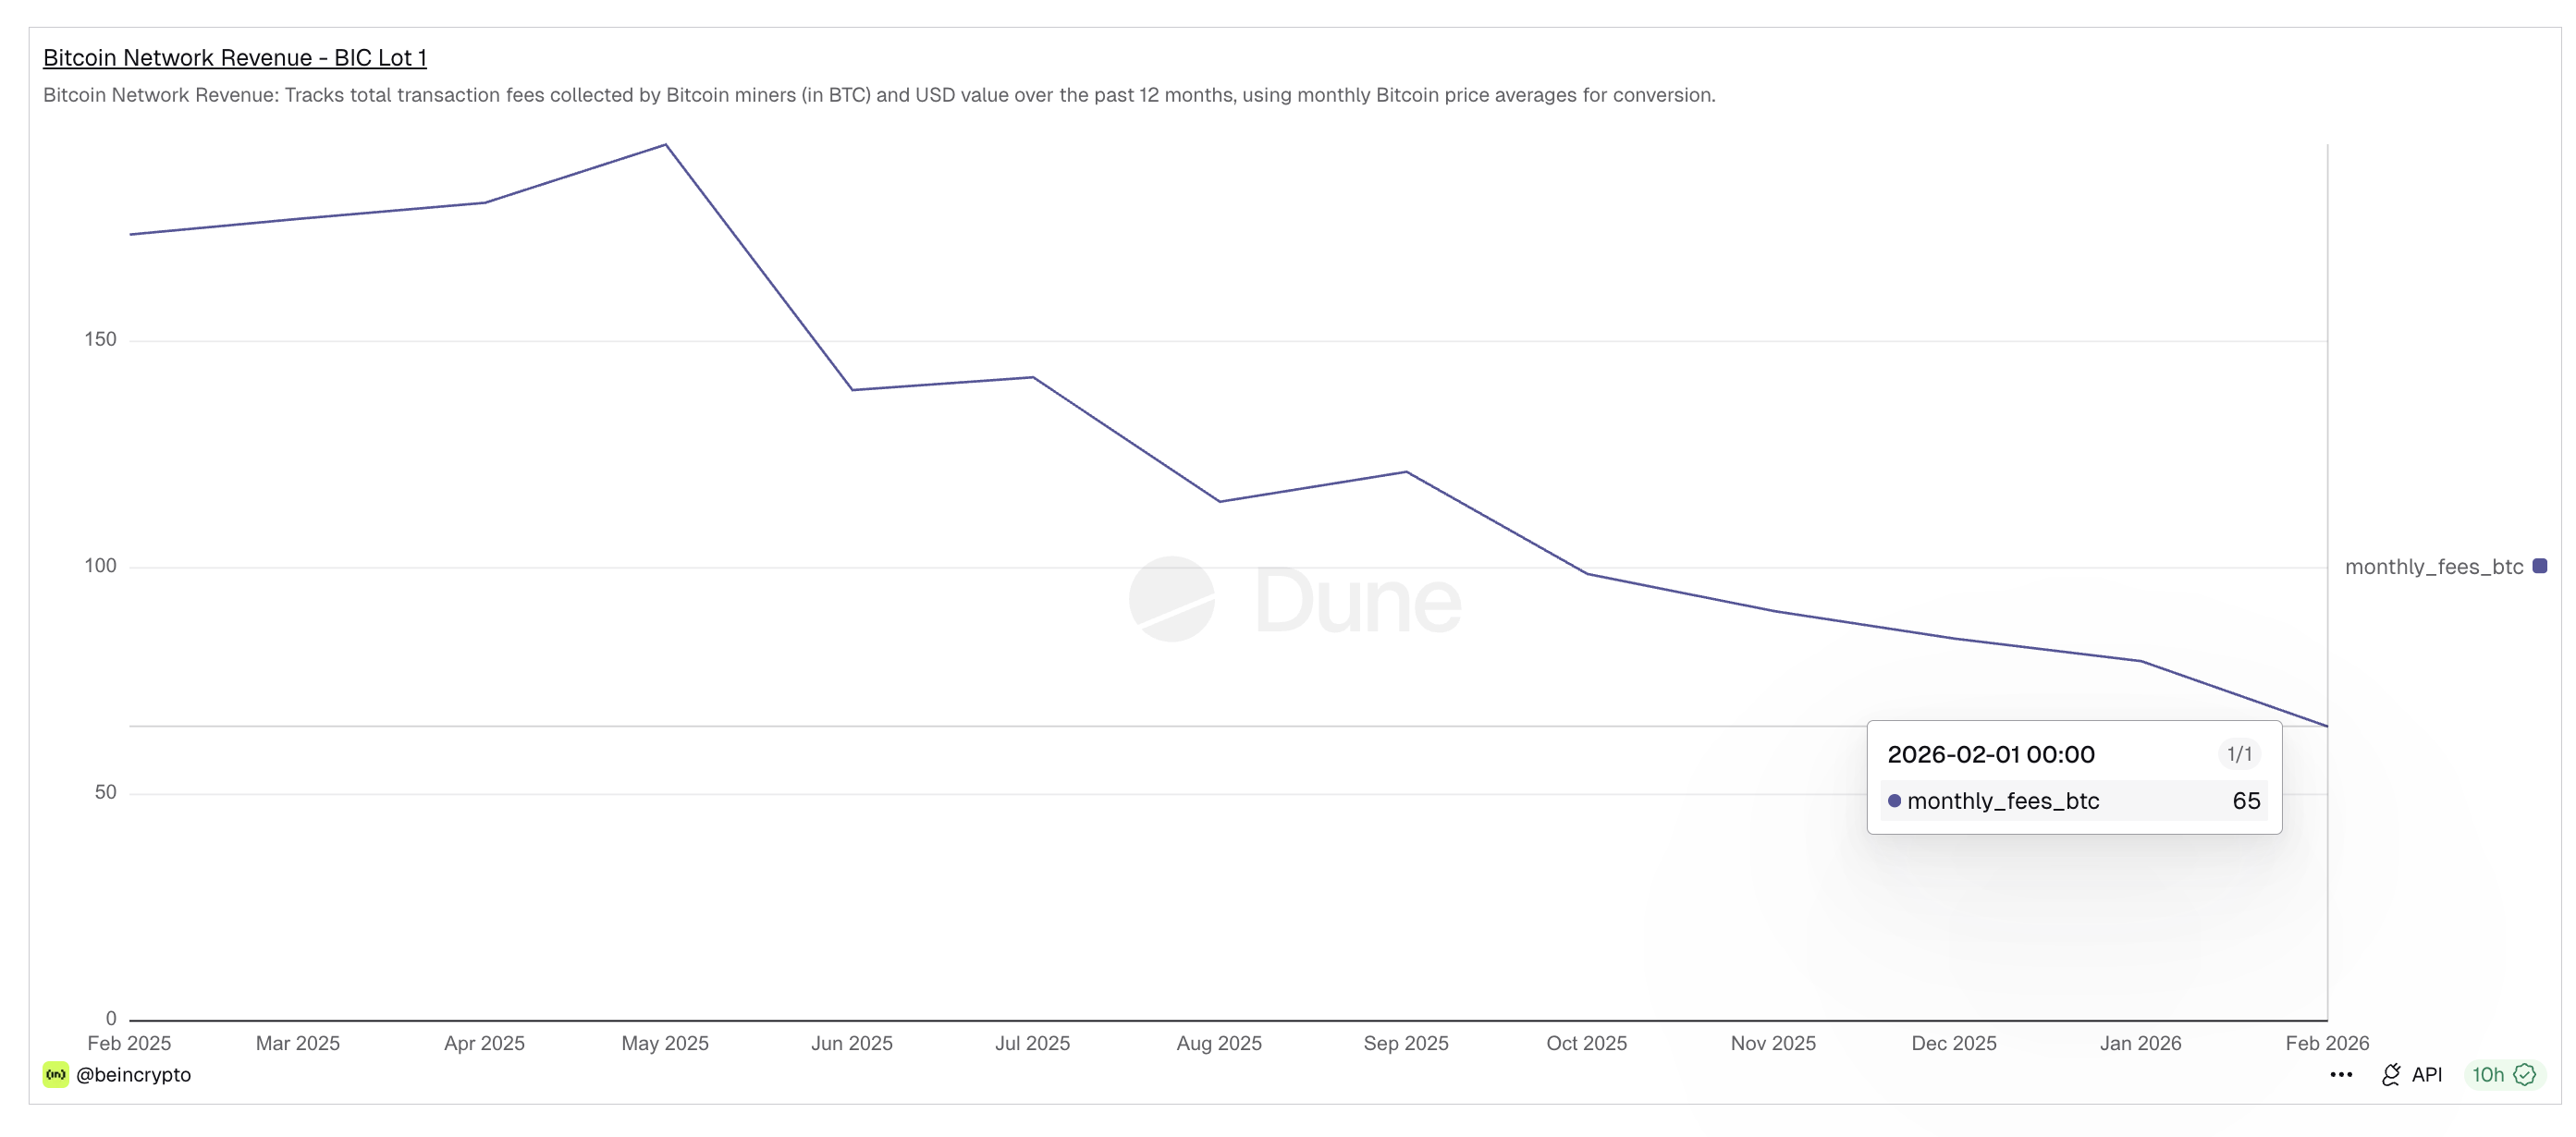
BeInCrypto’s exclusive Dune dashboard helps explain the reason behind this shift. Bitcoin network revenue, which tracks transaction fees earned by miners, has collapsed sharply over the past year. Monthly fees fell from 194 BTC in May 2025 to just 65 BTC by February 2026. This represents a nearly two-thirds drop in miner income.
With earnings falling and BTC correcting, miners have fewer incentives to hold Bitcoin. Instead, they are forced to sell reserves, increasing supply in the market. This sustained selling pressure has weakened Bitcoin’s structure. But miners are not the only group stepping away.
Institutional demand has also started to deteriorate, raising new risks around the critical $60,000 support zone.
ETF Outflows And Realized Price Align With Bitget CEO’s Warning About Critical Support
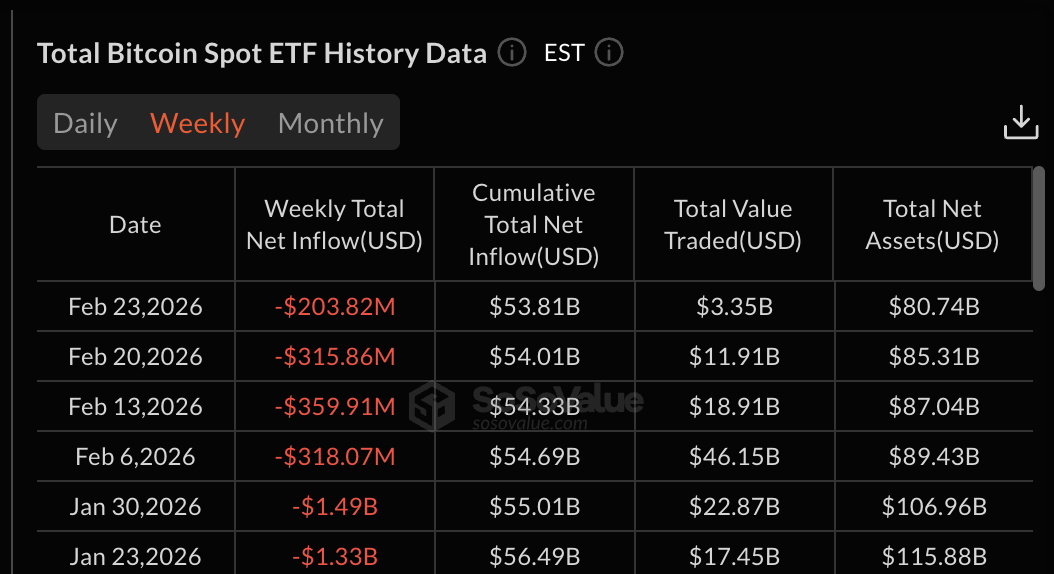
Institutional demand through Bitcoin ETFs has weakened significantly in recent weeks. Bitcoin has now recorded six consecutive weeks of ETF outflows. This marks the longest sustained weekly exit period since spot Bitcoin ETFs launched.
These outflows signal that large investors are reducing exposure instead of accumulating.
Gracy Chen, CEO of Bitget, directly addressed this fragile setup yesterday, right before BTC lost $63,000. She said:
“Today, Bitcoin is trading in the $64,000–$66,000 zone, and we believe macro factors are doing most of the work. Selling pressure is still tangible and heavy, so the asset has become highly sensitive to headlines, and recent turbulence around tariffs has put even more pressure on risk sentiment,” she said.
She also identified the most important level now:
“On the technical side, we think $60,000 remains the key support level so far, while a move lower, caused by a significant macro event, or accelerating ETF outflows could drag the asset down to $50,000. Liquidity there is deep, and support is substantial, so we’d expect a bounce from either level and a renewed attempt higher,” she added.
Her statement highlights how closely ETF flows and macro pressure are now tied to Bitcoin’s structure. This risk becomes clearer when compared with Bitcoin’s realized price.
Realized price currently sits near $54,700. This level represents the average cost basis of all Bitcoin in circulation. Historically, Bitcoin tends to stabilize near this level because it reflects the market’s aggregate holding cost.
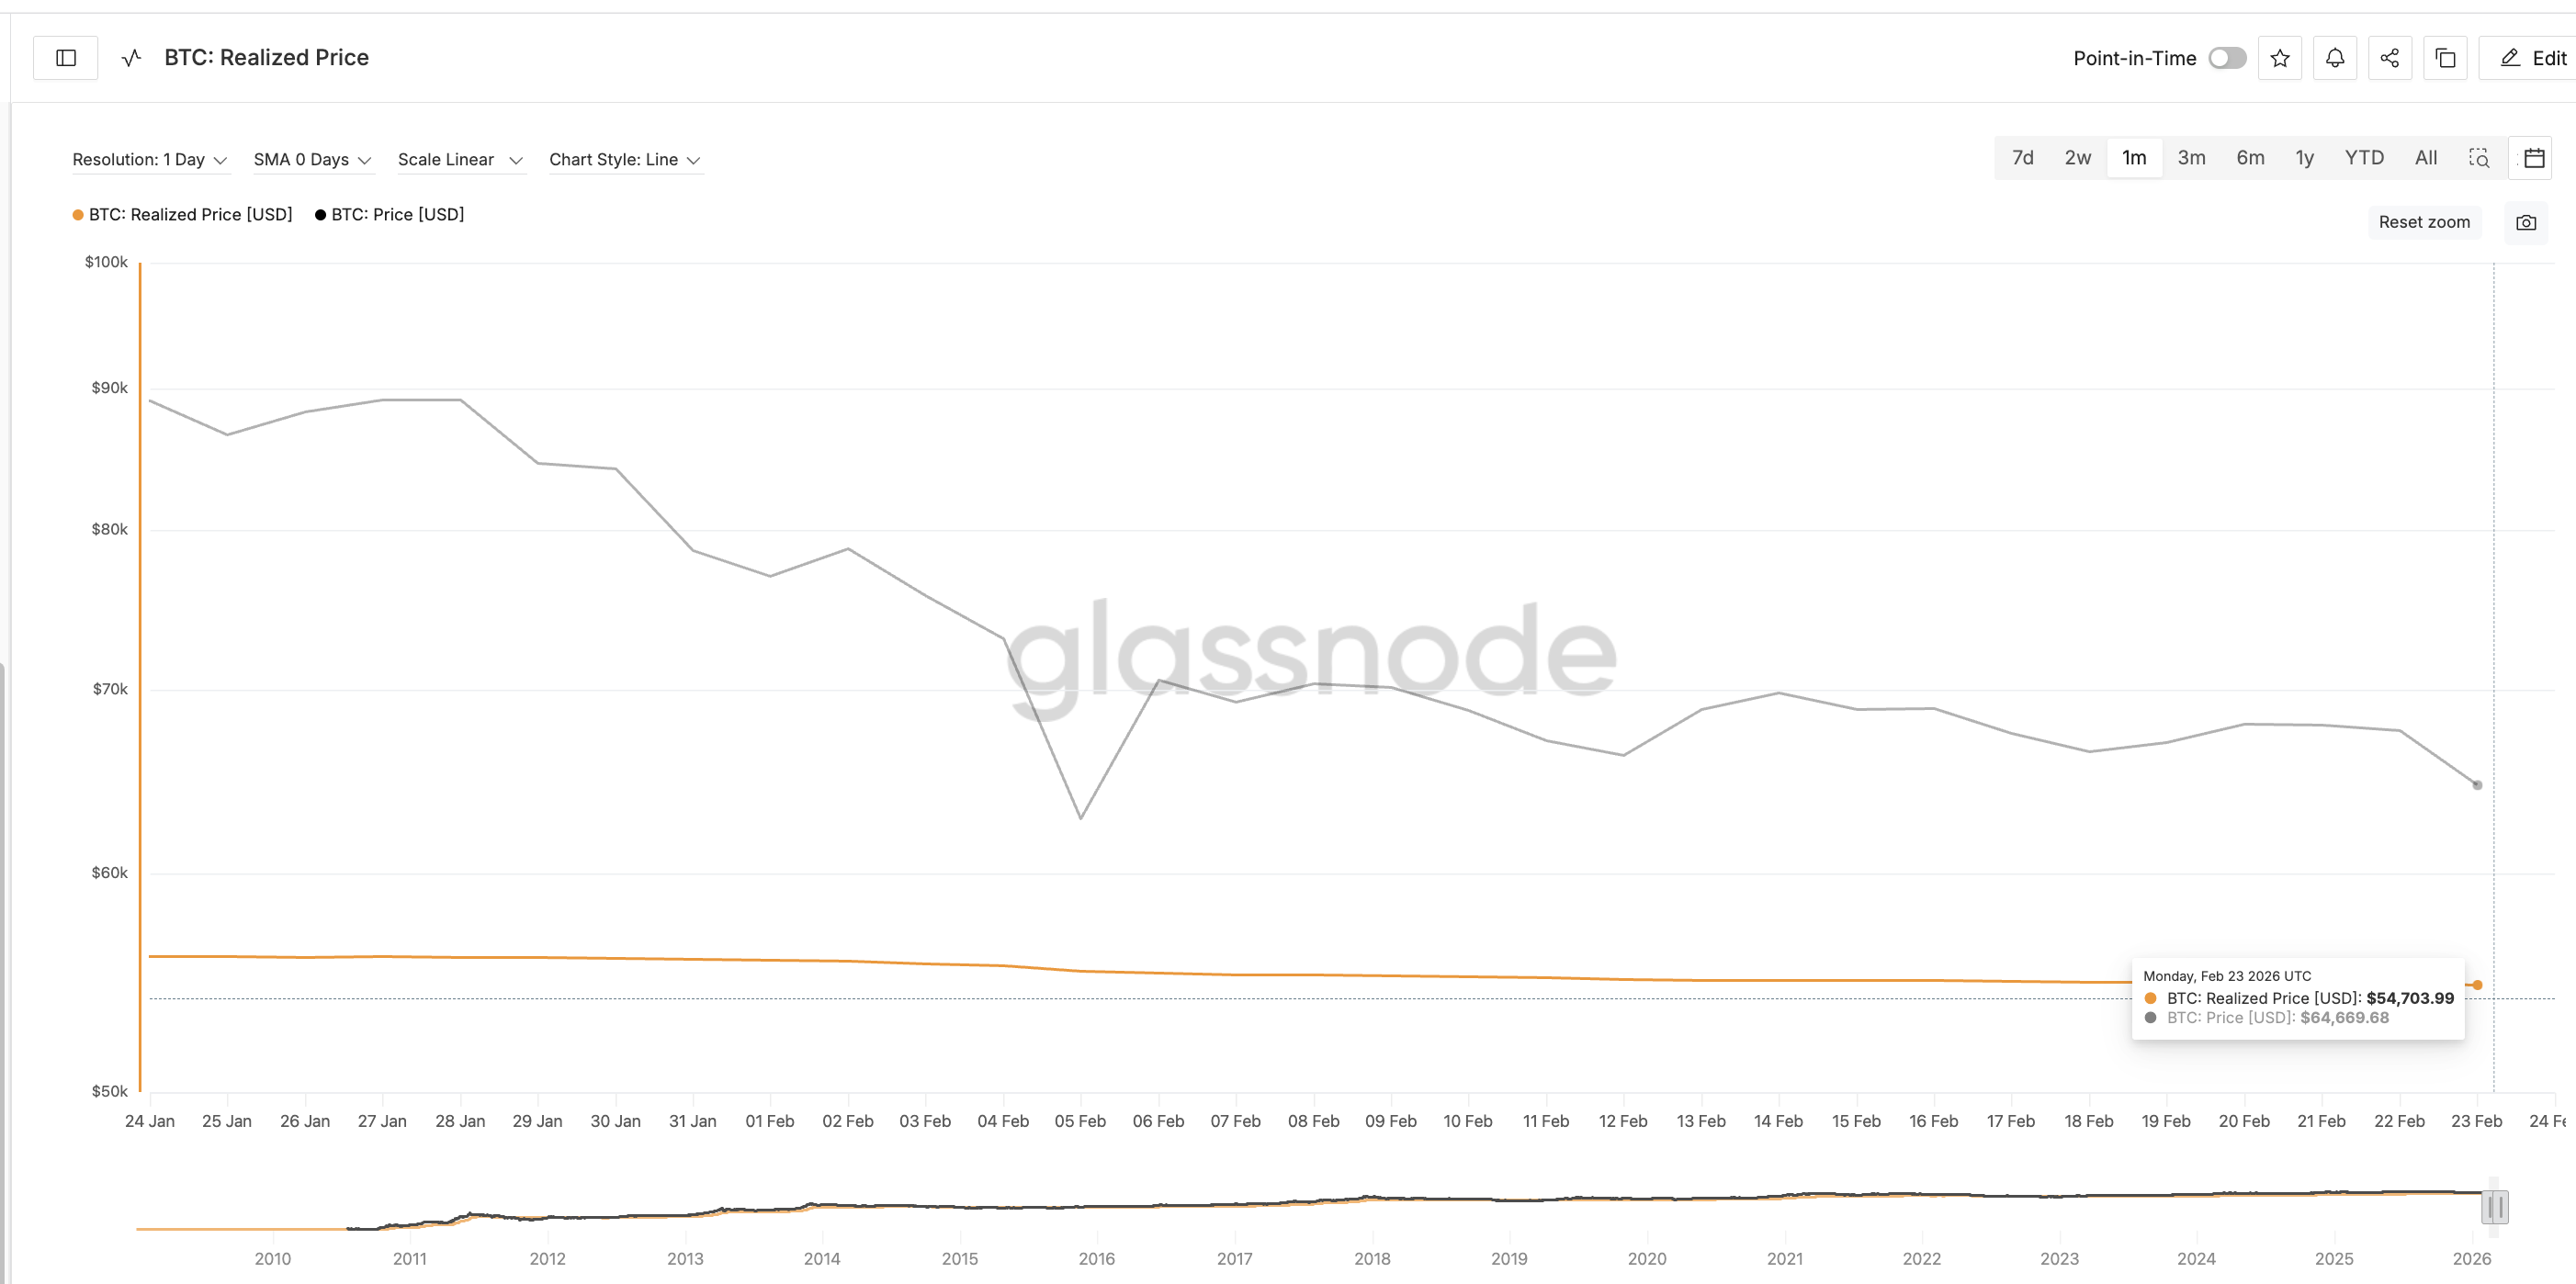
If ETF demand continues weakening and Bitcoin loses $60,000, the realized price could become the next major support zone. This makes the current BTC price region especially critical.
Bitcoin Price Levels Show Why The $60,000 Zone Is The Key
Bitcoin’s recent price action confirms the importance of the $60,000 zone, already highlighted by the Bitget CEO. This level previously served as support on February 6, around the time when miner capitulation reached its current cycle peak. The same level now aligns with a key Fibonacci retracement zone near $60,100.
This convergence makes the area both psychologically and technically important. If Bitcoin manages to hold above this zone, it could stabilize and attempt recovery.
However, a confirmed break below $60,000 would confirm the head-and-shoulders breakdown. Based on the pattern’s structure and technical retracement levels, this could trigger a decline toward $54,800. This level aligns almost exactly with Bitcoin’s realized price.
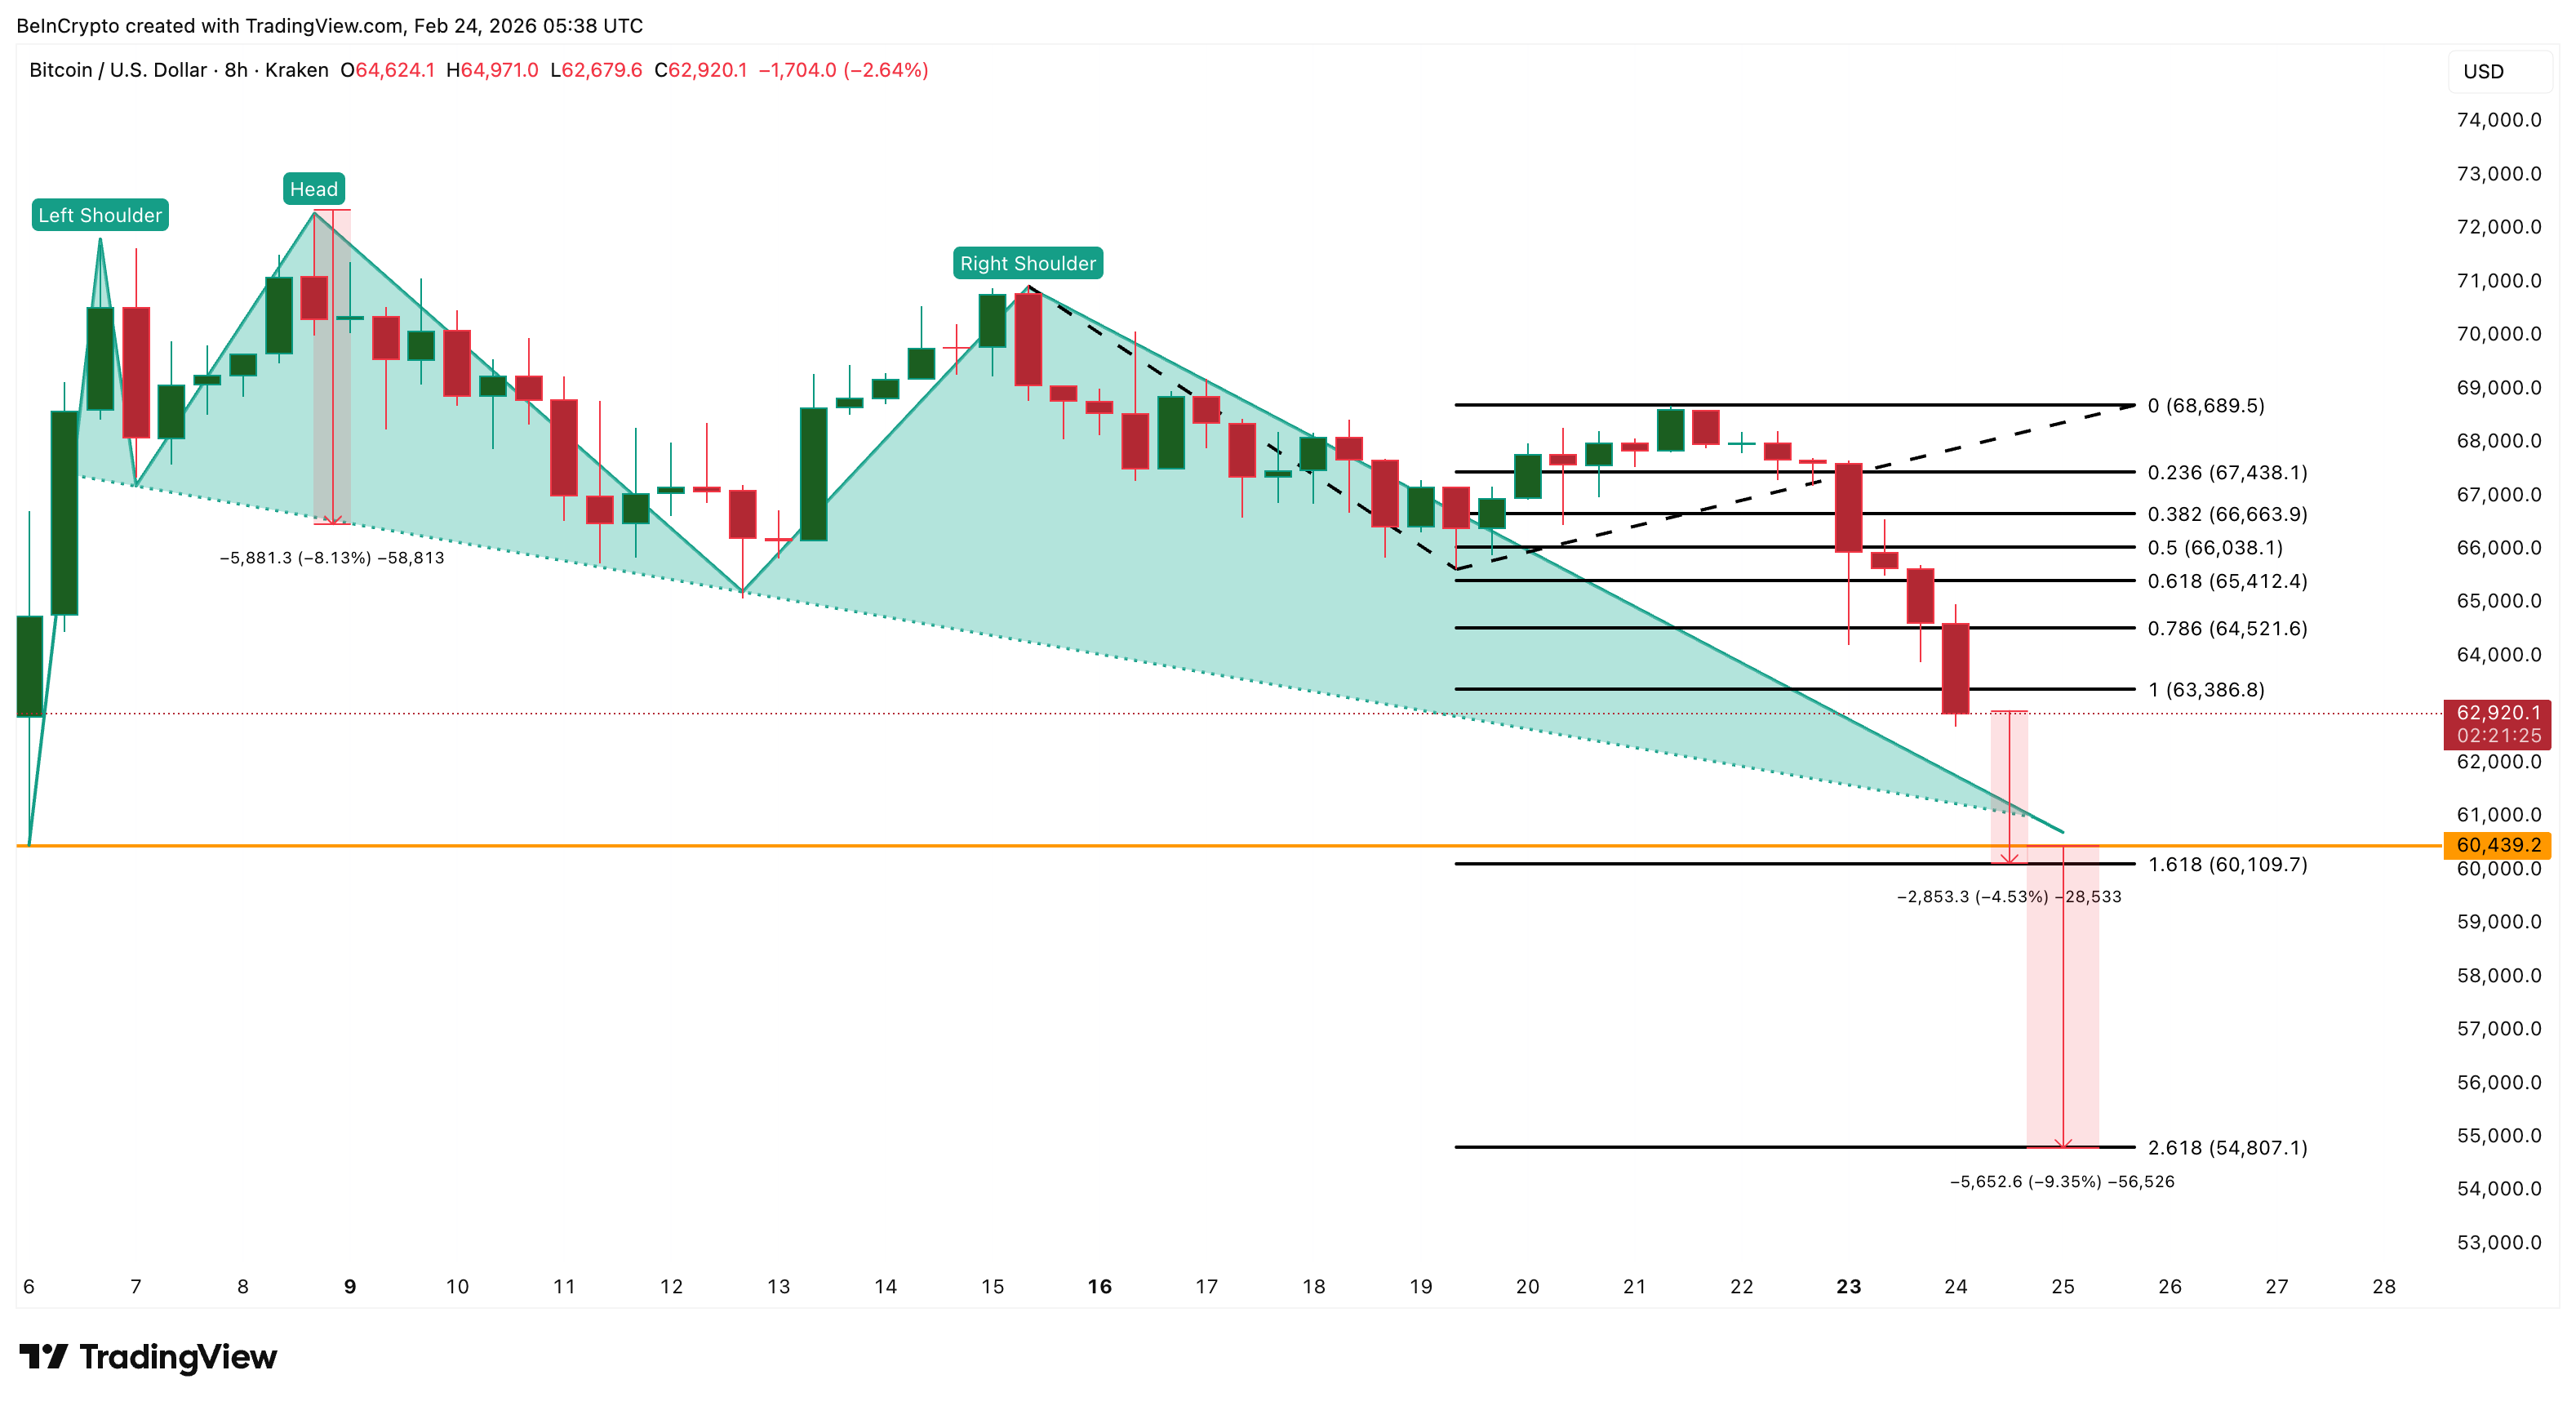
Gracy Chen’s warning reinforces why this zone matters. Her view that $60,000 remains key support, with deeper downside possible if ETF outflows continue, aligns closely with Bitcoin’s current technical structure. For now, Bitcoin stands at a decisive point.
Some strength returns if the BTC price recovers and reclaims the crucial resistance at $63,300, followed by $65,400. However, complete bearish structure invalidation remains out of bounds for now.
Miner capitulation continues to increase supply, while ETF outflows signal weakening institutional demand. Until these pressures ease, the $60,000 level remains the line separating stabilization from a deeper correction.
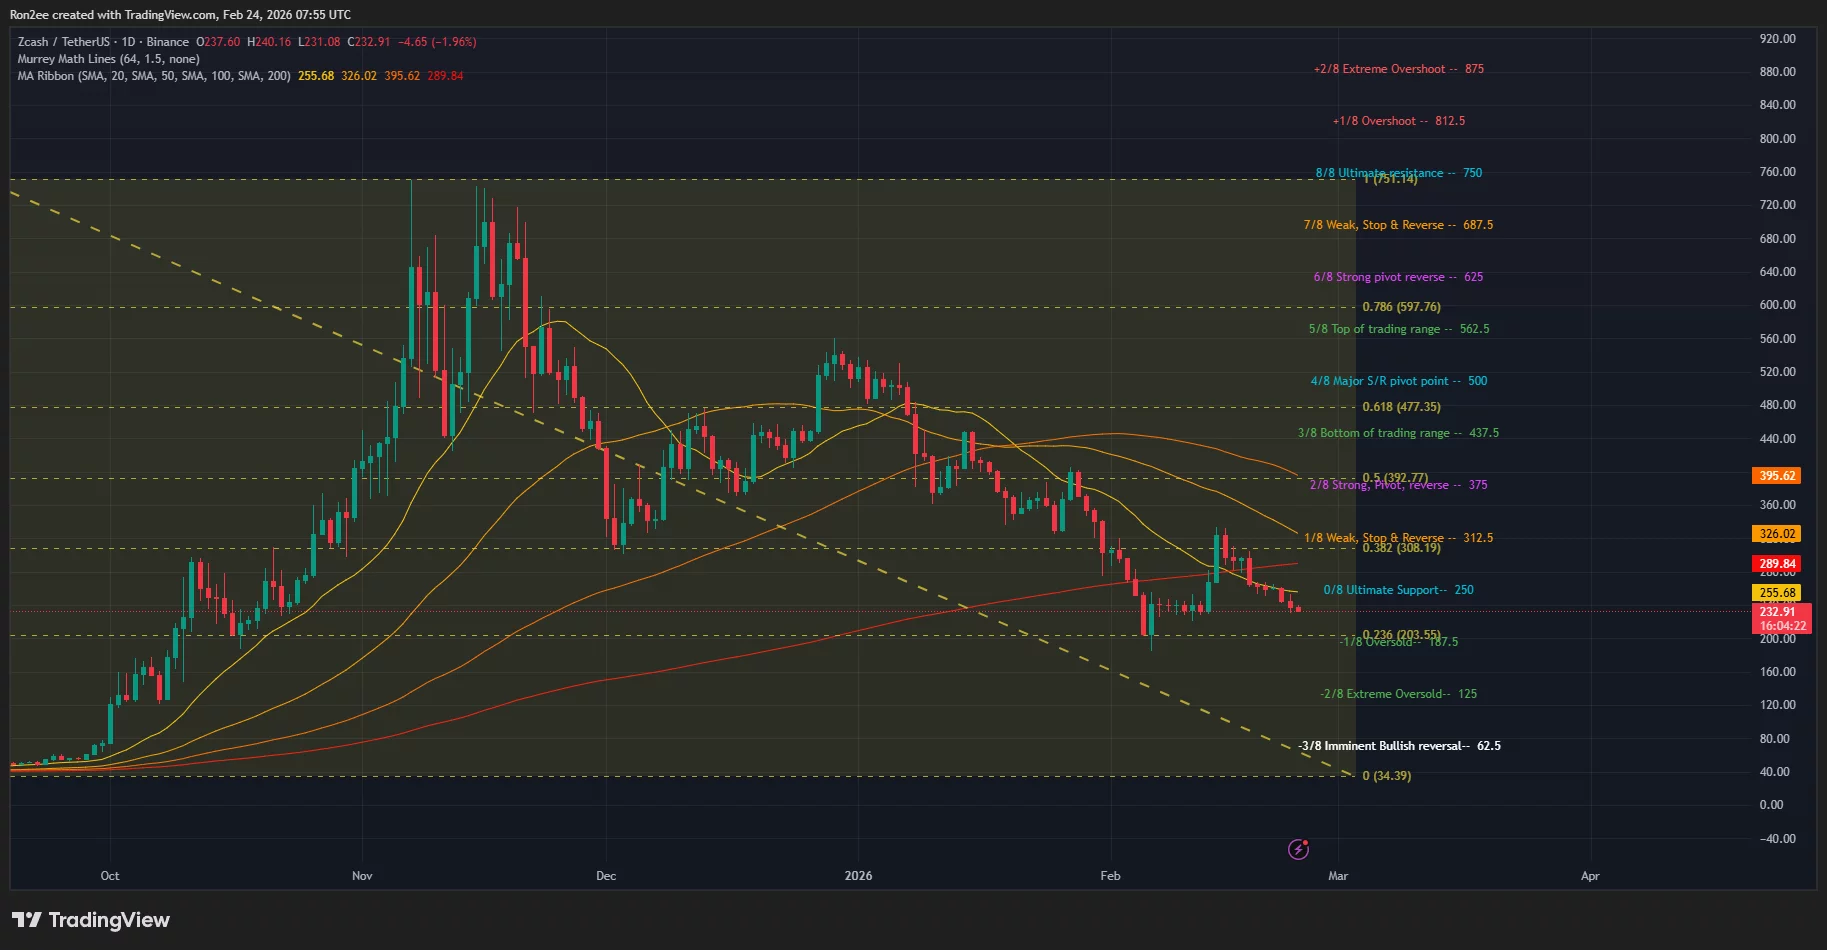
Zcash price has dropped over 20% in the past 7 days as the broader crypto market remained in a downtrend. The privacy token now risks a drop to $200 as a death cross appears to have taken shape on the daily chart.
Summary
- Zcash price has dropped 22% over the past 7 days largely weighed down by macroeconomic and geopolitical concerns affecting markets.
- It is close to confirming a death cross on the daily chart.
According to data from crypto.news, Zcash (ZEC) tanked nearly 22% to $231 last check Tuesday, Feb. 24. It has dropped by 28% from this month’s high and 56% from the beginning of this year.
Zcash price has been in a downtrend since the entire development team at the Electric Coin Company resigned from the project following a severe governance dispute with Bootstrap, the nonprofit organization that owns and oversees ECC.
While the organizational split did not lead to the forking of the Zcash blockchain and the ZEC token’s fundamentals remain unaffected, it has raised investor concerns over the future direction of the ecosystem.
The token’s crash was further exacerbated by a broader market drop triggered by persistent liquidations across leveraged markets as Bitcoin fell below several key support levels. The latest downturn comes as investor sentiment for risk assets has remained extremely fragile over the past weeks amid macroeconomic and geopolitical uncertainty.
Meanwhile, data from CoinGlass shows that futures demand for the token has dwindled since the start of this year. ZEC open interest has dropped to $306 million, nearly a fourth of the figures seen in early January.
On the daily chart, Zcash price has dropped below all moving averages, with the 50-day and 200-day SMAs appearing to be closing on a bearish crossover, which forms what traders call a death cross. Death crosses are some of the most feared bearish patterns in technical analysis.

Zcash price action also shows that it has fallen below the Ultimate support level of the Murrey Math lines. A loss below this baseline means loss of bullish momentum and hints at further capitulation.
Hence, the token risks a drop to the next key psychological support level at $200 next, which also closely aligns with the 23.6% Fibonacci retracement level. At press time, the target price remained 14% below Zcash’s current price of $233.
Disclosure: This article does not represent investment advice. The content and materials featured on this page are for educational purposes only.


On-chain analytics platform Nansen is establishing an operational presence in Bhutan’s Gelephu Mindfulness City (GMC). The move marks another step in the small Himalayan kingdom’s push to build a sovereign digital asset ecosystem.
More broadly, the deal underscores Bhutan’s accelerating ambition to build a sovereign-backed digital asset jurisdiction from the ground up. For Nansen, it is a bet that the next wave of growth will come from exactly that kind of ecosystem.
Not a Relocation
Under the collaboration announced Tuesday, Nansen plans to incorporate a local entity in GMC and hire a Bhutan-based team. In addition, the company will develop on-the-ground analytics capabilities to support the special administrative region’s expanding digital asset infrastructure.
The move is not a relocation. Nansen CEO and co-founder Alex Svanevik told BeInCrypto the company is keeping its Singapore headquarters intact.
“We’re not leaving Singapore — this is an additional entity,” Svanevik said. “We chose GMC because of the vision behind it. Most crypto-friendly jurisdictions are optimizing for what exists today. Bhutan is building something fundamentally different — a values-driven economic zone with digital assets baked into the foundation, not bolted on as an afterthought.”
Why Bhutan
Established as a purpose-built special administrative region in southern Bhutan, GMC is designed around sustainable economic development. The region has attracted attention for its integration of digital assets at the sovereign level. That includes holding crypto in its strategic reserves and developing a regulatory framework purpose-built for the sector.
For Svanevik, that sovereign-level commitment is the key differentiator.
“GMC has crypto in its strategic reserves, a progressive regulatory framework purpose-built for digital assets, and genuine sovereign conviction behind it. That’s rare. We want to be pioneers in that ecosystem,” he said.
Expanding Beyond Analytics
The partnership reflects a broader shift in Nansen’s own strategy. The company in January rolled out AI-powered trade execution on Base and Solana and launched its AI agent on the web, moving beyond its roots as a wallet-labeling and analytics tool toward a full-stack on-chain trading platform.
“Nansen is becoming an AI-first platform for on-chain investing — analytics, trading execution, and AI agents working together,” Svanevik said. “In GMC’s ecosystem, that positions us well as the infrastructure matures around custody, tokenization, and institutional liquidity.”
Nansen currently tracks over 500 million labeled wallet addresses across major blockchains.
Building Blocks, Not Hype
Still, the Nansen collaboration is the latest in GMC’s series of digital asset partnerships, spanning custody infrastructure, tokenization, institutional liquidity, and legal frameworks.
Jigdrel Singay, a board director at GMC, framed the approach as deliberately incremental.
“At GMC, we are focused on building the supporting layers — data, governance, and human capability — that enable innovation to develop responsibly,” Singay said.
Svanevik described Bhutan’s model as forward-looking rather than reactive.
“Bhutan is building something genuinely new — a jurisdiction designed for the future of finance, not retrofitted from the past,” he said.
Meanwhile, specific details on team size, office setup, and hiring timelines are still being finalized. Svanevik said the operational buildout will take shape over the coming months.

FULL STORY: Did Jeffrey Epstein’s Network Build Bitcoin?

Coronation Street’s Lucy Fallon spent weeks in mental health hospital | Soaps

Christian Brothers sells $22.5m in property


-

 Crypto World7 days ago
Can XRP Price Successfully Register a 33% Breakout Past $2?
-

 Video4 days ago
XRP News: XRP Just Entered a New Phase (Almost Nobody Noticed)
-

 Fashion4 days ago
Weekend Open Thread: Boden – Corporette.com
-

 Politics2 days ago
Baftas 2026: Awards Nominations, Presenters And Performers
-

 Sports14 hours ago
Women’s college basketball rankings: Iowa reenters top 10, Auriemma makes history
-

 Politics15 hours ago
Nick Reiner Enters Plea In Deaths Of Parents Rob And Michele
-

 Business6 days ago
Infosys Limited (INFY) Discusses Tech Transitions and the Unique Aspects of the AI Era Transcript
-

 Entertainment6 days ago
Kunal Nayyar’s Secret Acts Of Kindness Sparks Online Discussion
-

 Tech6 days ago
Retro Rover: LT6502 Laptop Packs 8-Bit Power On The Go
-
 Sports5 days ago
Clearing the boundary, crossing into history: J&K end 67-year wait, enter maiden Ranji Trophy final | Cricket News
-

 Business2 days ago
Mattel’s American Girl brand turns 40, dolls enter a new era
-

 Business2 days ago
Law enforcement kills armed man seeking to enter Trump’s Mar-a-Lago resort, officials say
-

 Entertainment5 days ago
Dolores Catania Blasts Rob Rausch For Turning On ‘Housewives’ On ‘Traitors’
-
 NewsBeat23 hours ago
‘Hourly’ method from gastroenterologist ‘helps reduce air travel bloating’
-

 Business6 days ago
Tesla avoids California suspension after ending ‘autopilot’ marketing
-

 Tech2 days ago
Anthropic-Backed Group Enters NY-12 AI PAC Fight
-

 NewsBeat2 days ago
Armed man killed after entering secure perimeter of Mar-a-Lago, Secret Service says
-

 Politics2 days ago
Maine has a long track record of electing moderates. Enter Graham Platner.
-

 Crypto World6 days ago
WLFI Crypto Surges Toward $0.12 as Whale Buys $2.75M Before Trump-Linked Forum
-

 Crypto World4 days ago
83% of Altcoins Enter Bear Trend as Liquidity Crunch Tightens Grip on Crypto Market