
Crypto World
Can XRP price hold $1.45 demand zone as key metric peaks?

XRP price is testing a critical demand zone near $1.45 as rising on-chain velocity and falling open interest hint at a decisive move ahead.
Summary
- XRP trades near $1.44 after sharp weekly losses, with sellers still dictating short-term direction.
- On-chain velocity has surged to yearly highs, suggesting heavy re-positioning as price weakens.
- A firm hold above $1.45 could spark a short bounce, while a breakdown risks deeper losses.
XRP was trading near $1.44 at press time, down about 10% over the past 24 hours, sliding to its lowest level since November 2024. The token has weakened across all major timeframes, falling 23% over the past week and nearly 40% over the past month.
Price action over the last seven days has remained confined between $1.44 and $1.88, with sellers maintaining control. Even so, market activity has picked up. XRP (XRP) recorded $5.07 billion in trading volume in the past 24 hours, up 25%. This points to heavy participation during the sell-off.
Derivatives data show a more cautious tone. CoinGlass figures indicate futures volume rose 17% to $7.94 billion, while open interest slipped 1.8% to $2.61 billion. This mix suggests that traders reducing leverage while spot activity rises, a setup that can appear near short-term turning points.
XRP velocity spikes as supply shifts hands
A Feb. 4 analysis by CryptoQuant contributor CryptoOnchain highlighted a sharp move in XRP Ledger activity. The seven-day SMA of XRP velocity climbed to 0.013 on Feb. 3, matching the highest levels seen since January 2025.
In previous cycles, this level has appeared at key moments. During this instance, the velocity increase coincided with a price decline, suggesting rapid coin movement rather than steady accumulation. Such conditions are often linked to older holdings changing hands or aggressive short-term trading during periods of stress.
According to the analyst, when velocity reaches its upper range while price struggles, it can mark a high-friction phase in the market. Whether this activity marks late-stage selling or the early stages of stabilization depends on how the price reacts around key support.
In a separate note, CryptoOnchain pointed to a sharp drop in XRP open interest on Binance, which has fallen to $405.9 million, the lowest level since November 2024.
A market reset of this size suggests that leverage has been significantly reduced. The probability of more forced sales drops as positions are unwound. This eases the influence of derivatives on short-term price moves.
Under these conditions, if spot demand holds up, any rebound is more likely to develop in a gradual and orderly way.
XRP price technical analysis
XRP is testing a clearly defined demand zone at $1.45, which has held during prior drops. The token is trading well below its 20-day moving average, placing the price in a stretched position.
XRP has also slipped below the lower Bollinger Band, which points to shrinking volatility. Instead of sellers running out of steam, the price action suggests heavy selling pressure pushing straight into support.
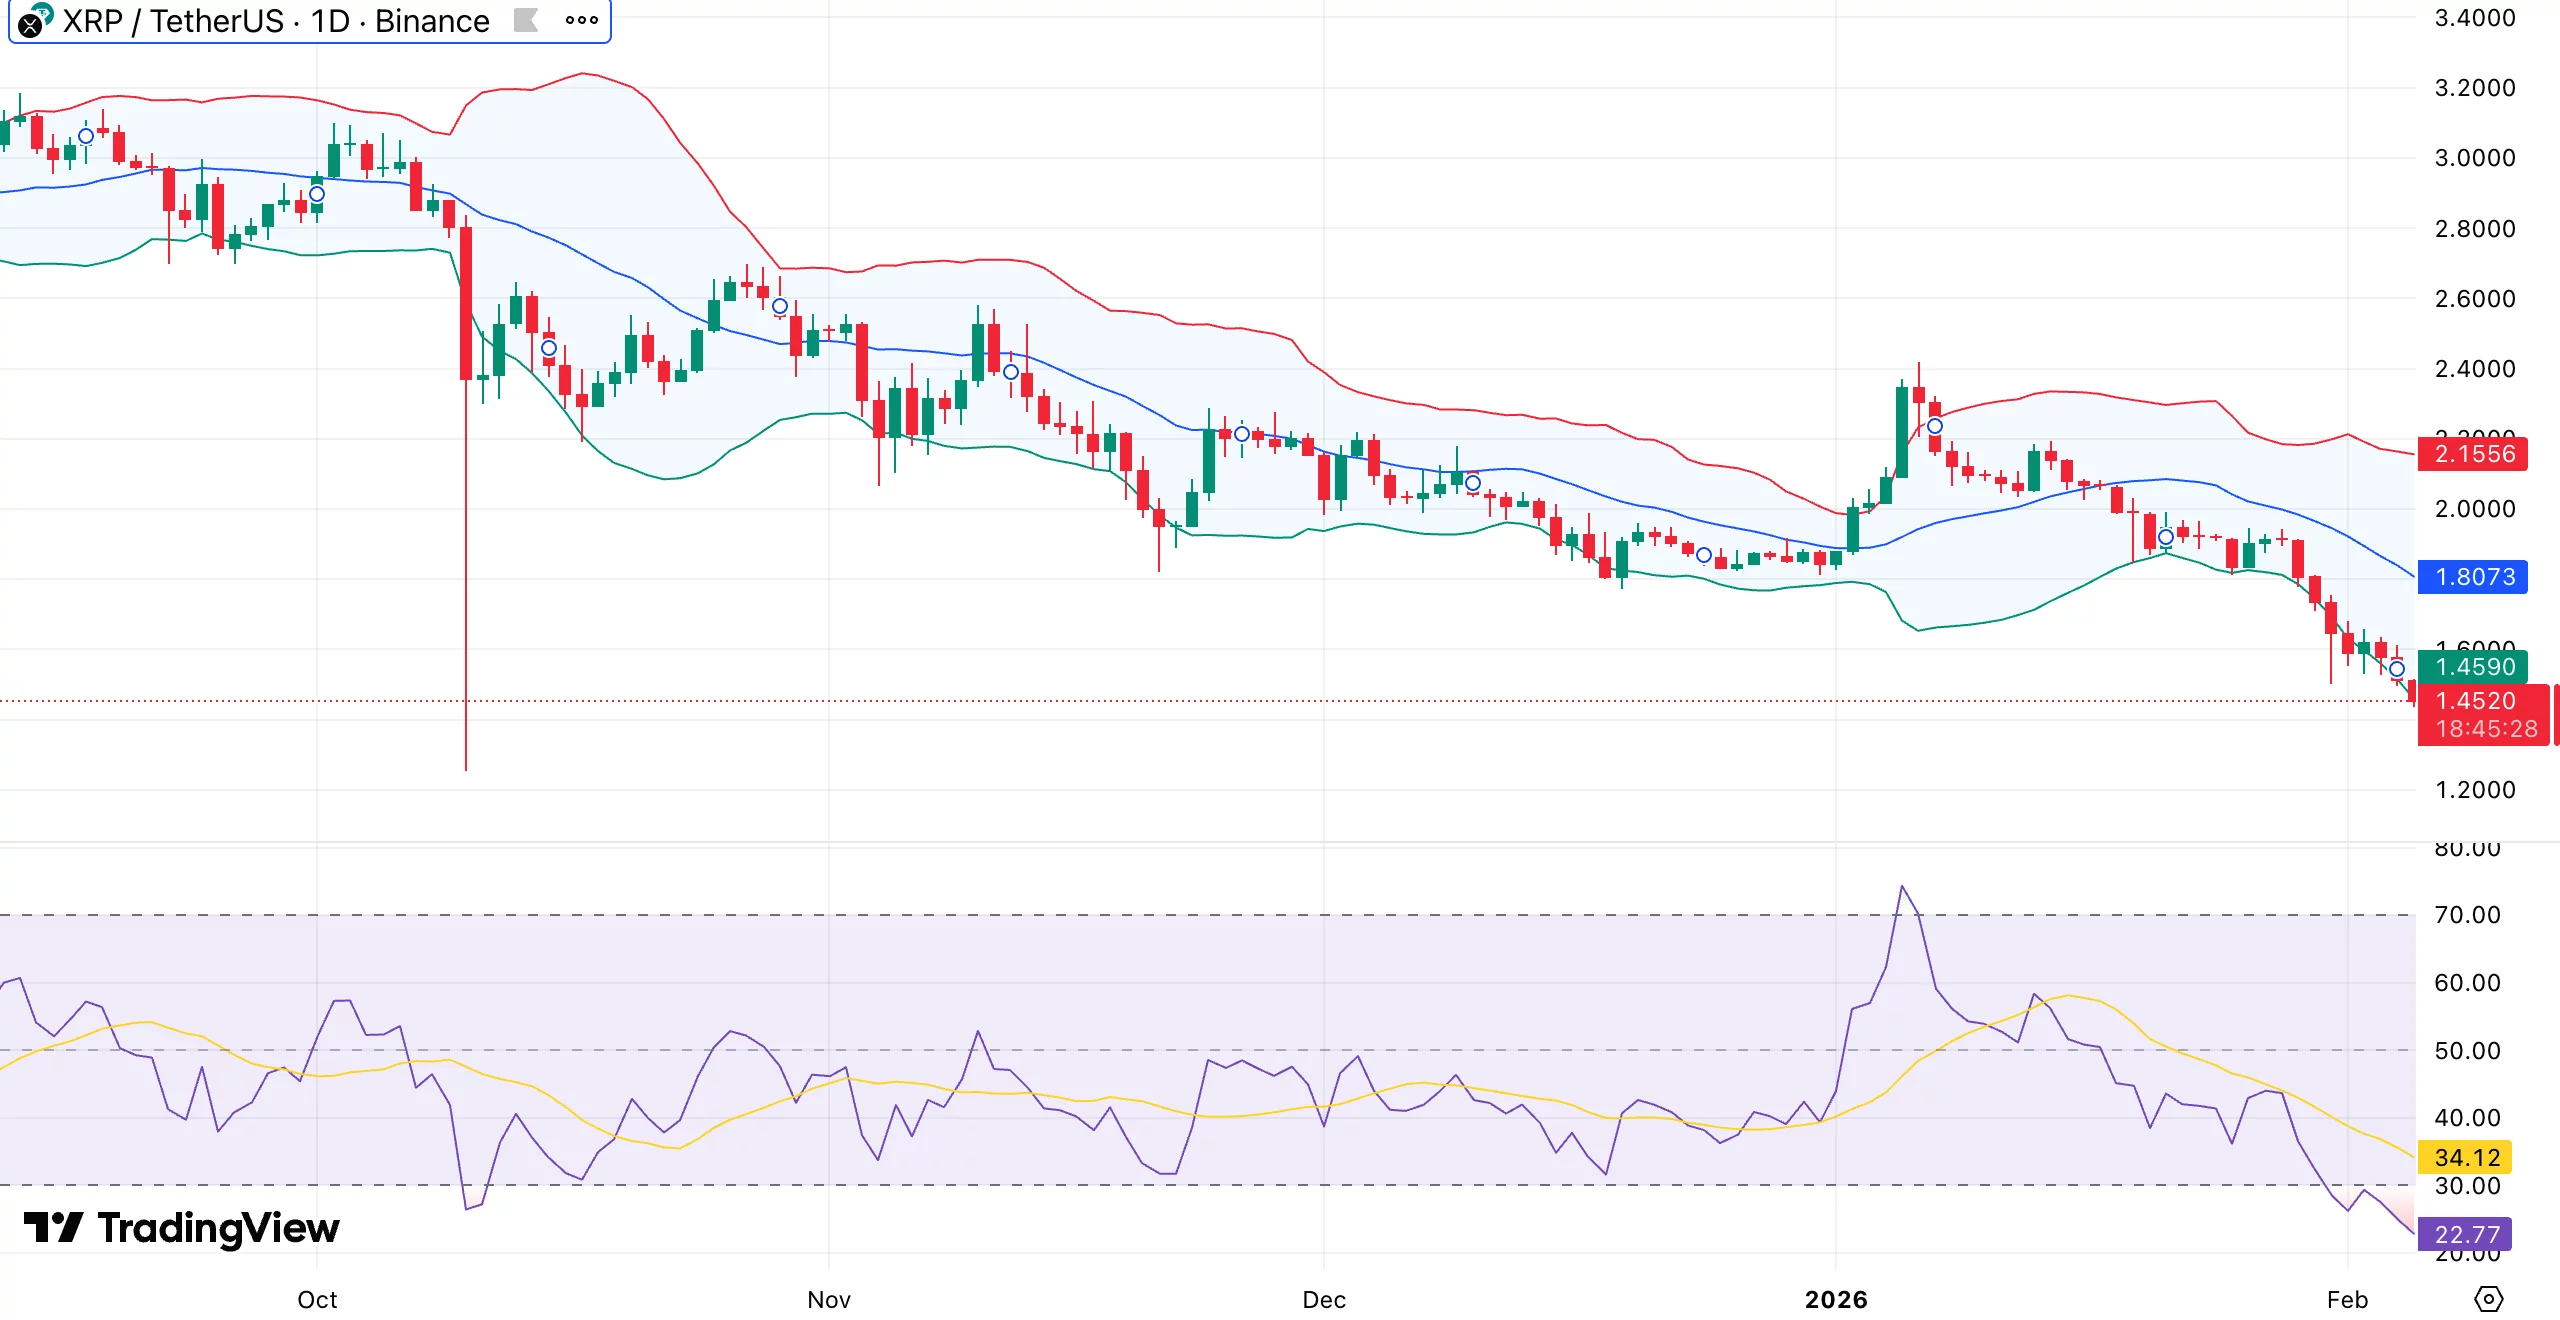
The relative strength index is in the low-30s, indicating that momentum is weak but getting closer to levels where selling pressure often slows.
Smaller bodies and longer wicks on recent candles suggest that sellers are meeting more resistance close to the current price. So far, the $1.45 level has not given way on a daily close.
If buyers continue to defend this zone, a short-term bounce toward $1.60–$1.70 becomes possible, driven by oversold conditions and reduced leverage. For the price to stabilize further, XRP would need to reclaim $1.80 and hold it.
Failure to hold $1.45 would change the picture quickly. A clean break below that level could open the door to deeper losses, as visible support becomes thinner beneath current prices.

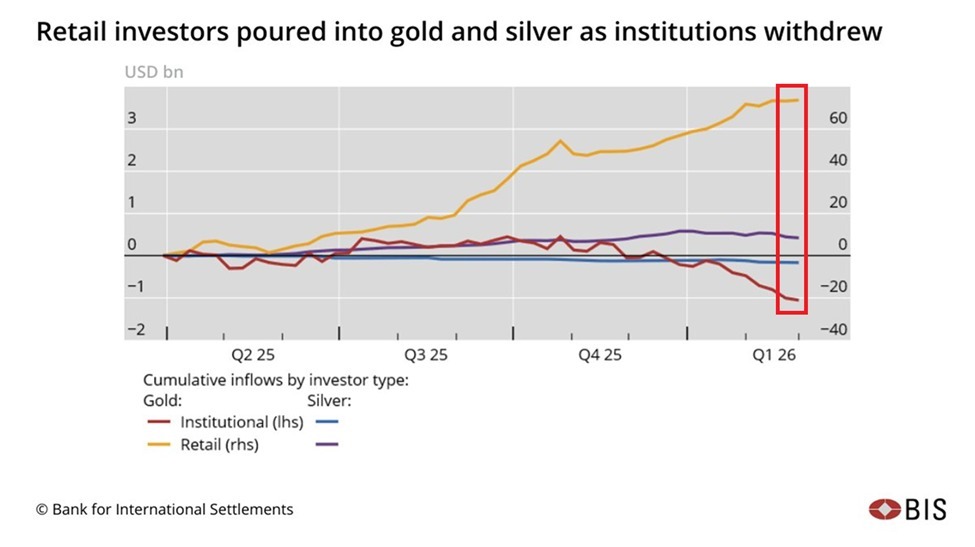
Retail gold purchases have tripled over the last six months, while Wall Street selling has accelerated over the past four months, according to data from the Bank for International Settlements (BIS).
“Retail-driven exuberance,” increasingly channeled through exchange-traded funds (ETFs), “set the stage for outsize moves,” continuing the precious metal rally from 2025, reported the BIS in a quarterly review released on Monday.
Since Q2 2025, retail investors have bought around $70 billion in gold ETFs, and these purchases have more than tripled over the last six months, observed the Kobeissi Letter, citing BIS data on Thursday.
“Retail investors are all-in on precious metals,” it noted.
Gold has surged 60% over the past year, and some crypto proponents have speculated it has come at the expense of Bitcoin, which some argue competes with gold as a store-of-value asset.
BIS data shows cumulative retail inflows effectively tripled from around $20 billion to roughly $60 billion over the six months from late Q3 2025 to the end of Q1 2026.
However, institutional selling started around mid-November and accelerated after the precious metals market began to correct in January, according to the data.

Leveraged liquidations amplified commodity drops
Bitcoin (BTC) is not the only asset susceptible to high volatility from overleveraged positions.
Prices of precious metals such as gold and silver reversed abruptly in late January and February 2026, while the “daily rebalancing of leveraged ETFs and margin‑triggered liquidations amplified the swings,” particularly in silver, BIS reported.
Smaller speculative derivatives traders, or “non-reportables,” had built up heavily leveraged long positions in silver heading into the crash, it added.
Gold prices are currently down 9% from their late January all-time high, while silver has slumped much harder, dropping 34% over the same period, according to GoldPrice.
Related: Bitcoin vs gold: ETF flows point to early capital rotation signs
The abrupt price drop and the spike in precious metal volatility “point to the role of retail flows, and amplification of price moves due to forced sales by leveraged ETFs, trend-following investors such as commodity trading advisers, and margin dynamics,” BIS stated.
Dollar strengthens as commodities and crypto weakens
The bank concluded that gold and silver declines coincided with changing expectations around US monetary policy and the performance of the US dollar, which has gained 4.7% since late January, according to the DXY dollar index.
“The precious metals crash seemingly coincided with shifts in expectations about the US dollar and the path of monetary policy, but it was hard to square with broader changes in fundamentals.”
Meanwhile, crypto markets have fallen around 43% from their October total capitalization peak as retail sentiment and interest in digital assets have dried up and remain at bear market levels.

Magazine: Metaplanet’s Japan Bitcoin bet, Bithumb ordered suspension: Asia Express
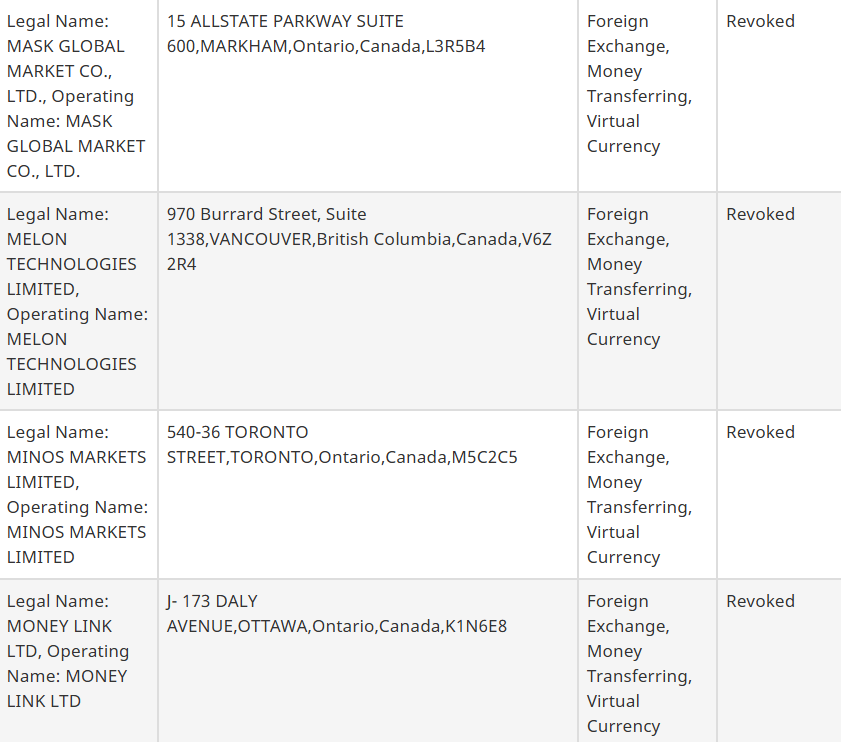
Canada’s financial intelligence unit has revoked the registrations of 50 money services businesses (MSBs) so far this year, with 47 related to crypto, and the minister of finance says it will continue cracking down.
Canada’s Financial Transactions and Reports Analysis Centre (FINTRAC) said on Monday that it took its most recent action, revoking 23 MSB registrations.
Minister of Finance François-Philippe Champagne said in a statement on Tuesday that it’s part of the government’s latest effort to combat money laundering, with FINTRAC also “strengthening enforcement and increasing transparency on compliance actions.”
He added that the 23 cancellations represented “a significantly increased pace of action, and our government will maintain this momentum.”
“Our government will continue to monitor and pursue new measures to address risks posed by virtual currency businesses, such as cryptocurrency MSBs and crypto ATMs, which can be used to facilitate money laundering and fraud,” Champagne said.

Traditional financial systems, such as wire transfers, have long been used for money laundering and other forms of fraud due to their scale and widespread adoption.
Related: US, UK, Canada launch joint operation to disrupt crypto fraud
The Financial Action Task Force estimates that 2 to 5% of global GDP is laundered through traditional financial systems, whereas Chainalysis estimates that less than 1% of crypto transactions are linked to illicit activity.
Two crypto platforms fined near the end of last year
FINTRAC has been stepping up its enforcement actions against crypto firms, issuing a $126 million fine against crypto platform Cryptomus in October for a range of alleged violations, including failing to report suspicious transactions on 1,068 separate occasions in July 2024 and failing to develop and apply written compliance policies.
Crypto exchange KuCoin also received a $14 million penalty a month earlier for violations, including allegedly failing to register as a foreign money services business with FINTRAC and failing to report large crypto transactions with the required information.
Magazine: Big Questions: Can Bitcoin save you from the dreaded Cantillon Effect?


Visa’s crypto division has launched a tool to allow artificial intelligence agents to make payments, the same day the Stripe-backed blockchain Tempo launched alongside a protocol for AI agents.
“Excited to share Visa CLI, the first experimental product from Visa Crypto Labs,” Cuy Sheffield, the head of Visa Crypto Labs, posted to X on Wednesday.
A website for Visa CLI, meaning a command line interface where users type what action a program must take, says the tool will give an AI agent “the ability to securely pay for what you need as you code.”
The tool also said it allows for “programmatic card payments without the pain of API keys.” API keys can include sensitive information that AI agents can leak, causing security risks.
It’s the latest standard seeking to allow AI agents to make payments online as hype around AI and stablecoins grows.
Coinbase launched its x402 standard to facilitate agentic stablecoin payments in May, which was most recently integrated by Sam Altman’s World in a developer toolkit for AI agents released on Tuesday.
Stripe-backed Tempo blockchain goes live
Meanwhile, the Tempo blockchain, backed by payments company Stripe, launched on mainnet on Wednesday, releasing a payments protocol for AI agents.
Tempo posted to X that its blockchain was “purpose-built for payments” and focused on servicing high-throughput stablecoin transactions, currently one of the most popular ways AI agents are used.
“Agents can already write code, coordinate services, retrieve data, and execute complex workflows across the internet. But as these systems become more capable, they increasingly need to transact,” Tempo said.
Agent payments will soon overtake human payments on the internet. The Machine Payments Protocol (@mpp) is a new open standard co-authored by @stripe and @tempo.
It’s designed to be extensible and payment-method agnostic, already supporting stablecoins, cards, and more. pic.twitter.com/dEjfGN2tp9
— Tempo (@tempo) March 18, 2026
The project also launched the Machine Payments Protocol, an open standard that it developed with Stripe, which it described as giving “a standard way for agents and services to coordinate payments programmatically.”
Related: SlowMist introduces Web3 security stack for autonomous AI agents
Tempo said the protocol “is designed to be rail-agnostic and extensible,” noting that Visa had extended support for the protocol on its card payments network while Stripe is supporting “cards, wallets, and other payment methods.”
The crypto fintech Lightspark had also extended support for the protocol over the Lightning Network for Bitcoin (BTC) payments.
AI Eye: IronClaw rivals OpenClaw, Olas launches bots for Polymarket


Nasdaq has received approval from the U.S. Securities and Exchange Commission to proceed with its tokenized equities pilot.
Summary
- Nasdaq received SEC approval to launch a pilot allowing select participants to trade and settle equities in tokenized form alongside traditional shares.
- The pilot is limited to securities within the Russell 1000 and major index linked ETFs, with tokenized shares carrying the same rights and pricing as standard equities.
According to the SEC’s approval filing, Nasdaq can now move ahead with “eligible participants” choosing to trade securities in either traditional or tokenized form on the same platform.
Tokenization involves representing real-world assets as digital tokens on blockchain infrastructure, allowing for more efficient settlement and extended market functionality.
Per previous coverage, Nasdaq first filed its proposal in September to enable trading of high-volume stocks in either a traditional format or as tokenized versions within the same exchange environment.
At the time, CEO Tal Cohen said the model can shorten settlement cycles and improve processes such as proxy voting, while maintaining investor protections.
The SEC has limited the pilot to securities in the Russell 1000 Index, which tracks the largest publicly traded companies in the U.S., along with exchange-traded funds tracking the S&P 500 and Nasdaq 100 indices.
According to the filing, there were concerns around market surveillance and potential pricing discrepancies during the review process. The commission said these were addressed through amendments that clarified safeguards.
Nasdaq has also partnered with crypto exchange Kraken, along with tokenization platform Backed, to build infrastructure that would allow public companies to create and issue tokenized shares.
Wednesday’s approval follows growing demand for tokenized assets from both crypto firms and traditional financial institutions seeking to modernize market infrastructure.
The SEC has also authorized the DTCC to pilot tokenization initiatives, while the New York Stock Exchange’s parent company Intercontinental Exchange has backed a project with OKX to launch tokenized stocks.
Crypto traders have become hopeful for a market rally after the US Federal Reserve held interest rates steady on Wednesday, according to crypto sentiment platform Santiment.
However, analysts are split on whether a near-term market surge is a reliable signal for traders.
“For now, traders are expecting a bullish relief rally in spite of no changes being made,” Santiment said in an X post on Wednesday, pointing to an increase in bullish sentiment among crypto market participants on social media who are linking the Fed’s steady rates to a potential crypto rally.
The social media discussion score surged from roughly 9 to 71 in the hours after the Fed’s “expected outcome” on Wednesday to hold rates steady at 3.5-3.75%.
Fed policy is a strong catalyst for Bitcoiners
“This is likely due to the fact that the bearish price action related to the lack of cuts already occurred yesterday,” Santiment said.

Fed policy has historically been a major catalyst for optimism among crypto market participants, with traders eyeing rate cuts in 2025 as a signal for a possible bull year for Bitcoin.
However, a pause in rates can increase expectations that cuts could come next.
Several analysts said they are expecting a crypto rally, but they are divided on how long it could last.
“Bull trap” may be on the horizon
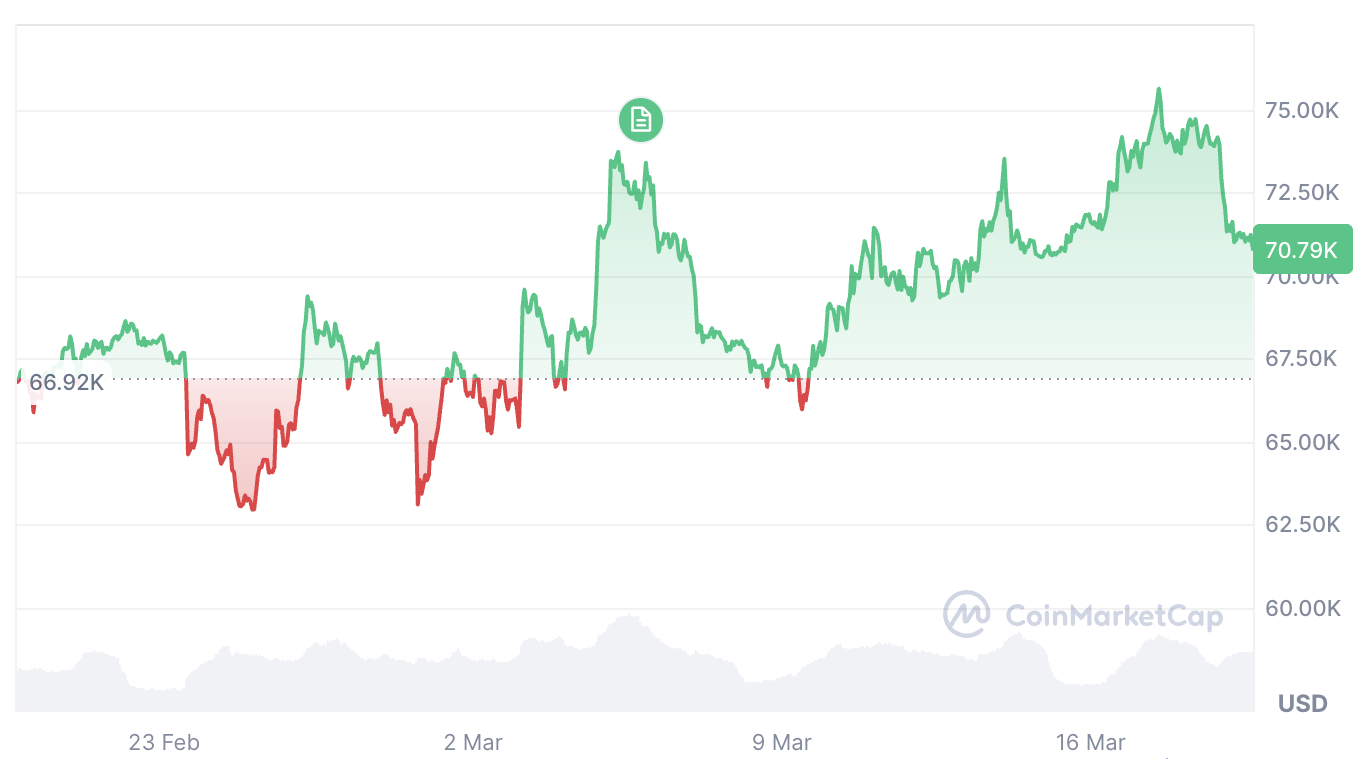
Bitcoin (BTC) onchain analyst Willy Woo recently warned that a potential “bull trap” may be forming, a false signal that Bitcoin is entering an uptrend before reversing lower.
Bitcoin has fallen 4.35% over the past 24 hours, trading at $70,790 at the time of publication, according to CoinMarketCap.
Meanwhile, crypto analyst Matthew Hyland said that Bitcoin and the broader crypto market will “see a significant rally” once the stock market finds its low and rebounds. The S&P 500 has fallen 3.73% over the past 30 days, according to Google Finance.
Echoing a similar sentiment, crypto trader Moustache said in an X post on Monday, “What you’ll see in the coming months is a massive rally.”
Related: ‘Rich Dad, Poor Dad’ author says ‘pin is near’ on TradFi ‘bubble burst:’ Predicts $750K Bitcoin
Other indicators suggest that crypto investors are still taking a cautious approach to the market.
The Crypto Fear & Greed Index, which measures overall crypto market sentiment, fell back into “Extreme Fear” territory on Wednesday, after briefly moving up into “Fear” the day prior.
Magazine: Big Questions: Can Bitcoin save you from the dreaded Cantillon Effect?
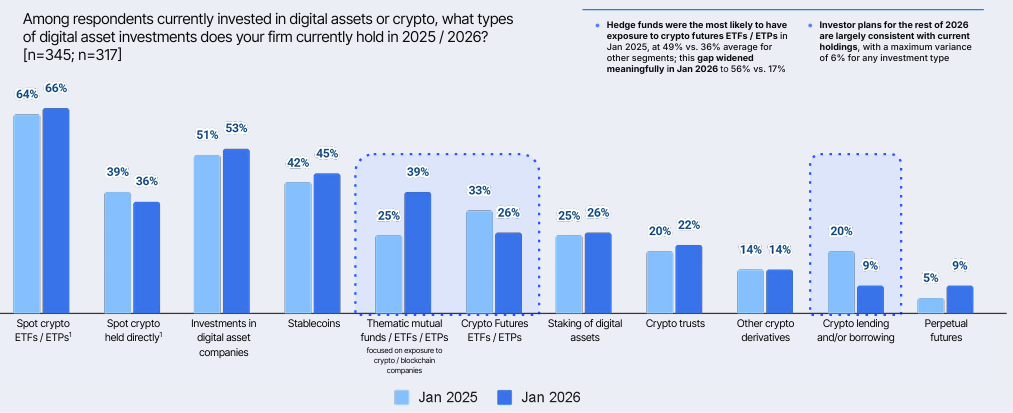
The crypto market sell-off since October hasn’t deterred institutional investors, with a new survey showing most plan to increase exposure to digital assets in the coming year.
According to a January survey of 351 institutional investors conducted by Coinbase and EY-Parthenon, 73% of respondents said they plan to increase their allocations of digital assets in 2026, while 74% expect crypto prices to rise over the next 12 months.
Two-thirds of respondents said exchange-traded products (ETPs) and other regulated vehicles have become their preferred way to gain exposure, reflecting growing familiarity with these instruments and a broader shift toward regulated access points. Regulation was also cited as a key factor attracting institutional participation.
On the regulatory front, more than three-quarters of respondents cited market structure as the most important area requiring clarity — a concern that comes as US lawmakers continue to debate legislation defining how digital assets are classified and regulated across agencies.
Market volatility, however, is reshaping how institutions approach crypto. Nearly half (49%) of respondents said recent turbulence has led them to place greater emphasis on risk management, liquidity and position sizing, rather than reducing exposure.

Related: Crypto’s 2026 investment playbook: Bitcoin, stablecoin infrastructure, tokenized assets
Stablecoins, tokenization gain traction
One of the key takeaways from the survey is growing institutional interest in emerging blockchain use cases such as stablecoins and tokenized real-world assets (RWAs).
According to the findings, 85% of respondents use or plan to use stablecoins for payments and treasury operations, with settlement and internal cash management cited as primary use cases.
Part of that momentum is being driven by US regulatory developments, with 83% of respondents saying the passage of the GENIUS Act will increase financial institutions’ willingness to engage with stablecoins. More than two-thirds (69%) said the law will drive broader adoption of stablecoin-based transactions.

Meanwhile, interest in tokenized assets continues to grow, with 63% of investors expressing interest in gaining exposure and 61% expecting tokenization to have a significant impact on market structure in the coming years.
Related: SEC’s ‘Crypto Mom’ calls for simpler disclosure rules, flags tokenization debate
XRP digital asset treasury Evernorth has submitted a key filing with the SEC, putting it a step closer to its goal of going public on the Nasdaq stock exchange.
The Ripple Labs-backed firm announced plans to go public in October as part of a merger with special purpose acquisition company (SPAC) Armada Acquisition Corp. II (Armada II).
In a statement on Wednesday, Evernorth announced that it had filed a Form S-4 registration statement with the US Securities and Exchange Commission (SEC), marking the final major regulatory hurdle before launching via a SPAC.
Evernorth eyes ticker XRPN
If the SEC approves the filing, Evernorth said it will still need final approval from Armada II shareholders for the merger, after which it can move forward with listing on the Nasdaq under the ticker XRPN.
Evernorth stated in October that it expects the merger to generate $1 billion in gross proceeds, which will be primarily used to build an XRP treasury, with a smaller portion of the funds being allocated to operating and deal expenses.
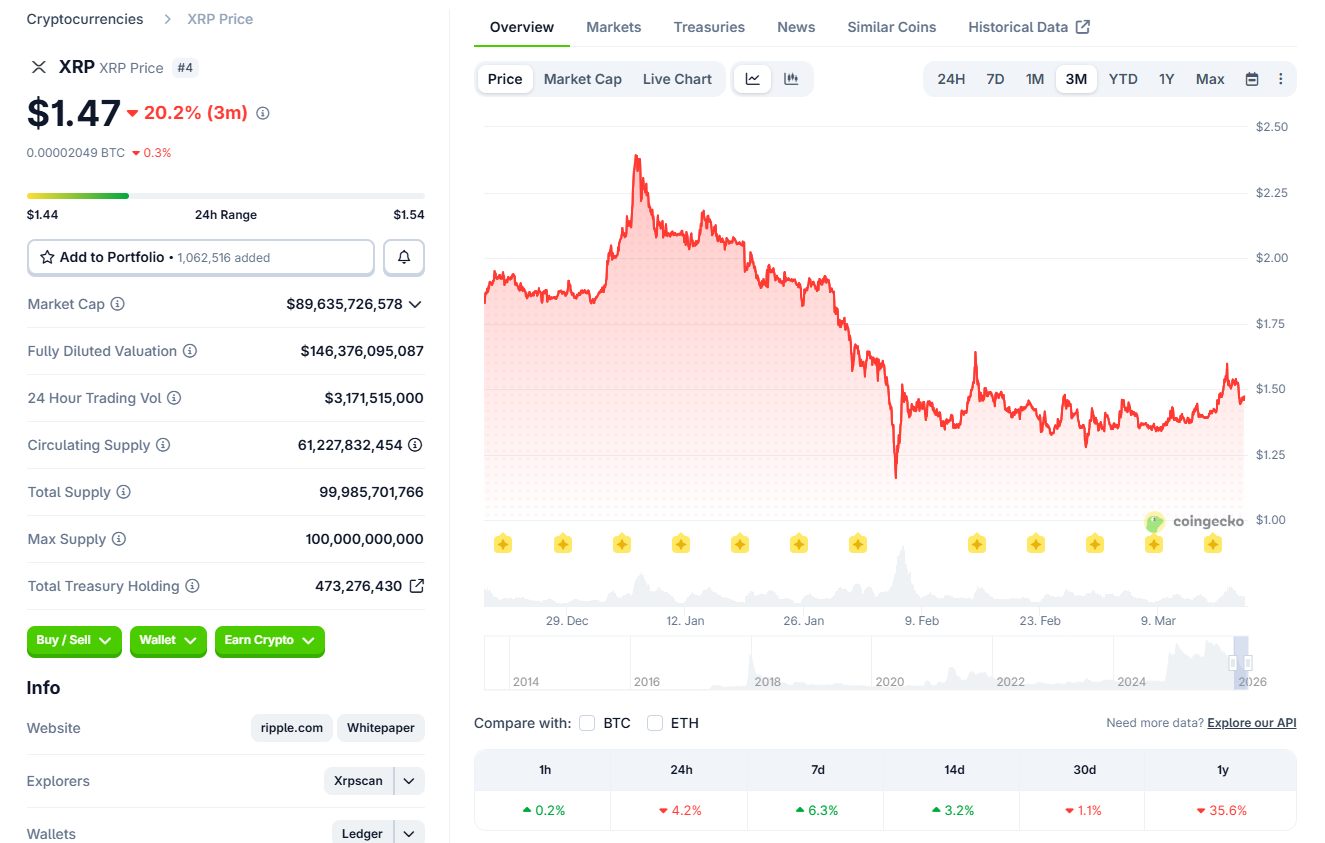
XRP treasury faces market turbulence
Evernorth has already begun building its XRP (XRP) treasury, with CoinGecko data showing the firm’s total treasury value is at $692.24 million, made up of 473.27 million XRP, which it made in two tranches between Oct. 20 and Nov. 4.
With an average cost per XRP at $2.54, the value of its holdings has fallen 19.1% over the past three months amid a broader crypto market downturn. At the time of writing, XRP is currently priced at $1.47.

Related: Ripple to buy back $750M in shares through April: Report
SEC provides clarity for crypto and XRP
Evernorth’s treasury plans come as XRP was among a number of tokens declared as a digital commodity in guidance published by the SEC on Tuesday.
In a notice on Tuesday, the SEC declared that generally only tokenized securities remain “subject to the securities laws.”
Other tokens used in its digital commodities example included Aptos (APT), Avalanche (AVAX), Bitcoin (BTC), Dogecoin (DOGE) and Ethereum (ETH).
“We always knew XRP wasn’t a security – and now the @SECGov has made clear what it is: a digital commodity. Grateful to the Crypto Task Force for working to deliver the clarity that markets, investors, and innovators have long deserved,” said Ripple’s chief legal officer, Stuart Alderoty via X on Tuesday.

Magazine: Big Questions: Can Bitcoin save you from the dreaded Cantillon Effect?

Polymarket, the blockchain-driven prediction markets platform, is acquiring Brahma, a crypto startup that builds DeFi infrastructure. The move is framed as a step to consolidate Polymarket’s stack and broaden its product suite as the two firms align on a path toward deeper on-chain and off-chain liquidity.
Brahma announced the transition on Wednesday, saying its team will dedicate its efforts to evolving Polymarket’s stack and product offerings. The company, founded in 2021, has reported processing over $1 billion in volume and asserts that its technology could help Polymarket streamline wallet creation, deposits, and token redemptions for users.
According to the announcement, the acquisition could unlock more liquidity for niche, low-volume markets on Polymarket and help the platform scale complex products for sophisticated users. Polymarket’s founder and CEO, Shayne Coplan, told Fortune that building reliable infrastructure across blockchain networks and traditional financial rails remains hard and there are no shortcuts. Financial terms of the deal were not disclosed at press time.
Key takeaways
- Polymarket is acquiring Brahma to enhance its infrastructure and product stack, with Brahma winding down its own products as the transition unfolds.
- Brahma’s core offerings—Strategy Vaults for automated DeFi strategies, Brahma Accounts (smart accounts for DeFi users), and Swype.fun (a Visa card linked to DeFi positions)—will be phased out over the next 30 days.
- The deal aims to bring more liquidity to Polymarket’s markets, particularly in smaller, harder-to-liquidate segments where users may benefit from smoother wallet creation and redemption flows.
- Polymarket has pursued aggressive expansion despite broader crypto-market softness, including partnerships and acquisitions announced in recent months.
Strategic implications of the Brahma integration
The Brahma transaction signals Polymarket’s intent to deepen technical capacity behind its prediction markets. Brahma’s experience in designing and operating scalable, user-ready DeFi infrastructure could help Polymarket reduce friction for users—potentially lowering barriers to entry and increasing throughput on low-visibility markets where liquidity is typically thin.
While the two firms have not disclosed the purchase price, the alignment comes as Polymarket has sought to diversify its toolkit beyond core prediction markets. The integration underscores a broader industry push to merge on-chain finance primitives with markets that hinge on real-world events and outcomes.
What changes for Brahma’s products and users
As part of the transition, Brahma’s three main products will be wound down over the next month: Strategy Vaults, which automate DeFi positioning; Brahma Accounts, the platform’s smart-account solution for DeFi users; and Swype.fun, a card-linked interface intended to realize DeFi positions for real-world spending. For existing users of these services, the wind-down process will be navigated in the coming weeks as the Polymarket integration proceeds.
Brahma’s team noted that its solutions were designed to meet sophisticated users’ demands, including automated strategies and streamlined access to DeFi features. The move to fold these capabilities into Polymarket could embed more robust infrastructure into the platform and potentially broaden its appeal to professional market participants and developers building on top of prediction markets.
Polymarket’s broader expansion playbook
The Brahma deal is part of a broader acceleration of Polymarket’s growth trajectory. In March, the company announced a partnership with Palantir Technologies and TWG AI to build an AI-powered sports integrity platform, signaling continued investment in data-focused, technologist-led initiatives. Earlier, Polymarket acquired Dome, a Y Combinator-backed provider of developer tools for prediction markets, and Lunch, a boutique firm focused on assembling and recruiting technical teams for startups.
Despite a tougher macro environment for crypto, Polymarket has faced regulatory scrutiny in several jurisdictions given its business model around unregulated betting on real-world events. Notably, recent coverage has highlighted how prediction markets have encountered resistance in places like Argentina, alongside ongoing debates in the United States about market design and regulation.
Polymarket’s ongoing expansion, including the Brahma acquisition, indicates a strategy focused on building a more capable infrastructure backbone and scaling its ecosystem through partnerships and targeted acquisitions. Investors and users will want to watch how the Brahma integration unfolds, how liquidity dynamics evolve on niche markets, and how regulatory developments shape the platform’s ability to deploy new features at scale.
As the integration progresses, readers should monitor whether Polymarket can successfully merge Brahma’s engineering capabilities with its existing stack, and what that means for the speed and reliability of user experiences, especially in lower-liquidity markets where liquidity depth and transaction costs can be decisive.
Twenty-one crypto organizations have signed an open letter urging US colleges to incorporate decentralized finance into their curricula, arguing that there will be massive demand for crypto talent on Wall Street.
“Our purpose with this letter is simple: to respectfully urge higher education institutions across the United States to further integrate digital assets, blockchain, and decentralized finance into their business and legal curricula,” the open letter reads, which was published on Wednesday.
The campaign was spearheaded by decentralized protocol aggregator 1Inch, with signatories including the Solana Policy Institute, Blockchain Association, DeFi Education Fund and crypto platforms like Aave, MyEtherWallet, Delphi Digital and Messari.
While 1Inch acknowledged that DeFi is taught in some schools, it argued that current curricula treat it mostly as theoretical, and that students should gain a more practical understanding of a “critical part of the global financial ecosystem.”
“It is wrong to think, as some do, that DeFi and crypto technologies lack practical uses or are somehow deviant to the public good,” 1Inch said, pointing out that stablecoins eliminate cross-border payment friction, lending protocols offer yield opportunities for investors and tokenized assets enable trading around the clock.
“The theoretical phase is over. Ideas have already become infrastructure.”
In comments to Cointelegraph, 1Inch said it is pushing for more DeFi courses to be taught in the classroom because opportunities have expanded beyond developer roles to those in more business and legal roles.
“It’s no longer just hoodies; it’s suits and ties too,” 1Inch said, noting that Wall Street firms like Goldman Sachs and PwC are on the lookout for crypto talent beyond the tech-savvy programmers.
“The aim is to build on top of these greater DeFi understanding and practical knowledge, not just among the developers of tomorrow but CEOs and CLOs.”
The open letter asks for more “foundational education” in blockchain architecture and DeFi as a core module rather than as an elective course, with the course material touching on everything from automated market makers and liquidity provision to decentralized autonomous organizations and smart contract risks.
1Inch also suggested that students engage with DeFi systems directly to “gain a real-world understanding of how DeFi works.”
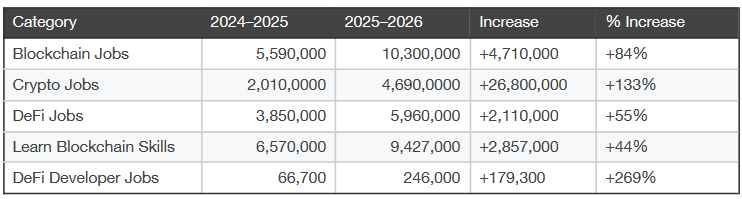
The biggest Wall Street firms are seeking DeFi experts
BlackRock, Fidelity Investments, Goldman Sachs, JPMorgan and Morgan Stanley were recently seen putting out job advertisements for DeFi-related roles.
This has also been reflected in Google search statistics, said 1Inch, showing that Google search volume for “Blockchain jobs” grew 84% between 2024 and 2026.
More specialized roles are accelerating even faster, with “DeFi Developer Jobs” increasing nearly 270% to 246,000 results, 1Inch said.

Related: Columbia professor says NYSE tokenization plan reads like ‘vaporware’
DeFi has had limited exposure to some US Ivy League colleges in the past.
Massachusetts Institute of Technology ran an “MIT Digital Currency Experiment” in 2014, which involved distributing Bitcoin (BTC) to students, while it later offered courses touching on blockchain ethics and distributed ledger technology.
Harvard’s extension school also offers a blockchain innovation course, while Texas A&M offered a “Bitcoin Protocol” course to business and engineering students in 2023.
On Tuesday, Bitcoin bull Michael Saylor said the Florida Department of Education approved Saylor Academy — a non-profit education platform — to operate as Saylor University.
Saylor Academy is now Saylor University.
The Florida Department of Education has granted @saylordotorg university status—marking a major milestone in our mission to provide free, world-class higher education for all.pic.twitter.com/SbimeofUkQ
— Michael Saylor (@saylor) March 17, 2026
The move enables students to receive tuition-free master’s degrees, which include programs that teach about Bitcoin and blockchain technology.
Magazine: What’s a ‘Network State’ and are there real-life examples? Big Questions
Bitcoin (BTC) slid 2.5% around Wednesday’s Wall Street open as a fresh US inflation overshoot spooked markets.
Key points:
-
US PPI inflation surpasses market expectations again, continuing its “hot” 2026 trend.
-
BTC price pressure results at the Wall Street open, as markets brace for the Federal Reserve interest-rates decision.
-
Traders see no reason to rethink their bearish stance on Bitcoin.
Fed rates “less supportive” for Bitcoin, crypto
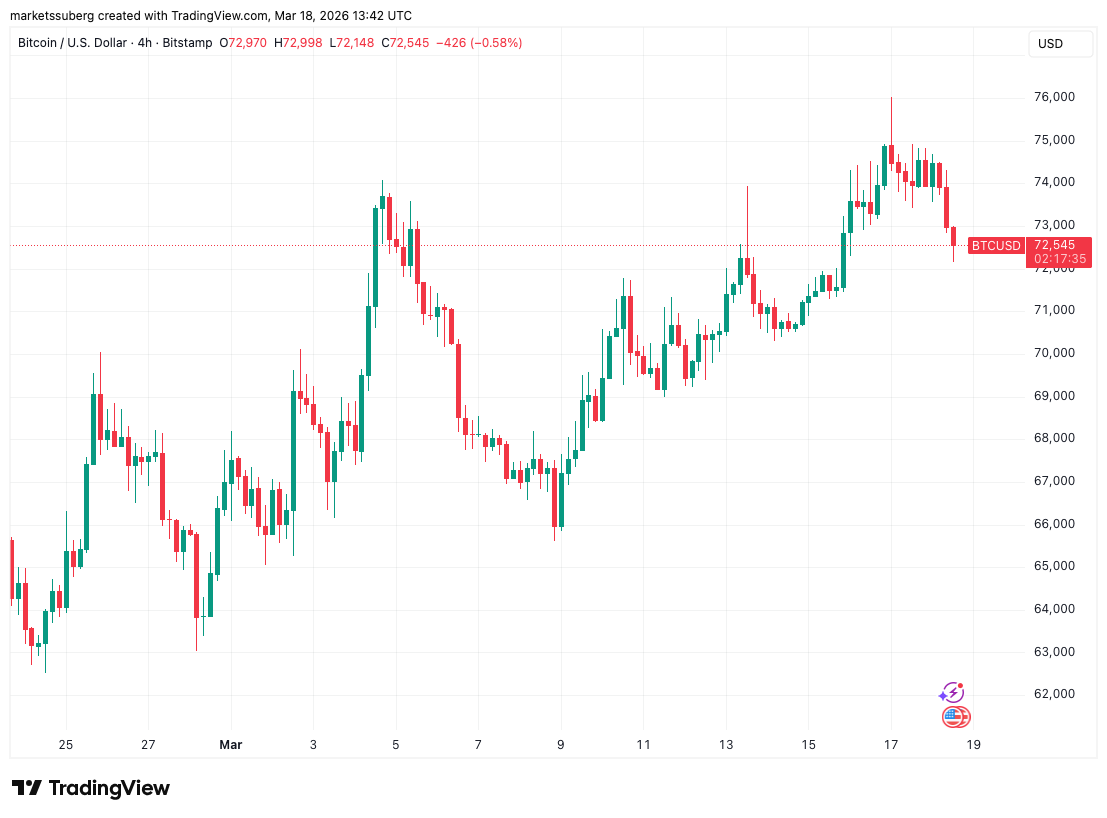
Data from TradingView showed $72,000 coming back into focus for BTC price action after the February print of the Producer Price Index (PPI).

This came in markedly above expectations at 0.7% month-on-month and 3.4% year-on-year, extending a trend from recent months. Markets had foreseen 0.3% and 3%, respectively.
“On an unadjusted basis, the index for final demand rose 3.4 percent for the 12 months ended in February, the largest 12- month advance since increasing 3.4 percent in February 2025,” an official statement from the US Bureau of Labor Statistics (BLS) confirmed.

The timing of the release was pertinent, coming just hours before the Federal Reserve was due to release its decision on interest-rate changes.
While markets saw practically no chance of a rate cut or hike, the Federal Open Market Committee (FOMC) meeting could still spark volatility based on the tone of Chair Jerome Powell’s accompanying statement and press conference.
“Macro remains the dominant driver into what is arguably the most important central bank week of the year,” trading company QCP Capital wrote in its latest “Market Color” analysis on the day.
QCP noted that other major central bank rate moves were scheduled for the day after the Fed.
“Markets have sharply pared easing expectations as higher oil prices complicate the path for rate cuts, even as growth and labour data soften,” it continued.
“For crypto, the implication is straightforward: the rates backdrop is becoming less supportive, not more.”

Lower interest rates imply better liquidity prospects for crypto and risk assets, while a hawkish Fed tends to pressure prices.
”Caution pays” for BTC price into FOMC
Going into FOMC, Bitcoin traders were firmly risk-off.
Related: Bitcoin sparks ‘bull trap’ warning after BTC price rejects at $76K
“$BTC hovering below weekly resistance; FOMC later today – I think caution pays here,” trader Jelle wrote in his latest commentary on X.

An accompanying chart showed the risk of a fresh BTC price support breakdown, with Jelle and others having stated that Bitcoin remains in a bear market.
$BTC 1D
It looks almost exactly the same.
Bear Flag Breakdown & Retest with low volume on the upward move.
Most oversold indicators have completely reset. pic.twitter.com/NBvrE1K5Mf
— Roman (@Roman_Trading) March 17, 2026
Crypto analyst Michaël van de Poppe, meanwhile, was more optimistic, still seeing a chance of $80,000 reappearing.
“Very strong move on $BTC this month, and now it’s consolidating. Nothing wrong with that, the opposite actually,” he told X followers.
“It’s very likely that we’ll continue to test higher, as resistances are still above us.”

Van de Poppe acknowledged that he also “wouldn’t be surprised” at a test of range lows.
This article does not contain investment advice or recommendations. Every investment and trading move involves risk, and readers should conduct their own research when making a decision. While we strive to provide accurate and timely information, Cointelegraph does not guarantee the accuracy, completeness, or reliability of any information in this article. This article may contain forward-looking statements that are subject to risks and uncertainties. Cointelegraph will not be liable for any loss or damage arising from your reliance on this information.

UK Ex PM Condemns Trump Over Iran War Handling
Scots told what to eat and drink in nuclear emergency with government official advice
Bitcoin price today: slides below $71k as traders pare Fed cut bets


-
 Crypto World5 days ago
HYPE Token Enters Net Deflation as HyperCore Buybacks Outpace Staking Rewards
-

 Tech3 days ago
Your Legally Registered ‘Motorcycle’ Might Not Count Under Proposed US Law
-

 Fashion6 days ago
Weekend Open Thread: Addict Lip Glow
-
 Tech2 days ago
Are Split Spacebars the Next Big Gaming Keyboard Trend?
-
Sports5 days ago
Why Duke and Michigan Are Dead Even Entering Selection Sunday
-

 Business3 days ago
Search for Savannah Guthrie’s Mother Enters Seventh Week with No Arrests
-

 Business5 days ago
US Airports Launch Donation Drives for Unpaid TSA Workers as Partial Government Shutdown Enters Fifth Week
-
Crypto World5 days ago
Coinbase and Bybit in Investment Talks: Could Bybit Finally Enter the US Crypto Market?
-

 Business3 days ago
Australian shares drop as Iran war enters third week
-

 Business5 days ago
Country star Brantley Gilbert enters growing non-alcoholic beer market
-

 Crypto World3 days ago
Crypto Lender BlockFills Enters Chapter 11 with Up to $500M in Liabilities
-

 Sports5 days ago
College Basketball Best Bets: Conference Tournament Semifinal Picks
-

 Politics21 hours ago
The House | The new register to protect children from their abusers shows Parliament at its best
-

 Business6 days ago
Trump demands Powell cut rates as Iran conflict raises energy prices
-

 Fashion3 days ago
25 Celebrities with Curly Hair That Are Naturally Beautiful
-

 News Videos13 hours ago
RBA board divided on rate cut, unusually buoyant share market | Finance Report | ABC NEWS
-

 Crypto World6 days ago
Senate Votes to Include CBDC Ban in Bipartisan Housing Bill
-

 NewsBeat6 days ago
Deane Road crash near Bolton colleges and university
-

 News Videos6 days ago
Tom Lee: The 100x Opportunity EVEN Bigger Than Bitcoin (New Ethereum Prediction 2026)
-

 Crypto World14 hours ago
Canada’s FINTRAC revokes registrations of 23 crypto MSBs in AML crackdown


You must be logged in to post a comment Login