
Crypto World
Canary Capital Launches First-Ever Staked SUI ETF


Canary Capital’s introduction of the Canary Staked SUI ETF provides investors with regulated exposure to the Sui Network’s staking rewards
Canary Capital on Wednesday, Feb. 18, officially launched the Canary Staked SUI ETF (NASDAQ: SUIS).
The exchange-traded fund seeks to track the spot price of SUI while participating in the Sui Network’s proof-of-stake protocol, with net in-kind staking rewards reflected in the fund’s NAV, according to a blog post.
“The Canary Staked SUI spot ETF (SUIS) brings exposure to SUI in a registered, exchanged-traded structure, while also enabling investors to benefit from net staking rewards generated through SUI’s proof-of-stake mechanism,” said Steven McClurg, CEO at Canary Capital.
The new product aims to provide both institutional and retail investors with access to the Sui ecosystem. It also reflects a growing interest in regulated crypto investment vehicles, offering transparency and compliance with existing financial regulations.
The move is expected to attract a broader range of investors seeking diversified exposure to digital assets.
The product launch comes as Sui Network has recorded growth recently, recording over $10 billion in 30-day decentralized exchange (DEX) trading volume, 1,000 monthly active developers, and more than $200 billion in monthly stablecoin transfer volume, according to DeFiLlama and Artemis data.
This article was generated with the assistance of AI workflows.


The Trump administration submitted a $1.5 trillion defense spending request to Congress on April 3 — the largest military budget proposal in U.S. history — pairing record military outlays with cuts to domestic programs in a fiscal combination that signals sustained inflation pressure and a narrower path to Fed rate cuts.
Summary
- The Trump administration submitted a $1.5 trillion FY2027 defense budget proposal to Congress on April 3, roughly a 42% increase over current Pentagon spending levels.
- The proposal pairs the record defense allocation with $73 billion in cuts to domestic programs including housing, health research, and education.
- The fiscal combination — wartime spending surge alongside domestic contraction — carries implications for inflation, Federal Reserve policy, and risk assets including crypto.
The Trump administration submitted a $1.5 trillion defense spending request to Congress on April 3 — the largest military budget proposal in U.S. history — pairing record military outlays with cuts to domestic programs in a fiscal combination that signals sustained inflation pressure and a narrower path to Fed rate cuts. According to NPR’s reporting on the White House release, the proposal represents a roughly 42% increase over current spending and includes $1.1 trillion in base Pentagon funding alongside $350 billion to be passed through the budget reconciliation process.
A $1.5 trillion defense budget — the first base defense budget in U.S. history to cross the $1 trillion mark — funded partly through domestic spending cuts rather than new revenue, raises immediate questions about the fiscal trajectory of the U.S. government. Budget Director Russell Vought wrote that “President Trump promised to reinvest in America’s national security infrastructure, to make sure our nation is safe in a dangerous world.” For crypto markets, the more immediate concern is the inflationary signal embedded in the spending mix.
Defense-heavy budgets during active wartime, combined with domestic spending reductions that shift costs to states, tend to sustain elevated government outlays without equivalent economic output — a dynamic that complicates the Federal Reserve’s rate path at exactly the moment investors had been positioned for monetary easing.
What investors are watching
Bitcoin was trading near $67,000 as the proposal was released, with U.S. equity markets closed for Good Friday. The budget announcement lands as an additional fiscal signal atop an already difficult macro environment for crypto — one defined by oil above $100, the ongoing Strait of Hormuz closure, and a strong March jobs print that independently reduced near-term rate cut expectations.
The budget proposal must now move through Congress, where both the size and the domestic spending cuts will face bipartisan scrutiny. A prolonged legislative fight over defense appropriations would add fiscal uncertainty to the existing geopolitical backdrop — a combination that has historically supported safe-haven assets over risk assets in the near term.

Cambodia’s parliament passed legislation targeting compounds used to defraud victims through scams, including those involving cryptocurrency.
In a Friday notice, the Senate of the Kingdom of Cambodia announced that the chamber had unanimously approved the draft law with no amendment, with 58 senators voting yes. According to reports, the draft bill, which would still need the king’s approval before becoming law, imposed prison time between two to five years and up to $125,000 in fines for certain crimes, or twice the time in prison and penalties if part of a gang or targeting multiple victims.
“The draft law stipulates the establishment of criminal rules to fill the gaps and deficiencies in the current law, which will contribute significantly to addressing challenges that pose serious risks to social security, the economy and citizens, including affecting Cambodia’s reputation, as well as improving the effectiveness of the fight against fraud through technological systems, aiming to contribute to the preservation and protection of public security and order, and improving the effectiveness of cooperation in combating this crime,” said a translation of the Friday Senate notice on the bill.

According to a 2025 report from the US State Department, Cambodia’s government “frequently downplayed scam operation cases as labor disputes,” never arresting or prosecuting any owner or operator of a suspected scam compound. The Cambodian operations are just some of many across parts of Southeast Asia, where compounds are alleged sources of forced labor.
Related: UK sanctions $20B scam market by cutting ‘legitimate’ crypto ties
The passage of the bill followed UK authorities sanctioning the operators of a Cambodia-based scam center, and the country extraditing to China the leader of a criminal syndicate with alleged tied to scam compounds. Cambodia’s national assembly advanced the bill on March 30, with all 112 members voting yay.
What happens in these scam compounds?
According to a 2024 UN News report that explored a compound in the Philippines, scam centers like the ones targeted under the Cambodian bill were massive undertakings, with facilities designed so that the residents would never need to leave. Although many of the workers were responsible for carrying out the scams, they were also “trafficked here, held against their will” and “exposed to violence” in the compounds.
“The people who work here are basically fenced off from the outside world,” said the report. “All their daily necessities are met. There are restaurants, dormitories, barbershops and even a karaoke bar. So, people don’t actually have to leave and can stay here for months.”
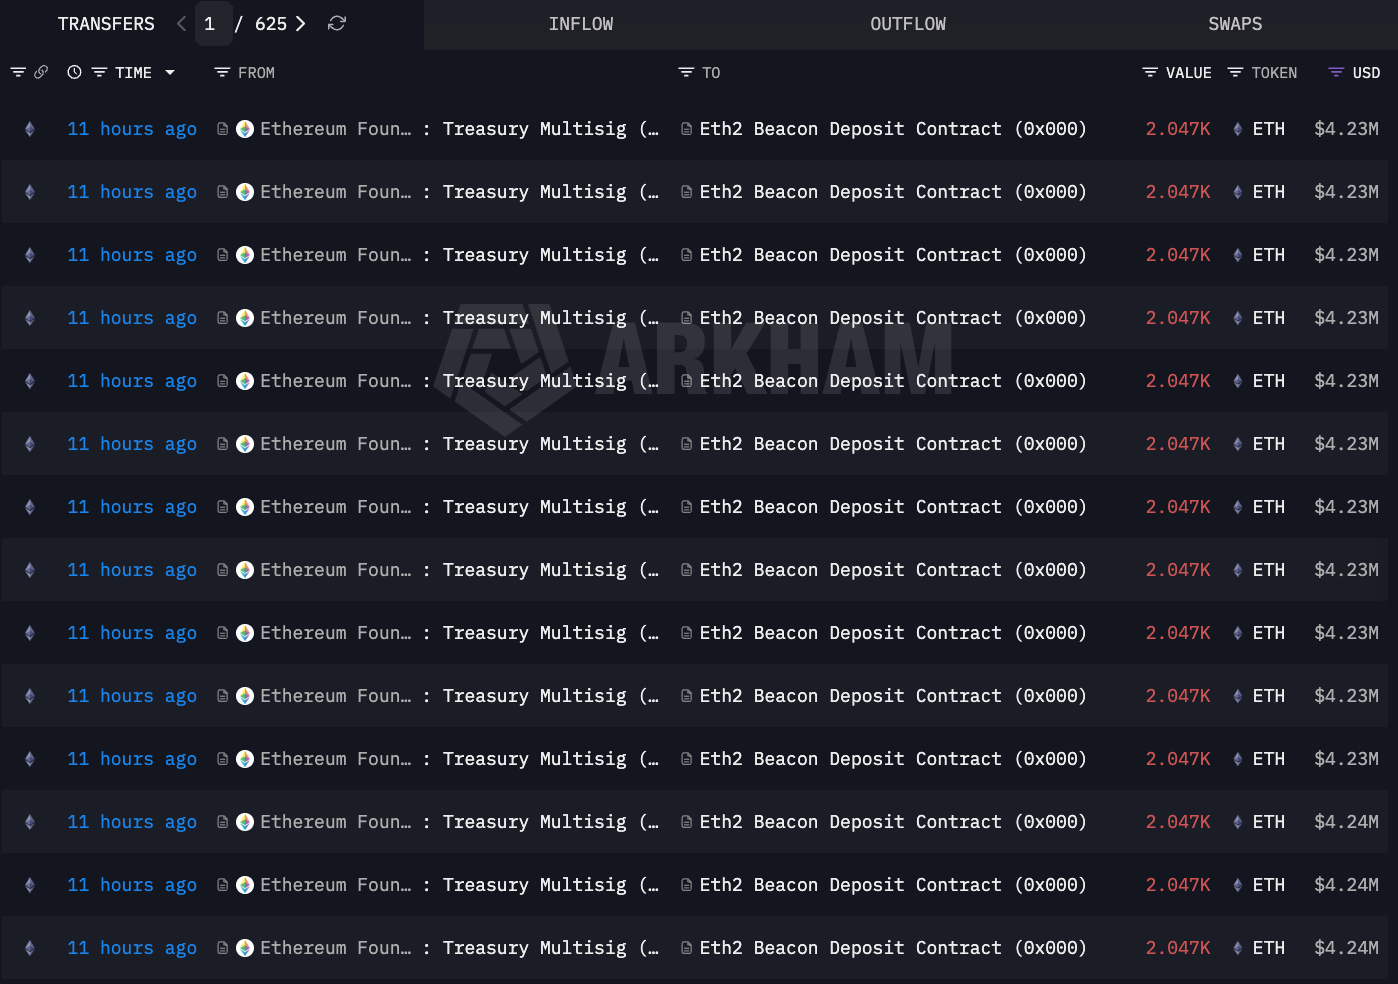
The Ethereum Foundation (EF), the non-profit organization that steers development of the Ethereum ecosystem, staked over 45,000 Ether (ETH) on Friday, bringing the total amount staked to about 69,500 ETH, less than 500 coins shy of the Foundation’s 70,000 goal.
The EF staked the coins in a series of transactions, each consisting of 2,047 ETH, with the total amount staked on Friday valued at over $92.2 million, according to data from Arkham Intelligence.

The EF began staking ETH in February as part of its revamped treasury strategy policy announced in June 2025 and will use the yield generated to fund protocol research, development and ecosystem grants. The EF said in its updated treasury policy:
“We are now increasingly moving into staking and DeFi, both to enhance financial sustainability and to support a key application category that is delivering on the promise of permissionless, secure access to base civilizational infrastructure for millions of people today.”
The foundation staked 2,016 ETH, valued at about $4.1 million in February, followed by 22,517 ETH, valued at about $46.1 million, in March. The EF has locked over $143 million in ETH in the Ethereum Beacon Deposit Contract, according to Arkham Intelligence.

The adoption of a yield-bearing treasury strategy followed pressure from the Ethereum community on the EF to generate income from its treasury to cover expenses, rather than continually selling tokens to fund operations.
Related: Ethereum Foundation sells $10.2M worth of ETH to BitMine in OTC deal
Vitalik Buterin warns EF staking may force positions in hard forks
Validators, who lock up tokens to secure proof-of-stake (PoS) blockchain networks, can influence which chain is valid in the event of a network hardfork, or a partition of a network into two competing chains.
“If EF stakes, ourselves, this de facto forces us to take a position on any future contentious hard fork,” Ethereum co-founder Vitalik Buterin said in January 2025.
The EF is exploring ways to mitigate the centralization risks posed by its staking activities in the event of a contentious hard fork, Buterin added.
Magazine: Ethereum’s Fusaka fork explained for dummies: What the hell is PeerDAS?
Crypto World
Best Crypto to Buy Now: Pepeto Raises Above $8.1M as Investors Look Past BTC and XRP During the Correction

Bithumb, South Korea’s second largest exchange, just postponed its IPO by two years after compliance fines, proving the industry is building for a longer timeline than this correction suggests. The correction is temporary, but the infrastructure underneath is permanent.
The best crypto to buy now is not the asset that needs billions to move 15%, it is the entry where the listing compresses the return into one day. Pepeto has raised above $8.1 million with live tools and a confirmed Binance listing.
Bithumb delayed its planned public offering by at least two years after fines and compliance issues, according to CoinGecko. The postponement confirms the infrastructure buildout will outlast the fear, as CoinDesk noted.
For the best crypto to buy now conversation, the correction is a pause in a longer story, and the entries positioned before the next chapter collect the most.
Best Crypto to Buy Now in 2026: Pepeto, BTC, and XRP
Pepeto
The correction has large cap holders watching BTC grind sideways, but the wallets searching for the best crypto to buy now already found the answer. Pepeto runs a zero fee swap engine that eliminates cost from every trade, and a cross chain bridge that connects networks so tokens move freely. These tools are live, which means every wallet using them interacts with a finished product at a price the Binance listing erases permanently, and that gap between presale pricing and listing day is where every dollar of real return lives.
The wallet behind the original Pepe project is part of the build alongside a former Binance expert, and the SolidProof audit confirmed the contract. The presale has collected above $8.1 million at $0.000000186 while the Fear and Greed Index sat at 9, and a $50,000 position earning 189% APY through staking returns roughly $98,000 in one year before the listing multiplier adds on top.

The correction will pass, the recovery will arrive, and the presale price will be gone, which means every day without a position is a day the reader’s money misses returns that the wallets already inside are set to collect.
The market always recovers, and the entries that turn corrections into wealth have tools working before the recovery starts. The Binance listing closes this window, and the presale counter ticks toward zero while the reader decides whether their money enters at presale pricing or pays whatever the open market charges after listing day rewrites the price.
BTC Holds $66,927 as Institutional Capital Builds Slowly
Bitcoin trades near $66,927 with dominance at 56.2%, according to CoinMarketCap. Institutional inflows are rebuilding, confirming the recovery forms underneath the fear.
Analysts target $72,000, but BTC needs billions more just to move 15%, math designed for pension funds. The best crypto to buy now for real returns is the entry where one listing delivers what BTC takes a quarter to produce.
XRP Holds $1.32 as CLARITY Act Approaches
XRP trades near $1.32 with support at $1.30 and resistance at $1.35, according to CoinGecko. The CLARITY Act reaching the Senate by mid April could shift sentiment.
The bullish case targets $2.00, a credible 50% gain, but that return takes months and depends on macro conditions the best crypto to buy now at presale pricing does not need.
The Bottom Line
Bithumb postponing its IPO proves the industry is building for a timeline far longer than this correction, and the recovery forming beneath the fear is going to reward the entries positioned before it arrives. BTC needs billions to move 15% and XRP targets $2.00 over months, but neither offers the presale pricing that a Binance listing transforms overnight.
Above $8.1 million committed during fear is the proof, and the Pepeto official website still shows the figure that listing day erases. The reader searched for the best crypto to buy now and the answer led them here, because early wallets acted before the crowd had reason to look, and the reader’s money right now sits at presale pricing with a working exchange behind it, which is how every early fortune in crypto started.
Click To Visit Pepeto Website To Enter The Presale

FAQs
What is the best crypto to buy now during the correction?
Pepeto leads with above $8.1 million raised, live exchange tools, and a confirmed Binance listing. The correction is temporary and the presale price ends when the listing opens.
Why are large caps not the best crypto to buy now for returns?
BTC needs billions to move 15% and XRP targets 50% over months. The best crypto to buy now at presale pricing delivers the listing return from one event the Pepeto official website still shows.
Will the market recover from this correction?
Institutional infrastructure is expanding, exchanges are building for decades, and capital inflows are rebuilding. The correction is a pause, and the entries positioned before the recovery collect the most.
Disclaimer: This is a Press Release provided by a third party who is responsible for the content. Please conduct your own research before taking any action based on the content.


Coinbase has received conditional approval from the Office of the Comptroller of the Currency for a national trust bank charter — a first for any major U.S. crypto exchange — as community banking groups wasted no time calling the decision a grave mistake.
Summary
- Coinbase has received conditional approval from the Office of the Comptroller of the Currency for a national trust bank charter, the company confirmed on April 2.
- The approval positions Coinbase to offer federally regulated digital asset custody services nationwide under a single federal license.
- Community banking groups have pushed back sharply, with the Independent Community Bankers of America calling the OCC’s direction a “grave mistake.”
Coinbase has received conditional approval from the Office of the Comptroller of the Currency for a national trust bank charter, making it the first major U.S. crypto exchange to clear this specific federal regulatory hurdle. The company confirmed the approval through an April 2 blog post authored by Greg Tusar, Co-CEO of Coinbase Institutional, following a Bloomberg report that first broke the news.
The conditional charter would allow Coinbase to operate a national trust bank focused on digital asset custody and related settlement services. The entity will not accept retail deposits or issue traditional loans — its scope mirrors the structures already granted to Ripple, Circle, Paxos, and BitGo, which received their initial OCC approvals in December 2025. For Coinbase, the practical outcome is significant: a federal trust charter replaces a patchwork of state-level licenses with a single, nationwide regulatory status. It also positions the exchange directly inside the stablecoin custody and settlement infrastructure being built under the GENIUS Act.
Coinbase Chief Legal Officer Paul Grewal confirmed the news on X, writing: “Consistent rules and regulatory trust are what allow us to innovate with confidence. Today’s conditional @USOCC approval is yet more proof that our approach is working.”
The banking backlash
The approval has not been well received by traditional financial institutions. The Independent Community Bankers of America, which represents thousands of small lenders, described the OCC’s direction as a “grave mistake” in remarks reported by American Banker. The ICBA has repeatedly urged the OCC to pull or revise its crypto charter framework, arguing that digital asset firms are accessing bank-like federal status under lighter regulatory conditions than traditional banks face.
The Bank Policy Institute has gone further, weighing potential legal action against the OCC over what it describes as an improper reinterpretation of federal licensing rules — a possible lawsuit that could delay or complicate final approval for Coinbase and others in the pipeline.
Institutional and market context
Coinbase’s conditional charter comes as the exchange is already embedded in U.S. institutional crypto infrastructure, serving as custodian for multiple spot Bitcoin and Ethereum ETFs. Full OCC authorization will require meeting operational, governance, and capital thresholds — the same conditions applied to earlier approvals before they became final. Until then, the conditional status means the charter is approved in principle but not yet operational.
Crypto World
Figure Technology Solutions (FIGR) Stock Surges on Record Q1 Loan Growth and Token Adoption

Key Takeaways
-
FIGR shares advance 4.93% following 113% annual increase in Q1 lending volume
-
Monthly loan activity reaches $1.19B in March, demonstrating accelerating momentum
-
YLDS token circulation expands to $598M, indicating growing platform adoption
-
Available capital from lenders increases 14% as liquidity deepens
-
Democratized Prime data reveals synchronized expansion across borrowers and lenders
Shares of Figure Technology Solutions (FIGR) finished regular trading at $34.51, posting a 4.93% gain following a robust intraday surge and subsequent stabilization. During extended hours, the stock retreated modestly to $34.44, representing a 0.20% decline. The upward movement came after the company disclosed preliminary operating results for March and the first quarter of 2026, revealing substantial growth across multiple business segments.
Figure Technology Solutions, Inc. Class A Common Stock, FIGR
Lending Platform Volumes Reach New Heights
Figure Technology disclosed impressive performance in its consumer lending marketplace throughout March 2026. The blockchain-powered platform facilitated $1.19 billion in transactions, representing a 33% sequential gain from February activity. Year-over-year comparisons proved even more dramatic, with volumes doubling from March 2025 levels at a 102% growth rate.
First quarter results demonstrated ongoing momentum, with total platform volume hitting $2.9 billion. This figure exceeded the previous quarter by 7% while soaring 113% compared to the same period last year. The data underscores accelerating demand for distributed ledger-based credit origination and secondary market trading capabilities.
The organization maintains its marketplace operations as a primary revenue generator, offering home equity lines of credit, debt service coverage ratio mortgages, and unsecured consumer loans. Transaction activity through Figure Connect bolstered overall platform engagement. The expanding scope demonstrates the company’s increasing influence within tokenized lending markets.
YLDS Token Achieves Significant Milestone
Figure announced impressive progress for its YLDS offering, which debuted in February 2025. Outstanding tokens reached a valuation of $598 million during March 2026, advancing 2% from the prior month. The metric represents a dramatic escalation from the mere $3 million circulating during March 2025.
First quarter comparisons unveiled even stronger momentum, with YLDS circulation soaring 83% above fourth quarter 2025 levels. This trajectory indicates accelerating acceptance of tokenized credit instruments throughout the platform ecosystem. Furthermore, the expansion reflects increasing confidence in blockchain-enabled financial products among marketplace participants.
The firm characterizes YLDS as unsecured digital certificates collateralized by its affiliated entity’s asset portfolio. Consequently, the instrument enhances liquidity and capital formation across its lending infrastructure. The swift uptake aligns strategically with the organization’s comprehensive asset tokenization initiatives.
Democratized Prime Platform Records Symmetric Expansion
Figure’s Democratized Prime offering maintained consistent matched transaction levels throughout March 2026. The outstanding balance totaled $368 million, remaining relatively flat versus February figures. Borrower appetite edged higher to $376 million, demonstrating persistent credit demand.
Lender capital availability climbed to $453 million during March, posting a 14% monthly gain. This increase suggests enhanced funding capacity within the platform’s liquidity pools. The system maintains equilibrium between available capital and borrower requirements.
Quarterly comparisons revealed substantial acceleration across all measurements, including a 79% expansion in matched transaction balances. Borrower demand advanced 53%, while lender capital surged 112% compared to the final quarter of 2025. These metrics underscore broadening participation and strengthening liquidity throughout the platform architecture.

President Trump has fired Pam Bondi and replaced her with Todd Blanche as interim U.S. Attorney General — handing control of the Justice Department to the official who dismantled the DOJ’s crypto enforcement unit in April 2025 and holds up to $485,000 in personal digital asset holdings.
Summary
- President Trump has replaced Attorney General Pam Bondi with Todd Blanche, the DOJ official who disbanded the National Cryptocurrency Enforcement Team in April 2025.
- Blanche, now acting AG, holds up to $485,000 in personal crypto holdings and authored the memo ending the DOJ’s regulation-by-prosecution approach to digital assets.
- The appointment hands the Justice Department’s leadership to one of the most crypto-friendly figures in U.S. federal law enforcement history.
President Trump has fired Pam Bondi and replaced her with Todd Blanche as interim U.S. Attorney General — handing control of the Justice Department to the official who dismantled the DOJ’s crypto enforcement unit in April 2025 and holds up to $485,000 in personal digital asset holdings.
Bondi confirmed her departure in an April 2 post on X, writing that she would be “working tirelessly to transition the office of Attorney General to the amazing Todd Blanche” before moving to an unspecified private sector role. NBC News confirmed that Bondi was fired following growing frustration from the president over her handling of key priorities.
Blanche is not a new name in the digital asset industry. As Deputy Attorney General, he authored the April 2025 memo that formally disbanded the National Cryptocurrency Enforcement Team, declaring in plain language that the DOJ “is not a digital assets regulator” and criticizing the prior administration’s approach as a “reckless strategy of regulation by prosecution.”
The memo directed prosecutors to stop pursuing cases against crypto exchanges, mixers, and offline wallets for end-user behavior, shifting enforcement focus to individuals directly defrauding investors. The decision triggered a swift backlash from Democratic lawmakers, who argued it opened the door to sanctions evasion, drug trafficking, and large-scale financial fraud.
Blanche also holds reported personal crypto exposure of up to $485,000 — a detail that will almost certainly draw scrutiny from Congress as he leads the nation’s top law enforcement agency.
What changes at the DOJ
Blanche’s elevation to acting AG signals continuity — and likely intensification — of the DOJ’s current posture toward digital asset enforcement. The NCET, which handled major crypto fraud cases and supported cross-border law enforcement coordination, remains disbanded. Its closure, combined with the prior directive to deprioritize structural crypto enforcement, has already reshaped how federal prosecutors approach the space.
With Blanche now at the top, those policy choices become structurally harder to reverse regardless of who eventually takes the permanent AG role. Trump announced the change via Truth Social, describing Blanche as a “very talented and respected Legal Mind.” The White House has not yet specified a timeline for a permanent nomination, with EPA Administrator Lee Zeldin reportedly under consideration.


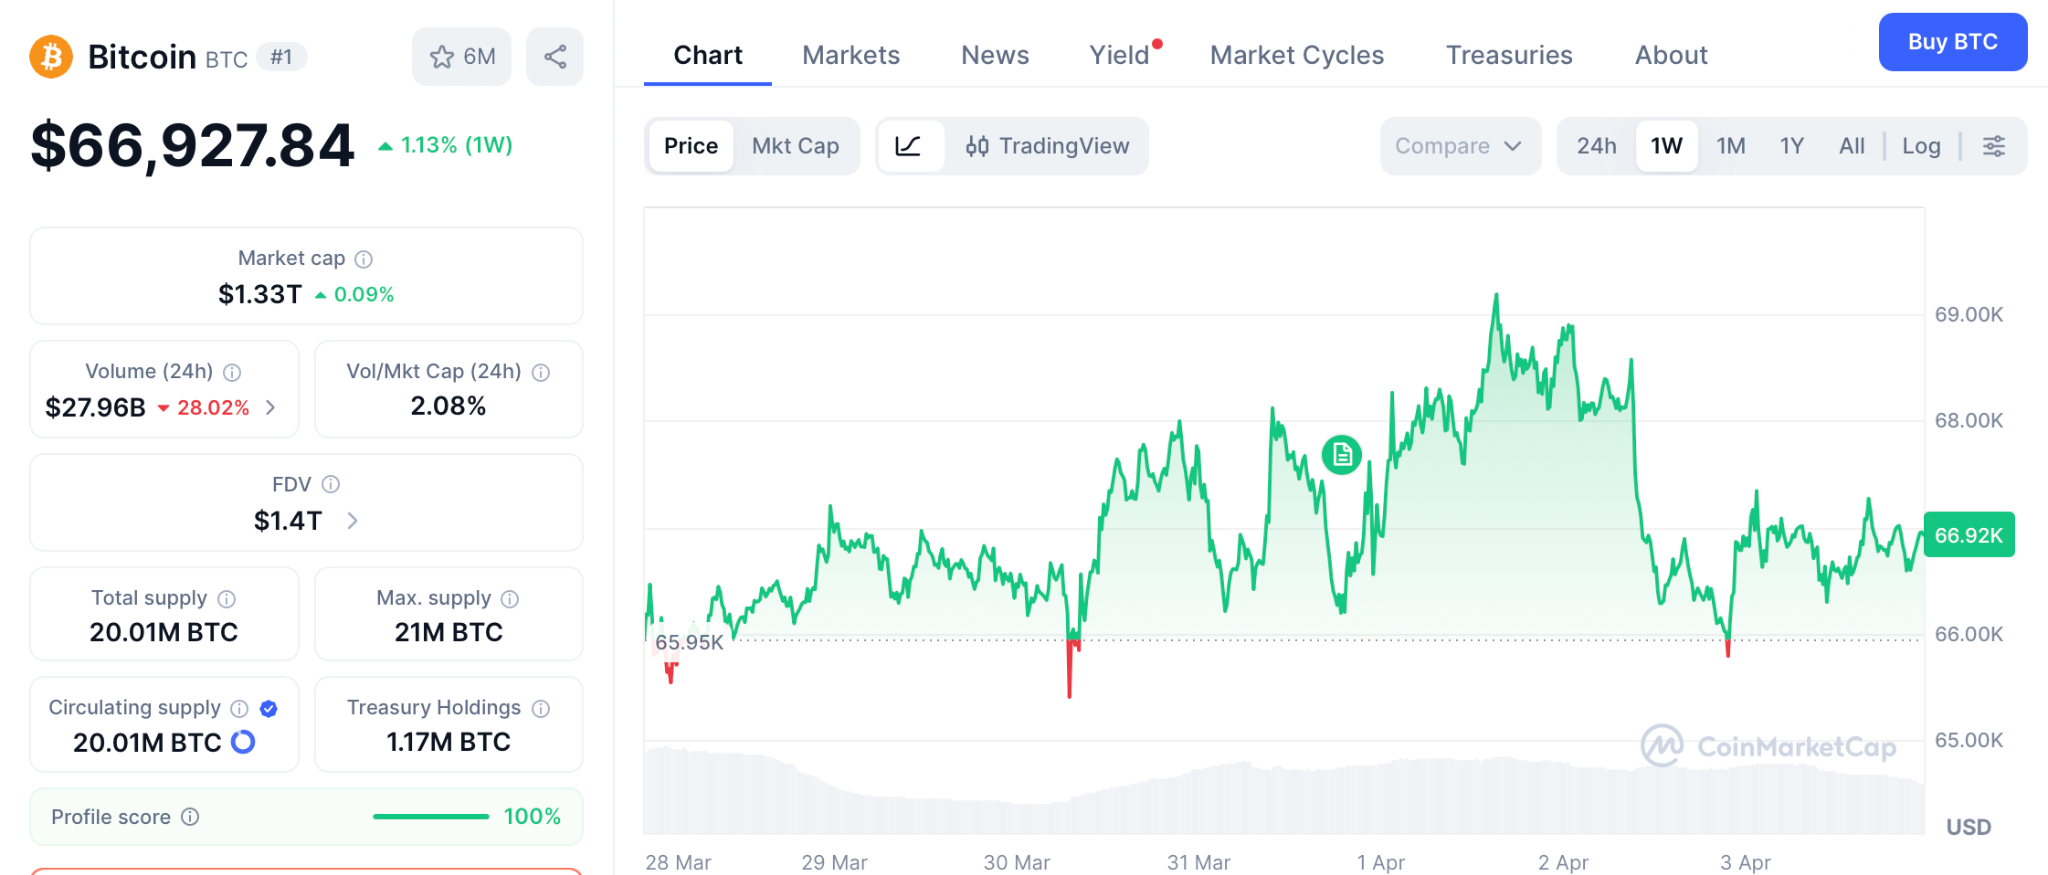
A U.S. fighter jet identified as an F-15 was shot down over Iran on April 3, with one crew member rescued and President Trump briefed, adding a sharp new layer of escalation to a conflict that has already pushed Bitcoin down more than 40% from its October 2025 all-time high.
Summary
- A US fighter jet, identified by CNN analysis as an F-15, was shot down over Iran on April 3, with one crew member rescued, according to sources cited by CNN.
- The White House confirmed President Trump has been briefed, and Trump posted on X referencing reopening the Strait of Hormuz “with a little more time.”
- Bitcoin, already trading near $67,000 amid weeks of war-driven pressure, faces renewed downside risk as oil markets prepare to price in the latest escalation.
A U.S. fighter jet identified as an F-15 was shot down over Iran on April 3, with one crew member rescued and President Trump briefed, adding a sharp new layer of escalation to a conflict that has already pushed Bitcoin (BTC) down more than 40% from its October 2025 all-time high. Iranian state media published images of the downed aircraft, which CNN analysis matched to an F-15. The White House press secretary confirmed that “President Trump has been briefed,” with live coverage updated at 1:12 p.m. EDT.
Bitcoin was trading near $67,000 at the time of writing, down modestly on the day. The downed aircraft adds a new variable to an already fragile macro backdrop. As crypto.news has tracked, Bitcoin has repeatedly tested the $65,000–$67,000 range as a support zone during periods of heightened U.S.–Iran tension, with sharper downside reserved for moments of genuine escalation — the initial U.S. strikes sent BTC briefly to $63,000 before markets stabilized.
The incident lands on Good Friday, with traditional U.S. equity markets closed for the Easter holiday. Oil, already trading above $100 per barrel amid the ongoing Strait of Hormuz closure, could spike sharply when Asian markets open overnight. A sustained move higher in oil would intensify inflation concerns and further reduce the Federal Reserve’s room to cut rates — a combination that has been the dominant headwind for crypto since the conflict began.
Trump’s Hormuz signal
In a separate post on X, Trump suggested the Strait of Hormuz could be reopened “with a little more time” — a statement investors read as leaving space for a negotiated resolution even as military operations continue. As crypto.news reported on April 2, Trump had addressed the nation from the White House describing U.S. forces as nearing the “final stages” of the campaign while warning of continued strikes over the following weeks. The contradiction between active military pressure and diplomatic signaling has kept markets in an uncertain holding pattern. For Bitcoin, any credible de-escalation — particularly one that restores Hormuz shipping and brings oil back below $100 — represents the single most significant potential catalyst for a sustained recovery from the current range.
Crypto World
BTC USD Price Hanging in The Balance: What is Quantum Computer, and Can Bitcoin Survive it?

BTC USD is hovering at the $66,000 – $67,000 price level, caught between a critical support floor and a quantum threat. The question isn’t just whether BTC can hold $66,000. It’s whether Bitcoin’s underlying cryptography survives the next decade of computing power. One risk is measured in weeks. The other, potentially in years. Both are moving faster than the market expects.
Quantum computing, the use of quantum mechanical phenomena to process information exponentially faster than classical computers, has shifted from theoretical threat to active development timeline. Google’s quantum milestones and competing programs from IBM and state-backed labs have reignited debate over Bitcoin’s SHA-256 hashing and elliptic curve cryptography (ECDSA), the two pillars securing every wallet and transaction on the network.
— BSCN (@BSCNews) March 31, 2026
 BREAKING: GOOGLE WARNS 6.9M BITCOIN WILL BE VULNERABLE WHEN QUANTUM COMPUTERS BECOME POWERFUL ENOUGH
A new Google Quantum AI whitepaper has identified approximately 6.9 million Bitcoin $BTC vulnerable to future quantum at-rest attacks.
Around 1.7 million BTC sits in old… pic.twitter.com/pCwKrhXL4e
Analysis of Google’s quantum paper found the crypto sector broadly underestimates the asymmetric risk. A sufficiently powerful quantum machine could, in theory, derive private keys from public addresses, rendering cold storage irrelevant. Bitcoin Core developers have acknowledged the long-term threat, with post-quantum cryptography upgrades discussed but no consensus timeline confirmed.
For now, BTC USD price action is the more immediate variable. Support at $66,000 is the line we should be watching.
Discover: The best pre-launch token sales
Can BTC USD Price Recover Above $78,000, Or Is $50,000 the Next Target?
Bitcoin is sitting at $66,800–$67,000, effectively range-bound with no decisive momentum in either direction. Volume has compressed, a pattern that historically precedes either a sharp breakdown or a relief rally, rarely a slow grind higher.
The $66,000 level is load-bearing. Analysts flagged it as primary support, with a confirmed close below opening a path toward $50,000, or a 25% drawdown from current levels. On the upside, resistance clusters between $78,000 and $87,000 based on multiple technical models.
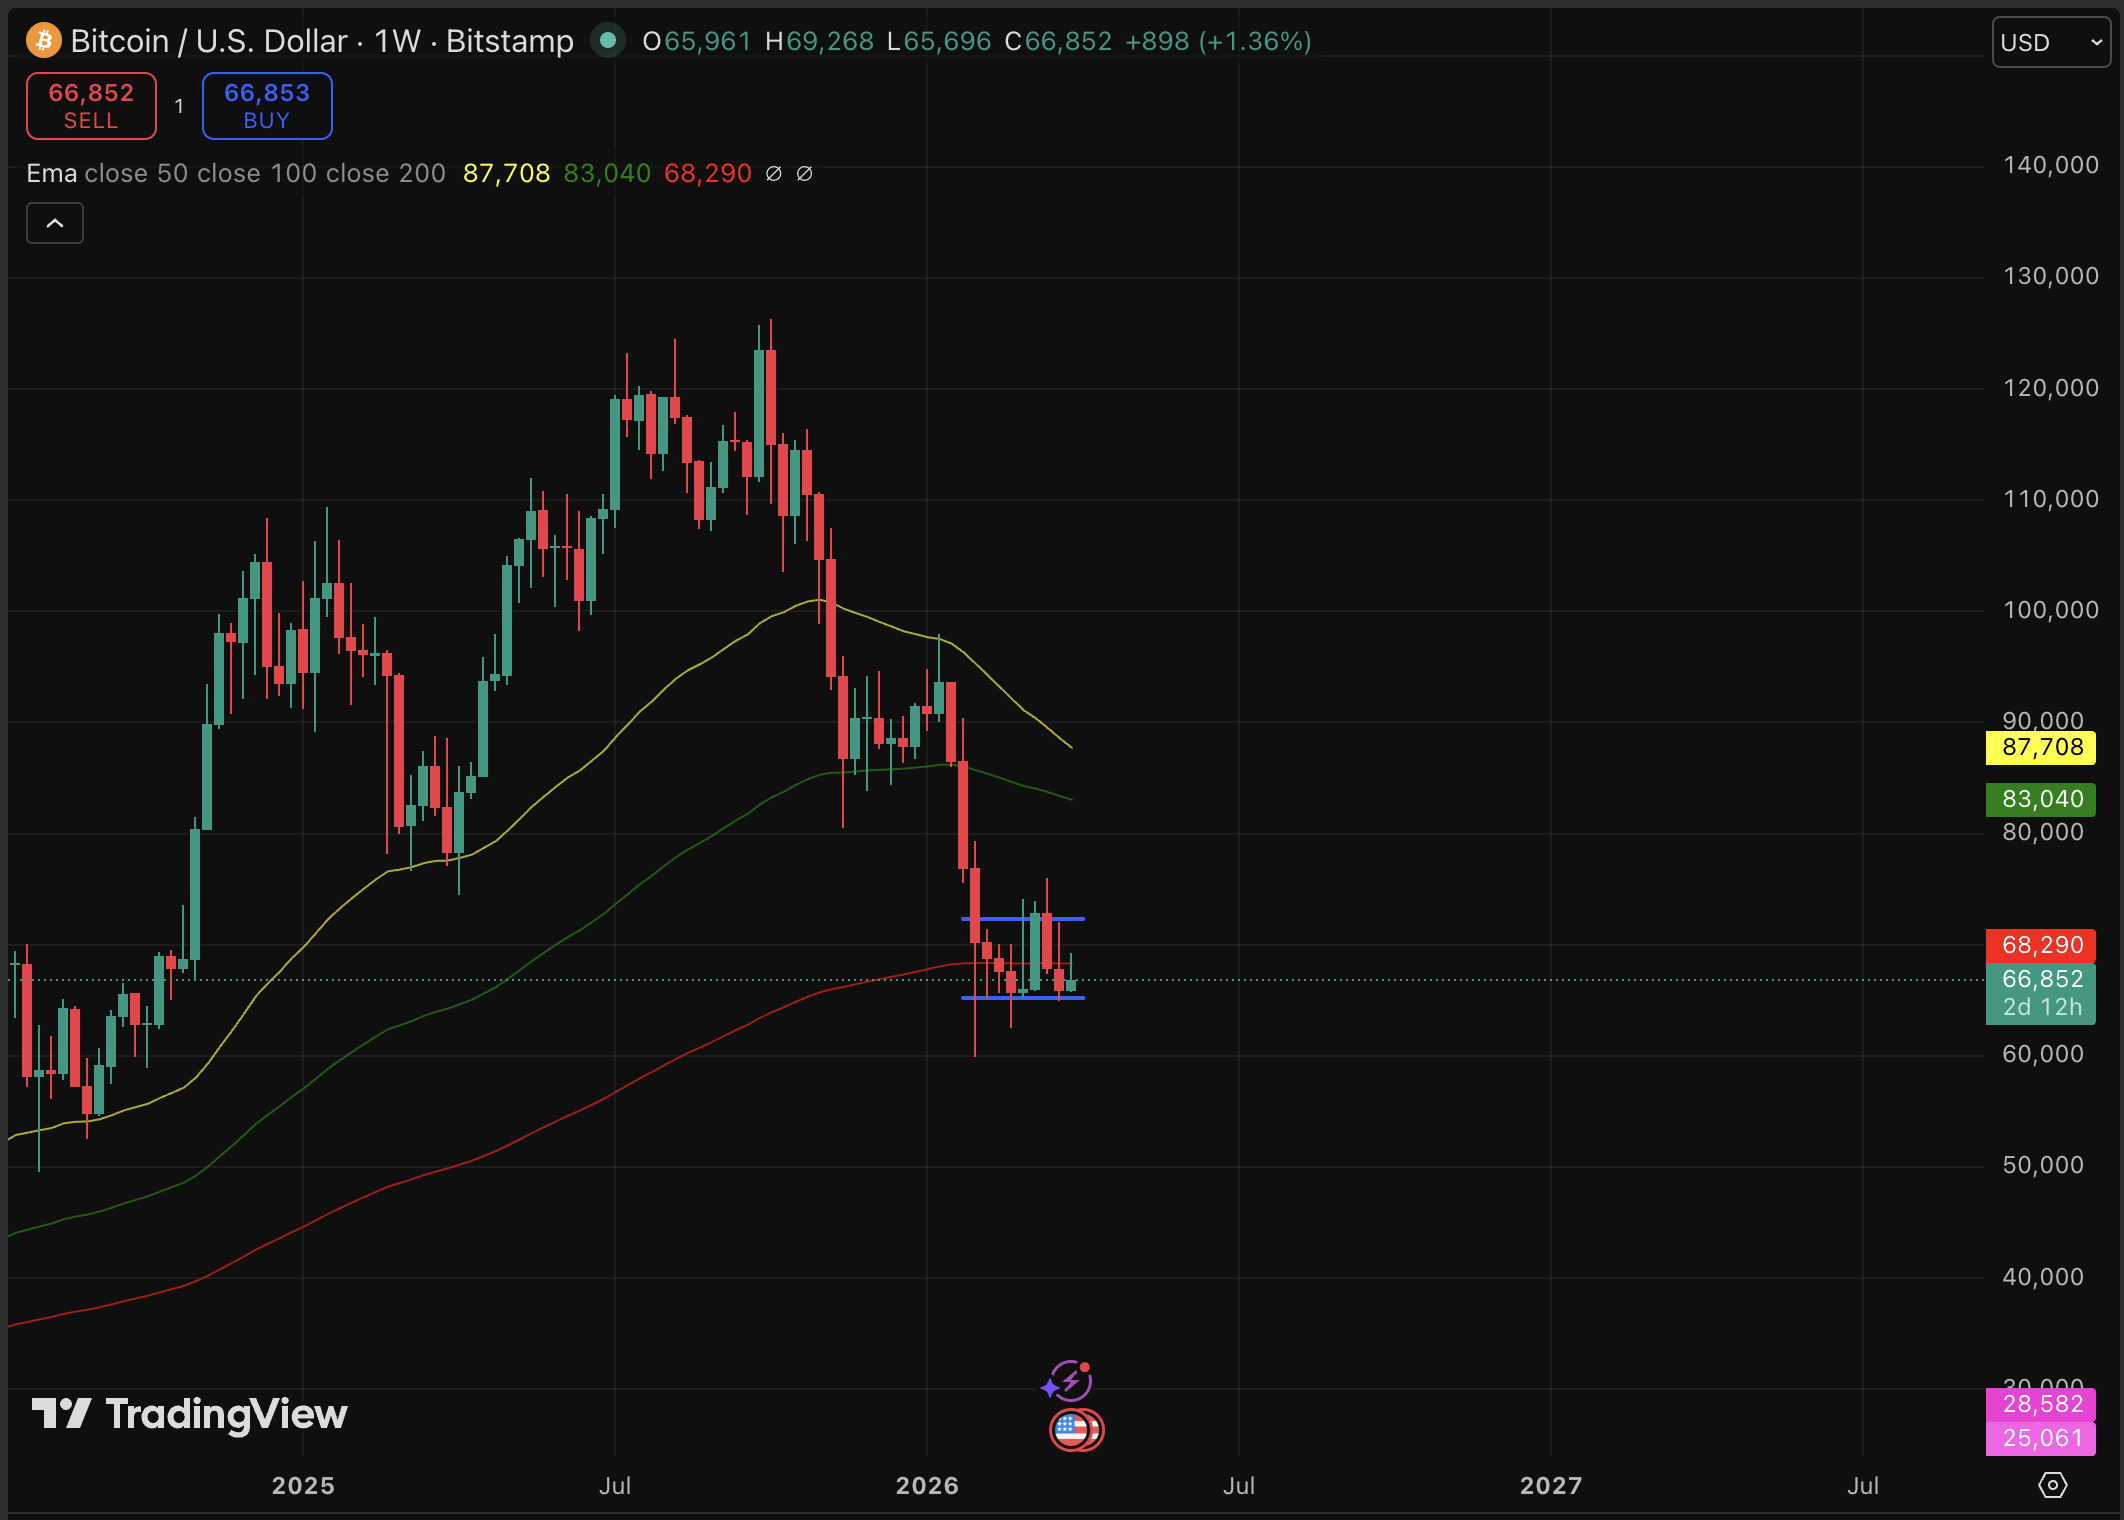
BTC could always hold $66,000, reclaims $70,000 on volume, and momentum builds toward the $78,000 resistance zone ahead of Q2 macro catalysts. But a consolidation between $64,000–$70,000 through April, with direction determined by macro risk appetite and ETF flow data, could also be in play.
For bear, though, a daily close below $66,000 with elevated selling volume targets $58,000–$50,000 — invalidating the near-term recovery thesis entirely is on the wishlist.
Changelly’s April model prices in a potential peak near $78,020, suggesting the bull isn’t unreasonable, but it requires clean price action from here. The quantum threat adds a longer-term overhang that institutional allocators are quietly beginning to model into risk frameworks.
Discover: The best crypto to diversify your portfolio with
Bitcoin Hyper Targets Early Mover Upside as Bitcoin Tests Key Levels
BTC at $66,739 offers upside, but analyst consensus caps the near-term move at roughly 20% toward $80,000. For traders who’ve already been through the cycle, that’s a reasonable hold. For fresh capital seeking asymmetric exposure, it’s a different calculation entirely.
Bitcoin Hyper is positioning directly at the intersection of Bitcoin’s structural limitations and its quantum-era upgrade needs. The project bills itself as the first-ever Bitcoin Layer 2 with Solana Virtual Machine (SVM) integration, delivering sub-second finality and smart contract capabilities while anchored to Bitcoin’s security model.
The pitch is essentially: Bitcoin’s trust, Solana’s speed, without choosing between them. Addressing Bitcoin’s core bottlenecks, such as slow transactions, high fees, and zero native programmability, is the core use case. The quantum debate only reinforces the argument that Bitcoin’s infrastructure needs to evolve.
The presale has raised $32,262,965.45 at a current price of $0.013678, with high-APY staking available to early participants. Numbers at that raise level signal genuine demand — though presale projects carry significant execution risk and early pricing does not guarantee post-launch performance.
Traders researching the infrastructure angle can explore Bitcoin Hyper here.
The post BTC USD Price Hanging in The Balance: What is Quantum Computer, and Can Bitcoin Survive it? appeared first on Cryptonews.


X is preparing to automatically lock any crypto scam account that mentions cryptocurrency for the first time in its posting history, with Head of Product Nikita Bier saying the measure should eliminate 99% of the economic incentive behind the platform’s most persistent category of fraud.
Summary
- X Head of Product Nikita Bier confirmed on April 1 that the platform is implementing auto-locking and verification for any crypto scam account that posts about cryptocurrency for the first time in its history.
- The measure is designed to remove the economic incentive behind scam accounts that hijack or newly weaponize established profiles to promote fraudulent crypto schemes.
- Bier said the feature should kill 99% of the incentive, and also called out Google for failing to stop phishing emails at the inbox level.
X is preparing to automatically lock any crypto scam account that mentions cryptocurrency for the first time in its posting history, with Head of Product Nikita Bier saying the measure should eliminate 99% of the economic incentive behind the platform’s most persistent category of fraud. Bier confirmed the plan in an April 1 post on X replying to Benjamin White, founder of prediction market Predictfully, who publicly shared his account hack experience after a phishing email disguised as a copyright violation notice stole his credentials.
White’s experience is a textbook example of the attack pattern X is now targeting. His credentials were stolen through a fake login page that captured both his password and two-factor authentication code in real time. The hijacked account was then immediately redirected toward fraudulent crypto promotions — a sequence that has become standard practice among organized scam networks operating on the platform. “Yeah, we’re aware,” Bier wrote in reply. “We are in the process of implementing auto-locking + verification if a user posts about cryptocurrency for the first time in the history of their account. This should kill 99% of the incentive, especially since Google isn’t doing shit to stop the phishing.”
The scale of the problem
Crypto scams on X have intensified through 2026. In March, on-chain investigator ZachXBT traced a coordinated network of more than ten X accounts that used war-related panic posts to funnel users toward fraudulent crypto schemes, with on-chain evidence showing the cluster earned six figures from the campaign. Earlier in September 2025, X itself disclosed a bribery network in which scammers paid middlemen to reinstate suspended crypto fraud accounts, prompting legal action from the company.
How the feature works — and its limits
The auto-lock mechanism targets a specific and near-universal signature of scam activity: accounts with no prior history of crypto discussion suddenly posting promotional or transactional crypto content. By requiring verification before that first crypto post goes live, X introduces friction at the exact point where hijacked account abuse begins.
The feature does not appear to affect established accounts that already have a history of discussing crypto on the platform. Bier acknowledged that Google’s inaction on phishing emails remains a compounding vulnerability in the broader scam chain — one that X cannot fully control from its end alone.

AirPods Max 2 teardown reveals nothing has changed beyond the H2 chip

Kemi Badenoch talks ‘spring cleaning’ Reform defections

Samsung Now Lets You Control Your Smart Home Straight Using Your Car Infotainment


-

 NewsBeat1 day ago
Steven Gerrard disagrees with Gary Neville over ‘shock’ Chelsea and Arsenal claim | Football
-

 Sports7 days ago
Sweet Sixteen Game Thread: Tide vs Michigan
-
Entertainment4 days ago
Fans slam 'heartbreaking' Barbie Dream Fest convention debacle with 'cardboard cutout' experience
-

 Business22 hours ago
No Jackpot Winner and $194 Million Prize Rolls Over
-

 Crypto World2 days ago
Gold Price Prediction: Worst Month in 17 Years fo Save Haven Rock
-
 Entertainment6 days ago
Lana Del Rey Celebrates Her Husband’s 51st Birthday In New Post
-

 Tech5 days ago
The Pixel 10a doesn’t have a camera bump, and it’s great
-
Crypto World3 days ago
Dems press CFTC, ethics board on prediction-market insider trades
-

 Tech5 days ago
Avatar Legends: The Fighting Game comes out in July and it looks pretty slick
-

 Sports3 days ago
Tallest college basketball player ever, standing at 7-foot-9, entering transfer portal
-

 Tech4 days ago
EE TV is using AI to help you find something to watch
-

 Fashion6 days ago
Amazon Sundays: Soft Spring Layers
-

 Fashion3 hours ago
Weekend Open Thread: Spanx – Corporette.com
-

 Business2 days ago
Login and Checkout Issues Spark Merchant Frustration
-

 Fashion7 days ago
When Evening Dressing Gets Colorful for Spring
-

 Tech5 days ago
Elon Musk’s last co-founder reportedly leaves xAI
-

 Tech3 days ago
How to back up your iPhone & iPad to your Mac before something goes wrong
-

 Tech4 days ago
Apple will hide your email address from apps and websites, but not cops
-

 Politics4 days ago
Should Trump Be Scared Strait?
-

 Crypto World4 days ago
U.S. rule change may open trillions in 401(k) funds to crypto
You must be logged in to post a comment Login