
Crypto World
Cardano Price Drop Fails to Get Whale Nod
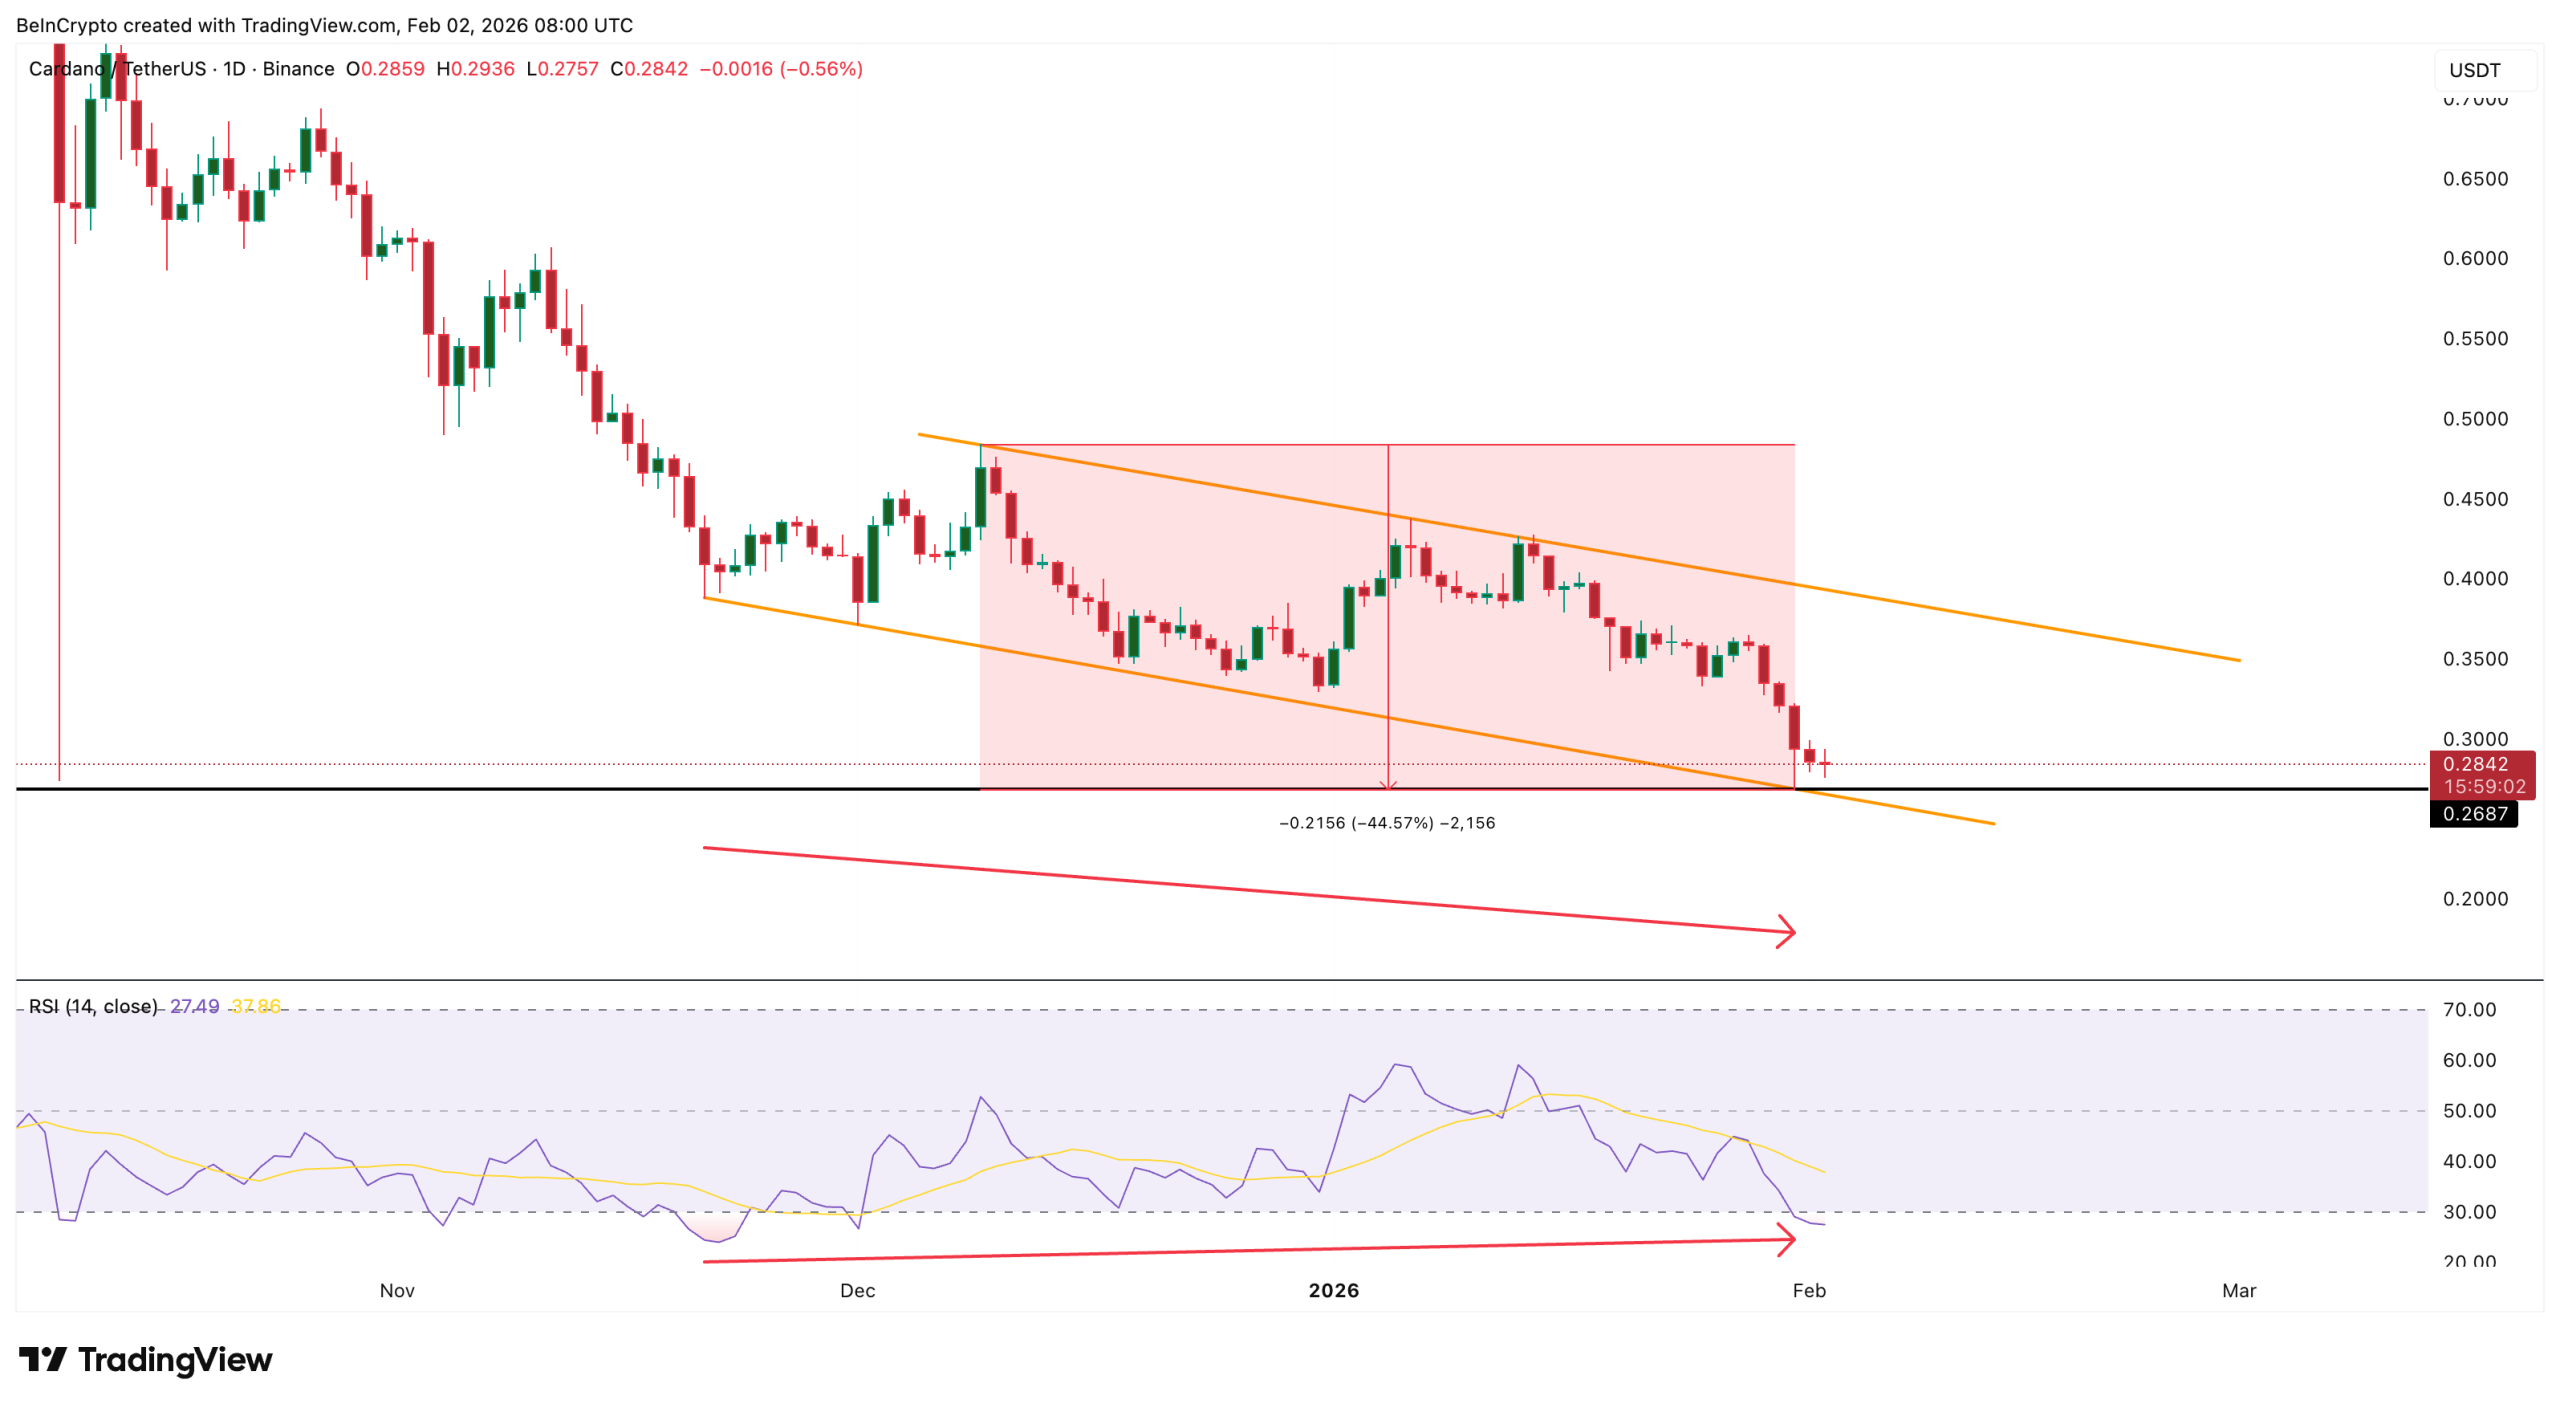
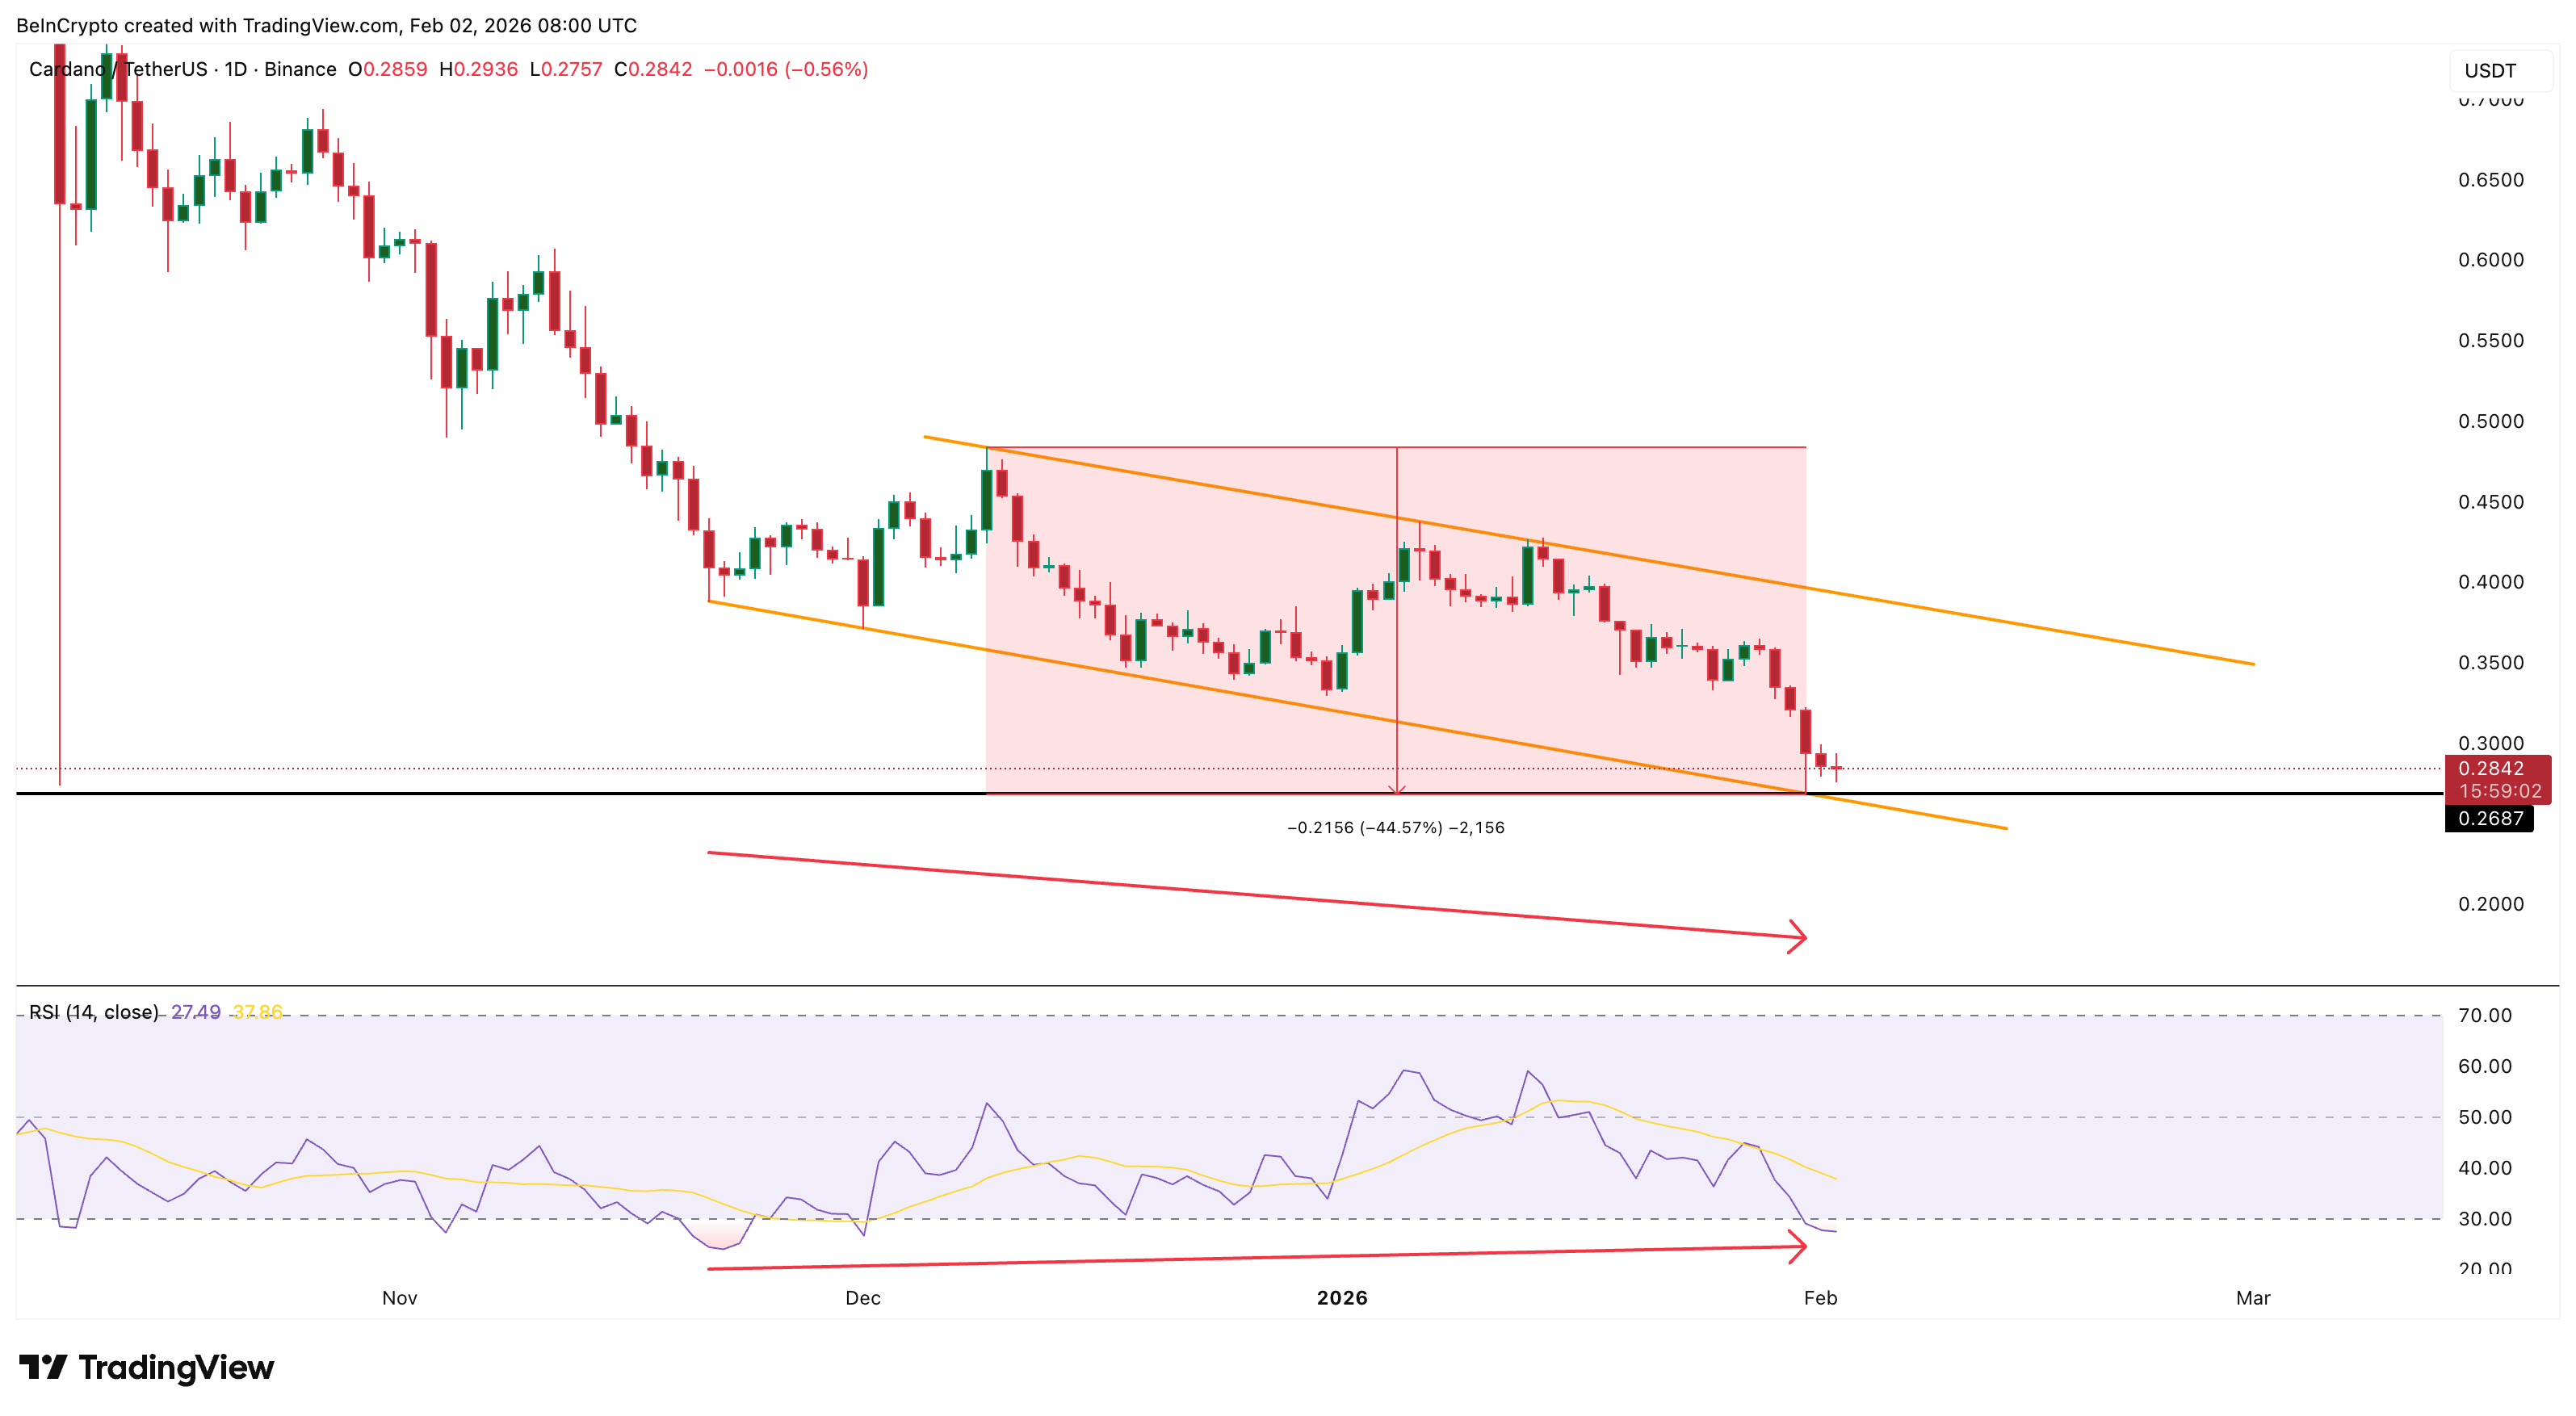
The Cardano price is trading at a deep discount. Since early December, the price has fallen nearly 45% and recently touched $0.26 before rebounding near $0.28. On paper, this looks like a strong buying zone.
The chart also shows early reversal signals. Retail traders are accumulating again. Yet large holders, known as whales, remain cautious. Despite the discount and improving indicators, buying lacks conviction. Three data points explain why.
Bullish Divergence Inside a Falling Channel Still Fails to Unite Whales
Technically, Cardano’s chart looks mixed.
Sponsored
Sponsored
Since November, ADA has been trading inside a falling channel, where the price makes lower highs and lower lows within parallel lines. This reflects a controlled downtrend, not panic selling, as the channel remains intact. Yet, the downside risk remains.
At the same time, momentum is improving.
Between November 21 and January 31, ADA formed a lower low. During the same period, the Relative Strength Index (RSI) made a higher low. RSI measures momentum on a 0–100 scale. When price falls, but RSI rises, it suggests selling pressure is weakening. This is known as a bullish divergence. This usually appears near early trend reversals.
Want more token insights like this? Sign up for Editor Harsh Notariya’s Daily Crypto Newsletter here.
However, whales are not responding in a unified way despite the reversal sign.
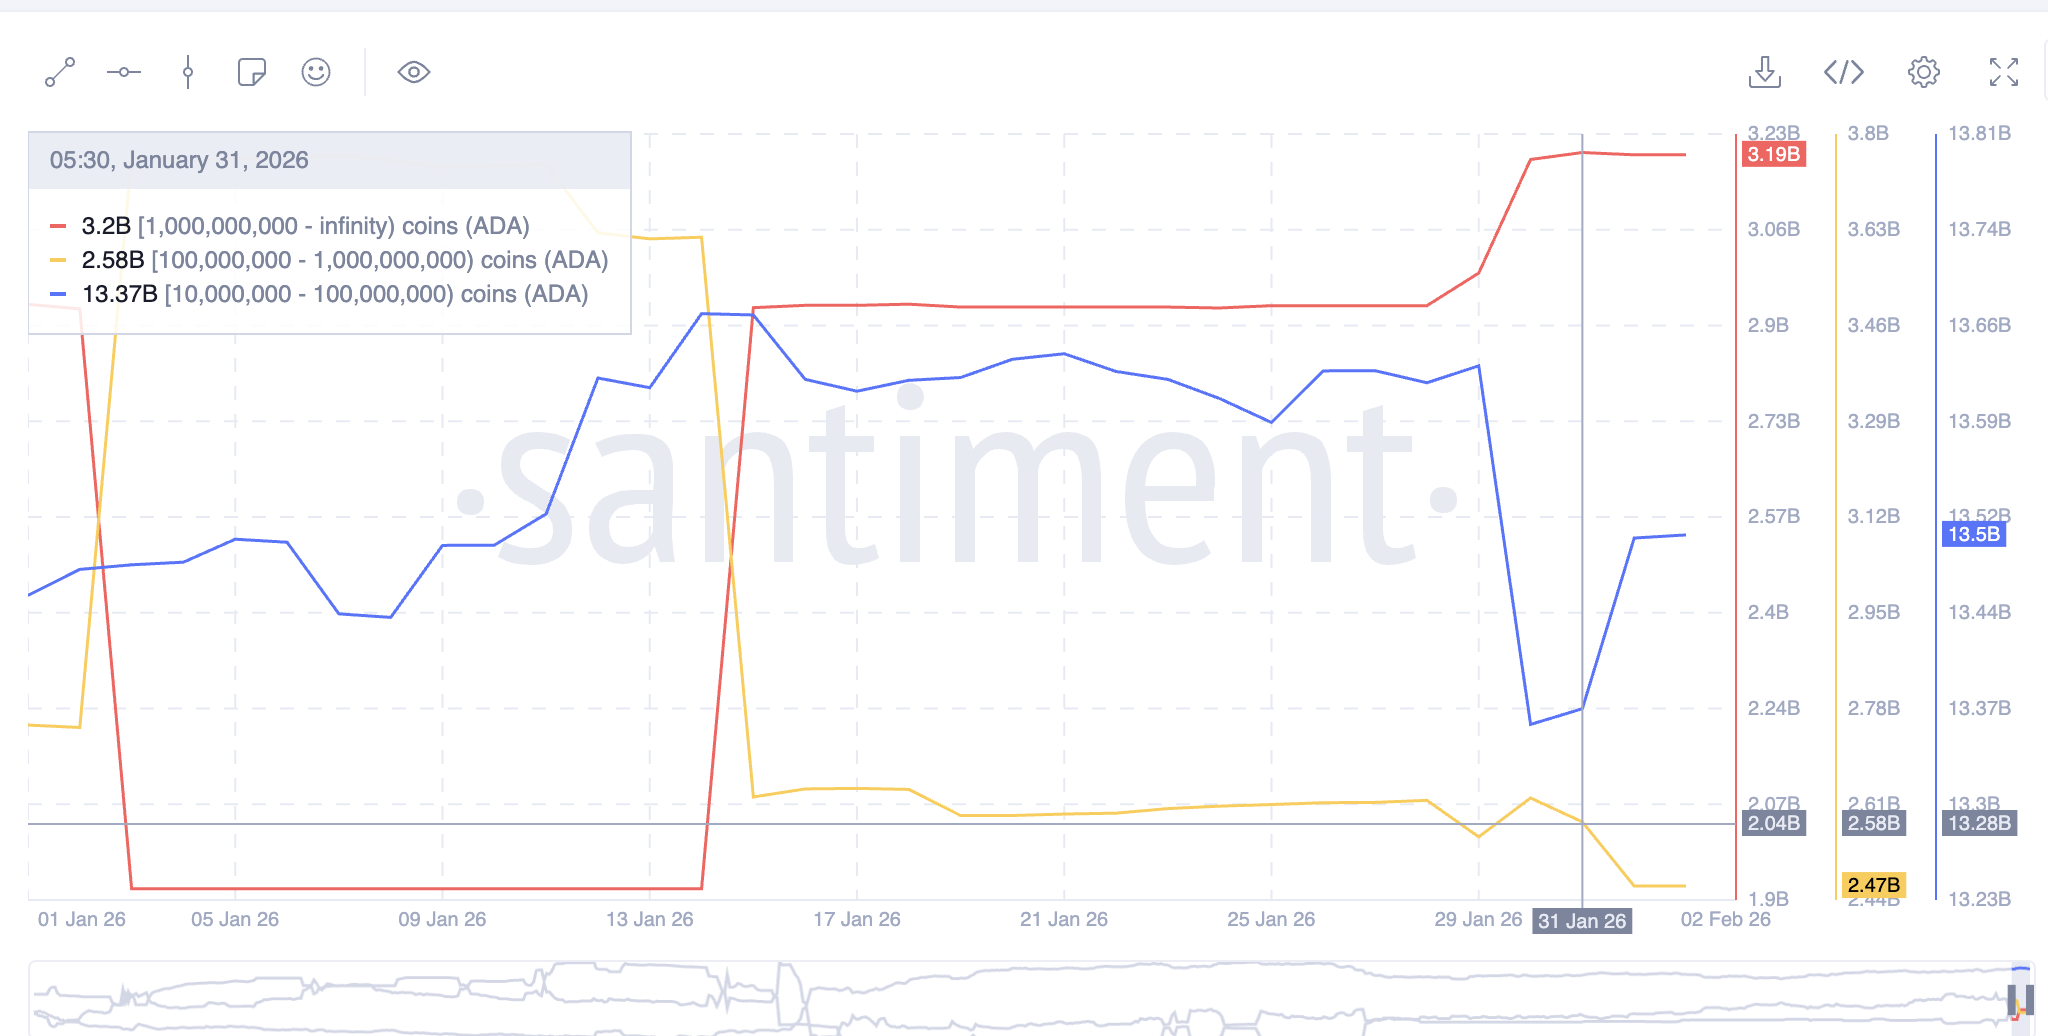
On-chain data shows three major wallet groups behaving differently:
- Wallets holding over 1 billion ADA increased holdings slightly after January 28, but nothing during the Jan-end dip.
- Wallets holding 100 million to 1 billion ADA reduced holdings from about 2.58 billion to 2.47 billion.
- Wallets holding 10 million to 100 million ADA increased holdings from roughly 13.37 billion to 13.50 billion.
Sponsored
Sponsored
When whales strongly believe in a rebound, these groups usually accumulate together. That is not happening. The net buying strength is merely 20 million ADA. The reason is risk.
As long as ADA stays near the lower boundary of the falling channel, a breakdown remains possible. A confirmed break could trigger another 29% drop, highlighted later while discussing price. This structural risk keeps large investors defensive, even with bullish divergence forming.
Weak Social Dominance and Cautious Retail Buying Limit Momentum
The second barrier is sentiment.
Social dominance measures how much attention a coin receives compared to the rest of the crypto market. It tracks the share of online discussions focused on that asset. Rising dominance often signals growing speculation and inflows.
For Cardano, social dominance peaked near 1.08% in November 2025, when the ADA price touched $0.59. Since then, it has declined steadily. It now sits near 0.047%, close to a multi-month low.
Historically, this matters.
Sponsored
Sponsored
- In early December, a local social peak preceded a 12% rally.
- In late December, another peak was followed by a 16% rise.
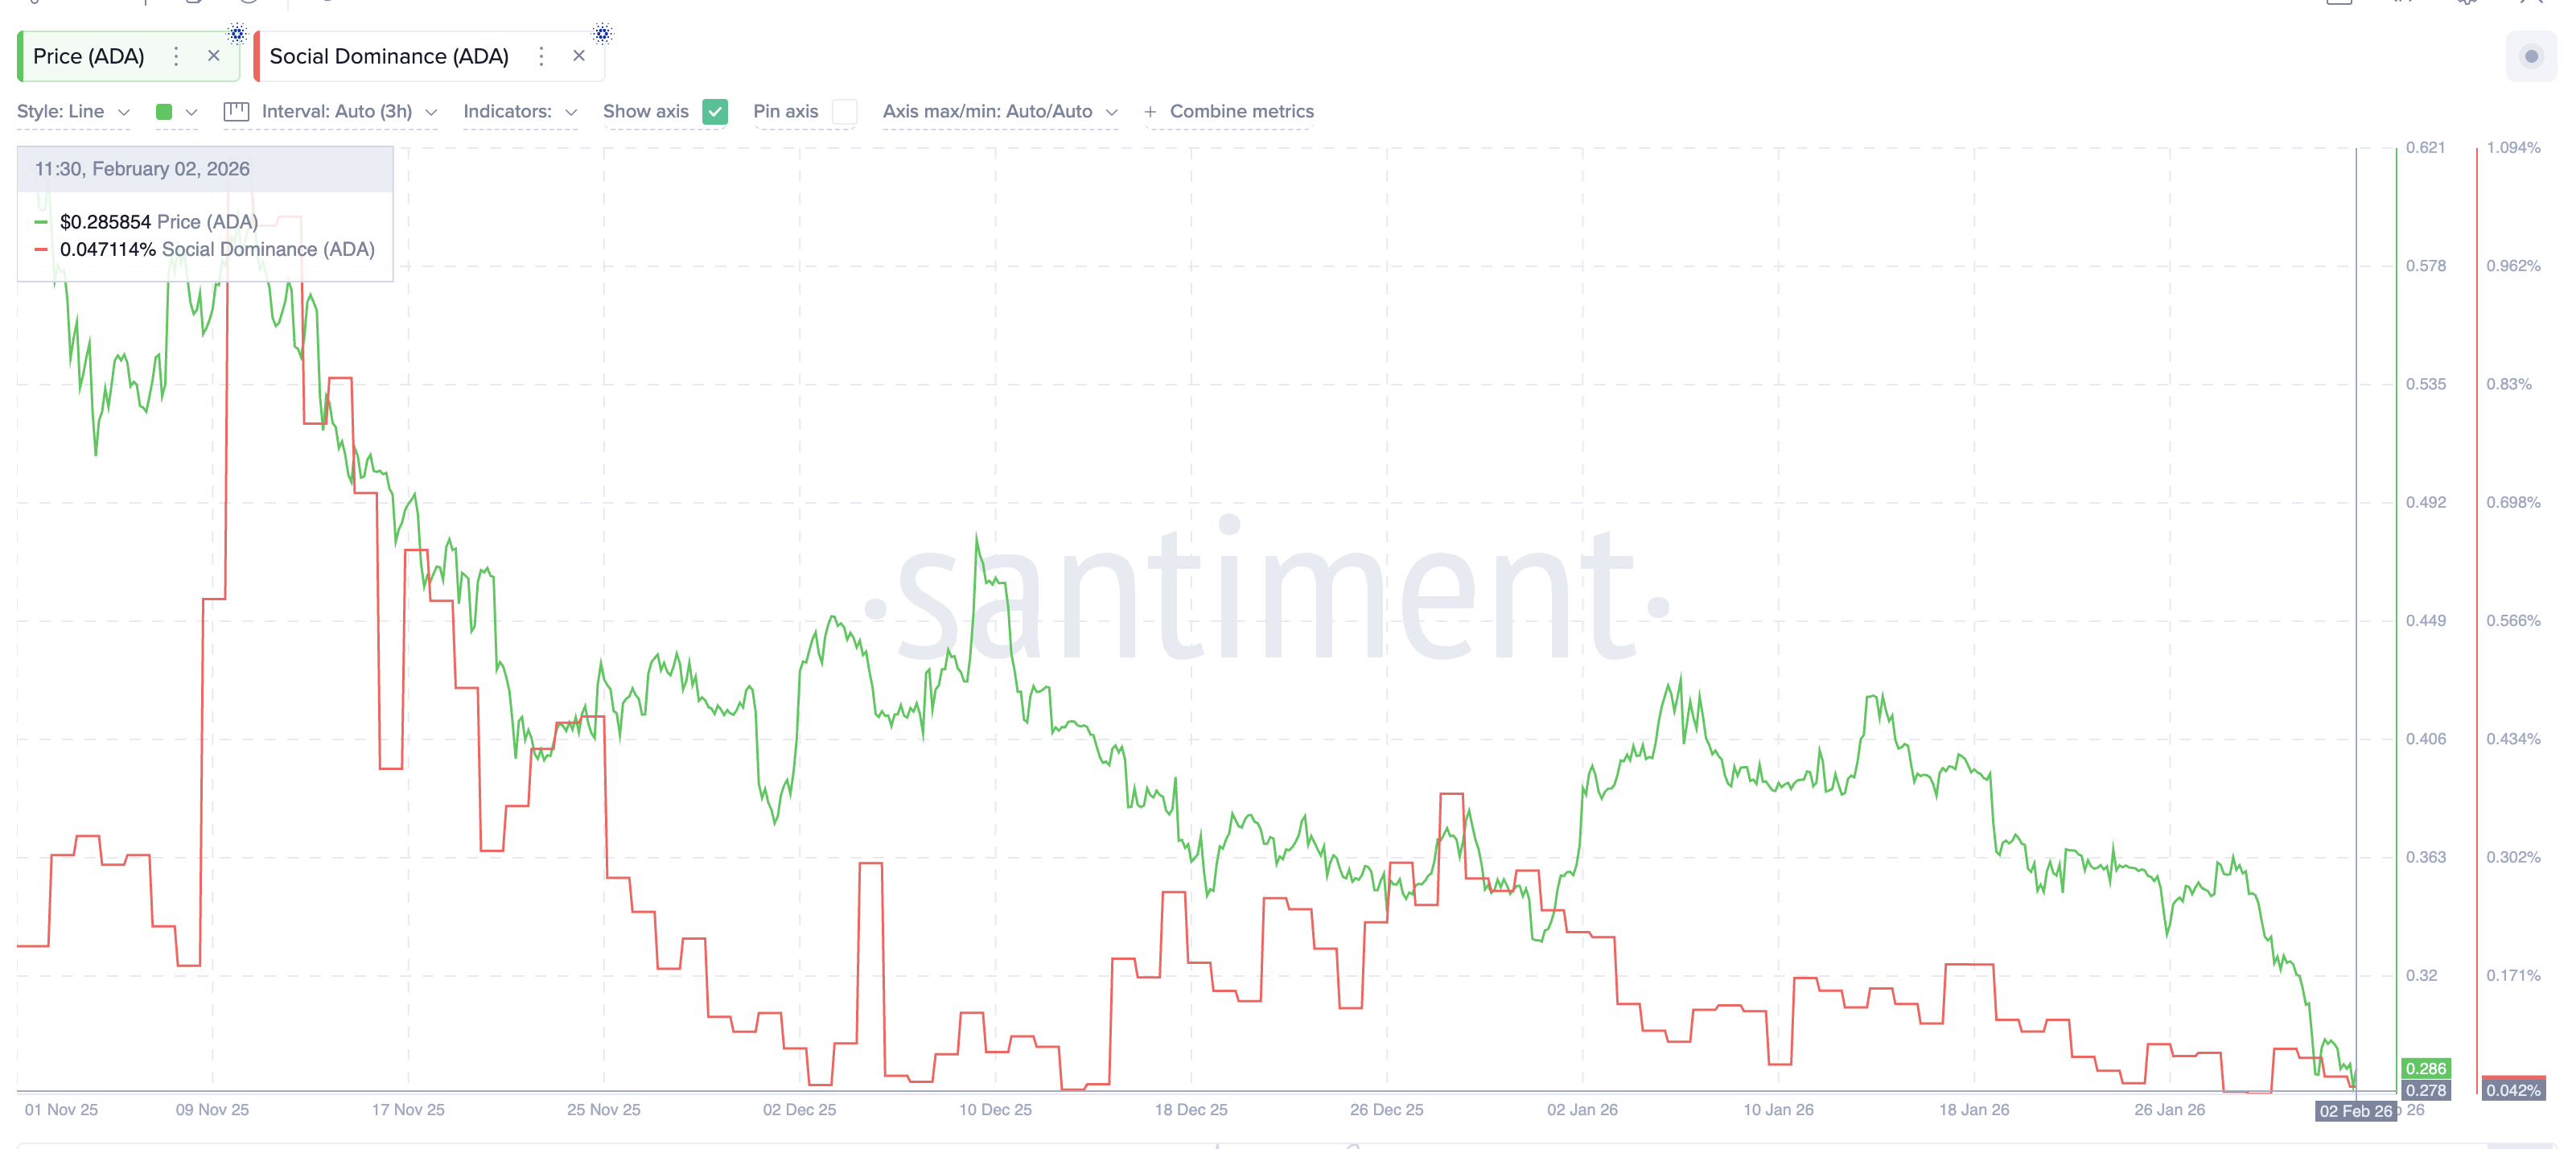
When social interest rises, price often follows. Right now, interest is fading. Without narrative momentum, whales have little incentive to scale into positions. Retail behavior is more positive, but still cautious.
Since January 22, ADA has posted daily net outflows from exchanges. Outflows mean coins are leaving exchanges, usually for holding rather than selling. This reflects buying pressure.
Daily net buying peaked near $14.9 million on January 31 and later cooled to around $2.8 million. There have been no major selling days since late January.
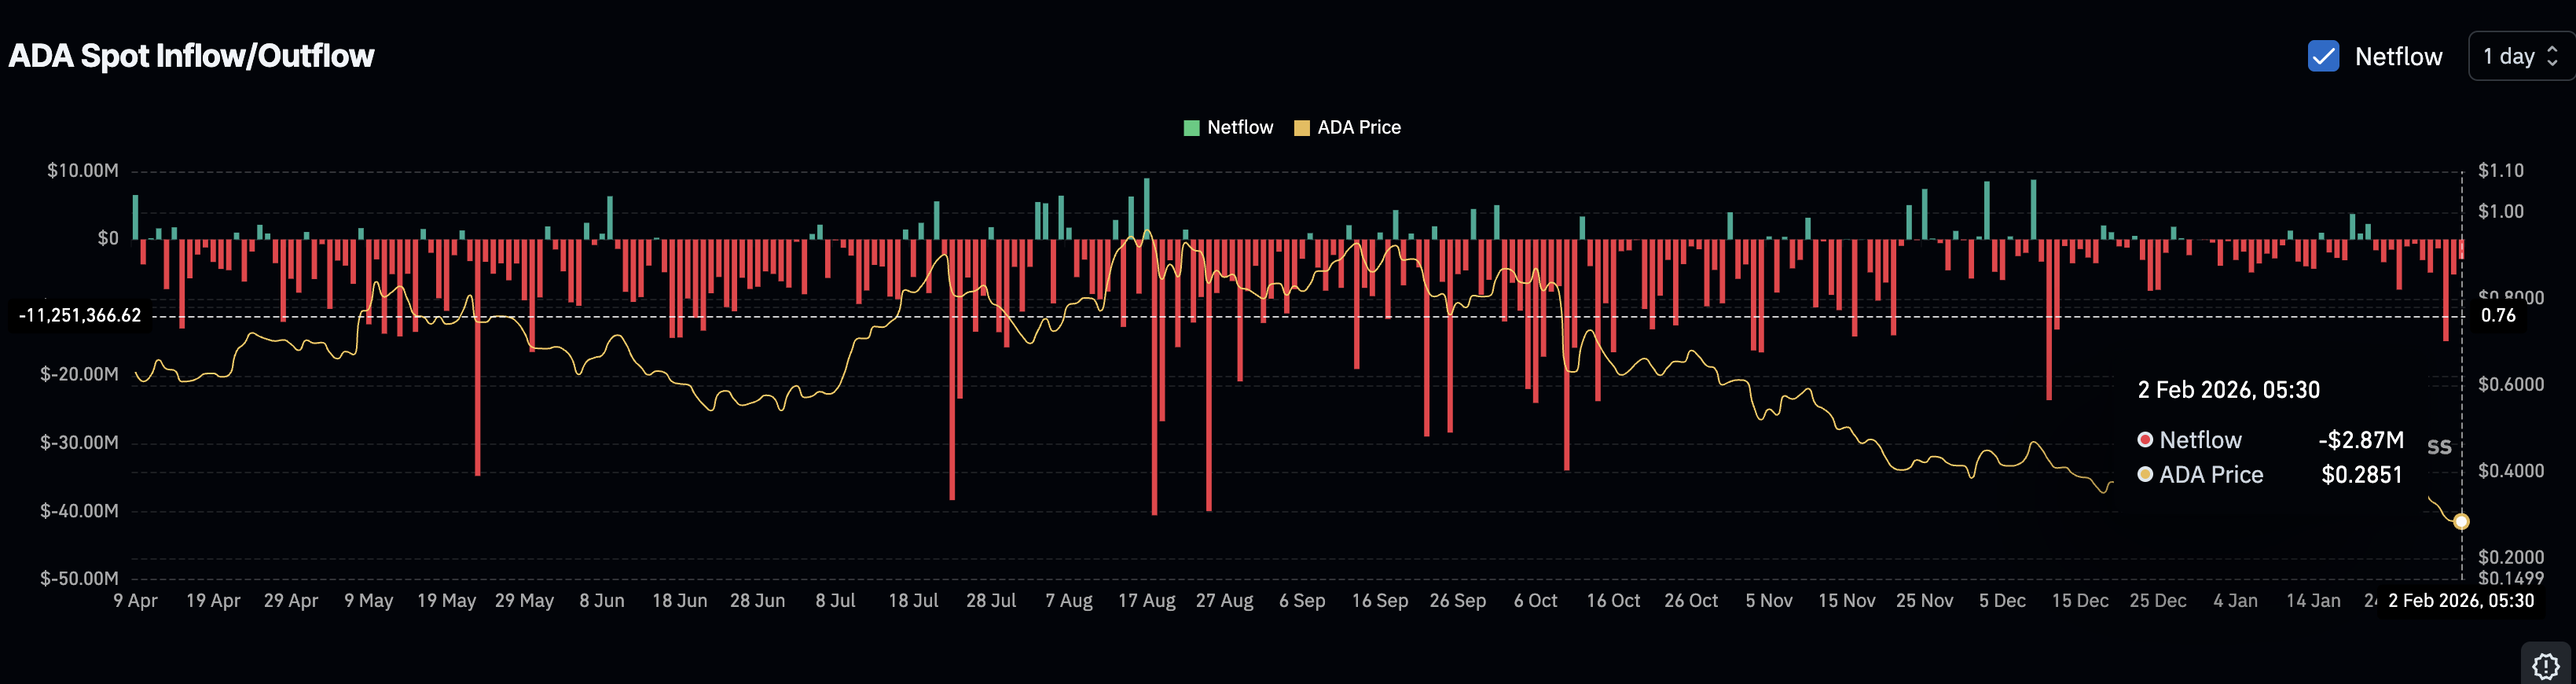
This shows retail investors are slowly accumulating dips. But the pace is modest. Without rising social attention, retail demand alone cannot drive a strong trend.
Sponsored
Sponsored
Smart Money Weakness and Key Cardano Price Levels Keep Whales Defensive
The final warning comes from “smart money” and price structure.
The Smart Money Index tracks how experienced traders position during different market hours. It aims to reflect informed behavior rather than emotional trading.
Recently, this index has moved below its signal line and continued falling. In past rallies, around early January, it usually rose before the price. Its current weakness suggests professional traders are not positioning for a rebound yet. This also reinforces whale caution.
From a technical view, several levels now define February’s outlook.
On the upside, ADA must first reclaim $0.319. This would signal improving confidence. A move above $0.376 is more important. It would break the falling channel and shift the structure from bearish to neutral. That could attract coordinated whale buying.
On the downside, $0.268 remains critical. A confirmed break below this level would also confirm a channel breakdown and open downside toward $0.188, implying a 29% drop target from the breakdown point.
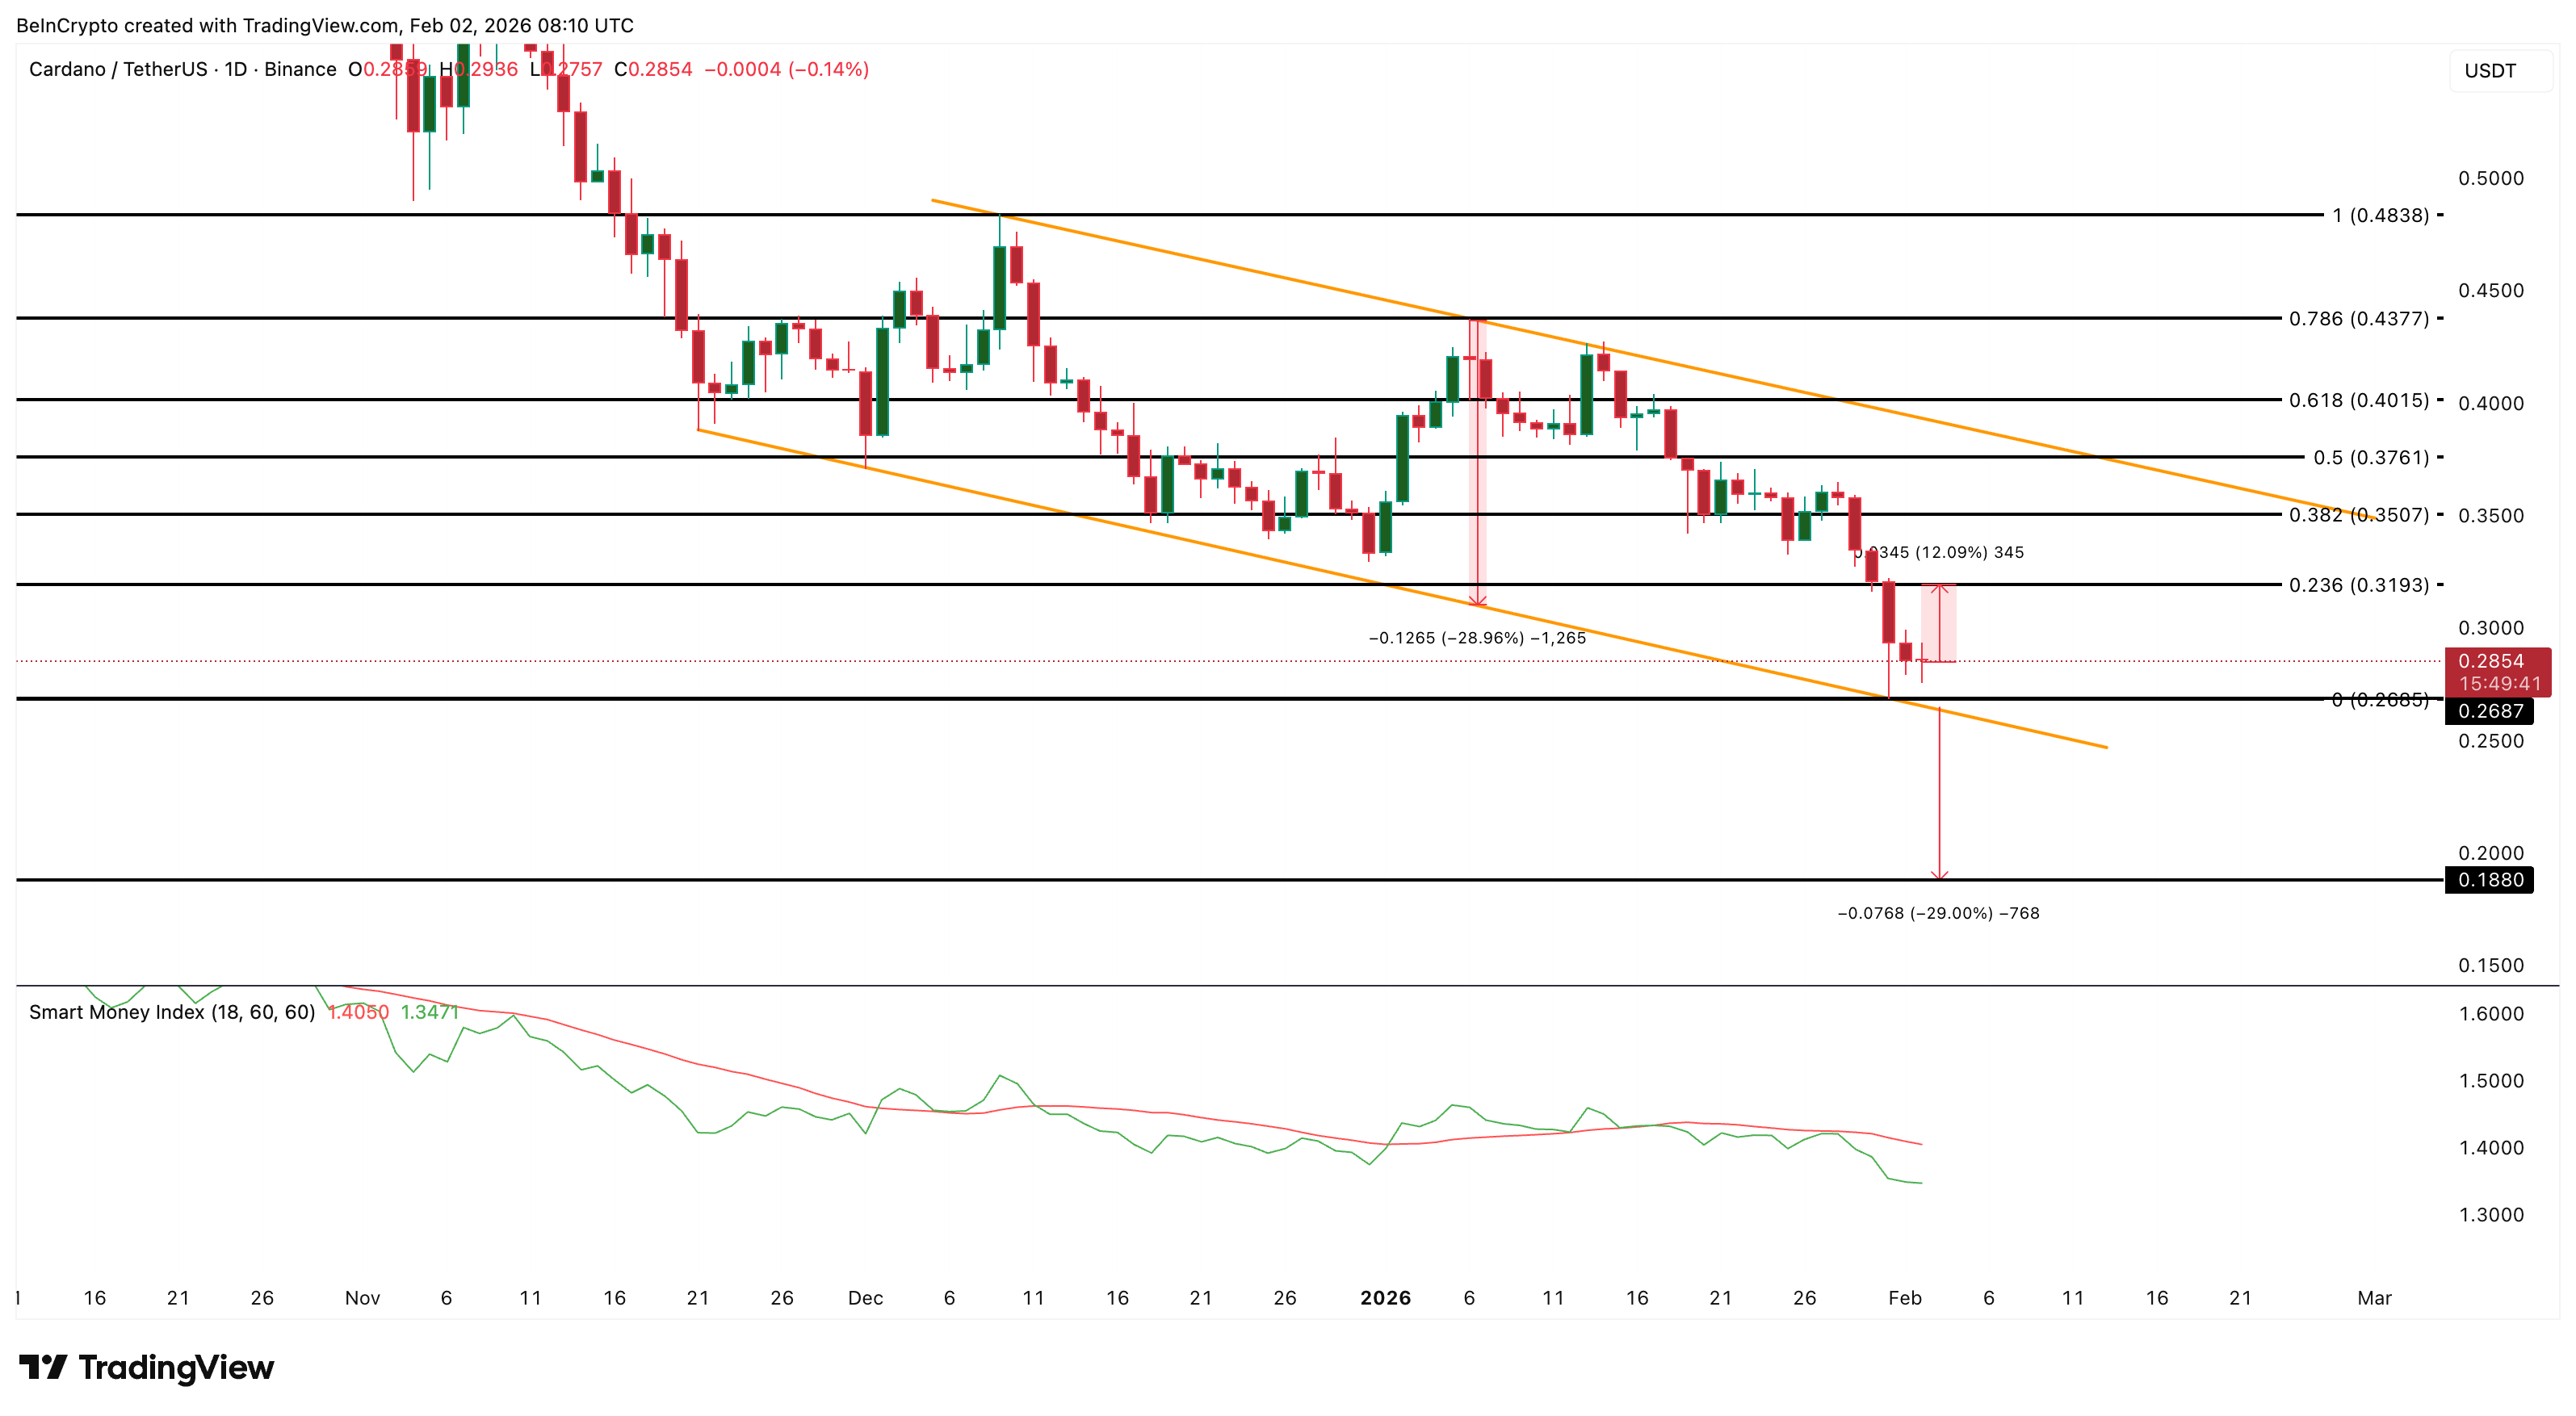
As long as the price stays between $0.268 and $0.319, uncertainty dominates. The bullish divergence shows that selling pressure is fading. But weak social momentum, fragmented whale behavior, and the absence of smart money support keep conviction low. Until sentiment improves and key resistance breaks, Cardano’s rebound remains possible, not proven.


Tron founder Justin Sun has criticized World Liberty Financial. He accused the Trump-linked crypto venture of hiding a blacklist function that allowed it to freeze investor wallets.
In an April 12 post on X, Sun said he invested in World Liberty because he believed the platform’s public pitch around decentralized finance and broader retail access.
Justin Sun Slams World Liberty Financial’s ‘Trap Door’
He said the company undermined that belief by hiding a contract feature that let it freeze or restrict token holders without notice or recourse. Sun said the team blacklisted his WLFI wallet in 2025 and urged it to unlock the tokens.
Sun is not a marginal WLFI holder. The Tron founder had spent at least $75 million on WLFI tokens, making him one of the project’s biggest known backers.
However, World Liberty blacklisted Sun’s wallet when the project launched last year. At the time, the company said it flagged the Sun-linked address because it suspected the wallet had misappropriated other holders’ funds.
Sun disputed that characterization and has now recast the episode as evidence that the project retained centralized control inconsistent with its DeFi branding.
“Every action taken by the WLFI team to extract fees from users, to secretly implant backdoor controls over user assets, to freeze investor funds without disclosure or due process, and to treat the crypto community as a personal ATM — all of these actions are illegitimate and were never authorized by any fair, transparent, or good-faith community governance process,” he stated on X.
The continued blacklisting of Sun’s wallet has already resulted in losses of more than $80 million, according to blockchain firm Bubblemaps.
WLFI Faces Increased Scrutiny
Meanwhile, Sun’s criticism represents a fresh blow for a project already under pressure after a sharp decline in its token price and criticism of its borrowing practices.
The project was already facing market scrutiny over its use of WLFI as collateral on Dolomite, a decentralized lending protocol. Notably, the protocol is also tied to one of the venture’s advisers.
On-chain activity showed that WLFI’s team posted roughly $400 million of WLFI and borrowed $150 million in stablecoins. The activity raised concerns about liquidity, related-party conflicts, and the risk that a deeper drop in WLFI could intensify stress on the position
Those concerns have already shown up in the market. WLFI fell to an all-time low near $0.08 after investors digested reports about the Dolomite loans.
World Liberty has tried to calm investors rather than retreat from the strategy. The company said on social media that its loan positions were “nowhere near liquidation” and described itself as the “anchor borrower” in WLFI markets.
On April 11, the firm said it had repaid $25 million of the loan. It added that it would publish a governance proposal for a phased unlock for early retail purchasers after community discussion.
The post Justin Sun Accuses Trump’s World Liberty Financial of Hiding Wallet Freeze Function appeared first on BeInCrypto.

TLDR:
- On-chain researchers have flagged wallets consistently routing large ONDO batches to CEX deposit addresses.
- Binance, Gate, and Coinbase are the three centralized exchanges receiving the flagged ONDO transfers.
- The coordinated wallet routing pattern points to either a single entity or a group acting together.
- ONDO trades at $0.24, where increased sell-side pressure could test the token’s key support levels.
ONDO, priced at $0.24 as of this writing, is drawing increased attention from on-chain researchers. A network of wallets has been identified consistently routing large token batches to centralized exchange deposit addresses.
Binance, Gate, and Coinbase are the three platforms receiving these transfers. The activity has prompted analysts to issue warnings directed at current ONDO holders.
This development is gaining traction across crypto trading and research communities.
Large ONDO Transfers Flagged Across Three Major Exchanges
On-chain researchers have identified a coordinated network of wallets moving ONDO in large batches. These wallets are consistently sending tokens directly to CEX deposit addresses.
The activity spans three major platforms: Binance, Gate, and Coinbase. Analysts describe the routing behavior as structured rather than coincidental.
Crypto analyst Dami-Defi brought this activity to public attention on X. The analyst stated: “On-chain researchers have flagged a network of wallets consistently routing large ONDO batches directly to CEX deposit addresses on Binance, Gate, and Coinbase.”
The post emphasized it as something every ONDO holder should be aware of. It gained rapid traction among traders and blockchain researchers alike.
When wallets route tokens to exchange deposit addresses, it often signals intent to sell. However, large holders sometimes use this process for repositioning or portfolio rebalancing.
The confirmed intent behind these transfers has not been established by researchers. No direct sell-off has been officially declared at this point.
What makes this activity stand out is its consistency and volume. Sporadic exchange inflows are common and generally dismissed.
However, a network of wallets acting in a similar pattern is a different matter. This behavior can eventually translate into visible supply pressure on the open market.
On-Chain Data Points to Structured Wallet Behavior Around ONDO
On-chain tracking tools now allow researchers to monitor wallet movements in real time. Identifying when wallets route to known CEX deposit addresses has become standard analytical practice.
This type of early visibility gives market participants actionable information. It remains one of the more dependable forms of blockchain intelligence available today.
The flagged ONDO wallets share a similar routing approach, which points to coordination. This pattern could indicate a single entity managing multiple wallets or a group acting together.
Researchers have not definitively confirmed either scenario based on available data. The structured nature of the transfers, however, continues to raise questions.
ONDO operates within the real-world asset tokenization sector, a growing area of blockchain development. The project has built a foundation around on-chain financial infrastructure.
Despite strong fundamentals, token prices remain responsive to large supply movements. Coordinated exchange inflows from multiple wallets can shift market sentiment noticeably.
At its current price of $0.24, any increase in sell-side activity could test ONDO’s support levels. Holders are encouraged to track exchange inflow data through reliable blockchain analytics platforms.
The situation remains fluid, and further on-chain monitoring is warranted. No confirmed sell-off has been reported, but the pattern merits continued observation.


Anthony Scaramucci urged Bitcoin investors to stay focused after the asset dropped into the $72,000 range. He said the recent sell-off changed market sentiment, but not Bitcoin itself.
Summary
- Anthony Scaramucci said Bitcoin holders should stay calm even after BTC fell into the $72,000 range.
- Bitcoin’s weekend drop triggered nearly 120,000 liquidations as leveraged long traders absorbed most of the losses.
- Scaramucci said Bitcoin itself stayed unchanged despite weaker sentiment, lower prices, and ongoing bear market pressure.
SkyBridge Capital founder Anthony Scaramucci told the crypto community not to panic as Bitcoin faced fresh pressure. In a post on X, he said investors should not let price swings change their view of the asset.
He wrote, ”Bitcoin got us to $126,000. So now we feel terrible at $72,000.” He added that the asset remained the same even though emotions had shifted with the market.
Scaramucci said a holder who owned one Bitcoin before the rally still owned one Bitcoin after the drop. His message focused on separating short-term price action from long-term conviction.
He also warned against reacting to fear during periods of stress. His broader point was that investors should avoid making decisions based only on recent losses.
Bitcoin came under heavy selling pressure during weekend trading. The asset dropped sharply and touched a low near $71,349 after printing a large red candle early Sunday.
The move triggered widespread liquidations across the crypto market. Nearly 120,000 traders were liquidated within 24 hours, while losses reached almost $189.85 million over 12 hours.
Long traders took the largest hit during that stretch. Data in the report showed that leveraged long positions accounted for $132.80 million of the 12-hour liquidation total.
The sell-off added to the weak mood in the market. It also gave critics such as Peter Schiff another opening to question Bitcoin’s strength.
Bear market pressure remains
Scaramucci has already said the crypto market entered a bear phase earlier this year. He previously said the main issue was no longer whether the market had turned, but how long the pressure would last.
He also lowered his earlier Bitcoin cycle target from $170,000 to $150,000. That shift reflected a more cautious view as the market lost momentum.
Scaramucci pointed to what he called ”demographic tension” as one reason for the slower pace. He said crypto adoption still depends heavily on younger investors, while older capital tends to move more slowly.
Even so, his latest message remained clear. He told investors to ignore short-term noise, avoid excess leverage, and focus on the asset itself.
America’s debt burden is worsening, with the cost of servicing it rising and consuming a growing share of government income.
While total US national debt has surpassed $39 trillion, the bigger concern is no longer just how much is owed but how expensive it has become to maintain.
US Debt Burden Deepens as Interest Costs Spiral Higher
According to preliminary estimates, the US government paid $529 billion in interest between October 2025 and March 2026. That translates to roughly $88 billion per month, or more than $22 billion per week, highlighting the scale and speed of the growing burden.
The figure is comparable to combined federal spending on the Department of Defense ($461 billion) and the Department of Education ($70 billion) over the same period, highlighting how debt servicing is beginning to rival core government outlays.
The pressure is also accelerating. Over the same six-month period a year earlier, interest payments stood at $497 billion, marking a $33 billion, or 7%, increase year over year.
“Because the debt was larger than it was in the first half of fiscal year 2025, and because of higher long-term interest rates. Declines in short-term interest rates partially mitigated the overall rise in interest payments,” CBO noted.
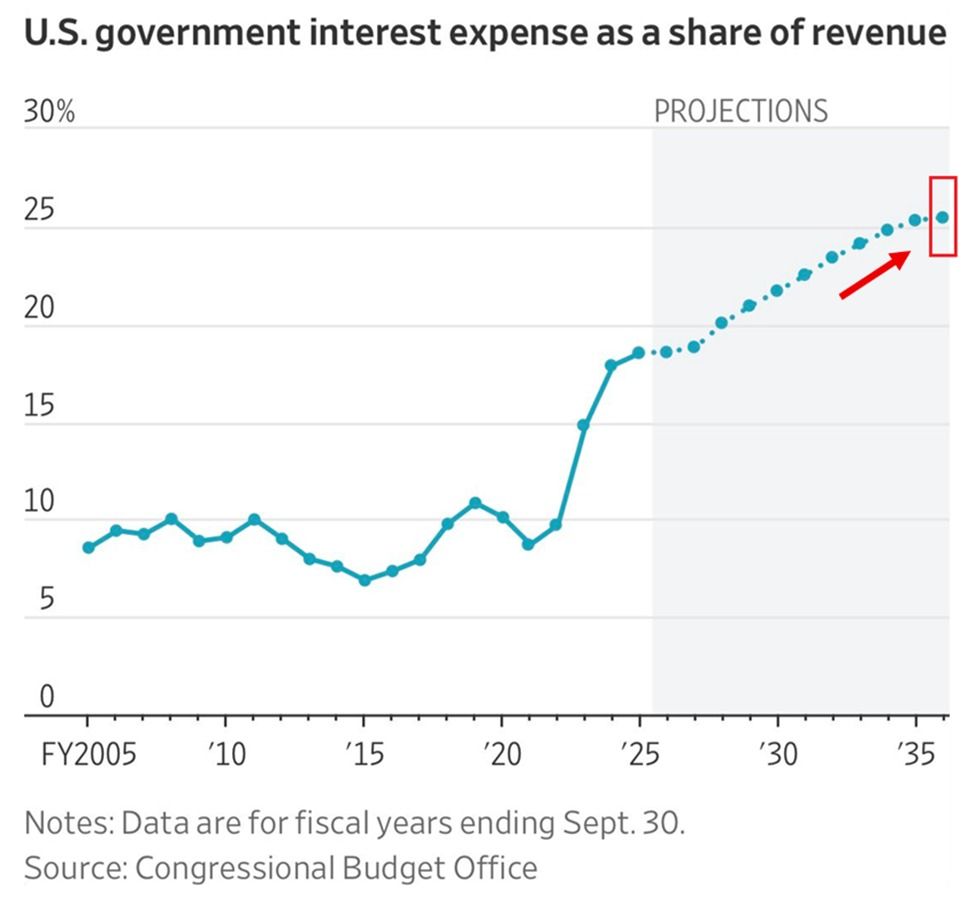
Beyond absolute figures, the structural strain is becoming more evident. Data highlighted by The Kobeissi Letter shows the US government spent 18 cents of every dollar of revenue on interest in Fiscal Year 2025.
This was the highest level since the 1990s. That share has tripled since 2015, signaling a significant shift in fiscal dynamics.
Looking ahead, the Congressional Budget Office projects this burden will rise further, reaching 25 cents of every dollar of revenue by 2035. Notably, these projections assume stable economic conditions, with no major recession or sharp rise in Treasury yields, leaving room for even greater strain if the outlook deteriorates.

As borrowing costs climb, the US debt story is increasingly defined not by its size, but by the mounting cost of carrying it.
Follow us on X to get the latest news as it happens
What It Means for Crypto
The structural deterioration in US public finances strengthens the structural case for hard assets with limited supply, including gold and Bitcoin (BTC). Notably, Bitcoin has shown relative resilience during the ongoing US-Iran conflict.
Gold, by contrast, has dipped amid escalating tensions. Still, deteriorating macro conditions could just as easily push investors toward risk-off positioning.
Whether Bitcoin ultimately proves to be a reliable inflation hedge or behaves more like a high-beta risk asset remains a live debate. What is less contested is that the fiscal conditions fueling that debate are intensifying, not improving.
Subscribe to our YouTube channel to watch leaders and journalists provide expert insights
The post How America’s Debt Interest Is Becoming Its Biggest Budget Problem appeared first on BeInCrypto.


Ether Machine has ended its plan to go public through a merger with Dynamix Corporation.
Summary
- Ether Machine canceled its SPAC merger with Dynamix and stopped its planned Nasdaq market debut.
- The firm’s proposed $1.5 billion institutional Ether fund will not launch under the canceled deal.
- Pressure on Ether treasury firms grew as Trend Research and ETHZilla both exited strategies.
The move stops its proposed Nasdaq listing and puts its large Ethereum treasury plan on hold.
Ether Machine and Dynamix said they mutually agreed to terminate their business combination agreement. The company said it made the decision because of “unfavorable market conditions.”
The agreement would have taken the Ethereum treasury firm public through a merger with the Nasdaq-listed SPAC. The deal also involved The Ether Reserve LLC, which was part of the broader transaction structure.
Ether Machine had planned to launch what it described as a large yield-bearing Ether fund for institutions. The firm said it expected to begin with more than 400,000 ETH under management and list under the ticker ETHM.
That target was worth more than $1.5 billion when the company first outlined the plan. The canceled merger now stops that launch and leaves the fund strategy without the public market debut it had expected.
A filing with the US Securities and Exchange Commission said a “Payor” listed in Annex A must pay $50 million to Dynamix. The payment must be made within 15 days after the termination became effective.
The filing did not publicly name that party. Dynamix now has until November 22, 2026, to complete another business combination or return trust funds to shareholders under its charter.
Ethereum treasury pressure builds
The canceled deal comes as other Ether treasury strategies also face pressure. Trend Research has exited its Ethereum position after selling 651,757 ETH worth about $1.34 billion and recording an estimated loss of $747 million.
ETHZilla has also moved away from its Ether accumulation strategy. The company changed its name and brand to Forum Markets after earlier pivoting from biotech to an Ethereum treasury model during the 2025 rally.


The ripple effects of geopolitical conflict are reshaping the plumbing of global trade finance, pushing some commodity traders out of the banking system and into the arms of stablecoins.
That’s according to Luke Sully, CEO of trade finance-focused stablecoin issuer Haycen, who says the war involving Iran has heightened compliance fears among Western banks, triggering a fresh wave of “debanking” across commodity markets.
“Since the war, banks are further retreating from certain commodity flows,” Sully told CoinDesk in an interview.
“We spoke with some commodity traders who are getting debanked now,” he added.
The $2 trillion market
The concern centers on counterparty risk.
Banks worry that seemingly legitimate transactions, say, involving firms in Oman or other regional hubs, could have indirect exposure to sanctioned Iranian entities. Rather than take the risk, some institutions are stepping back entirely.
The result is reduced access to traditional rails in a sector that is already largely financed outside of traditional banking.
Trade finance, a roughly $2 trillion market for international trade transactions, has increasingly been dominated by non-bank lenders, including private credit funds that finance the movement of commodities and goods globally.
“Everybody thinks they know about trade finance, but they don’t,” Sully says. “It’s predominantly non-bank investment funds lending to borrowers around the world to move goods and services.”
These lenders provide critical liquidity, often earning annualized returns of around 15%, and enable transactions such as shipping helium from Qatar to South Korea or manganese from South Africa to Indonesia.
But they rely on banks for settlement and payment rails, relationships that are now under strain.
Stablecoins, digital tokens pegged to fiat currencies, typically the U.S. dollar, are emerging as a key workaround. In particular, Tether’s USDT has seen growing adoption among commodity traders and counterparties operating in emerging markets.
These cryptocurrencies have rapidly evolved from a niche crypto trading tool into one of the fastest-growing segments of global finance, with total market capitalization surpassing $300 billion in 2025 after roughly 50% annual growth.
Transaction volumes have surged even faster, exceeding $4 trillion in 2025 and now accounting for around 30% of all onchain activity, underscoring their growing role as a medium for cross-border payments and dollar access in emerging markets.
Tether’s dominance
Once primarily used within crypto markets, stablecoins are increasingly being adopted for real-world use cases, from remittances to trade settlement, driven by their speed, global liquidity and ability to bypass traditional banking rails.
One such stablecoin is Tether’s USDT, which is currently dominating the flow.
“Tether is soaking up a lot of the payments flow,” Sully says. “If you want to make a one-time payment into an emerging market, USDT is helping.”
The appeal is straightforward: deep global liquidity and widespread acceptance.
“There is so much global USDT liquidity that people don’t mind sending or accepting it as payment,” he added, “because someone in their country will eventually swap it for dollars.”
That growing familiarity is also shifting perceptions.
Still, Sully frames this trend as a workaround rather than a long-term solution. “This is more of a workaround for these people than a solution for trade finance in general.”
‘A different problem’
The geopolitical backdrop is also producing more extreme signals.
Sully pointed to reports that bitcoin is being used as a “currency of choice” for payments tied to safe passage through the Strait of Hormuz, a critical chokepoint for global oil shipments.
“It shows that trade finance is increasingly being led and managed by non-bank actors and non-bank ways of transacting,” Sully says.
Haycen is positioning itself to capture this shift. The firm issues a U.S. dollar-backed stablecoin, USDhn, designed specifically for trade finance.
According to Sully, “Haycen aims to be the liquidity and settlement layer for non-bank global trade and is currently working with industry participants around the world.” The goal is to streamline a highly fragmented system.
Haycen’s model allows users to deposit funds, transact using its stablecoin, and potentially earn interest, subject to regulatory eligibility, while avoiding the delays and inefficiencies of correspondent banking.
“Funds don’t get lost for seven days. You can log in, see your deposits and counterparties in one place, and settle instantly.”
Unlike most stablecoin issuers, which focus on crypto trading or retail payments, Haycen is targeting a specific institutional niche. “Every other stablecoin business is a payments business or a crypto trading business,” Sully says. “We’re solving a different problem.”
That problem, how to move money efficiently in a fragmented, increasingly de-risked global trade system, may only grow more acute as geopolitical tensions persist.
Ironically, Sully notes, banks’ retreat could accelerate crypto adoption faster than the industry itself ever managed.
Read more: Banks are treading carefully on stablecoins despite market growth, S&P Global says


Polymarket briefly appeared in Google News results before Google removed the links, according to reports.
Summary
- Google removed Polymarket from News results and said the platform appeared there by error, according to reports.
- Polymarket keeps expanding through Google Finance, X, MetaMask, and World App despite the News removal episode.
- New wallet data shows only a very small share of Polymarket traders earn steady profits.
The listings showed up beside articles from established news outlets during searches tied to live events.
Google later said the appearance was a mistake. A spokesperson told The Verge, “This site briefly appeared in Google News in error, and it is no longer surfacing in News.”
Polymarket links appeared under mainstream news coverage for event-based searches. One example cited by Futurism involved the query “will ships transit the strait,” which referred to the Strait of Hormuz.
That search placed a Polymarket prediction market near reports from Reuters and The Guardian. Later search on Sunday did not show any Polymarket results for the same query.
The episode drew attention because Google News usually features reports from publishers that cover current events. Polymarket, by contrast, offers betting markets based on possible outcomes tied to those events.
Google has not announced any broader change to its News eligibility rules in relation to prediction market platforms. The available comments only said the listing appeared by error and was later removed.
Polymarket expands through partnerships
The brief Google News appearance came as Polymarket continues to secure distribution deals. Last year, Google partnered with Polymarket and Kalshi to bring their data into Google Finance.
X also named Polymarket its official prediction market partner in June. That agreement aimed to connect market forecasts with discussions taking place on the social media platform.
Other crypto and digital identity platforms have also added access to Polymarket. MetaMask said in October that it would integrate Polymarket, while World App also added the service during the same month.
These partnerships show that prediction market platforms continue to push for wider visibility. Even so, the Google News issue suggests there are still limits around how these services appear inside news-focused products.
Most traders still struggle to profit
Polymarket has gained attention as a growing crypto use case, but trader results remain uneven. Data shared by analyst Andrey Sergeenkov showed that only a small share of users posted strong and steady monthly profits.
According to the data, about 1% of traders made more than $5,000 in profit in a single month. Only 0.015% managed to maintain that level for four straight months.
The same findings showed that just 0.033% of wallets recorded more than $100,000 in total profits. The figures suggest that while prediction markets draw strong interest, consistent gains remain rare for most users.
Crypto World
Tron’s Justin Sun slams Trump-backed WLFI for treating users as ‘personal ATM’ after $75 Million DeFi loan
Trump-linked World Liberty Financial has lost a key backer after its $75 Million DeFi loan tied up user liquidity, with Justin Sun publicly breaking and criticizing the project’s treatment of investors.
“Every action taken by the WLFI team to extract fees from users and to treat the crypto community as a personal ATM is illegitimate,” Sun wrote.
I have always been an ardent supporter of President Trump and his crypto friendly policy.
As an early supporter who invested heavily in World Liberty Financial, I did so because I believed in the vision that was presented to the public: a decentralized finance platform that…
— H.E. Justin Sun 👨🚀 🌞 (@justinsuntron) April 12, 2026
The criticism comes days after World Liberty Financial deposited 5 billion WLFI tokens as collateral on the DeFi lending platform Dolomite and borrowed about $75 million in stablecoins.
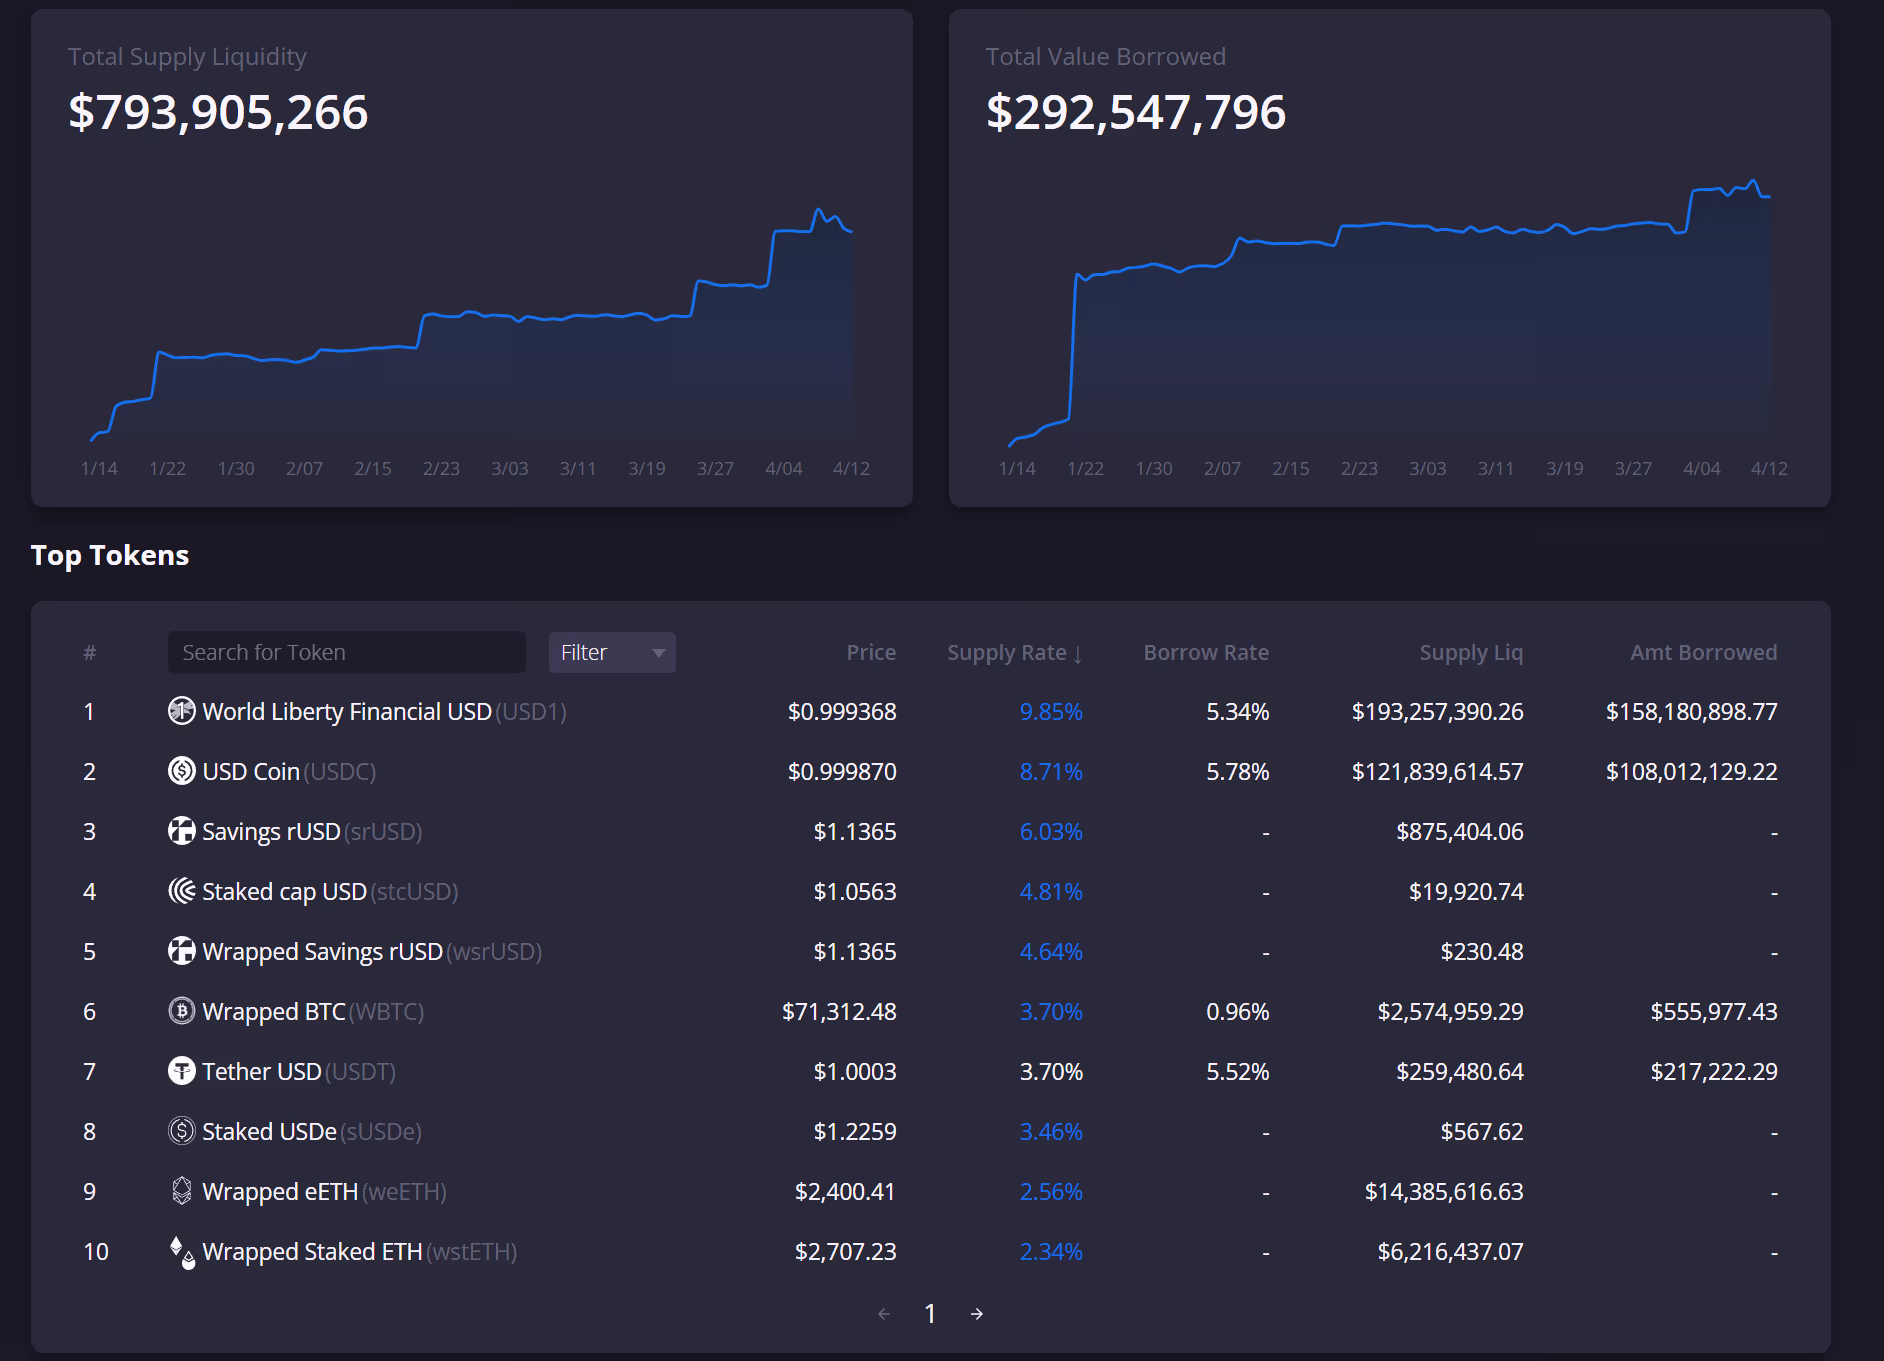
The deposit still dominates Dolomite, accounting for a majority of the protocol’s roughly $794 million in total supply liquidity.

At its peak earlier this week, the USD1 pool hit 100% utilization, temporarily locking ordinary stablecoin depositors out of their funds. As of Sunday, the pool had eased to roughly 82% utilization, with about $158 million borrowed against $193 million supplied.
Dolomite co-founder Corey Caplan also serves as an advisor to World Liberty Financial, a dual role that onchain analysts have described as functionally that of CTO. To accommodate WLFI’s deposit, Dolomite raised its WLFI supply cap to 5.1 billion tokens.
“These actions have nothing to do with me. They have nothing to do with the investors who believed the promises this project made,” Sun continued. “We oppose every one of these actions in the strongest possible terms.”
Frozen out of WLFI
Sun had helped stabilize the project early on by purchasing $30 million in WLFI tokens after a lukewarm launch raised questions about investor appetite.
Last September, WLFI froze Sun’s wallet, locking the Tron founder out of 595 million unlocked tokens worth about $107 million at the time.
WLFI said the action was part of a broader move against 272 wallets it linked to phishing attacks and compromised support channels, insisting it “only intervenes to protect users, never to silence normal activity.”
Sun is frames the September freeze as the project’s original sin.
“I am the first and single largest victim,” he wrote Sunday, “as a result of their wrongful blacklisting of my WLFI token wallet back in 2025, that violates basic investor rights and blockchain principles of fairness.”
Sun also took aim at WLFI’s governance process, alleging that votes cited to justify the freezes “were not conducted through a fair or transparent process,” that “key information was withheld from voters,” and that “the outcomes were predetermined.”
Notably, he carefully separated his attack on WLFI’s operators from the President himself, opening his statement by reaffirming that he has “always been an ardent supporter of President Trump and his crypto-friendly policy” and directing his denunciation at “the bad actors at WLFI.”
WLFI’s co-founder Zak Folkman did not immediately respond to a request for comment sent by CoinDesk to his Telegram.
WLFi is trading at $0.079, according to CoinDesk data, down 18% over the past week.
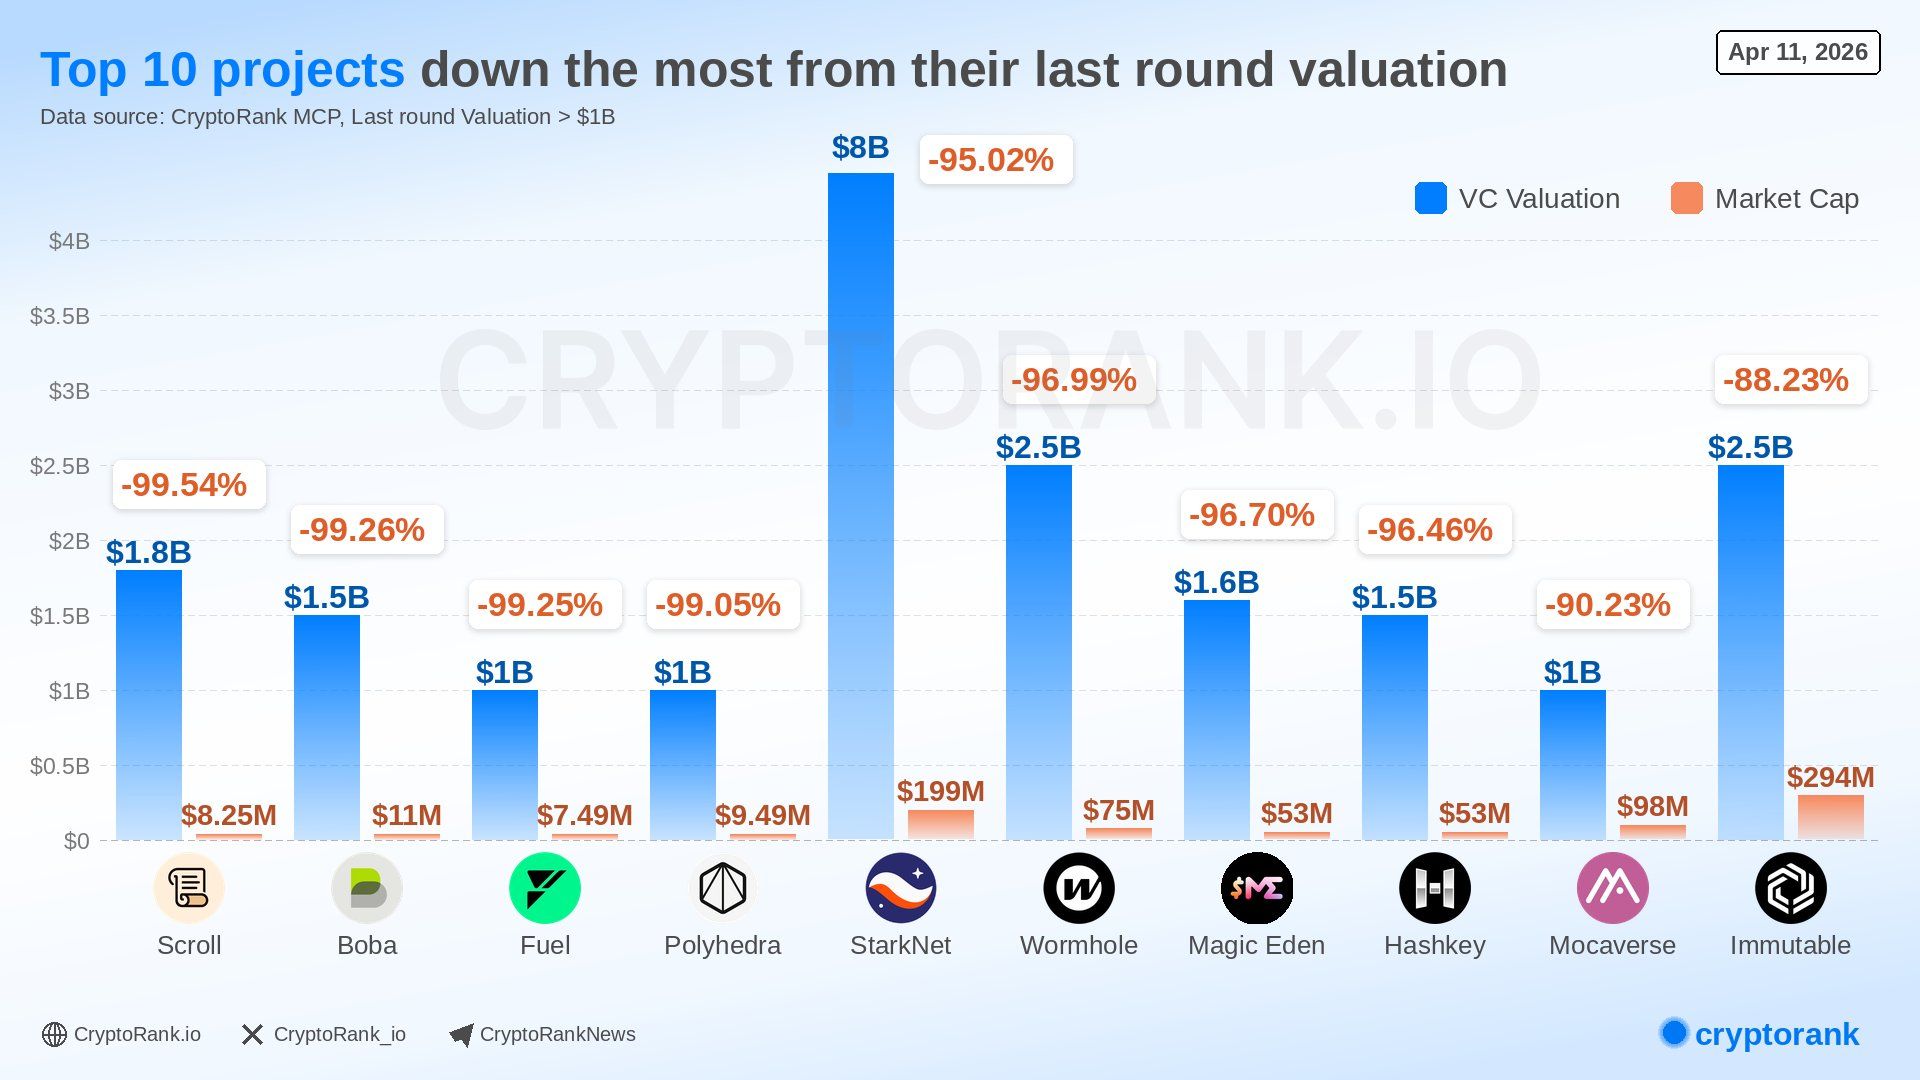
Ten crypto projects that had billion-dollar private valuations now trade at market caps ranging from $7 million to $294 million, according to CryptoRank data.
The gap between last-round venture capital valuations and current market caps ranges from 88% to over 99%. Four of the 10 hardest-hit projects belong to the zero-knowledge proof and Layer 2 sector.
Scroll, and Boba Network Lead the List
Scroll (SCR) tops the ranking with a 99.54% decline. The Ethereum Layer 2 raised $80 million across two rounds led by Polychain Capital, Variant Bain Capital Crypto, and more. Its last-round valuation stood at $1.8 billion.
It now trades at roughly $8.25 million in market cap.
Boba Network follows at -99.26%, while Fuel Network registered a 99.25% drop from a $1 billion valuation.
“These projects have fallen from billion-dollar valuations to nearly zero — a striking example of near-total value destruction. Even backing from Tier-1 VCs like Paradigm, Sequoia, Cbventures, and Multicoin wasn’t enough to protect post-TGE performance,” the post read.

Starknet (STRK) recorded the largest absolute loss on the list. It raised $282.5 million from Paradigm, Sequoia Capital, and Greenoaks Capital at a valuation of $8 billion. Its current market cap sits near $199 million, a 95% decline.
Rounding out the top 10 are Polyhedra (-99.05%), Wormhole (-96.99%), Magic Eden (-96.70%), HashKey Group (-96.46%), Mocaverse (-90.23%), and Immutable (-88.23%).
Follow us on X to get the latest news as it happens
Crypto VC Funding Rebounds Despite Market Weakness
Despite these losses, venture capital activity has picked up again. CryptoRank data shows that March 2026 recorded around 100 funding rounds totaling $2.59 billion in raises, the highest level since October 2025.
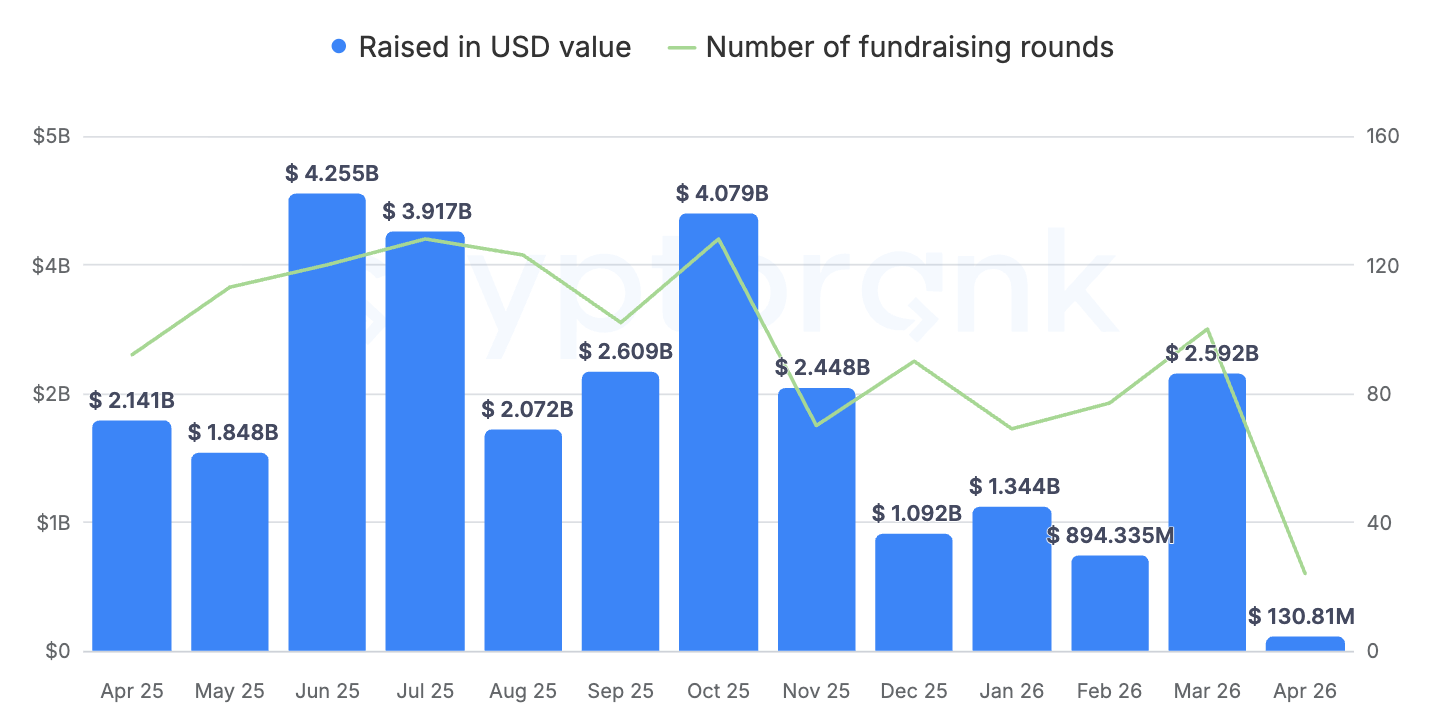
Coinbase Ventures and Animoca Brands led the most rounds during the month. Moreover, blockchain services accounted for 39 rounds, followed by decentralized finance (DeFi) with 20 rounds, and centralized finance (CeFi) with 15 rounds.
Subscribe to our YouTube channel to watch leaders and journalists provide expert insights
The post These Crypto Projects Had Billion-Dollar Valuations, Now They Trade 90% Lower appeared first on BeInCrypto.
The push to pass the CLARITY Act in the United States is intensifying as lawmakers face a looming deadline to provide clear regulatory oversight for the crypto industry. Senator Cynthia Lummis, among the most vocal crypto advocates in Congress, warned that delay could push meaningful legislation into a distant future, potentially delaying the sector’s growth and investor protections.
In a Friday post on X, Lummis framed the moment as a last chance to enact relief before 2030, arguing that the U.S. cannot surrender its financial future. The comment arrives as momentum for the bill appears fragile amid the upcoming midterm elections in November, which could reshape congressional priorities and slow the momentum around what many see as a foundational market-structure framework for digital assets.
Echoing the urgency, David Sacks, former White House AI and crypto czar, weighed in with a similar sentiment. “The time to act is now. Senate Banking, and then the full Senate, should pass market structure. I’m confident that they will. And then President Trump will sign this landmark bill into law,” Sacks wrote. The chorus from industry insiders underscores a shared view: absence of a clear regulatory path could hobble innovation and investor confidence.
Key takeaways
- Legislative urgency surrounds the CLARITY Act, with proponents arguing that clear regulatory boundaries are essential for advancing the U.S. crypto sector and protecting consumers.
- Timing remains a major question mark due to the November midterm elections, which could shift congressional priorities and slow passage of crypto legislation.
- Support crosses sectors and roles, with influential figures—from venture capital to exchange executives and technology founders—arguing that well-defined rules foster growth and certainty for participants.
- Internal debates on specifics, notably around stablecoin yield, pose potential chokepoints that could affect markup or floor votes in the Senate.
- Regulators themselves have voiced support for a comprehensive market-structure framework, signaling alignment with lawmakers on the direction of regulation.
CLARITY Act as a catalyst for U.S. crypto growth
Industry participants widely view regulatory clarity as a catalyst for innovation. A familiar refrain across crypto circles is that clear rules help both consumers and builders navigate risk, reduce ambiguity, and foster responsible innovation. Chris Dixon, managing partner at A16z Crypto, captured this sentiment in a post, noting that “when rules are defined, both consumers and entrepreneurs win.”
The sentiment extends beyond investment capital to product development and user experience. Robbie Ferguson, co-founder of Immutable, argued that the act could accelerate the sector’s growth trajectory, suggesting that clearer oversight would unlock opportunities for developers and gamers alike. The Web3 gaming ecosystem, in particular, has been a fervent advocate for clarity as a means to scale and protect players and developers in a regulated, trusted environment.
A wave of industry voices has also highlighted how clarity could influence real-world adoption. Coinbase CEO Brian Armstrong called for moving forward with the legislation after months of delays, signaling that the industry wants a path forward that offers predictability and guardrails for participants ranging from exchanges to resourceful startups. Coinbase chief legal officer Paul Grewal also signaled that progress toward a Senate markup hearing could be within reach, though he cautioned that relief hinges on reconciling disputes over stablecoin yield—a friction point that has lingered in negotiations.
On the regulatory front, the push for a comprehensive market-structure framework has drawn support from prominent regulatory figures. SEC Chair Paul Atkins publicly framed the moment as an opportunity for Congress to “future-proof against rogue regulators” and advance a broad framework that could guide the sector through anticipated changes in technology and market dynamics. His comments align with the broader view that congressional action is needed to preempt ad hoc or inconsistent regulatory actions that can unsettle markets and erode investor trust.
Industry alignment and governance questions
The CLARITY Act’s proponents argue that a clear delineation of which regulators oversee various crypto activities would reduce jurisdictional ambiguity and potential regulatory gaps. The broader market has been watching closely for signals about how the U.S. could harmonize oversight between agencies such as the CFTC and the SEC, while also addressing stablecoins as a critical asset class within the crypto ecosystem.
And while there is broad internal agreement on the need for a clear regulatory framework, negotiations are not without friction. Grewal’s remarks underscored a central sticking point: the yield mechanisms of stablecoins. A resolution on this issue appears essential to advancing to a formal markup in the Senate Banking Committee and, ultimately, a vote on the full Senate floor. The absence of consensus on stablecoins could delay movement even as other parts of the bill gain traction.
Regulators themselves have shown support for moving ahead with clear market structure legislation. Atkins’s comments reflect a shared industry sentiment that well-crafted rules would protect consumers, reduce exposure to rogue actors, and create an environment where legitimate crypto projects can flourish with a clear legal footing. This alignment between lawmakers and regulatory leaders could be a pivotal factor in determining whether the CLARITY Act gains the momentum it needs before the election cycle intensifies partisan debates around technology policy.
What this means for investors and builders
For investors, the prospect of a clear regulatory framework could reduce the legal and policy uncertainty that has weighed on asset prices and capital allocation in the crypto space. A well-defined regime may lower compliance risks for exchanges and on-chain platforms, potentially boosting institutional participation and retail confidence alike. For builders, a clarified map of permissible activities, responsible boundaries, and clear licensing expectations could accelerate product development and drive consumer adoption—provided that the final text resolves disputes that currently threaten to stall progress.
Historically, regulatory clarity has correlated with greater market maturity. If the CLARITY Act eventually becomes law, it could set a precedent for how the United States addresses both innovation and risk in digital assets. The timing, however, remains a crucial variable. With midterm elections looming, lawmakers may prioritize other issues, potentially delaying a milestone for the industry. Yet the breadth of support—from venture capital to founders of major crypto projects—signals a broad desire to move beyond debate and toward a functional framework that aligns incentives across the ecosystem.
What remains uncertain is whether the bill can bridge outstanding points of disagreement, particularly around stablecoins, before the Senate’s markup and subsequent floor vote. If those gaps persist, momentum may stall even as other provisions gain traction. Investors should monitor not only the political timetable but also the evolving stance of regulators on the practicalities of stability mechanisms and how they intersect with market structure legislation.
Beyond the U.S., observers note that global regulatory conversations increasingly mirror the desire for clarity and predictability. For markets that operate across borders, a clear U.S. standard could influence international norms, encouraging harmonization or at least mutual recognition of compliant activities. As the CLARITY Act advances, market participants will be watching for concrete milestones—whether a markup date, committee votes, or a White House signing ceremony—that would signal a durable shift toward regulatory certainty.
Readers should watch upcoming statements from lawmakers and industry leaders for clues about the bill’s trajectory, including how negotiators resolve stablecoin yield and other technical details. The next few weeks could prove decisive in determining whether the U.S. crypto sector gains a clear, implementable framework or faces a drawn-out path to regulatory clarity.

Live Gold, Crypto Trading | 9 April | #goldtrading #cryptotrading #bitcoin – MANSI
Man in hospital after being shot in the hand in Coleraine

Australia and US boost support for critical minerals with $3.5 billion

Why Israel is blocking foreign journalists from entering

Bitcoin: We’re Entering The Most Dangerous Phase

Alan Cumming Brands Baftas Ceremony A ‘Triggering S**tshow’
Live Gold, Crypto Trading | 9 April | #goldtrading #cryptotrading #bitcoin – MANSI

#finance #commerce#money #car #motivation #rich #makemoney #royalenfield

XRP 1000X WARNING!??!? (THEY CONFIRMED THE TRAIN HAS LEFT THE STATION)
-

 Business7 days ago
Three Gulf funds agree to back Paramount’s $81 billion takeover of Warner, WSJ reports
-

 Politics2 days ago
US brings back mandatory military draft registration
-

 Fashion2 days ago
Weekend Open Thread: Veronica Beard
-

 Tech5 days ago
How Long Can You Drive With Expired Registration? What Florida Law Says
-

 Fashion6 days ago
Massimo Dutti Offers Inspiration for Your Summer Mood Board
-
 Sports2 days ago
Man United discover Nico Schlotterbeck transfer fee as defender reaches Dortmund agreement
-

 Crypto World3 days ago
Canary Capital Files SEC Registration for PEPE ETF
-

 Fashion5 days ago
Let’s Discuss: DEI in 2026
-

 Business2 days ago
Tesla Model Y Tops China Auto Sales in March 2026 With 39,827 Registrations, Beating Cheaper EVs and Gas Cars
-

 Crypto World4 days ago
Bitcoin recovers as US and Iran Agree a Ceasefire Deal
-

 Politics2 days ago
Malcolm In The Middle OG Turned Down ‘Buckets Of Money’ To Appear In Reboot
-

 Business2 days ago
OpenAI Halts Stargate UK Data Centre Project Over Energy Costs and Copyright Row
-

 Business20 hours ago
Ireland Fuel Protests Enter Day 5 as Blockades Spark Shortages and Government Prepares Support Package
-

 Tech6 days ago
Gamer Restores the Original PlayStation Portal From Two Decades Ago
-

 Tech6 days ago
Italian court says Netflix must refund customers up to $576 over price hikes
-

 Tech6 days ago
Samsung just gave up on its own Messages app
-

 Tech6 days ago
Haier is betting big that your next TV purchase will be one of these
-

 Tech6 days ago
The Xiaomi 17 Ultra has some impressive add-ons that make snapping photos really fun
-

 Politics2 days ago
LBC Presenter Mocks Trump Over Iran War Failures
-

 Tech6 days ago
Save $130 on the Samsung Galaxy Watch 8 Classic: rotating bezel, sleep coaching, and running coach for $369
You must be logged in to post a comment Login