
Crypto World
Cardano Price Reversal Failed As Whales Sold $540 Million Into It
The Cardano price flashed a textbook bullish divergence on the daily chart, surged 24%, then collapsed. On-chain data reveals a coordinated whale exit worth over $540 million into the rally — even as the Money Flow Index confirmed retail was actively buying the dip.
Here’s what happened, and what it means next.
Daily RSI Divergence Fired & MFI Confirmed the Move
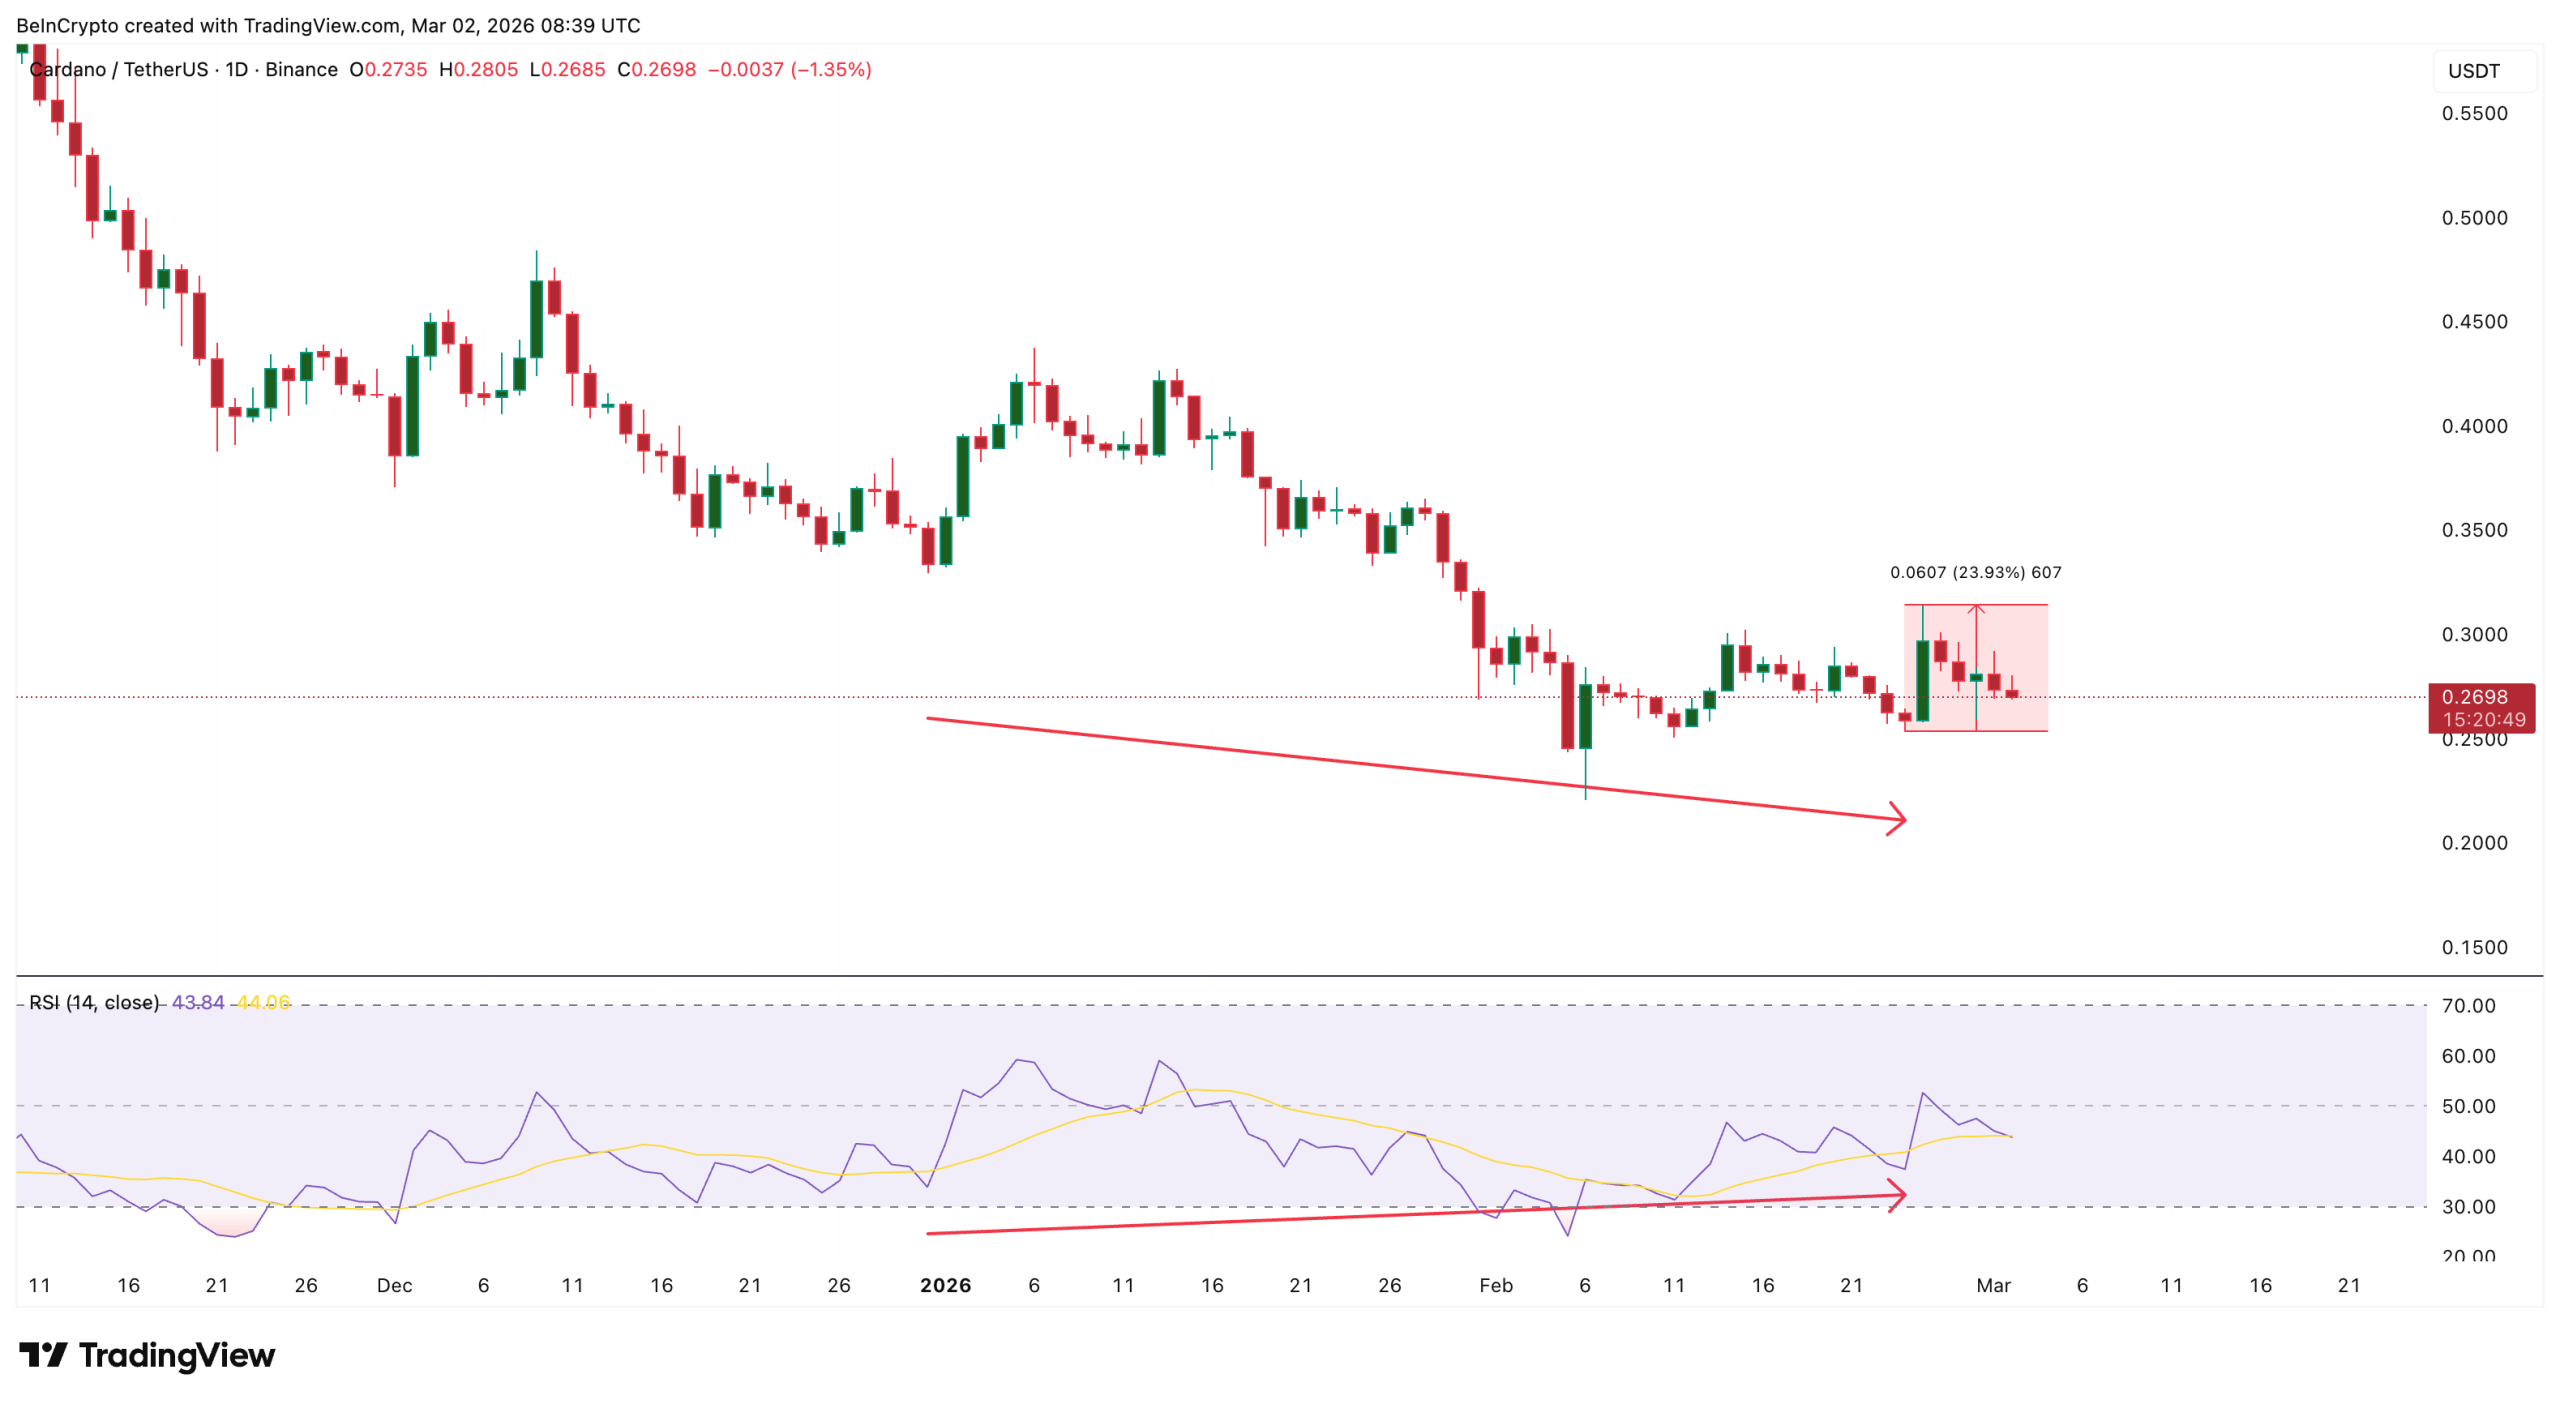
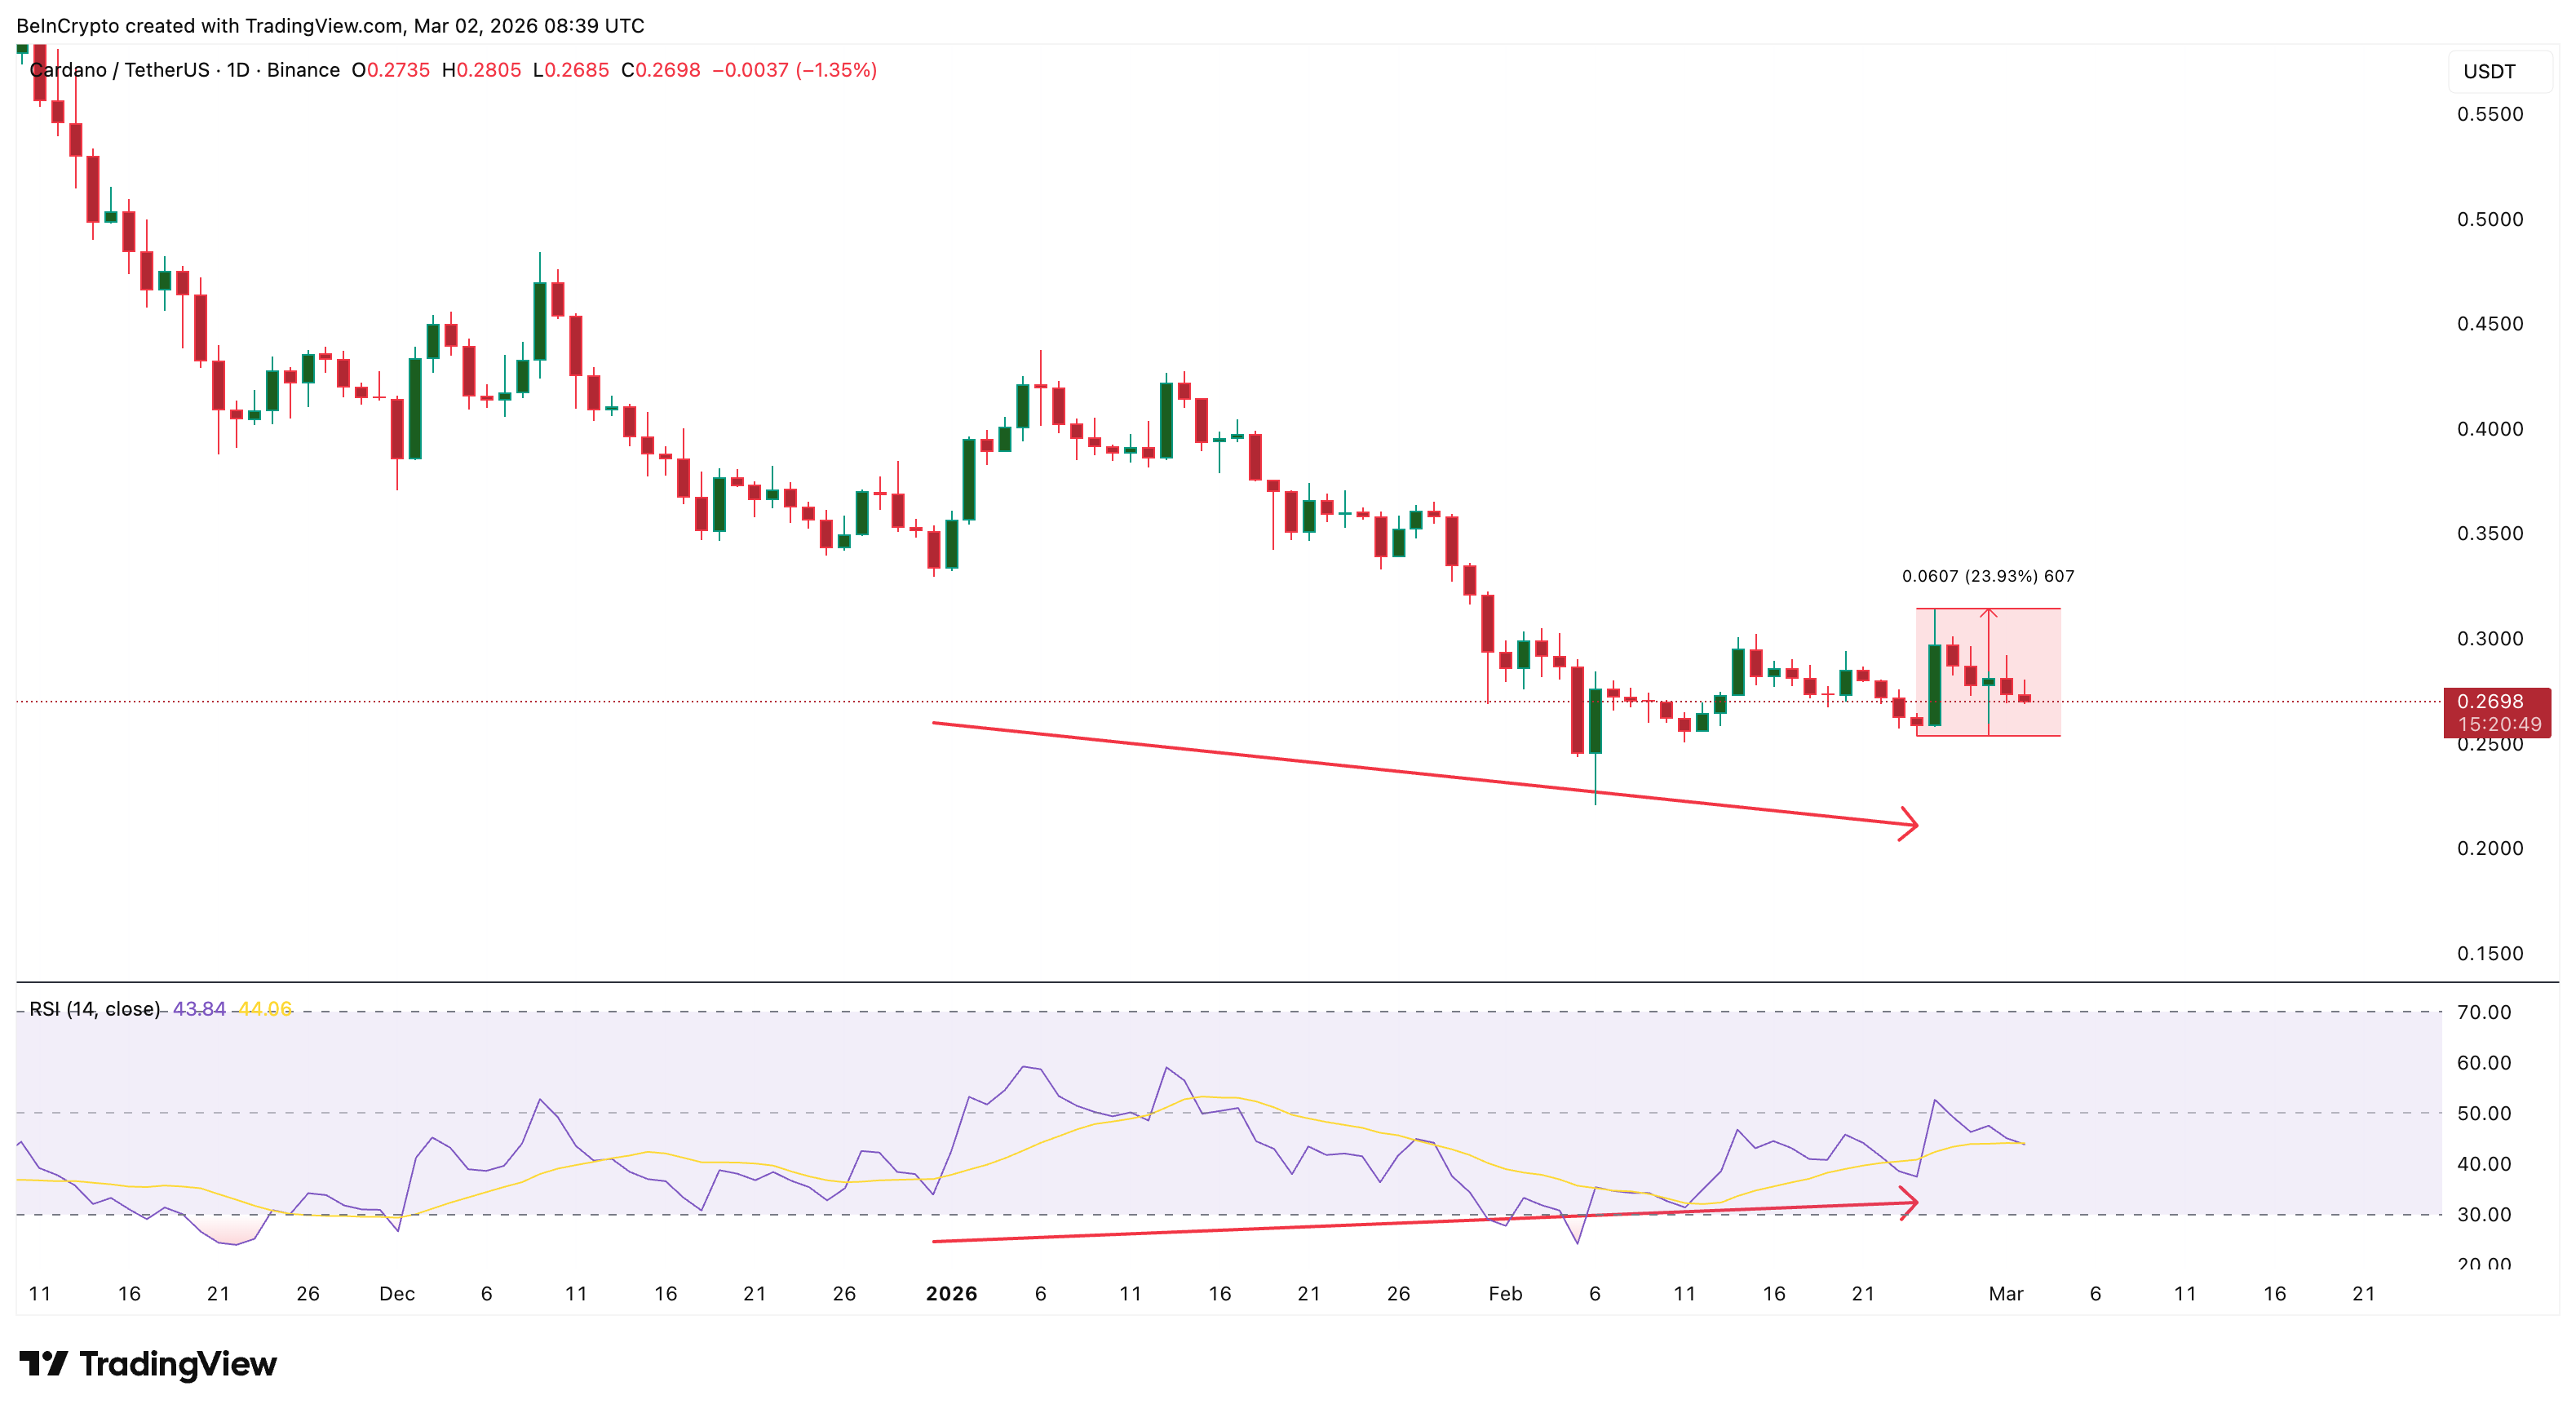
Between December 31, 2025, and February 24, 2026, ADA’s daily chart built a bullish divergence. The Cardano price printed a lower low, between the late-December range and the February 24 low. Meanwhile, the Relative Strength Index (RSI), a momentum oscillator, formed a higher low.
When price makes a lower low but RSI makes a higher low, it signals that bearish momentum is weakening even as price continues to fall.
The signal resolved on February 25 when ADA surged nearly 24%, briefly touching $0.31 before posting a long upper wick — a candlestick structure indicating aggressive selling into the highs.
Want more token insights like this? Sign up for Editor Harsh Notariya’s Daily Crypto Newsletter here.
What makes this setup more interesting is that the Money Flow Index backed it up. The MFI is a volume-weighted momentum indicator that combines both price and volume to measure buying and selling pressure, scored from 0 to 100. Unlike the RSI, which only considers price, MFI factors in trading volume — making it a more direct proxy for whether real capital is flowing into or out of an asset.
Between February 24 and 28, both price and MFI trended higher together. There was no bearish MFI divergence. This means the dips were being genuinely bought with volume conviction, not just price drifting upward on thin liquidity. Someone was actively absorbing sell pressure.
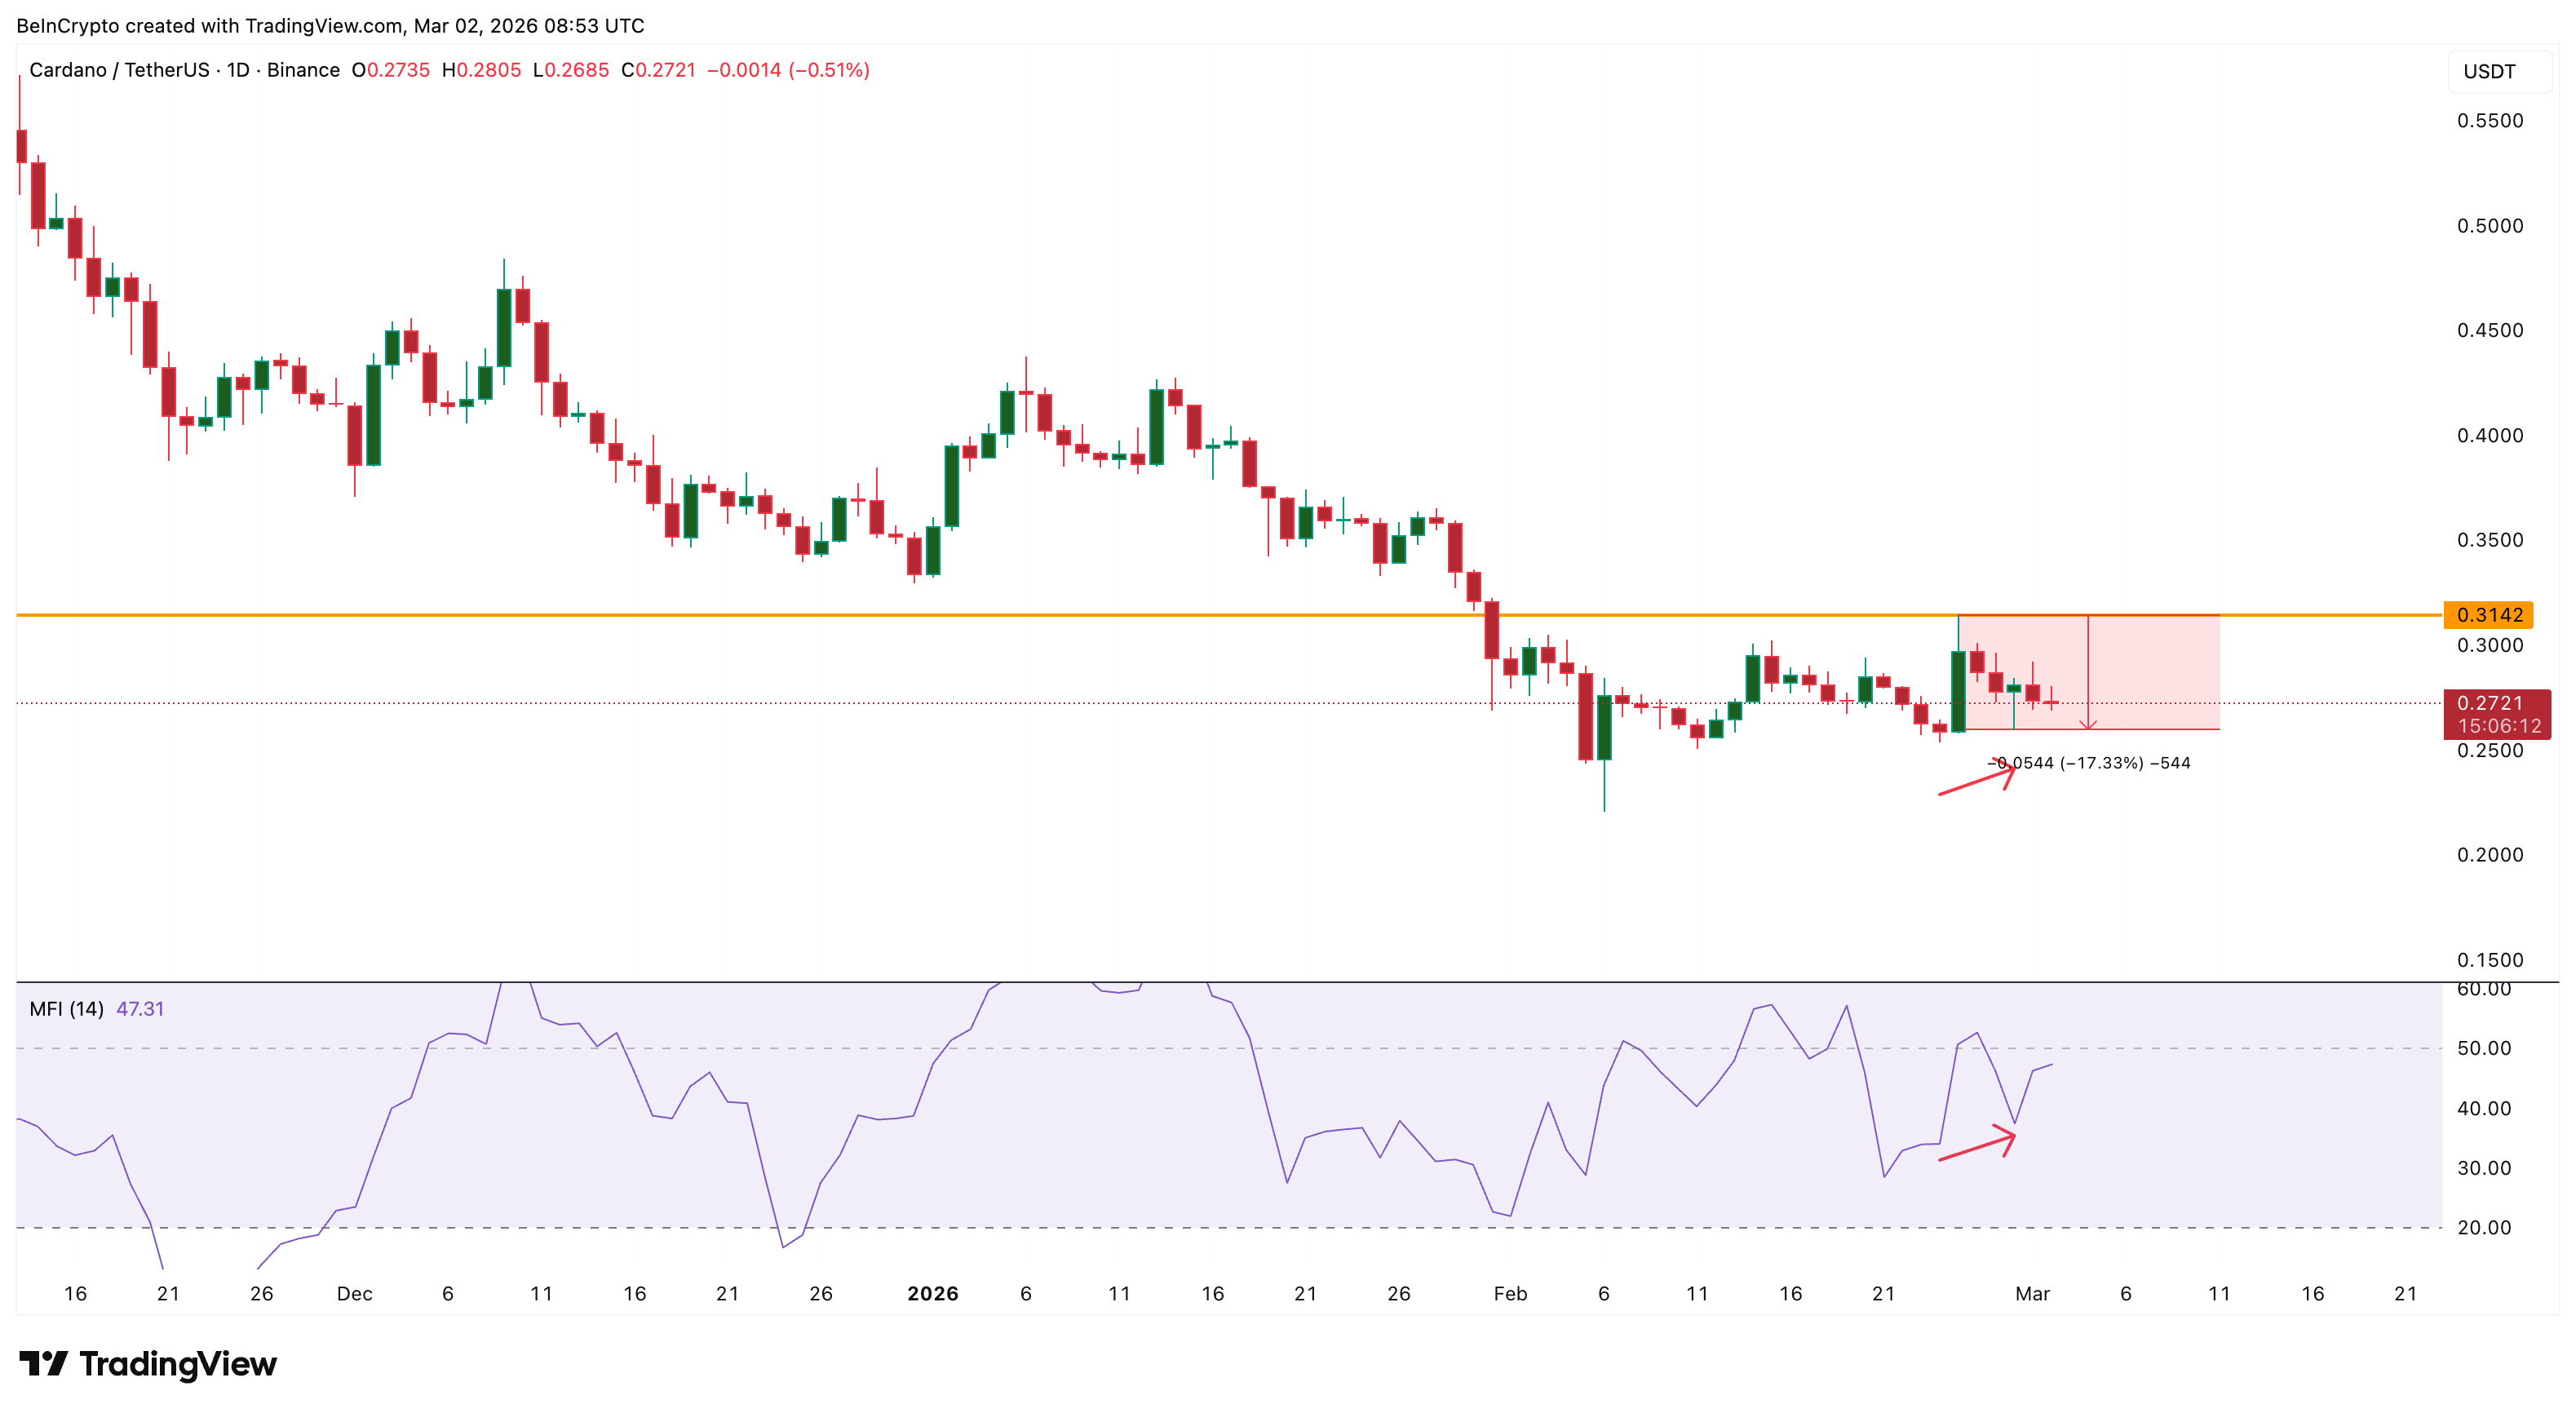
So the RSI divergence fired. MFI confirmed genuine buying support. ADA jumped 24%. And yet, from that February 25 peak, the price fell 17% within days. If the technical setup was valid and dip-buying was real, what killed the rally?
Over 2 Billion ADA Distributed in 3 Days: The Whales Were the Sellers
The answer is on-chain. Santiment’s supply distribution data reveals that between February 24 and 27, every major whale cohort reduced its holdings simultaneously.
The 1 billion-plus ADA cohort executed the largest single exit. It shed roughly 1.02 billion tokens in a single day between February 24 and 25 — dropping from 2.90 billion to 1.88 billion ADA.
The 100 million to 1 billion cohort initially picked up tokens on February 24, likely absorbing some of that initial sell, but then reversed aggressively by February 27, dropping from 3.47 billion to 2.61 billion ADA — a reduction of approximately 860 million tokens.
The 10 million to 100 million cohort shed around 220 million ADA over the same window, declining from 13.90 billion to 13.68 billion. Even the smallest whale tier, the 1 million to 10 million holders, reduced from 5.69 billion to 5.64 billion, offloading roughly 50 million tokens.
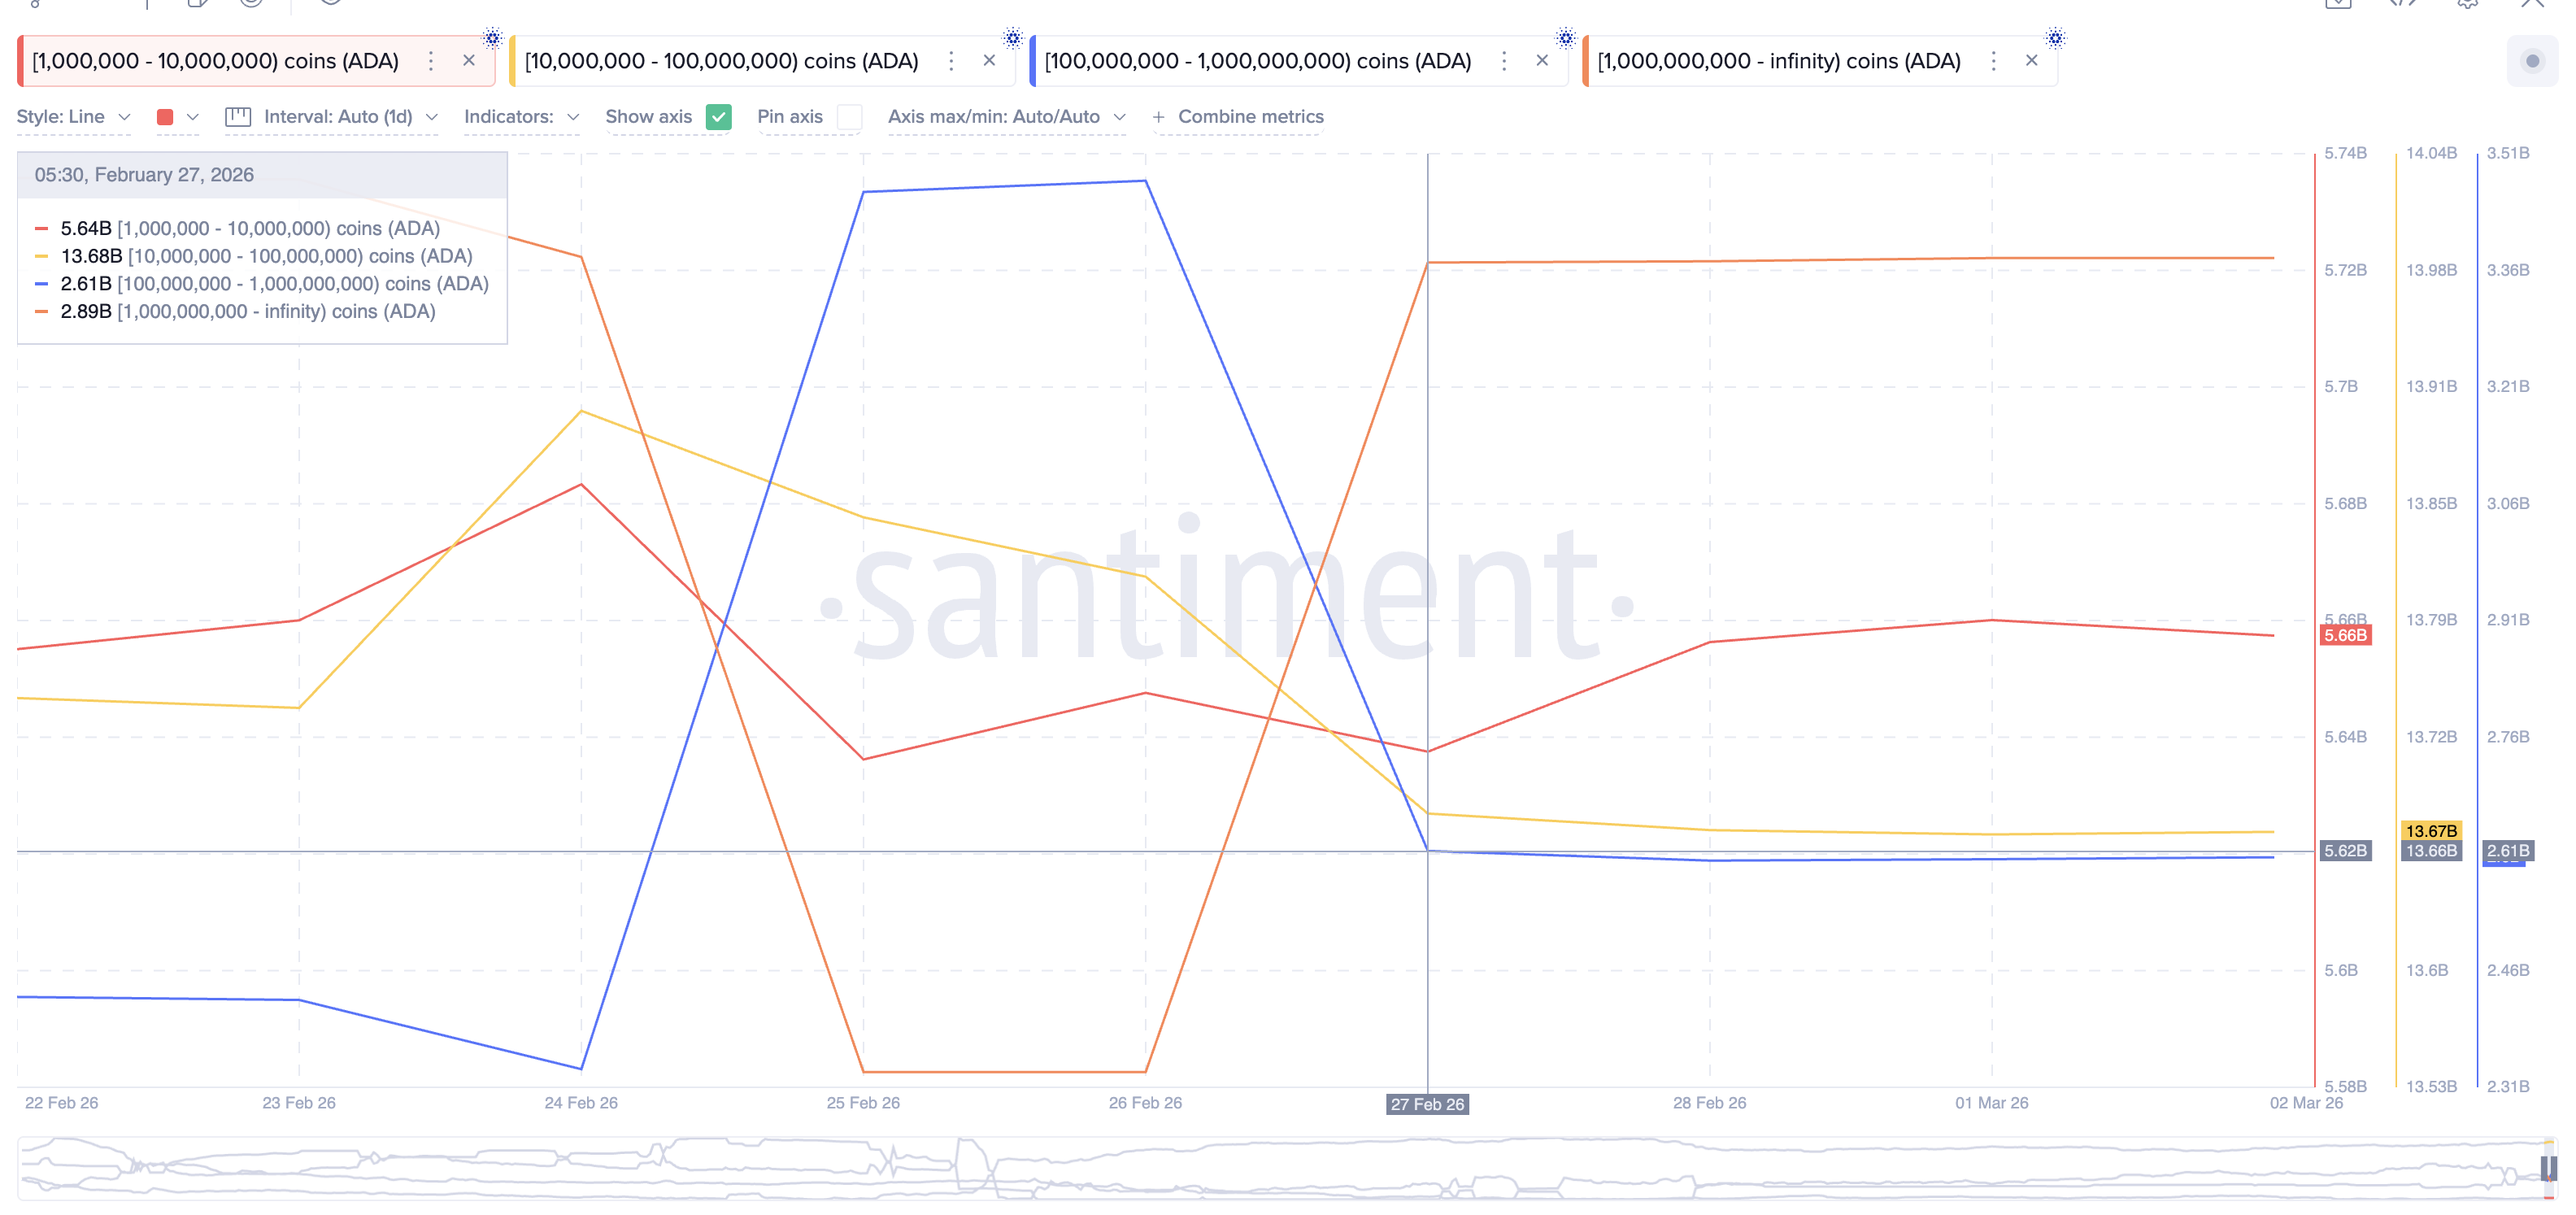
In total, approximately 2.15 billion ADA was distributed across all four cohorts within three days. At the average price of roughly $0.27 during this window, that amounts to approximately $540 million in concentrated sell pressure — all hitting the market during a rally that retail was actively buying into.
This is why the MFI data is so revealing. The MFI confirmed genuine buying support. The whale data confirms where the selling came from. Retail and mid-tier addresses were absorbing whale supply on the way up, but $540 million in distribution over 72 hours simply overwhelmed that demand.
Derivatives Data Adds Weight To ADA Breakdown
The derivatives market reinforces this picture. Cardano’s futures open interest had already collapsed from $1.95 billion September peak to below $450 million by mid-February. One of the lowest levels this year. This meant that leveraged retail had largely exited before the divergence even fired.
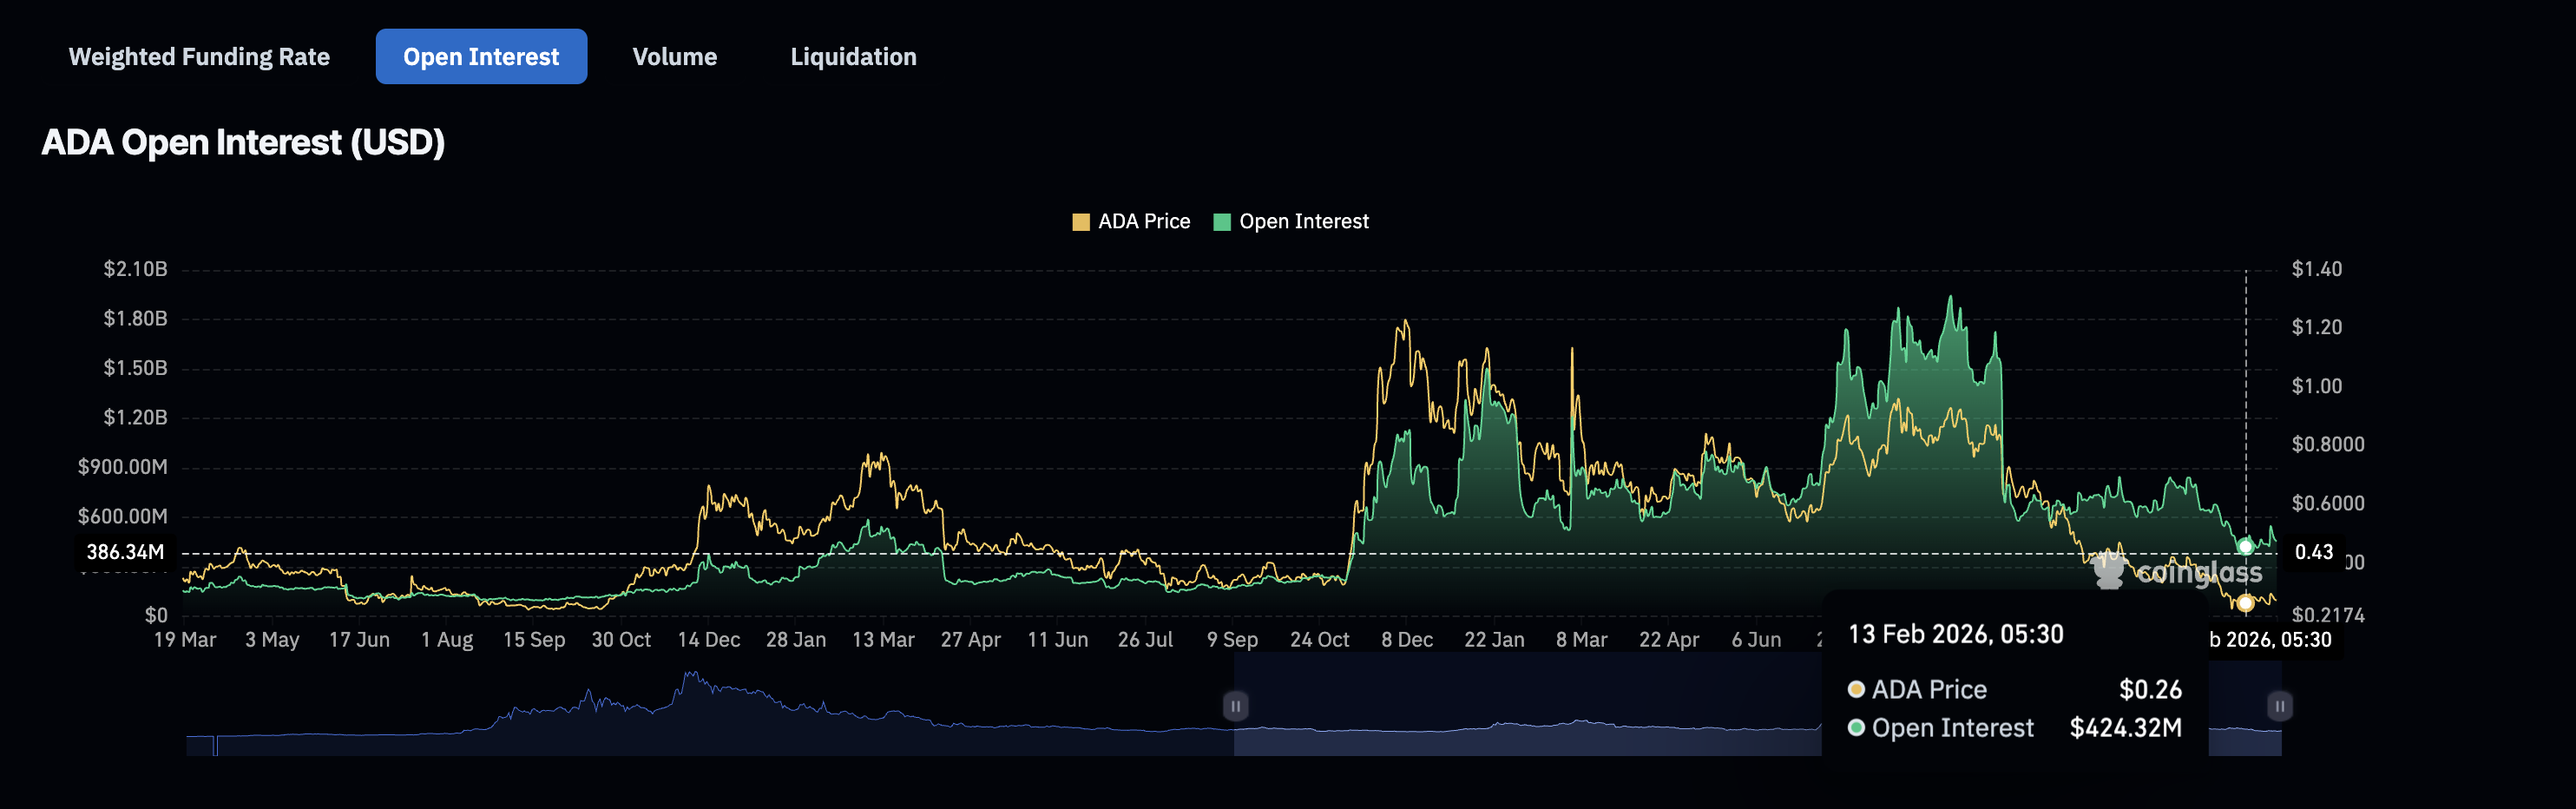
The buying MFI captured was therefore likely spot-driven: retail accumulating on the dip, using RSI divergence as conviction. But spot buying alone could not absorb the scale of whale distribution.
Cardano Price Action: Lower Lows Persist, Whale Re-Entry Becomes the Key Signal
ADA’s daily price structure remains lower as of March 2 (relative to late December), trading at $0.27, while the RSI continues to print higher lows (again relative to late December). This means the divergence framework is still technically alive, even after the late-February failure. A new swing low could trigger it again.
On the upside, $0.31 is the line in the sand. This was the exact rejection level on February 25. A daily close above this level would mark the first structural break in the downtrend, opening a path toward $0.37.
On the downside, a loss of $0.26 would confirm the weakness. Below that, the $0.23 and $0.21 levels become critical.
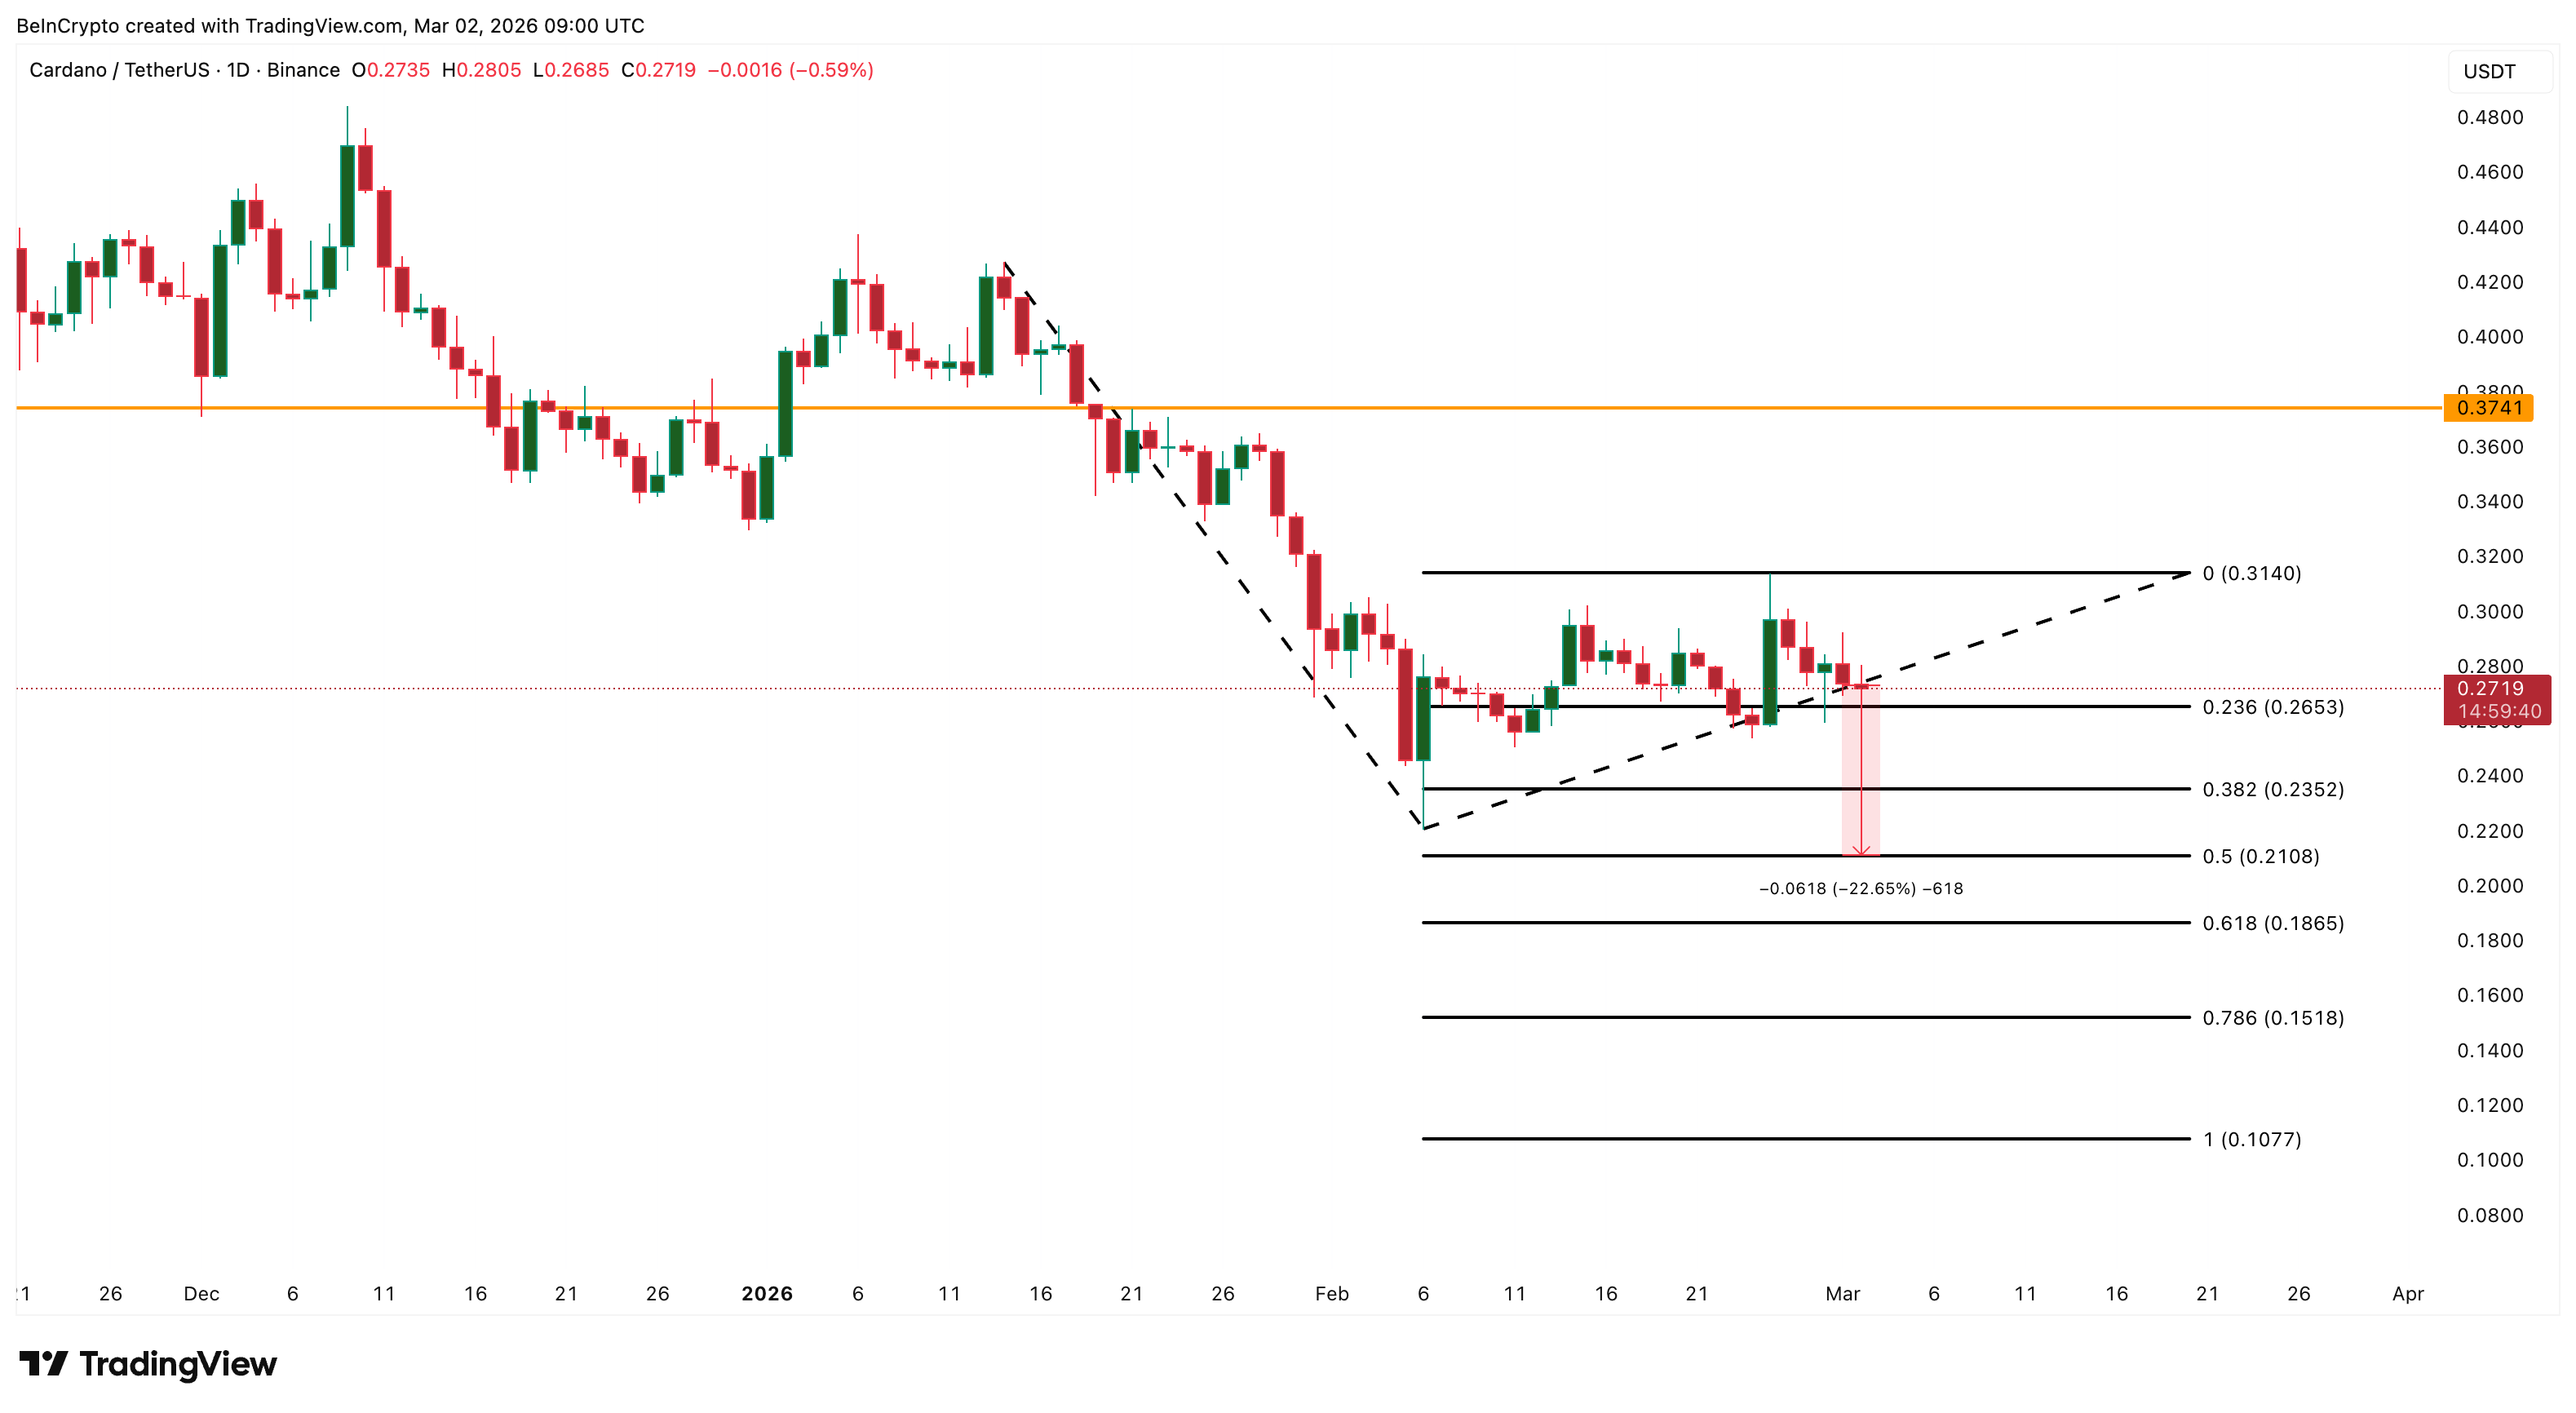
If $0.21 fails, deeper Fibonacci extensions at $0.18 (0.618) and $0.15 (0.786) come into play.
But the most important variable for Cardano’s next move is not a price level. It is whether the whales start buying again. As of March 2, Santiment data shows that major holders have not resumed significant accumulation.
If ADA declines toward $0.21 or lower and whale cohorts begin to re-accumulate, as they did earlier, it would represent a considerably stronger setup than February delivered. The moment whales resume buying can be treated as a potential local bottom signal.
For the next divergence to succeed, it needs whale participation as confirmation, not contradiction. Until that happens, the Cardano price structure could continue to point lower.


Key Highlights
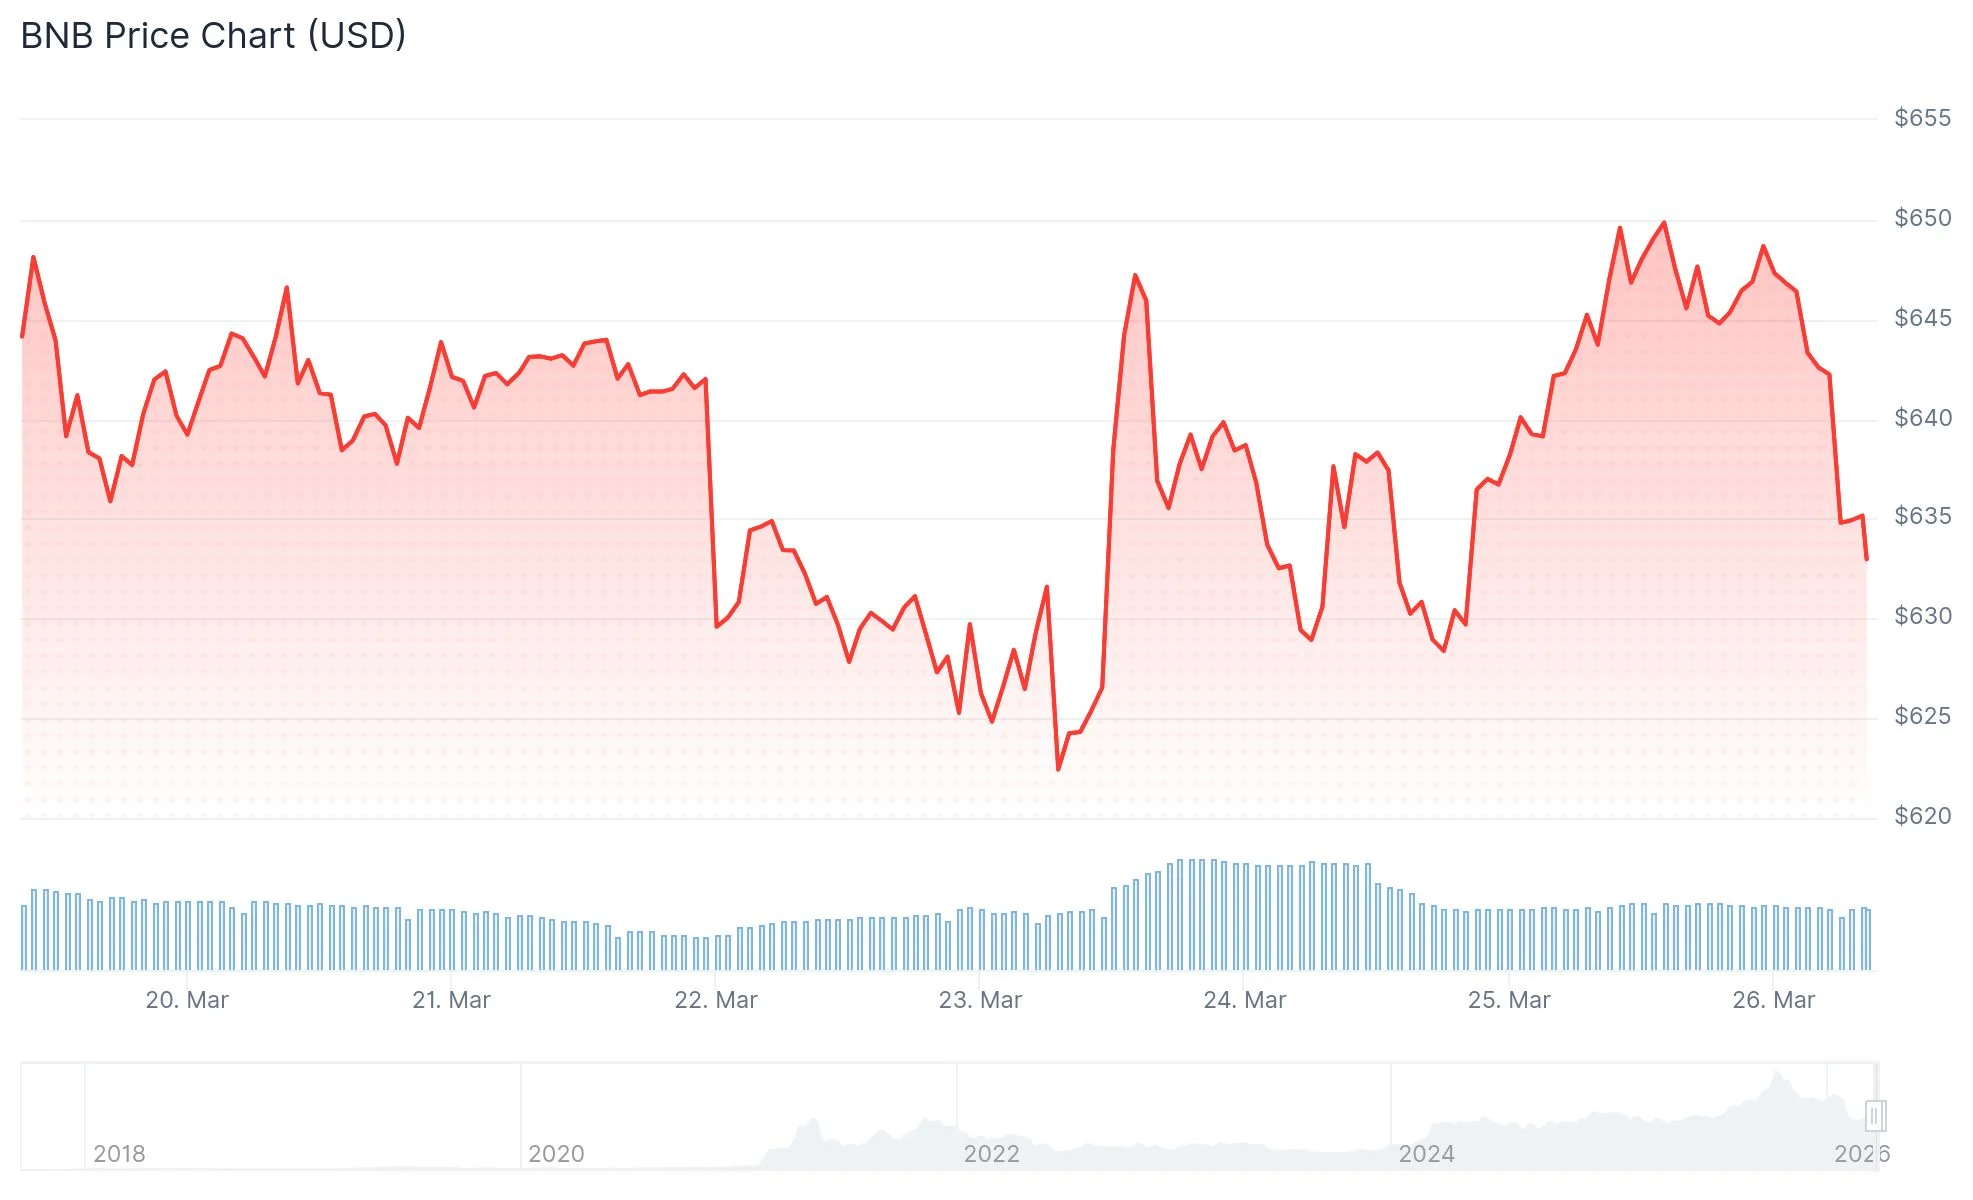
- Binance Coin recovered from a weekend low of $627 to reach approximately $648, driven by renewed positive market momentum.
- Futures open interest for BNB jumped 6.5% to reach $923 million, while Binance’s long/short ratio exceeded 2.21.
- Technical analysis shows BNB maintaining position above a critical ascending trendline within a bullish parallel channel pattern.
- A bullish crossover has formed as the 20-day SMA moved above the 50-day SMA, while BNB remains 53% below its peak price.
- Market analysts project price targets spanning from $2,000 to $5,000, supported by historical cycle analysis and fundamental on-chain metrics.
Binance Coin experienced a notable recovery from its weekend low of $627, pushing back toward the $648 level by Monday, March 25. This upward movement coincided with improved overall crypto market conditions as geopolitical concerns between the U.S. and Iran showed signs of de-escalation.
West Texas Intermediate crude oil retreated from $100 to approximately $87 per barrel as international tensions cooled. During this same timeframe, Bitcoin recovered above the $71,000 threshold while Ethereum neared $2,200. Equity markets across Asia, including Japan’s Nikkei 225, Hong Kong’s Hang Seng, and the Shanghai Composite, similarly recorded positive sessions.
According to CoinGlass derivatives data, BNB’s open interest expanded by 6.5% over a 24-hour period, reaching $923 million. On Binance specifically, the long/short ratio climbed above 2.21, indicating that bullish positions significantly outnumber bearish ones among active traders.
Technical Indicators Signal Continued Bullish Momentum
Chart analysis reveals BNB operating within an ascending parallel channel formation on the daily timeframe. The cryptocurrency has successfully maintained its position above the lower boundary of this channel, which has provided reliable dynamic support throughout recent weeks.
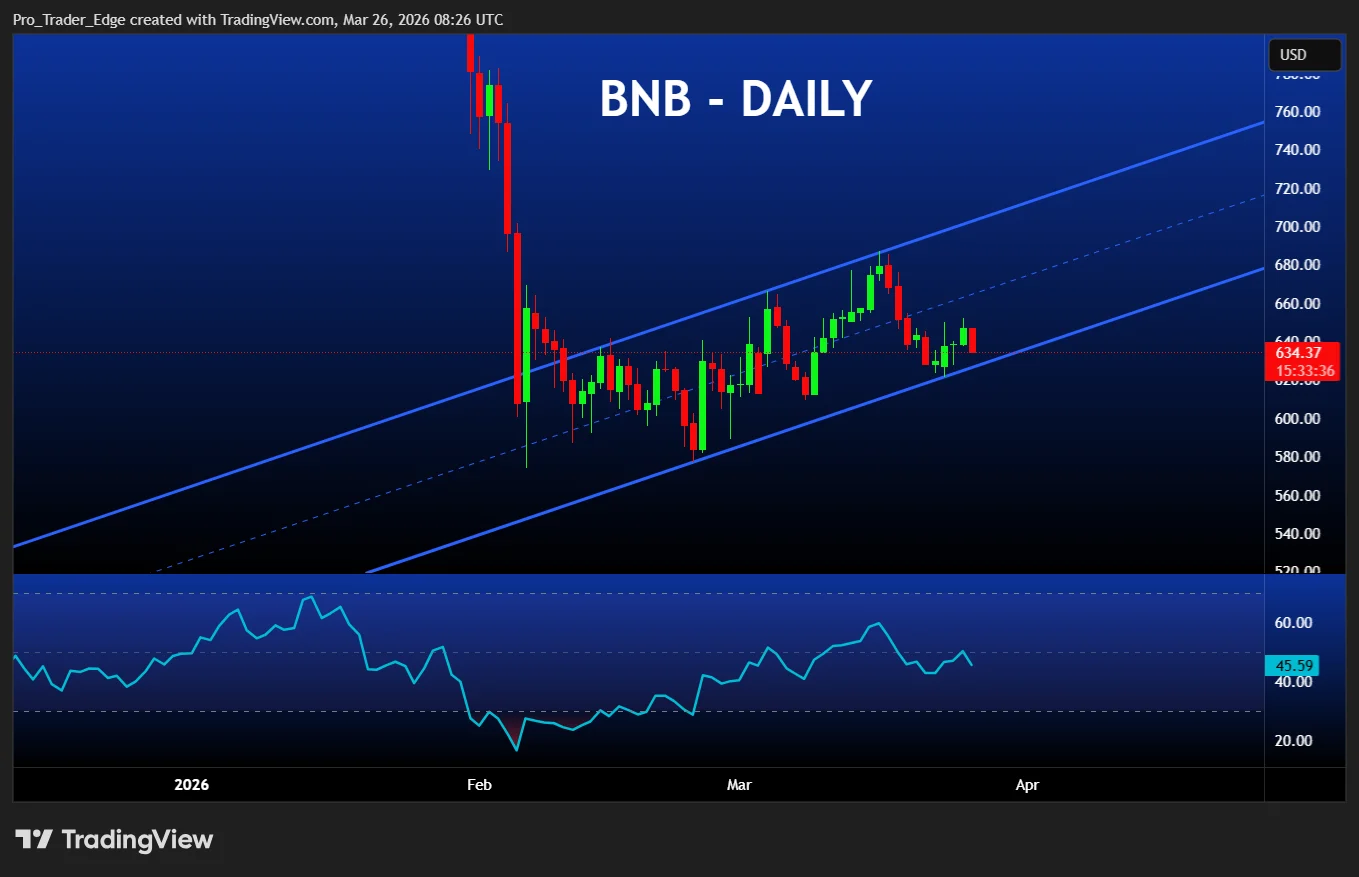
A significant development has occurred with the 20-day simple moving average (SMA) crossing above the 50-day SMA. This bullish crossover typically indicates strengthening short-term momentum favoring buyers over sellers. Meanwhile, the relative strength index (RSI) is hovering near neutral territory, implying additional upside potential remains available.
The immediate resistance zone to monitor sits at $685, a price level that has previously rejected upward attempts multiple times this month. Successfully breaking through this barrier could pave the way toward the 100-day SMA positioned around $750. Conversely, a decline beneath $600 would challenge the current constructive technical formation.
With BNB currently valued 53% below its historical peak, substantial recovery potential exists assuming market conditions remain favorable.
Crypto analyst Patel highlighted BNB’s position 53% off its all-time high, referencing historical patterns, ongoing token burn mechanisms, and robust fundamental indicators as justification for ambitious long-term price targets ranging from $2,000 to $5,000 and potentially $10,000, while identifying $300-$420 as an ideal accumulation range.
Token Economics and Network Utility Drive Underlying Value
BNB maintains significant utility across the Binance platform infrastructure. The token serves multiple functions including transaction fee payments, trading fee reductions, and various blockchain-related services, creating consistent organic demand.
Binance implements systematic token burn events that progressively reduce BNB’s circulating supply. These quarterly burns are viewed favorably by market analysts as a deflationary mechanism that complements expanding on-chain usage and network activity.
The previous accumulation range between $300 and $420 has been successfully cleared, and cycle-based projection models now suggest potential price zones between $2,000 and $5,000. These forecasts derive from historical market cycle analysis and structural data patterns.
As of March 26, BNB continues trading near $648 with the critical $600 support level holding firm.

Investigators have frozen about $1.2 million as efforts continue to trace funds lost in a wallet breach linked to a seed phrase compromise.
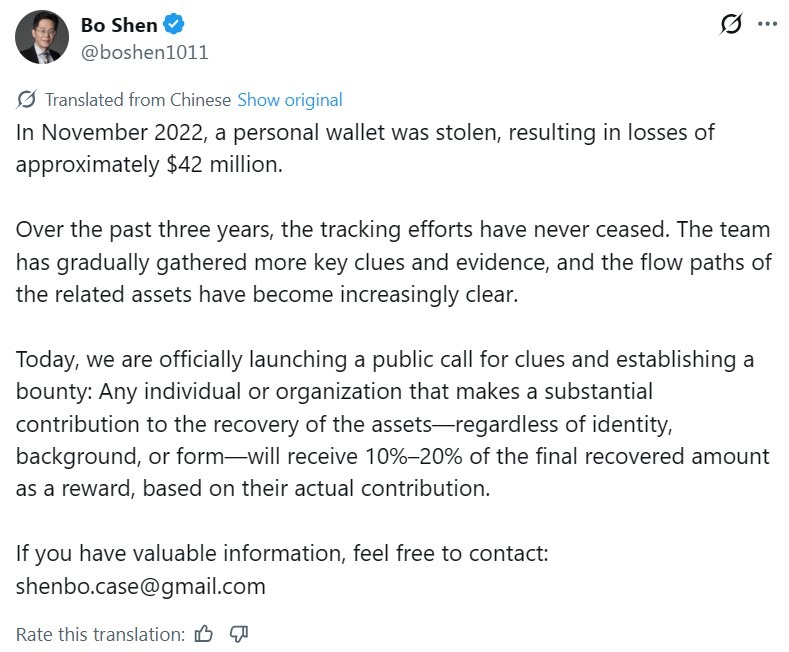
Bo Shen, the co-founder of venture capital firm Fenbushi Capital, offered a bounty to recover about $42 million in digital assets stolen from his personal wallet in a 2022 hack.
Shen said Thursday that he was offering a 10%-20% bounty on the recovered amount to any individual or organization that makes a substantial contribution to recovering the assets. Shen said onchain investigators ZachXBT and Taylor “Tayvano” Monahan had already helped freeze about $1.2 million in related assets. He said his team would distribute rewards once the recovery is complete.
The bounty revives a case Shen first disclosed in November 2022, when he said roughly $42 million in crypto had been drained from his personal wallet. At the time, he said the stolen funds were personal and did not affect Fenbushi-related entities.
Blockchain analytics company SlowMist later said the theft was caused by a compromise of Shen’s mnemonic seed phrase. Shen said the renewed push comes after investigators developed new leads and a clearer picture of how the stolen assets moved, though any recovery remains uncertain.

SlowMist said the stolen assets included about $38.2 million in USDC (USDC), 1,607 Ether (ETH), nearly 720,000 USDt (USDT) and 4.13 Bitcoin (BTC). These assets were later moved through exchanges, including ChangeNow and SideShift.
Shen says improved tracing tools expanded recovery efforts
Shen said onchain tracking and security investigation tools were less developed when the hack occurred in 2022, limiting the ability to trace funds across chains and platforms.
He said that recent advances in artificial intelligence-driven data analysis and onchain forensics improved the ability of investigators to follow asset flows and identify relevant transaction patterns.
Related: Hacked crypto tokens drop 61% on average and rarely recover, Immunefi report says
Shen said the effort could also serve as a test case for how newer tools and coordination methods can support long-running investigations. He said the case highlights how technological progress may expand what is possible in tracing and responding to crypto-related incidents.
However, any recovery remains uncertain, even with better tracing tools and fresh leads.
Magazine: Are DeFi devs liable for the illegal activity of others on their platforms?

Key Highlights
- TAO rallied 140% across six weeks, touching an intraday peak of $377.8 on March 25
- The TAO/BTC trading pair jumped nearly 78% this month, indicating capital flow away from Bitcoin
- Social engagement reached its second-highest recorded level, though positive sentiment stays moderate at 1.5:1 ratio
- March 2026 trading volume reached $5.7 billion, marking the strongest monthly performance in Q1
- Staked TAO across subnets expanded from $74,400 to over $620 million within twelve months
Bittensor (TAO) has delivered a 140% gain over the last six weeks, with the bulk of this appreciation occurring throughout March 2026. The cryptocurrency reached an intraday peak of $377.8 on March 25, marking its strongest level since mid-November 2025. Currently, TAO is trading at $341.7.
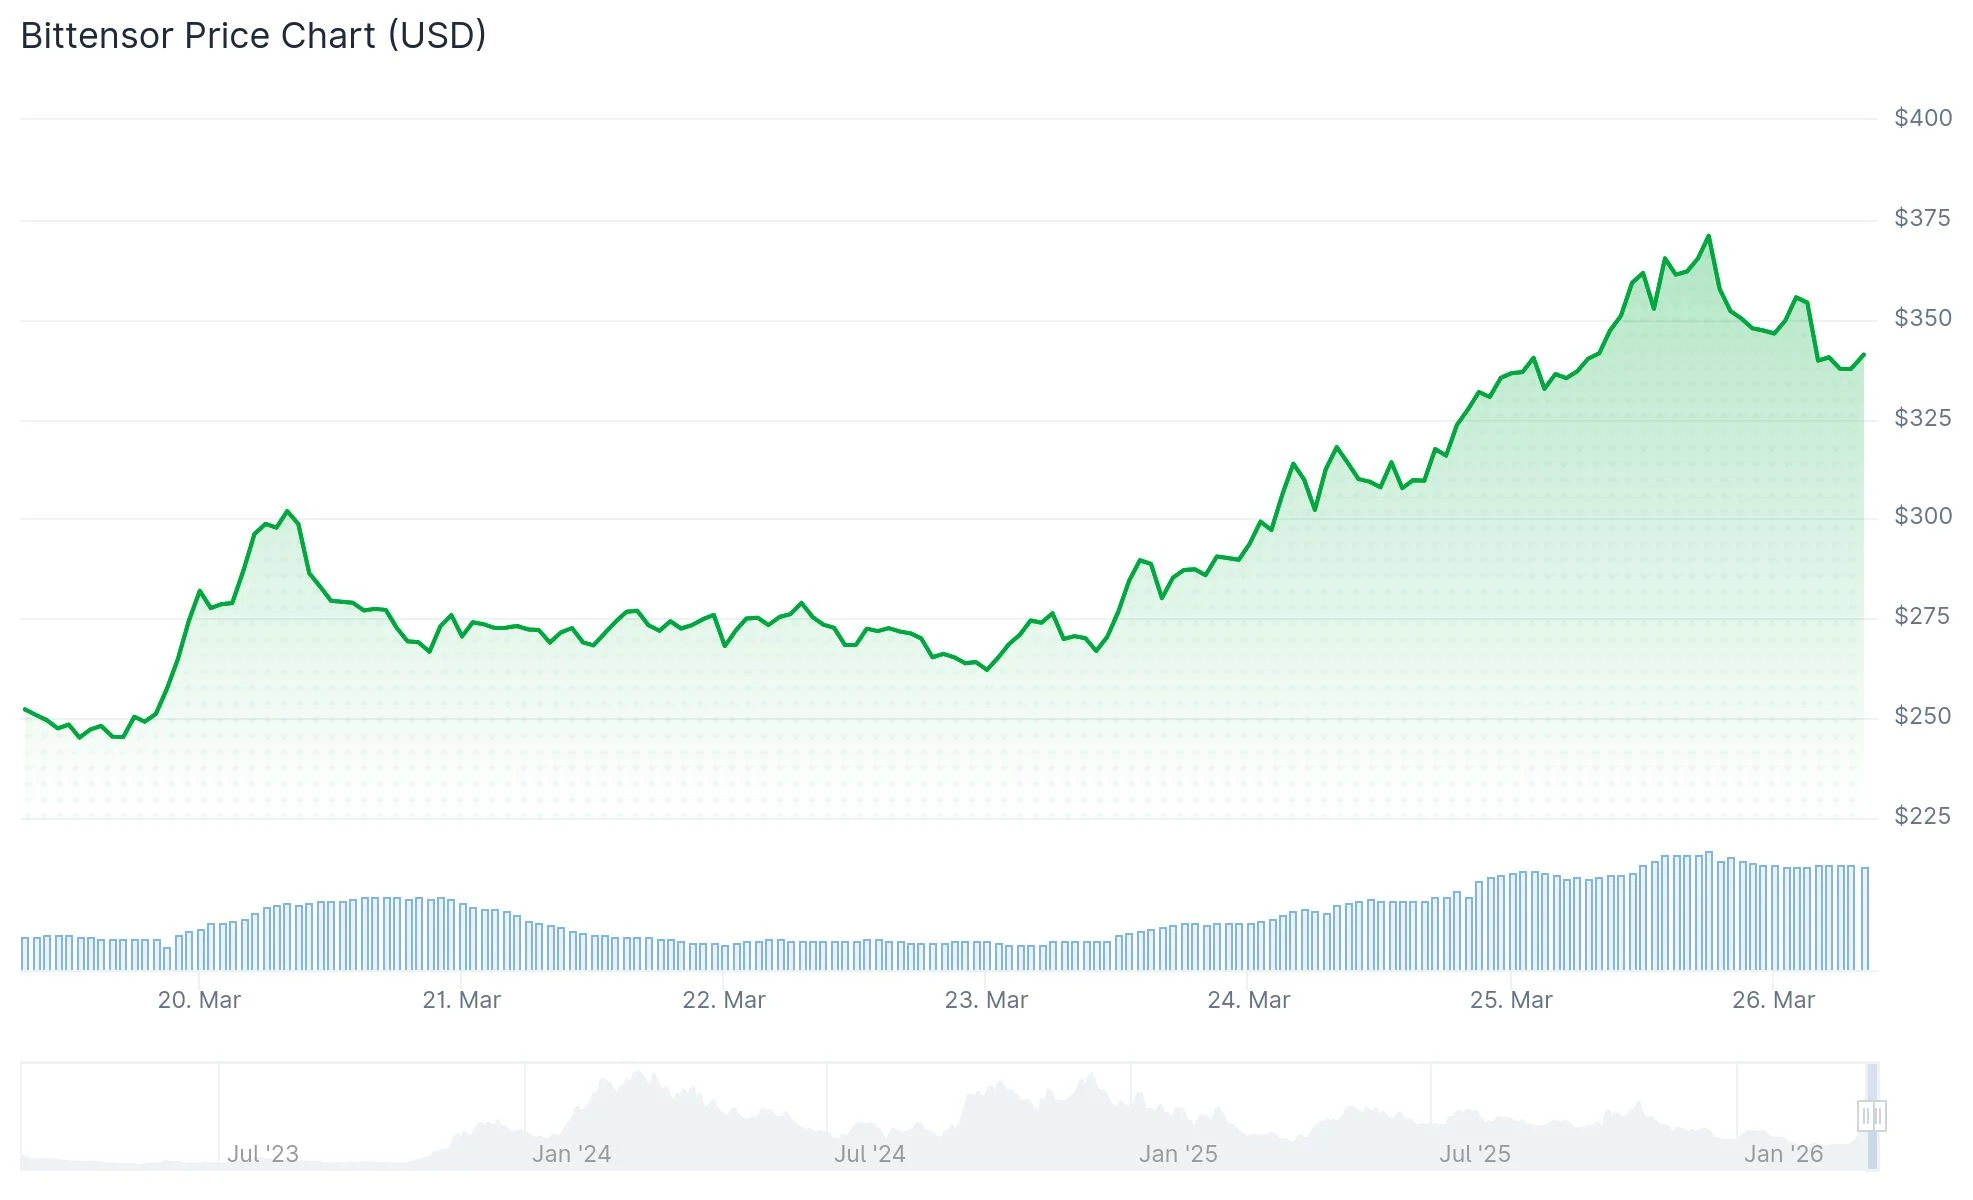
This impressive performance has positioned TAO among the top-performing large-cap digital assets this month. The token currently holds the 26th position in market capitalization rankings.
The decentralized artificial intelligence theme has emerged as a primary catalyst. Market participants have been shifting capital toward decentralized machine learning initiatives, with Bittensor positioned prominently within this sector.
The TAO/BTC pair appreciated nearly 78% during March. This suggests substantial capital has migrated into TAO from Bitcoin positions. Meanwhile, Bitcoin’s trading activity has registered its weakest levels for the first quarter of 2026.
A comparable dynamic emerged in October 2025, when the TAO/BTC ratio surged 66% while BTC declined more than 6%. That capital rotation eventually reversed, with the ratio declining 50% in subsequent months.
Social Engagement Rises Without Excessive Optimism
Despite the substantial price appreciation, sentiment metrics from Santiment paint a nuanced picture. Social discussion volume for TAO has climbed to its second-highest level ever across X, Reddit, and Telegram. Only the period preceding TAO’s $529 all-time high on November 1, 2025, generated greater social activity.
However, the sentiment composition remains balanced rather than exuberant. Santiment data shows only 1.5 positive mentions for each negative comment. The analytics platform suggests this is “generally a good sign,” as price rallies accompanied by moderate enthusiasm typically experience reduced selling pressure from speculative traders.
On-Chain Metrics Support Price Action
Bittensor’s subnet ecosystem has expanded in tandem with token valuation. Subnets function as specialized networks within Bittensor’s infrastructure that execute AI-related computations. Market observers indicate this correlated growth implies the rally has fundamental support beyond speculation.
The total value of TAO staked throughout subnets increased from approximately $74,400 to exceeding $620 million during the past twelve months.
March 2026 witnessed TAO’s monthly trading volume reach $5.7 billion, representing the highest figure recorded in the first quarter. Token Terminal analytics verify this as the strongest monthly volume performance for the asset year-to-date.


The UK government is moving toward a temporary ban on political donations made through cryptocurrencies after a fresh review raised concerns about foreign money entering British politics.
Summary
- Keir Starmer confirmed a moratorium on crypto political donations during House of Commons questioning Wednesday
- UK lawmakers linked crypto donations to foreign interference risks and weak transparency in elections
- Proposed ban would stay until Parliament and Electoral Commission approve stronger donation safeguards
Prime Minister Keir Starmer confirmed on March 25 that the government will pursue a moratorium while wider safeguards are prepared. Starmer told the House of Commons that the government will act to protect the country’s political system. He said,
”That will include a moratorium on all political donations made through cryptocurrencies.”
The move followed the Rycroft Review, which examined foreign financial interference in UK politics. A parliamentary committee also backed an immediate ban on crypto political donations until stronger rules are in place.
The government said crypto donations will be blocked until the rules are strong enough to deal with untraceable money and foreign interference. The plan is tied to wider efforts to tighten political finance rules under the Representation of the People Bill.
Official bill material says the proposed change would ban or pause cryptocurrency donations while further review takes place. The same material also links the policy to risks from anonymous payment methods in elections.
Furthermore, the change is not law yet. The Representation of the People Bill is still at committee stage in the House of Commons and must pass both Houses of Parliament before receiving royal assent.
The government said the measure would take retrospective effect from March 25, 2026. Once the law comes into force, parties, candidates, and other regulated groups would have 30 days to return unlawful donations received during that period before enforcement can begin.
Ban stays until regulators approve the framework
The government said the moratorium would remain in place until Parliament and the Electoral Commission are satisfied that the rules are robust enough to support confidence and transparency in this area. That means the restriction would not end automatically after passage.
The issue has gained attention since Reform UK began accepting crypto donations in 2025. The next UK general election must be held by August 15, 2029, which gives lawmakers time to decide whether a permanent framework will replace the temporary ban.
Crypto World
Chainlink (LINK) Price Update: $14.8M Whale Transfer and Coinbase Partnership Signal Market Shifts
Key Highlights
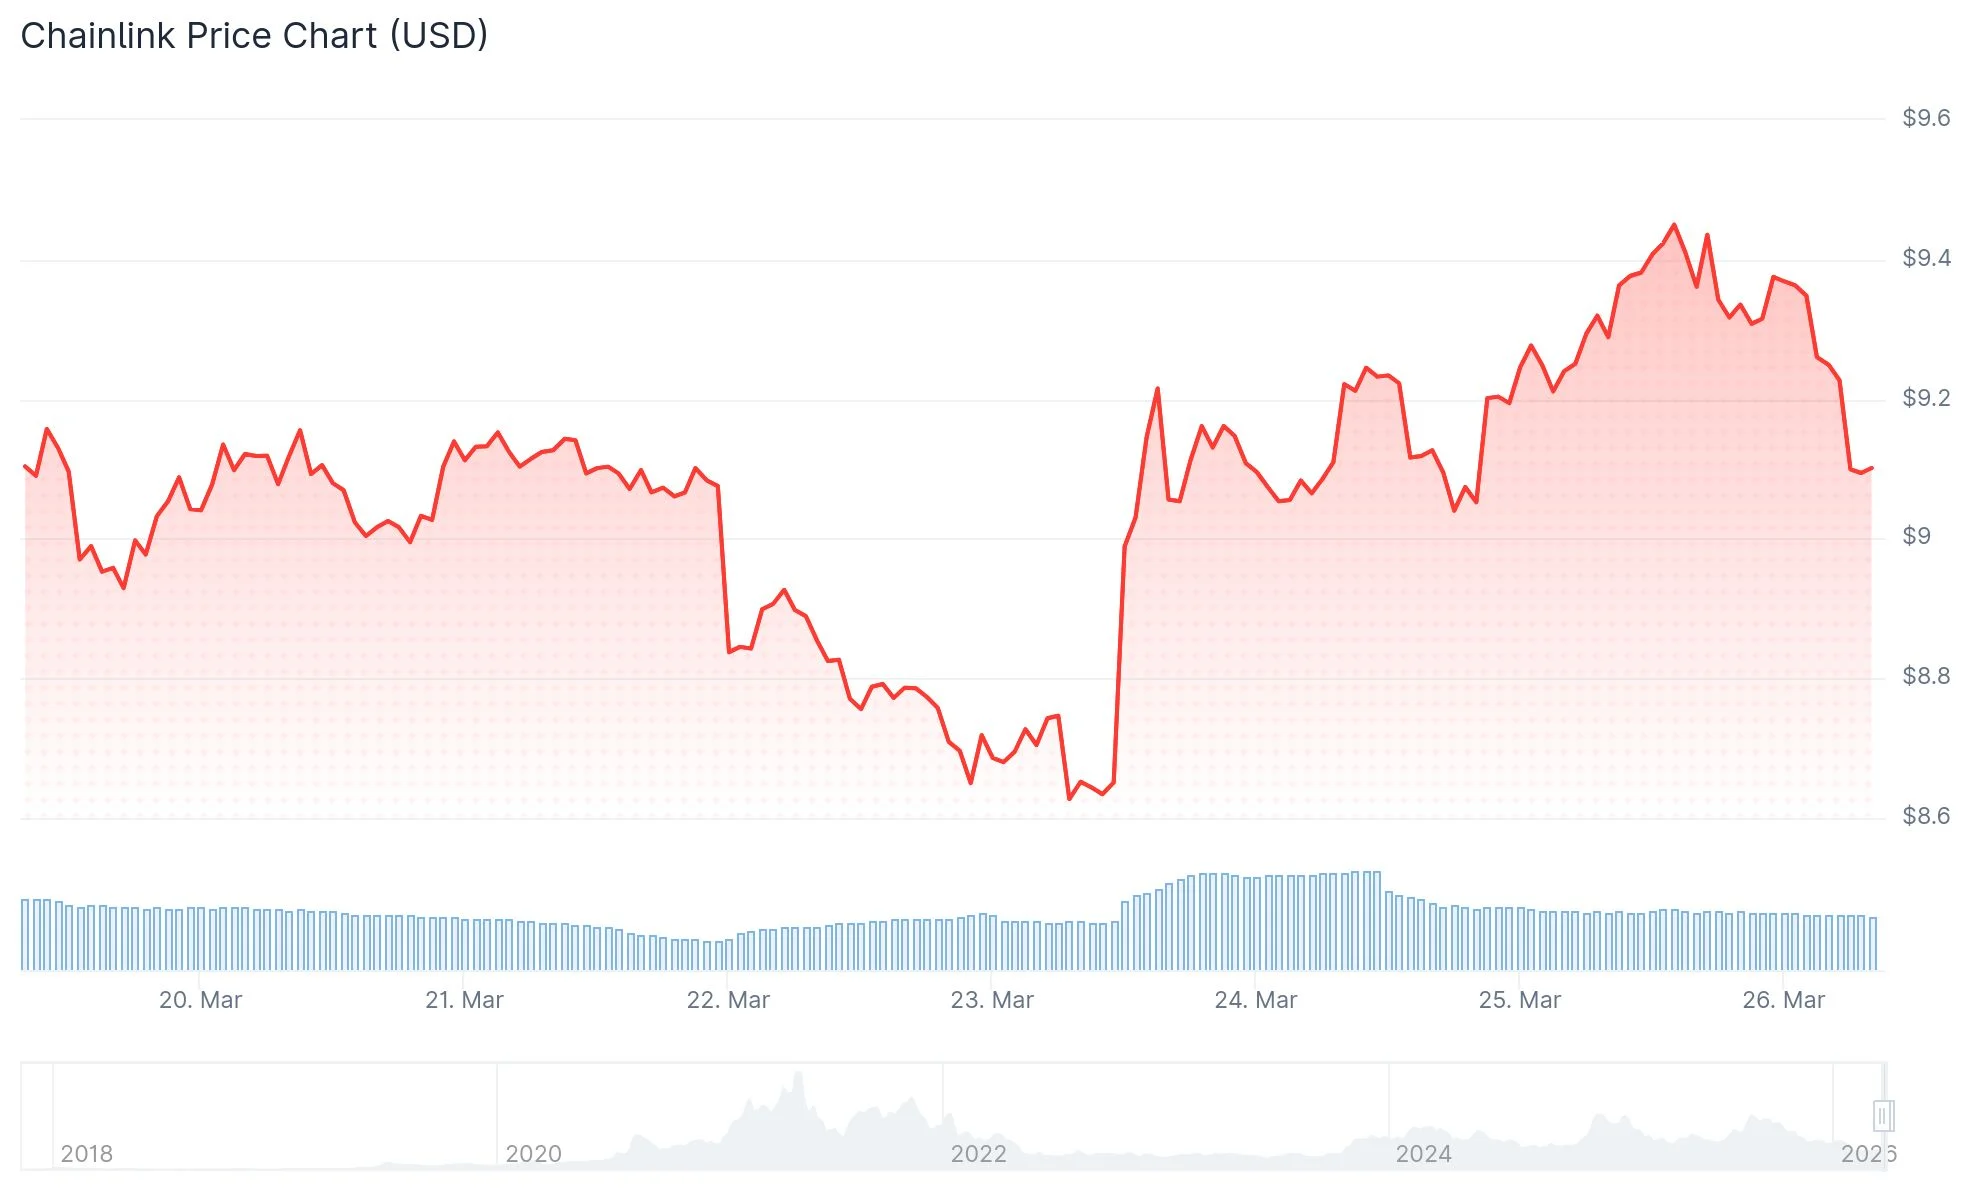
- LINK currently trades near $9.2, confined within an $8.5 to $9.9 price corridor over the last seven days
- A major holder established 10 fresh wallets, transferring 1.62 million LINK valued at $14.8 million in what appears to be portfolio restructuring
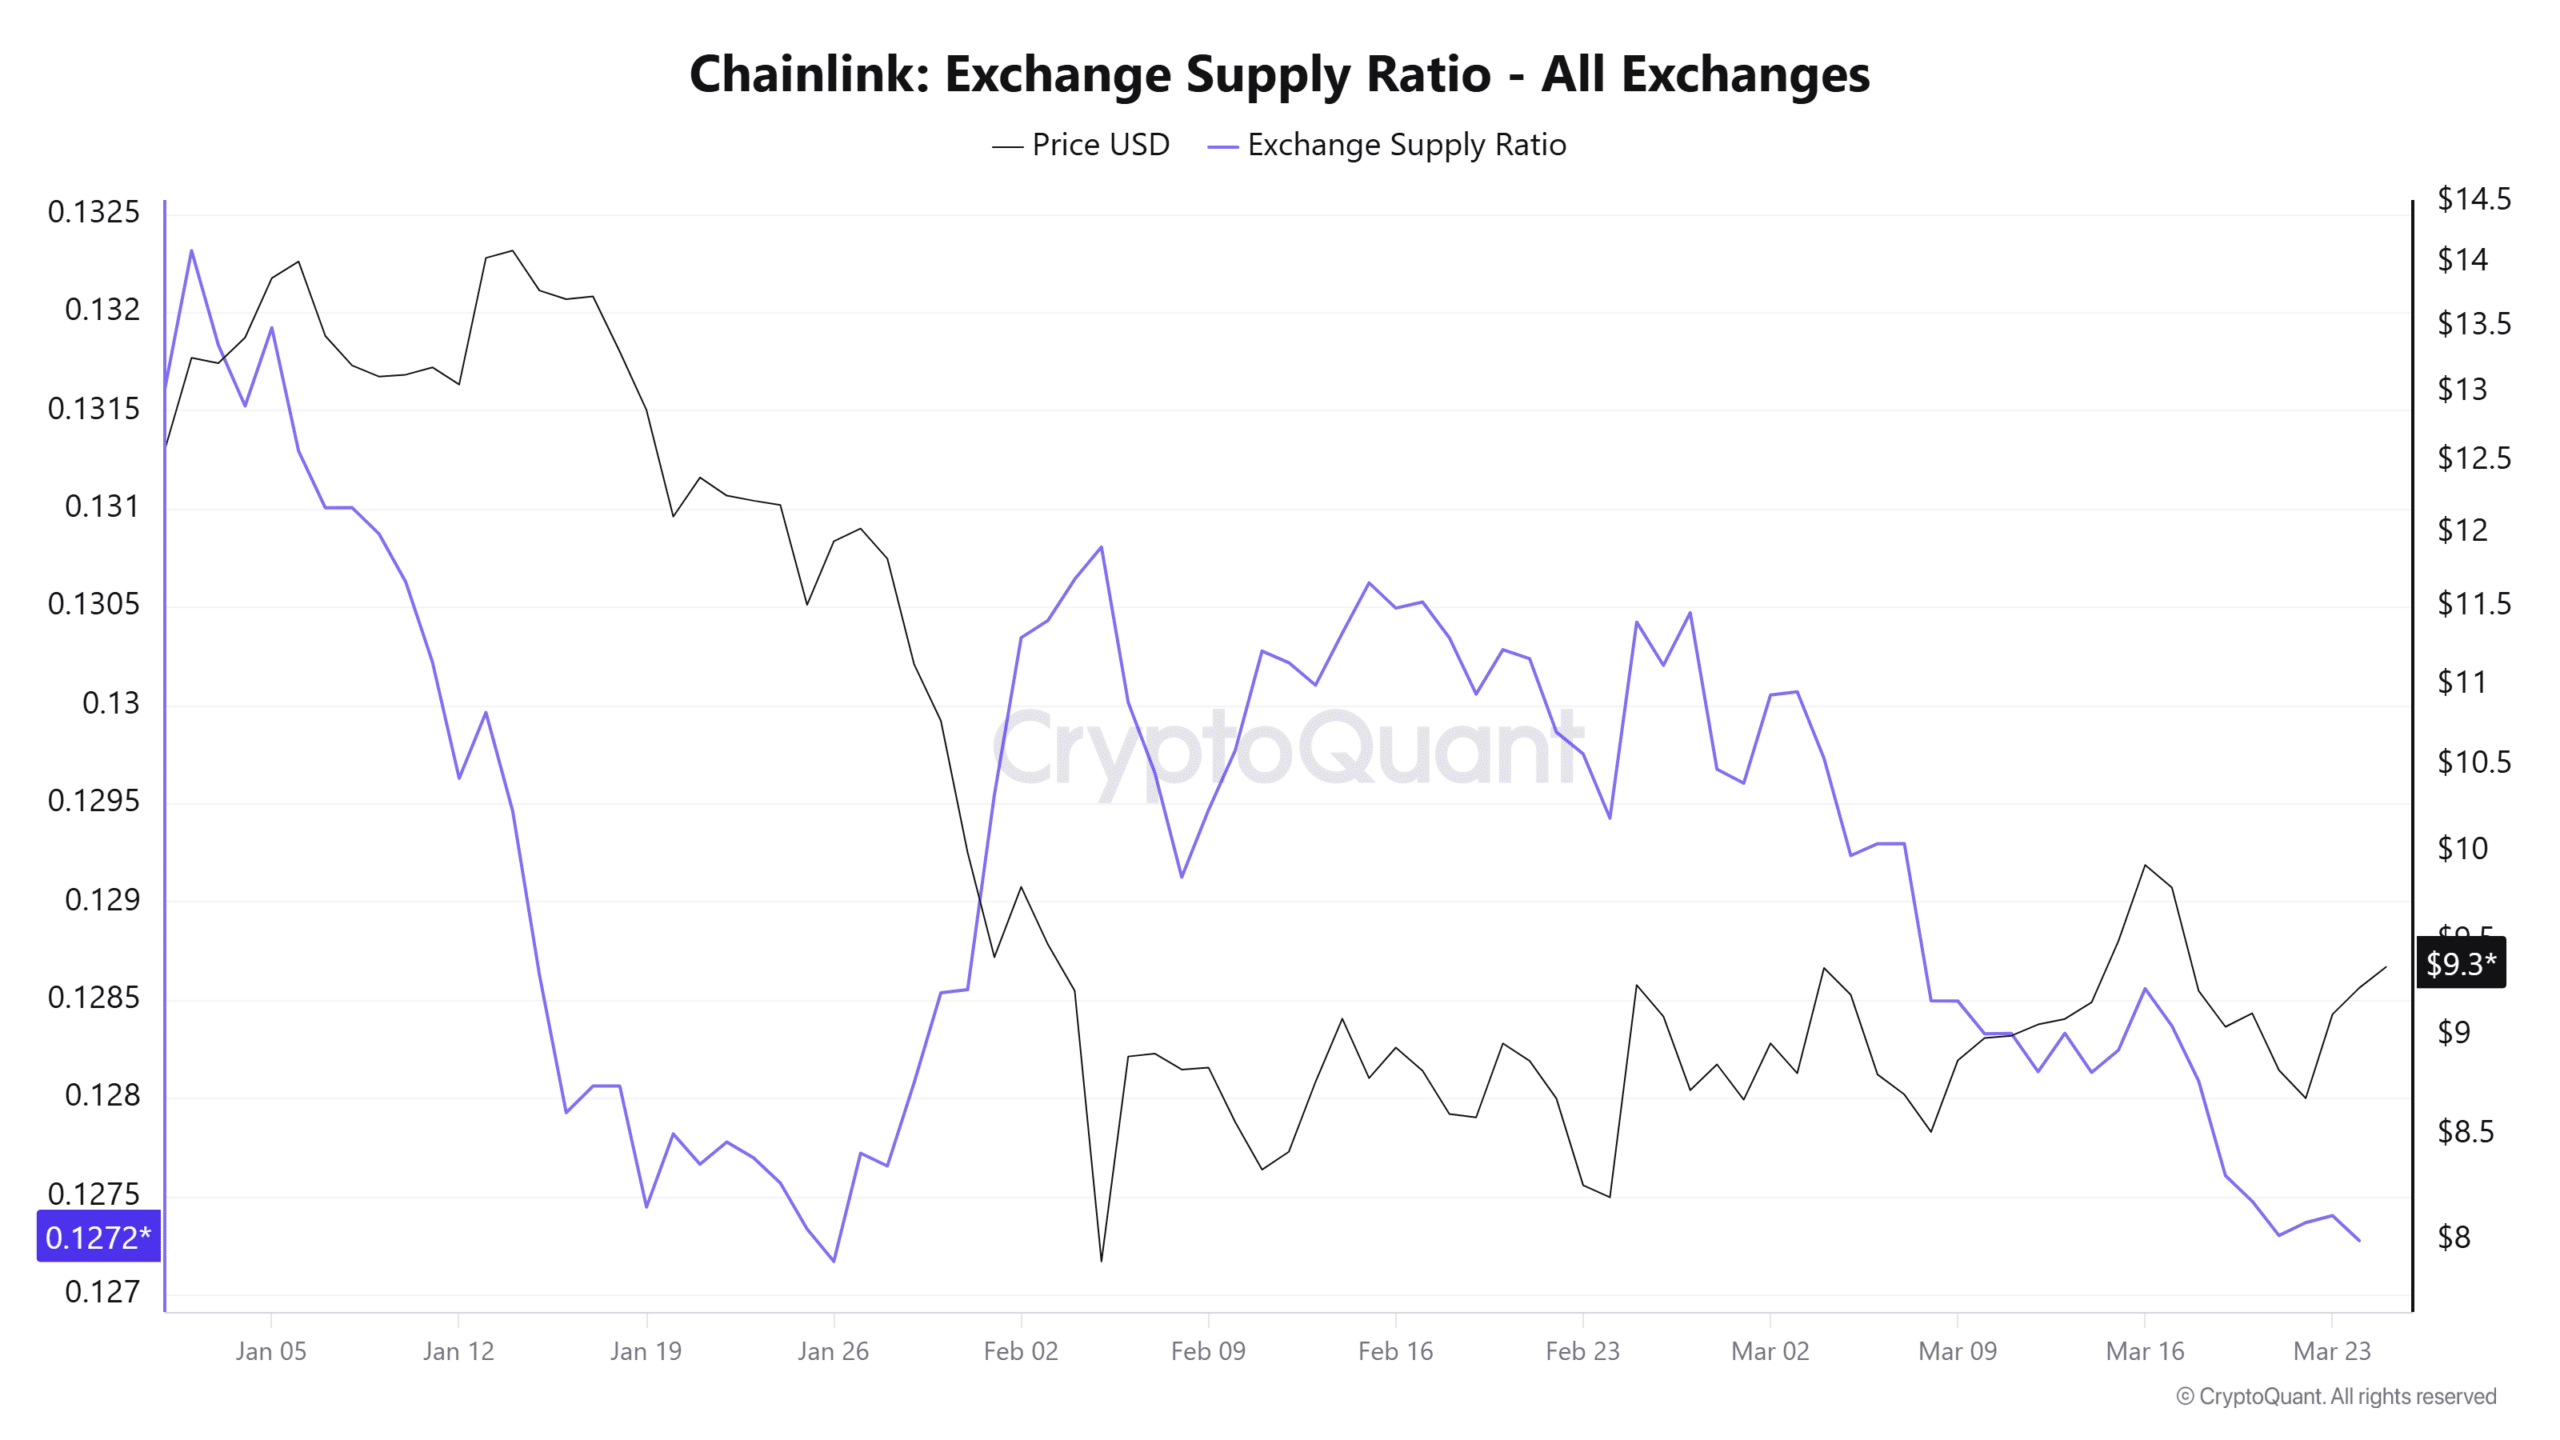
- Exchange Supply Ratio declined to 0.127, matching January lows and indicating token migration away from trading platforms
- Coinbase launched integration with Chainlink DataLink, delivering institutional-quality trading data to blockchain applications
- Stochastic RSI surged from 26 to 44 within 48 hours, indicating emerging buying pressure despite continued selling activity
Chainlink has remained stuck in neutral throughout the previous week. LINK maintains its position at $9.2, oscillating between downside support at $8.5 and upside resistance at $9.9 without achieving a decisive directional move. Trading volume contracted by 32% to reach $649 million daily, signaling reduced market engagement.

While price action remains stagnant, significant developments are unfolding beneath the surface. A prominent whale established 10 fresh wallet addresses and withdrew 1.62 million LINK tokens — representing $14.8 million in value — from a centralized exchange before distributing them to Flowdesk-associated addresses. Blockchain analytics platform Lookonchain documented the transaction and confirmed these tokens were not part of a recent acquisition. The movement suggests strategic wallet management rather than an aggressive buy or sell position.
CryptoQuant’s Spot Average Order Size metrics reveal substantial whale-sized orders concentrated around the $9.2 level during five of the previous seven trading sessions. This confirms that major market participants are engaged at present valuations, although their directional intent remains ambiguous.
Token Migration from Exchanges Reaches Multi-Month Low
The Exchange Supply Ratio (ESR) has experienced consecutive monthly declines, dropping to 0.127 — representing the lowest reading observed since January. A decreasing ESR indicates reduced token balances held on centralized exchanges, which traditionally constrains immediate selling pressure.
Data from Santiment reveals that wallet addresses containing a minimum of 1,000 LINK tokens have expanded to 25,420 — marking the highest tally since December 4th. This development suggests larger investors are methodically accumulating positions during the current consolidation phase.
Exchange Netflow metrics have shifted positive at 101,000 LINK, reflecting greater inflows to exchanges than outflows. This confirms that active distribution remains ongoing, contributing to the persistent price consolidation.
Bullish Momentum Emerges Against Overhead Pressure
The Stochastic RSI indicator advanced from 26 to 44 during the past two trading sessions. The Bulls v. Bears gauge demonstrates that buyers are exhibiting stronger conviction in defending elevated price levels compared to sellers attempting to force depreciation. A sustained breakout would require the Stochastic RSI to penetrate the 50 threshold.
Regarding fundamental catalysts, Coinbase revealed its initiative to deliver premium trading information onchain via Chainlink’s DataLink infrastructure. This implementation provides live order book data, spot pricing, and derivatives information to decentralized finance builders. Coinbase VP Liz Martin emphasized the advancement enables developers to construct “more robust onchain apps across derivatives, tokenized assets, and more.” Chainlink CBO Johann Eid characterized the collaboration as establishing a new benchmark for programmable market infrastructure.
At current valuation, LINK exchanges hands at $9.2 with immediate downside protection at $8.5 and near-term upside barrier at $9.9.
The UK government is accelerating plans to impose a temporary ban on political donations made via cryptocurrencies, tying the move to findings from the independent Rycroft Review that examined foreign interference in elections and political processes.
Prime Minister Keir Starmer signaled the government’s intent during a recent Prime Minister’s Question Time, stating that the administration would act decisively to protect democracy and include a moratorium on all political donations conducted through crypto assets. The pledge reflects cross-party concerns that crypto payments could be exploited by foreign actors to influence UK politics, a risk underscored by the independent inquiry.
Under the proposed policy, crypto donations would be prohibited until the government and regulators establish a robust framework capable of ensuring traceability and preventing illicit funding. A separate government statement outlined that the moratorium would apply until the regulatory environment is deemed sufficiently strong to support transparent, accountable fundraising in elections.
Key takeaways
- The UK moves to suspend crypto-based political donations pending a robust regulatory regime aimed at preventing untraceable funds and foreign interference.
- The change is being pursued as part of amendments to the Representation of the People Bill, with retrospective effect from March 25.
- The legislation is at the committee stage in the House of Commons and must pass both Houses and receive royal assent to become law.
- Enforcement includes a 30-day window for political parties and regulated actors to return any unlawful crypto donations once the law takes effect.
- Reform UK, which has publicly accepted crypto donations, illustrates the shifting political dynamics around crypto contributions in the UK.
Rationale, risk, and political momentum
The move follows the Rycroft Review, an independent inquiry that scrutinized foreign financial influence and interference risks in the UK’s electoral architecture. While not the law itself, the review has become a blueprint for where policymakers believe tighter controls are warranted. In public remarks, Starmer framed the moratorium as part of a broader effort to shield democratic processes from covert funding channels. The government’s stance is that crypto donations, if left unregulated, could provide a vehicle for opaque contributions and foreign actors to sway political outcomes.
Observers note that the policy signals a broader shift in how UK politics may handle digital assets in the fundraising space. While crypto markets continue to evolve rapidly, lawmakers are signaling that fundraising mechanisms, disclosures, and enforcement capabilities must keep pace to preserve electoral integrity. The government’s position is that once a robust regulatory environment is in place, the ban would be lifted only after appropriate assurances about transparency and enforcement are satisfied by Parliament and the Electoral Commission.
Legislative path and practical implications
Implementing the moratorium requires amendments to the Representation of the People Bill. The government indicated that changes would take retrospective effect from March 25, aligning with the timeline of the inquiry and the current parliamentary session. The bill is presently at the committee stage in the House of Commons, meaning it must pass through both the Commons and the Lords before reaching royal assent, after which it could become law.
Once in force, the rule would impose a 30-day window for political parties, candidates, and MPs to return any crypto donations deemed unlawful during the interim period. After the window closes, enforcement actions could follow for breaches discovered under the new regime. This phased approach aims to deter crypto-based contributions that lack clear traceability or originate from prohibited sources, while giving political actors time to adjust and comply with the updated requirements.
Crucially, the ban is described as not being lifted until the regulatory framework is judged robust enough to sustain confidence and transparency in donations conducted through digital assets. That implies a potentially lengthy period before any relaxation, contingent on the development and rollout of effective compliance standards, verification processes, and enforcement mechanisms overseen by the Electoral Commission and relevant regulators.
Context, parties, and potential market impact
The policy landscape around crypto donations in the UK has already seen notable developments. Reform UK, for example, was reported to be the first major party to publicly accept crypto donations, with its leadership announcing an intention to accept Bitcoin and other digital assets from eligible donors. The new moratorium framework could complicate such fundraising arrangements, particularly if the donor pool and regulatory expectations become more tightly defined and enforced.
For investors and market participants, the unfolding policy debate underscores how regulatory risk is evolving alongside the crypto sector. While the moratorium targets political fundraising rather than broader market activity, it reflects a broader emphasis on governance, transparency, and anti-fraud controls in digital asset use. Market watchers will be watching not only the trajectory of the Representation of the People Bill, but also how regulators operationalize new rules, such as enhanced monitoring of crypto contributions, heightened disclosures, and potential cross-border compliance requirements.
The timeline remains to be seen. With the next general election due by August 15, 2029, the length of any enforced pause will partly hinge on parliamentary pace and the readiness of the Electoral Commission to administer and enforce the new regime. The case also sits within a wider international dialogue about how democracies regulate crypto philanthropy and campaign funding, a field that is rapidly evolving as lawmakers weigh both security concerns and the potential benefits of digital assets for fundraising.
As the bill advances through Parliament, observers should monitor three critical developments: the precise scope of the ban (whether it applies to all crypto donations or only certain types of gifts), the design and timeline of the regulatory regime that would allow the ban to be lifted, and how enforcement will be operationalized in practice across different political parties and candidates.
In the near term, the government’s priority is to safeguard election integrity while building a credible framework for digital fundraising. Whether the proposed measures will withstand political and legal scrutiny, and how quickly regulators can implement the necessary safeguards, will shape the trajectory of crypto donations in UK politics for the years ahead.
Readers should stay attentive to parliamentary proceedings around the Representation of the People Bill, as well as official statements from the Electoral Commission and the government on the timing and conditions for any potential exemption or lifting of the moratorium. The ongoing debate will likely influence how political campaigns, donors, and crypto firms approach fundraising and compliance in the United Kingdom.
The next phase of the policy process will reveal how aggressively the UK plans to police crypto-backed political giving and whether the regulatory approach can provide a clear, enforceable path for campaign finance in the digital asset era.


A Texas federal court has dismissed a lawsuit filed by crypto developer Michael Lewellen, who sought a court ruling that his software would not violate US money-transmission laws.
Summary
- Texas court dismissed Lewellen lawsuit citing no credible threat of prosecution tied to his software
- Judge referenced DOJ memo stating developers not targeted for user actions or unintended regulatory violations
- Coin Center urges Congress to pass bill clarifying non custodial developers are exempt from money laws
The case focused on Pharos, a tool designed to support donations to charitable crowdfunding campaigns. Chief US District Judge Reed O’Connor dismissed the case on Wednesday. The judge said Lewellen had not shown a credible threat of imminent prosecution tied to his software.
Lewellen reacted to the ruling on X. He wrote,
”Disappointed to see the court dismiss my suit today.”
The court dismissed the case without prejudice, which leaves room for Lewellen to file again after making changes.
In the ruling, the court also cited a Department of Justice memo. That memo said federal prosecutors will no longer target virtual currency exchanges, mixing services, tumbling services, or offline wallets for the acts of end users or for unwitting regulatory violations.
Lewellen rejected that point as enough legal protection. He said,
”A non-binding DoJ memo is no substitute for real legal certainty.”
Judge O’Connor also said the cases Lewellen relied on were not close matches to his own situation.
In addition, Lewellen had argued that developers behind software such as Tornado Cash and Samourai Wallet faced prosecution under similar laws. He used those cases to support his claim that developers like him face a real legal risk.
Judge O’Connor said those prosecutions centered on money laundering. He wrote,
”By contrast, the core conduct here would be running a business.”
He also said Lewellen denied knowingly transmitting criminal funds, which the judge described as central to the earlier cases.
Coin Center and supporters push for legal clarity
Lewellen said his legal team is reviewing its next steps. Coin Center, which backed the lawsuit, said the court’s reliance on the DOJ memo does not resolve the broader issue for software developers.
Coin Center executive director Peter Van Valkenburgh said,
”The Blanche memo is not enough to secure their rights.”
He and Lewellen called on Congress to pass the Blockchain Regulatory Certainty Act of 2026, introduced by Senator Cynthia Lummis in January. The bill would state that developers of non-custodial software who do not control user funds are not subject to money transmitter laws.
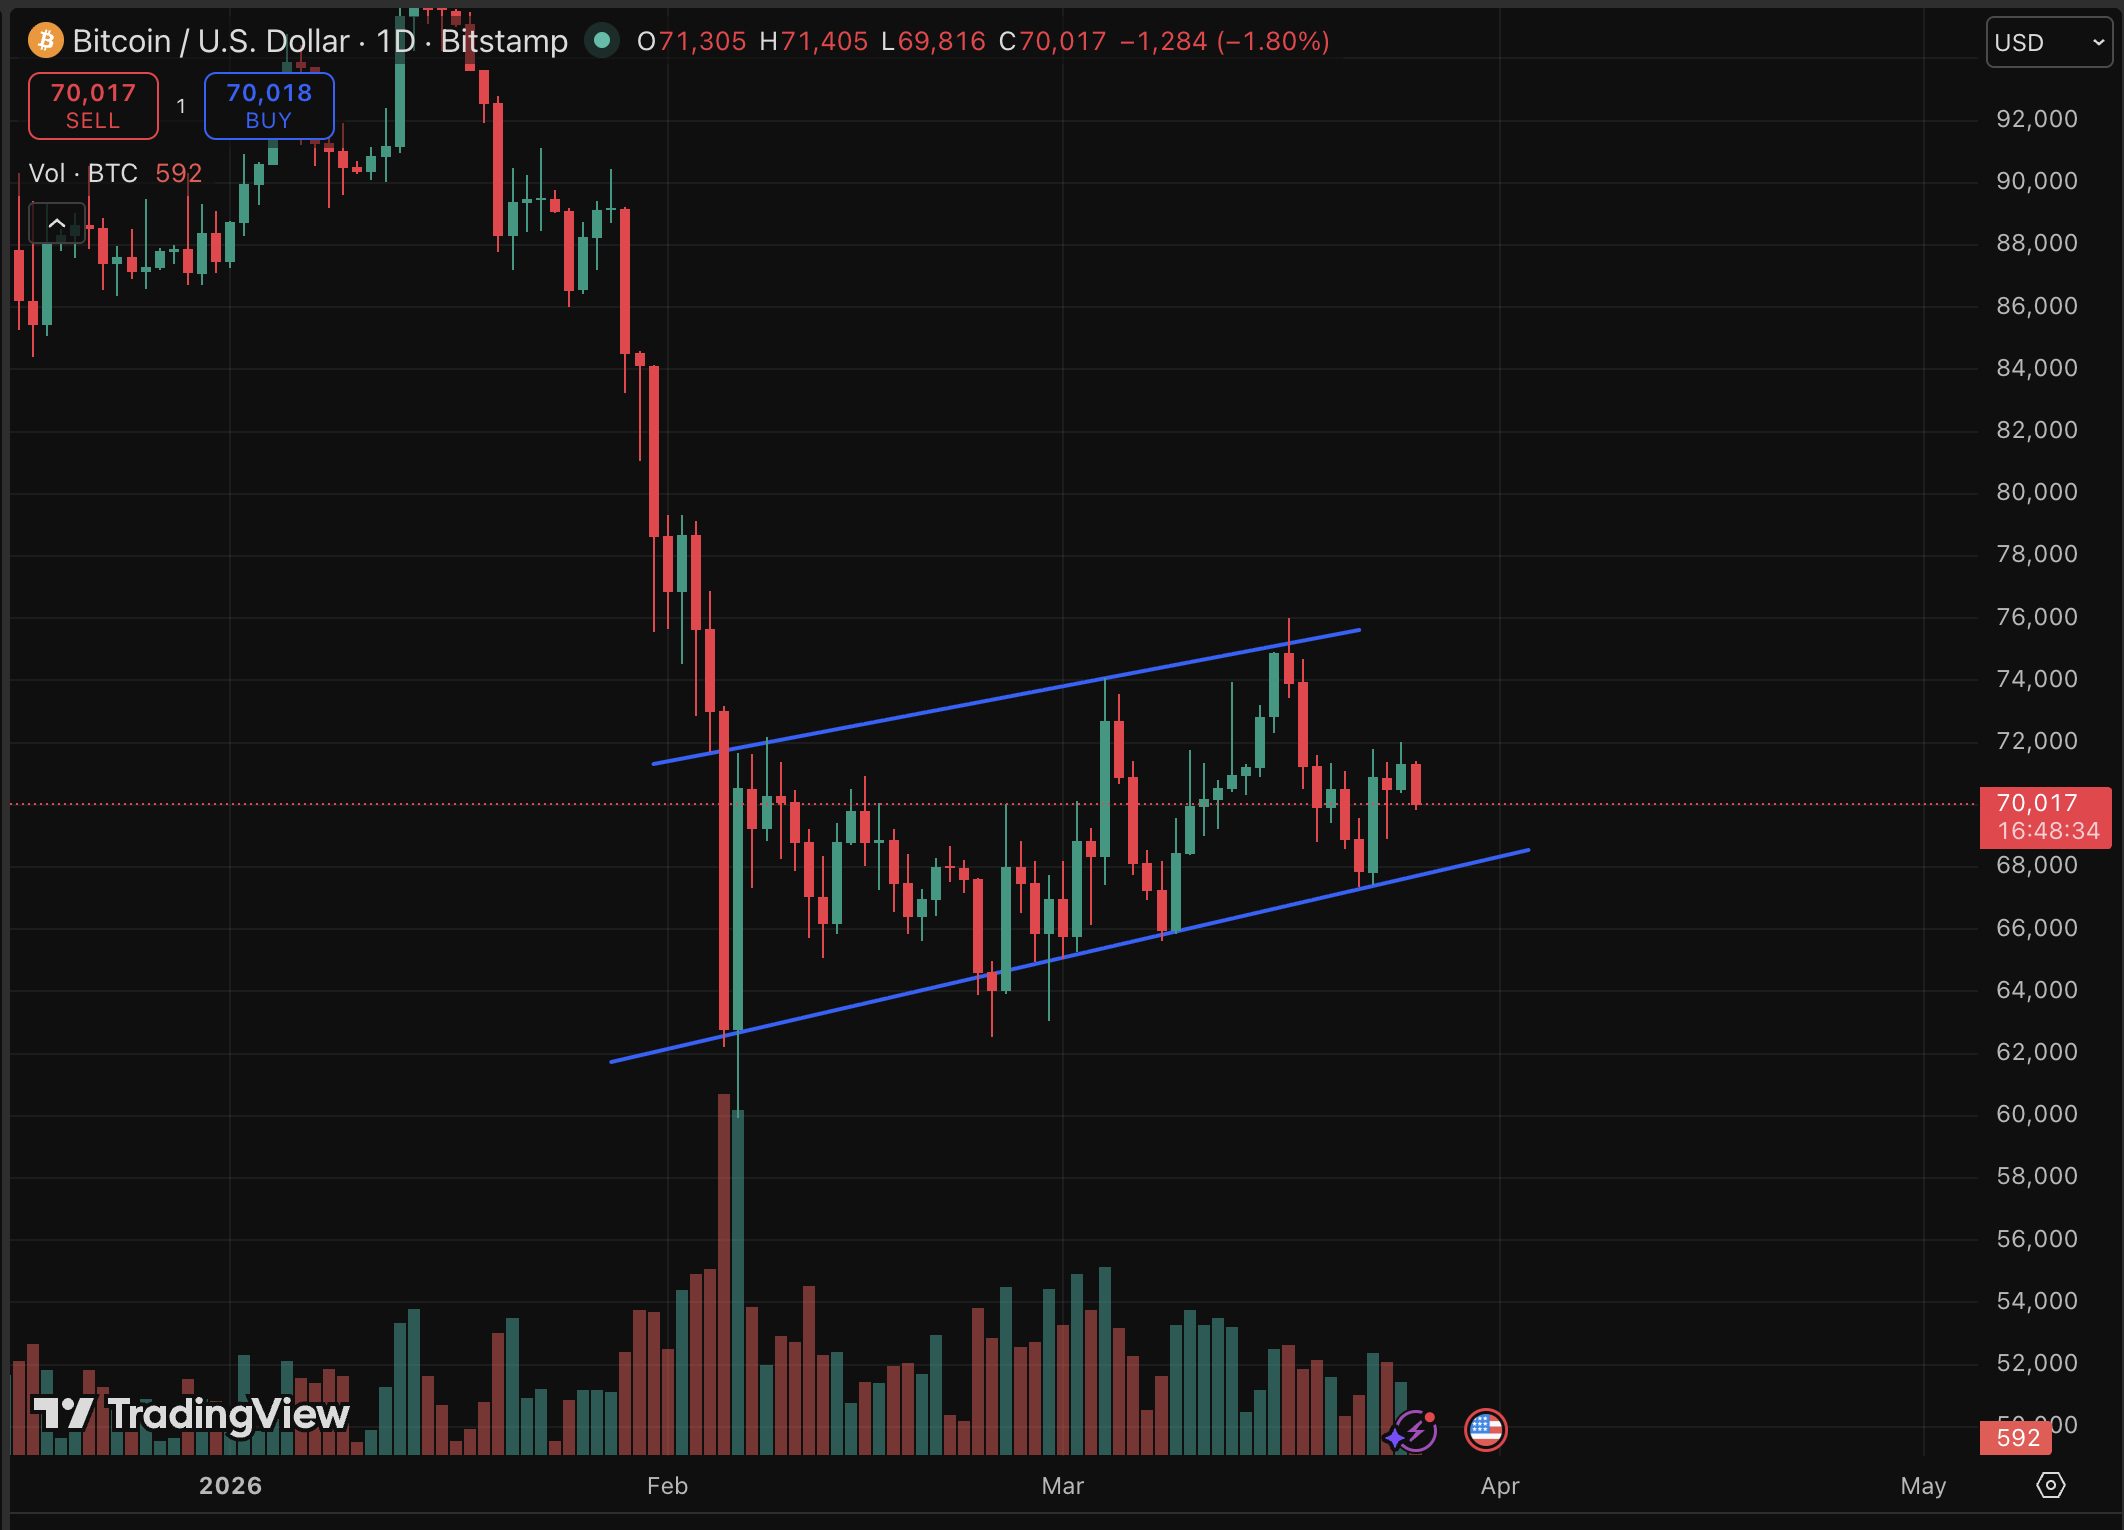
BTC USD is barely holding its ground. Bitcoin price now trades at under $70,000, a 1.6% drop in 24 hours, despite a bullish prediction yesterday. What’s interesting isn’t the number itself, but what the market is refusing to do despite serious headwinds.
Bitcoin rebounded to $71,200 yesterday, before the current pain, after oil prices eased on signals that Trump may pause Iran strikes, triggering a news-led bounce that analyst Blockchain Backer flagged directly: “Bitcoin spot volume falls to 2023 lows as Bitcoin rallies remain newsled,” as geopolitical headline-chasing.
Meanwhile, the Coinbase Premium has turned its most negative in over a month, per Coinglass data, meaning U.S. institutional buyers are consistently bidding below their offshore counterparts on Binance, a signal that has historically preceded periods of price stagnation.
Bitcoin ETF net inflows totaled $1.53 billion in March, ending a three-month outflow streak — but $1.3 billion of that landed in the first two weeks. The pace has collapsed to $195 million since. The macro setup and the on-chain signals are telling two different stories, and that tension is exactly where the price analysis gets complicated.
Discover: The best pre-launch token sales
Bitcoin Price Prediction: Can BTC Recover to $80,000 Before Q2 2026?
At $69,00, Bitcoin sits 44.4% below its all-time high of $126,080 last year. March futures (BTH26) settled at 70,750 on March 23 with a bid/ask spread of 70,660–70,740, signaling the derivatives market is pricing minimal near-term movement. Spot volume at 2023 lows confirms it: conviction is absent on both sides.
The technical picture shows consolidation without a clear catalyst. The $68,000 psychological level has acted as a floor held across multiple geopolitical shocks, which is genuinely impressive — but there’s no volume confirmation to hold it.

In a perfect world, a sustained Coinbase Premium recovery, combined with ETF inflows accelerating past $500 million per week, could push BTC back toward $80,000–$85,000 by late Q2. A normal Bitcoin price prediction puts BTC to grind sideways between $69,000 and $74,000 as geopolitical noise provides short-term volatility without directional conviction.
In a bear case, a clean breakdown below $68,500 on elevated volume, especially if ETF outflows resume, and reopens the path to $62,000. The range is holding, but it’s a defensive hold, not a confident one, for now.
Discover: The best crypto to diversify your portfolio with
Bitcoin Hyper Targets Early-Mover Upside as BTC Consolidates at Key Levels
When Bitcoin’s upside is capped by weak institutional demand and news-driven volume, some capital rotates toward infrastructure plays positioned to benefit regardless of BTC’s short-term direction. That’s the thesis gaining traction around Bitcoin Hyper ($HYPER), a Bitcoin Layer 2 project that has already raised more than $32million in its ongoing presale.
The project’s core claim is aggressive: the first-ever Bitcoin Layer 2 with Solana Virtual Machine (SVM) integration, delivering smart contract execution described as faster than Solana itself through extremely low-latency processing. It pairs that with a Decentralized Canonical Bridge for trustless BTC transfers, effectively bringing programmability to Bitcoin’s security layer without sacrificing the base chain’s trust model.
Current presale price sits at $0.0136, with staking live at 36% high APY rewards. Research Bitcoin Hyper ahead of the next price stage.
This article is for informational purposes only and does not constitute financial advice. Crypto assets are highly volatile. Always do your own research before investing.
The post Bitcoin Price Prediction: Middle East Conflicts and BTC USD Chart Analysis appeared first on Cryptonews.
Key Takeaways
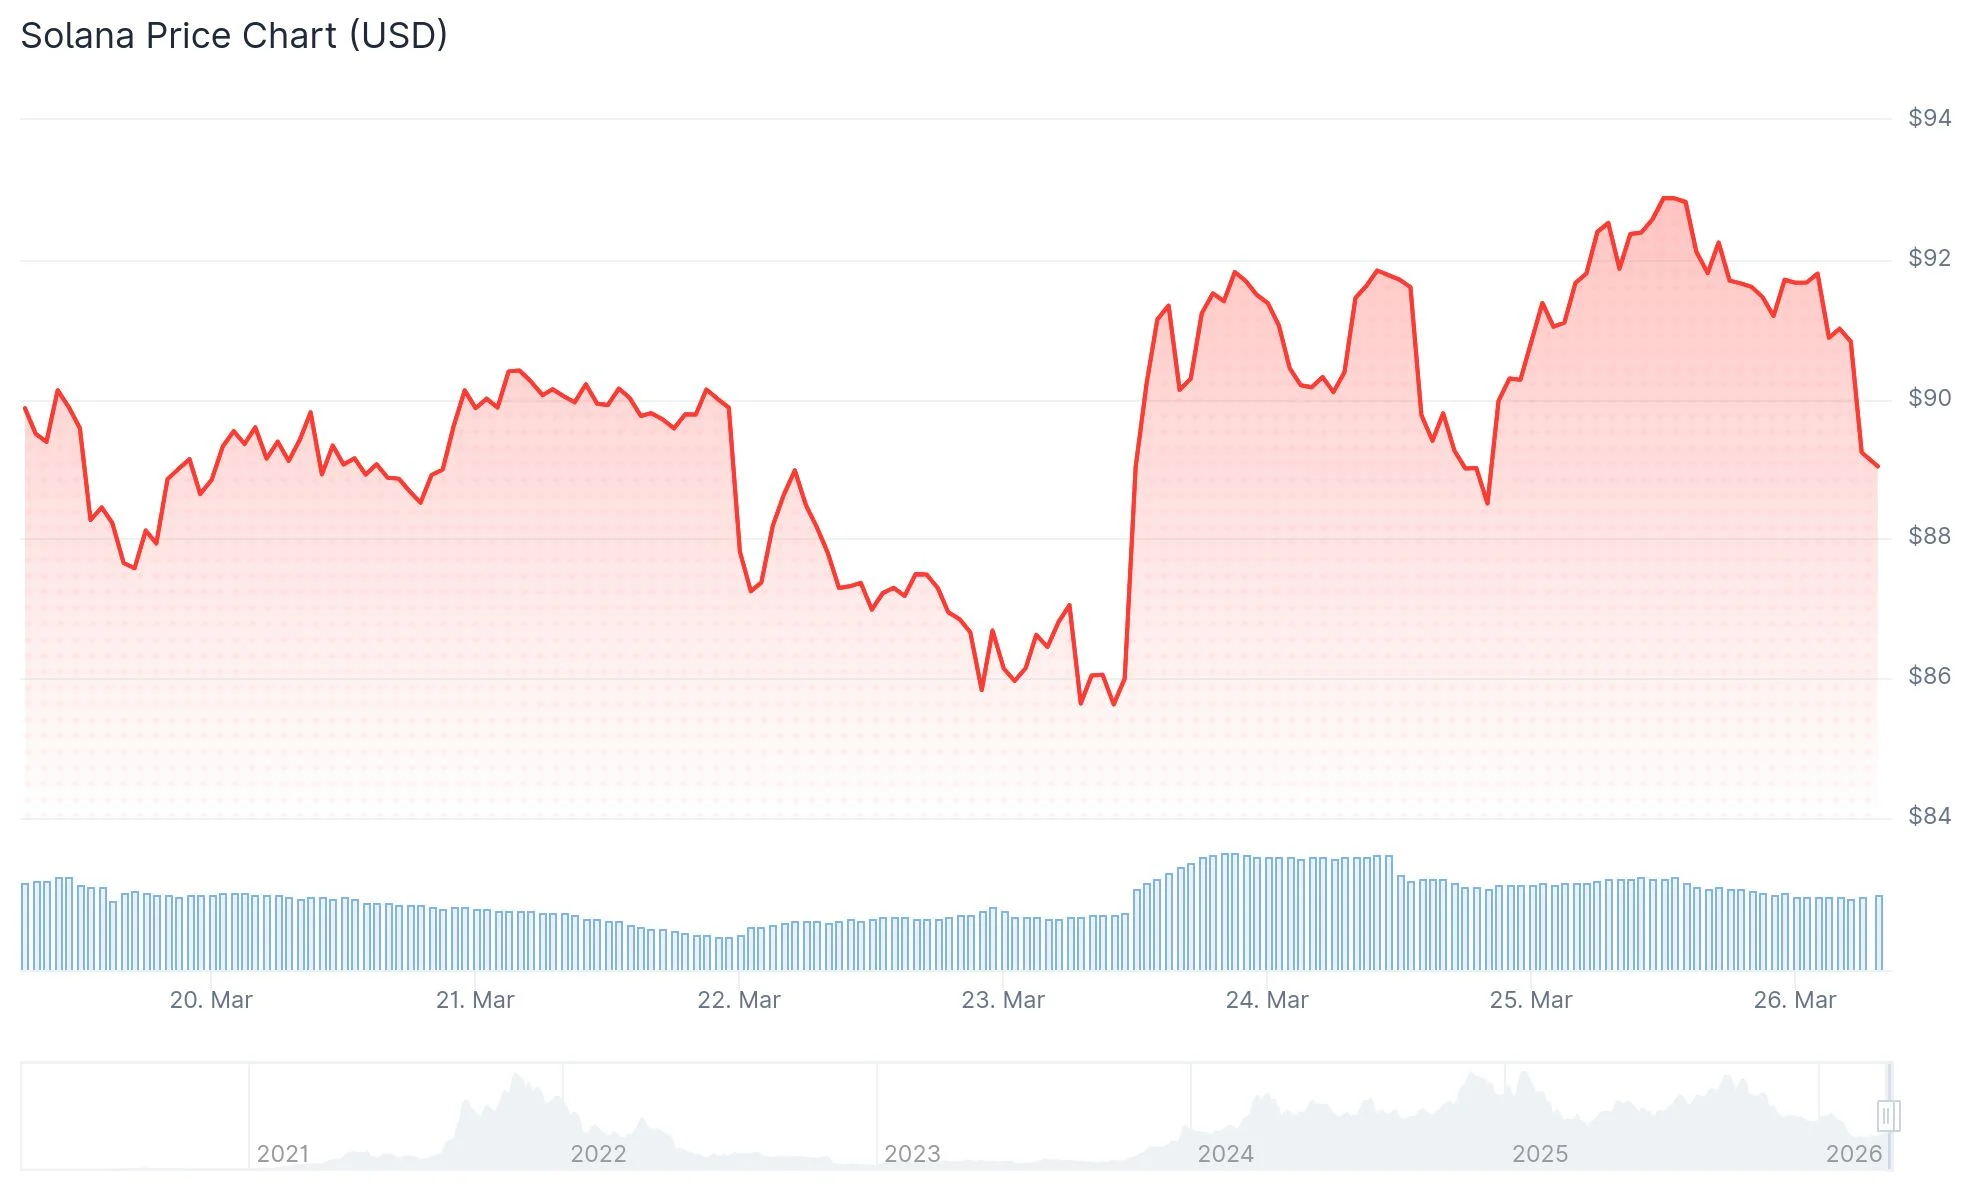
- A bearish reversal requires SOL to fall beneath $88.57—this hasn’t occurred yet.
- The $82–$86 zone shows robust buying activity, supported by Fibonacci levels.
- Price rejection occurred near $92.70, with resistance concentrated between $91–$94.
- Breaking above the $94–$96 threshold could propel SOL toward $98 and beyond.
- Major compliance firm Elliptic has partnered with Solana’s Developer Platform, bringing enterprise-grade tools used by Mastercard, Worldpay, and Western Union.
Solana continues defending a critical support area as market participants monitor a tight price corridor that may determine the asset’s upcoming trajectory. Multiple technical formations indicate indecision, while fresh institutional collaboration strengthens the network’s infrastructure.

The token has been trading within the $82 to $86 bracket, a zone that aligns with key Fibonacci retracement markers and an ascending trendline. This convergence indicates persistent demand at these price points. Following successful defense of this area, a consolidation pattern has emerged.
The subsequent upward movement from this foundation displayed an A-B-C corrective wave formation visible on shorter timeframes. Such patterns generally indicate consolidation rather than trend reversal. While this maintains bullish potential, it stops short of confirming directional commitment.
$91–$94 Zone Acts as Ceiling
During recent attempts to climb higher, SOL encountered significant selling pressure. The $91–$94 area features clustered Fibonacci resistance levels creating a formidable barrier. Price rejection around $92.70 demonstrated continued seller presence at these elevations.
Should this overhead resistance persist, expect potential retracement toward $85 or marginally lower to absorb liquidity. This wouldn’t compromise the overarching structure unless price action breaches $88.57—the critical threshold analysts identify as confirming bearish control.
Conversely, decisive movement above the $94–$96 region would shift technical dynamics. Such a breakthrough would negate the corrective interpretation and establish pathways toward $98 or higher targets.
The SOL/BTC trading pair reveals encouraging developments. Daily timeframe analysis shows the pair challenging horizontal resistance while maintaining position above an upward-sloping trendline. The Relative Strength Index demonstrates upward momentum and recently crossed above its signal line, indicating strengthening performance against Bitcoin.
Weekly chart examination places SOL near the lower boundary of a widening wedge formation. Maintaining this support level is crucial. Failure would suggest extended downside risk, while successful defense preserves recovery possibilities within the pattern.
Major Compliance Integration Announced
Beyond technical considerations, Solana secured an important infrastructure advancement. Elliptic has been designated as the official compliance partner for Solana’s Developer Platform.
This platform provides developers with unified access to construct financial applications including tokenized deposits, stablecoin payment systems, and real-world asset infrastructure. Elliptic contributes integrated wallet screening capabilities, transaction surveillance, and comprehensive risk assessment tools.
Notable organizations already utilizing the platform include payment giants Mastercard, Worldpay, and Western Union.
Currently, SOL must maintain support above $88.57 to preserve existing technical formation, while the $91–$94 region remains the critical area monitoring for potential breakout scenarios.


Google has set 2029 as its target to roll out post-quantum cryptography across its products, adding a firm deadline to a risk that has moved closer in recent years.
Summary
- Google sets 2029 deadline for post quantum cryptography amid faster progress in quantum computing hardware
- Ethereum plans protocol level quantum resistance while Bitcoin community remains divided on urgency and approach
- Solana introduces quantum resistant vaults but requires users to shift funds into specialized wallet structures
The company linked that timeline to faster gains in quantum hardware, better error correction, and new estimates on how quickly current encryption could become vulnerable.
Google said the industry should move sooner rather than later as quantum computing advances continue. The company stated that current cryptographic standards used for encryption and digital signatures will not remain safe forever.
In its update, Google said,
”Quantum computers will pose a threat to current cryptographic standards.”
It also said post-quantum migration is needed so users can continue to rely on secure authentication services across its products.
The 2029 timeline marks the first time Google has attached a clear migration target to its post-quantum work. That date arrives earlier than some estimates for Q-Day, the point when quantum machines could break widely used public-key encryption.
Google said it wants to set a public example for other companies and institutions. The company added, ”It’s our responsibility to lead by example and share an ambitious timeline,” while calling for wider action across the industry.
Moreover, the push toward quantum-safe systems is also gaining attention in crypto. The Ethereum Foundation launched a Post-Quantum Ethereum resource hub this week and said it wants protocol-level protections in place by 2029.
Ethereum’s plan focuses on securing the network against future quantum threats, with execution-layer work expected later. The effort reflects broader concern over how blockchains that rely on existing cryptographic systems may need upgrades over time.
Bitcoin and Solana show different approaches
Solana developers introduced a quantum-resistant vault in January 2025. The design uses hash-based signatures and creates a new key during each transaction, but users must move funds into special Winternitz vaults because the feature does not upgrade the full network.
Bitcoin developers remain divided on timing and need. Blockstream chief executive Adam Back said quantum risks are overstated and that action is not needed for decades, while Ethan Heilman and other researchers backed BIP-360, a proposal that would add a new output type to reduce short-exposure quantum risks.

Iran war deflects attention from Ukraine as new offensive begins
Germany’s Henkel in $1.4 billion deal to acquire hair care brand Olaplex

Binance Coin (BNB) Rallies From Key Support Level as Derivative Markets Show Strength


-
 Crypto World5 days ago
NIO (NIO) Stock Plunges 6.5% as Shelf Registration Sparks Dilution Worries
-

 Fashion6 days ago
Weekend Open Thread: Adidas – Corporette.com
-
 NewsBeat23 hours ago
Manchester United reach agreement with Casemiro over contract clause amid transfer speculation
-

 Politics6 days ago
Jenni Murray, Long-Serving Woman’s Hour Presenter, Dies Aged 75
-

 Crypto World4 days ago
Best Crypto to Buy Now: Strategy Just Spent $1.57 Billion on Bitcoin During Fear While Early Investors Quietly Enter Pepeto for 150x Potential
-

 Crypto World4 days ago
Bitcoin Price News: Bhutan Sells $72 Million in BTC Under Fiscal Pressure, but the Smart Money Entering Pepeto Sees What the Market Does Not
-

 Tech6 days ago
inKONBINI Lets You Spend Summer Days Behind the Register
-

 News Videos6 hours ago
Parliament publishes latest register of MPs’ financial interests
-

 Sports3 days ago
Remo Stars and Kano Pillars Strengthen Survival Hopes in NPFL
-

 Politics7 days ago
Gender equality discussions at UN face pushbacks and US resistance
-

 Business4 days ago
No Winner in March 21 Drawing as Prize Rolls to $133 Million for Next
-

 Sports3 days ago
Gary Kirsten Accuses Pakistan Cricket Board Of ‘Interference’, Mohsin Naqvi Responds
-

 Tech4 days ago
Give Your Phone a Huge (and Free) Upgrade by Switching to Another Keyboard
-

 Sports6 days ago
2026 Kentucky Derby horses, odds, futures, preview, date: Expert who nailed 12 Derby-Oaks Doubles enters picks
-
Sports7 days ago
Vikings Free Agency Enters Phase 2 with Key Questions
-

 Tech3 days ago
AI enters the chat: New Seattle dating app relies on tech to facilitate meaningful human connections
-

 Politics7 days ago
Scotland’s rejection of assisted dying is a victory for humanity
-

 Business6 days ago
DLocal: Entering 2026 At Escape Velocity
-
Business5 days ago
Columbia Sportswear enters $500 million credit agreement with JPMorgan Chase
-

 NewsBeat7 days ago
Missile lands next to presenter during live report
You must be logged in to post a comment Login