
Crypto World
Crypto ETFs See $1B+ Daily Outflows as Markets Slide

A broad pullback in crypto investment products coincided with a broader market softness, as the total crypto market capitalization slipped roughly 6% on Thursday. Bitcoin (CRYPTO: BTC) and Ether (CRYPTO: ETH) funds together recorded nearly $1 billion in outflows, among the year’s largest single-day moves, according to SoSoValue. Spot Bitcoin exchange-traded funds (ETFs) led the retreat, shedding about $817.9 million and marking the largest daily outflow since November 2025. The dip arrived as risk-off sentiment extended beyond digital assets, with gold retreating about 4% after a recent spike above $5,300 per ounce, based on TradingView data. The day’s market mood also reflected pointers from the traditional technology space, as AI-related stock worries and a sharp slide in Microsoft shares added to the caution in equities.
Key takeaways
- Bitcoin (CRYPTO: BTC) and Ether (CRYPTO: ETH) funds registered nearly $1 billion in net outflows on Thursday, one of the year’s largest moves, underscoring a shift in appetite for top-tier crypto exposures.
- Spot Bitcoin ETFs alone saw $817.9 million leave the market in a single session, the steepest daily withdrawal since late 2025, highlighting the fragility of near-term demand for physically backed BTC products.
- Gold prices fell about 4% as risk sentiment soured and equities, including those tied to AI, faced pressure; Microsoft (EXCHANGE: NASDAQ: MSFT) shares sank about 10%, amplifying the cross-asset pullback.
- Bitcoin ETF flows for January turned negative as weekly outflows persisted, with the week tally nearing $978 million and December-to-January transitions remaining unsettled for many funds.
- Altcoin fund performance remained negative, with spot Ether ETFs pulling out around $155.6 million and XRP (CRYPTO: XRP) funds off about $92.9 million; Solana (CRYPTO: SOL) ETFs also posted modest withdrawals of $2.2 million.
- Overall, crypto ETPs still command significant assets under management, with about $178 billion across crypto exchange-traded products, while spot BTC ETFs account for roughly 6.5% of Bitcoin’s estimated market capitalization of about $1.65 trillion; still a meaningful liquidity channel for institutional players.
Tickers mentioned: $BTC, $ETH, $XRP, $SOL, $MSFT
Sentiment: Bearish
Price impact: Negative. The ongoing outflows and asset-price declines indicate a risk-off environment pressuring both crypto equities and spot assets.
Trading idea (Not Financial Advice): Hold. A wait-and-see stance may be prudent until there is clearer evidence that liquidity improves and macro catalysts stabilize.
Market context: The retreat in crypto ETFs mirrors a wider liquidity pullback in risk assets, with investors reassessing exposure as macro headlines and sector rotations drive correlations higher between digital-asset products and traditional markets.
Why it matters
The weekend and week’s flows paint a portrait of a market still heavily driven by sentiment and macro risk rather than purely on-chain signals. The dual pressure on spot BTC/ETH products and the outflows in altcoin ETFs reveal how sensitive crypto investment products remain to broad risk-off dynamics. With ETF inflows/funding often used by institutional participants to gain or unwind exposure, a sustained pattern of redemptions can translate into thinner daily price moves for the underlying assets. The data suggest that even well-established products — including spot BTC ETFs, which continue to represent a sizable slice of the asset’s investable demand — are susceptible to shifts in investor risk tolerance that accompany geopolitical and macro headwinds.
From a market structure perspective, the outflows widen the disconnect between headline price action and long-run narrative of crypto as a macro-hedge or risk-on asset. While Bitcoin and Ether still command tens of billions in AUM across ETPs, and despite their relative dominance in investor allocations, fund flows point to a cautious crowd prioritizing liquidity protection and redemptions over new capital allocation. The Bitcoin ETF segment alone has accumulated roughly $107.65 billion in assets under management, representing approximately 6.5% of Bitcoin’s current market capitalization, underscoring the brokerage and fund-structure role in the pricing and liquidity framework of the space.
The broader risk environment is also shaping how crypto markets interact with traditional tech equities. The indiscriminate sell-off in AI-related shares, as illustrated by Microsoft’s rapid drawdown, feeds into a larger narrative of selective risk appetite rather than a targeted crypto downturn. This broader cross-asset mood can complicate trading strategies that rely on near-term catalysts in crypto markets, making the coming weeks a test of whether the weakness is transitory or a signal of a more persistent capital reallocation away from crypto-priced instruments.
Industry observers have pointed to elevated leverage in certain derivatives venues as another contributor to the slide. In a note cited by CryptoQuant, high leverage positions at a decentralized derivatives exchange were found to have suffered material losses in a short period, illustrating how leverage can amplify market moves across a downturn. The biography of risk surrounding crypto ETPs is not purely driven by on-chain metrics; it also reflects how investors deploy (and unwind) leverage via derivatives and related products when sentiment shifts.
Beyond the price action, underlying structural elements such as asset stewardship and regulatory signals continue to shape the landscape. The UK market has already shown a willingness to adopt crypto ETPs through new launches, as Valour and other providers received regulatory clarity in the wake of lifting certain restrictions; these evolutions could reintroduce fresh demand channels for BTC and ETH exposures once the macro fog clears.
What to watch next
- Next batch of crypto ETP flow data and updated weekly aggregates to assess whether outflows persist or begin to reverse.
- Regulatory developments in the UK and elsewhere that enable new ETPs and potential shifts in product structure for BTC and ETH exposures.
- Liquidity and leverage metrics in key derivatives venues, particularly around Hyperliquid and other decentralized platforms mentioned by market analytics firms.
- Price action for BTC and ETH in the near term, with attention to macro catalysts and potential support levels that could trigger a capex-based repricing of risk assets.
Sources & verification
- SoSoValue data on outflows for BTC and ETH and the scale of spot BTC ETF withdrawals
- TradingView data on gold price movements and context around XAUUSD
- CoinShares and related AUM updates for crypto ETPs and overall crypto ETP market share
- CryptoQuant commentary on leverage exposure and Hyperliquid’s long positions wiped out during the session
- UK regulatory moves and related ETP launches such as Valour’s BTC/ETH products post-FCA developments


Key Highlights
- Bitcoin surged past $72,000 following Israeli PM Netanyahu’s announcement of Lebanon ceasefire discussions
- BTC has gained 9% in the last 30 days, contrasting sharply with the iShares Tech-Software ETF’s 12% decline
- February PCE inflation registered at 2.8% YoY, matching market expectations
- Q4 GDP for the US was adjusted downward to 0.5% annualized, intensifying recession worries
- March CPI report — the inaugural reading since US-Iran conflict escalation — releases tomorrow with higher projections
Bitcoin climbed beyond the $72,000 threshold on Thursday, buoyed by encouraging developments in Middle Eastern diplomatic relations. Israeli Prime Minister Benjamin Netanyahu directed his cabinet to initiate ceasefire discussions with Lebanon focused on Hezbollah disarmament. This announcement transformed what had been a declining session for cryptocurrency markets.
The flagship cryptocurrency surged approximately 3% following the announcement, touching $72,300. American equities also rebounded, with the Nasdaq advancing 0.65%. WTI crude oil retreated from nearly $103 per barrel to approximately $98.60 in response to the diplomatic development.
Bitcoin demonstrated superior performance compared to other leading digital assets throughout the trading session. Ethereum (ETH), Solana (SOL), and XRP each posted gains below 1%, while BTC maintained its dominant position.
Earlier during the session, February PCE inflation figures aligned with analyst predictions. The Bureau of Economic Analysis disclosed that PCE increased 2.8% year-over-year, while core PCE moderated to 3%, declining from January’s 3.1%.
BREAKING: February PCE inflation, the Fed’s preferred inflation measure, was unchanged at 2.8%, in-line expectations of 2.8%.
Core PCE inflation falls to 3.0%, in-line with expectations of 3.0%.
This marks the final pre-Iran War PCE inflation datapoint.
— The Kobeissi Letter (@KobeissiLetter) April 9, 2026
Bitcoin had begun its recovery trajectory before the ceasefire announcement, climbing from an intraday trough of $70,500 to approximately $71,200 subsequent to the inflation data publication.
Notably, the February PCE statistics reflect the timeframe preceding the late-February commencement of US-Iran military tensions. Market analysts and investors are anticipating more recent economic indicators to gauge how the conflict has influenced pricing dynamics.
Bitcoin Diverges From Software Equity Performance
Bitcoin and software sector equities have exhibited contrasting trajectories throughout the past 30 days. The iShares Expanded Tech-Software ETF (IGV) has declined 12% over this period, whereas BTC has appreciated 9% during the same timeframe.
The 20-day correlation coefficient between Bitcoin and IGV has fallen to 0.34, indicating a pronounced divergence in the performance characteristics of these two asset classes.
Federal Reserve Maintains Position as Recession Indicators Emerge
The fourth quarter US GDP underwent a downward revision to a 0.5% annualized growth rate, signaling economic deceleration. Nevertheless, market participants displayed reduced risk aversion, partially attributable to expectations that weakening growth increases the likelihood of governmental liquidity interventions.
FOMC meeting minutes disclosed Wednesday revealed Federal Reserve officials maintain receptivity to rate reductions this year, although a majority indicated they would contemplate rate increases should inflation persist substantially above the 2% objective. CME FedWatch probabilities indicate a 98.4% likelihood that the Fed maintains its current rate stance at the April 29 policy meeting.
A weakening US dollar has provided tailwinds for Bitcoin, as diminished confidence in the Federal Reserve’s inflation control capabilities typically favors assets with limited supply.
March CPI data is slated for Friday’s release. Wall Street consensus forecasts project 3.3% YoY, representing an increase from February’s 2.4%, constituting the initial inflation measurement since the onset of US-Iran hostilities.


Quantum computing has become one of the hottest topics lately, thanks to Google saying that a sufficiently powerful machine could exploit legacy blockchains with less firepower than initially estimated.
For XRP holders, a nuanced answer, based on expert takes, is that XRP’s architecture is better positioned than Bitcoin’s. XRP is the digital token operating on the XRP Ledger (XRPL), which is a open-source, decentralized blockchain. Ripple is a fintech company that co-founder this ledge.
Let’s discuss in detail, one step at a time.
The threat
Every major blockchain shares the same fundamental cryptographic features that include a private key, which is the secret password that you never share but use to sign and execute transactions on the distributed ledger.
For this, a public key is mathematically derived, and from that, your wallet address is generated, which you share with others to receive funds.
The quantum vulnerability that everyone is talking about is that a sufficiently powerful machine running the so-called Shor’s algorithm could theoretically reverse-engineer your private key from the exposed public key, draining your funds.
Typically, your public key is exposed to the network when you send a transaction, and when you receive funds, only your address is on-chain. This is why your account activity, whether you have sent funds, makes you quantum vulnerable, not your balance or how long you have held the address.
XRP’s exposure
This week, XRP Ledger’s validator Vet, ran a quantum vulnerability audit of the entire ledger and found that around 300,000 XRP accounts holding 2.4 billion XRP have never sent any funds. They have so far received only funds, meaning their public keys have never been exposed to the network.
These accounts are therefore quantum-safe by default.
However, there are dormant whale accounts that have transacted before and exposed their public keys, but this happened at least 5 years ago. They are essentially exposed and not active. If a quantum computer comes into existence tomorrow, these whales would be in trouble.
Vet found two such accounts on the entire XRP Ledger, and together they hold 21 million XRP. While that sounds a lot, it’s just 0.03% of the circulating supply.
Note that the vulnerability is based on the assumption that they are dormant and not around for “key rotation” – an XRPL feature that lets you swap your signing key without moving funds at all. Think of it this way: You can change the lock on your house (account) without having to move house. This way, your funds stay safe, no send transaction occurs, and anyone holding your old key is locked out of your account.
“The XRP Ledger is account based and allows for signing key rotation. so you can rotate keys that sign on behalf of an account without switching the account. this is obviously not a perfect solution at all and actual quantum resistant algorithms will eventuell be adopted,” Vet said on X.
Technically, this feature is available for everyone, but the problem arises when people are not around to use it – the so-called long dormant accounts, who may have lost keys, passed away, or simply aren’t paying attention. That is what makes them vulnerable.
Mayukha Vadari, staff software engineer at Ripple, pointed to the “escrow feature” as another defense against quantum risk.
He said that funds locked in escrow with a time lock are safe not because of cryptography, but because of logic — a time lock simply prevents withdrawal until a specified time has passed.
“Time locks aren’t hash based either, you just can’t get in until that time has passed (at least not via quantum – you’d need some other bug for that). Yeah that’s true, can’t stop a blackholing – but the attacker is less incentivized to do that because they don’t get the funds,” Vadari said.
How Bitcoin compares
The quantum threat to Bitcoin appears worse than that to XRP for two reasons.
First, the sheer scale. A significant portion of early bitcoin was mined using a format called P2PK, which exposed public keys directly in the transaction output – no spend transaction required. This includes Satoshi Nakamoto’s 1 million BTC, which has never moved. Broadly speaking, estimates of quantum-vulnerable dormant bitcoin range from 2.3 million BTC to as high as 7.8 million BTC. This represents between 11% and 37% of bitcoin’s circulating supply.
All of these are sitting ducks for a potential quantum attacker.
Even holders who recognize the threat and want to protect face a structural problem that XRP holders do not. That’s because Bitcoin’s blockchain lacks a key rotation feature, leaving holders with only one option: move funds to a new address whose public key has never been seen. Funds at that new address are quantum-safe.
However, when you move funds from old to new, the transaction sits in the memory pool (a temporary waiting room) for about 10 minutes. During this time, the public key of the old address is exposed. A sufficiently strong quantum machine can exploit this public key within ten minutes. This risk is still largely theoretical, but it points to bitcoin holders’ relative structural vulnerability.
That said, note that Bitcoin developers have already initiated several proposals to develop quantum resistance.


SEC chair Paul Atkins says “Project Crypto” means the SEC and CFTC are ready to implement the CLARITY Act as soon as Congress passes comprehensive market‑structure reforms.
Summary
- SEC chair Paul Atkins says “Project Crypto” is designed so SEC and CFTC can implement the CLARITY Act as soon as Congress moves.
- Treasury Secretary Basant has urged lawmakers to advance comprehensive market‑structure safeguards to President Trump’s desk.
- The comments signal regulators are aligning around a post‑CLARITY operating framework, putting pressure back on Congress.
U.S. Securities and Exchange Commission (SEC) chairman Paul Atkins has signaled that the agency considers itself operationally ready to implement the long‑discussed CLARITY Act, once Congress passes the underlying legislation. In a post on social media, Atkins said “the design goal of Project Crypto is that once Congress takes action, the SEC and CFTC will be ready to implement the CLARITY Act,” describing the work as a joint preparedness effort rather than a theoretical exercise. The comment suggests regulatory staff have already mapped out rulemaking, supervision, and enforcement workflows for a future in which digital assets sit under a clearer statutory framework.
Atkins explicitly aligned his remarks with Treasury, backing recent comments by Treasury Secretary Basant that “it’s time for Congress to plan for future regulatory safeguards and advance comprehensive market structure legislation to President Trump’s desk.” Framed together, the statements amount to a coordinated nudge from market regulators and Treasury: the bottleneck is now legislative, not administrative. The reference to “comprehensive market structure legislation” implies that CLARITY is being treated less as a narrow crypto bill and more as a broader rewrite of how digital assets, intermediaries, and trading venues are slotted into U.S. securities and commodities law.
CLARITY Act heading to Congress
For the crypto industry, the message cuts in two directions. On one side, a prepared SEC‑CFTC “Project Crypto” environment could bring long‑sought certainty on when tokens are treated as securities, which venues qualify as exchanges, and how custodians, brokers, and stablecoin issuers are supervised. On the other, a ready‑to‑deploy framework also means that once Congress acts, the implementation phase could move faster than some market participants expect, leaving less room to adjust business models mid‑stream. With both the SEC and Treasury now publicly stressing readiness and urging Congress to “plan for future regulatory safeguards,” the next move belongs to lawmakers – and the eventual shape of the CLARITY Act will determine whether this regulatory preparedness feels like relief or whiplash.
The crypto market rose by over 1.4% over the past day. However, Bittensor (TAO) missed the market-wide recovery.
The token dropped over 9% over the past 24 hours. The decline made TAO the worst-performing top-100 cryptocurrency by market cap. At press time, it traded at $292.
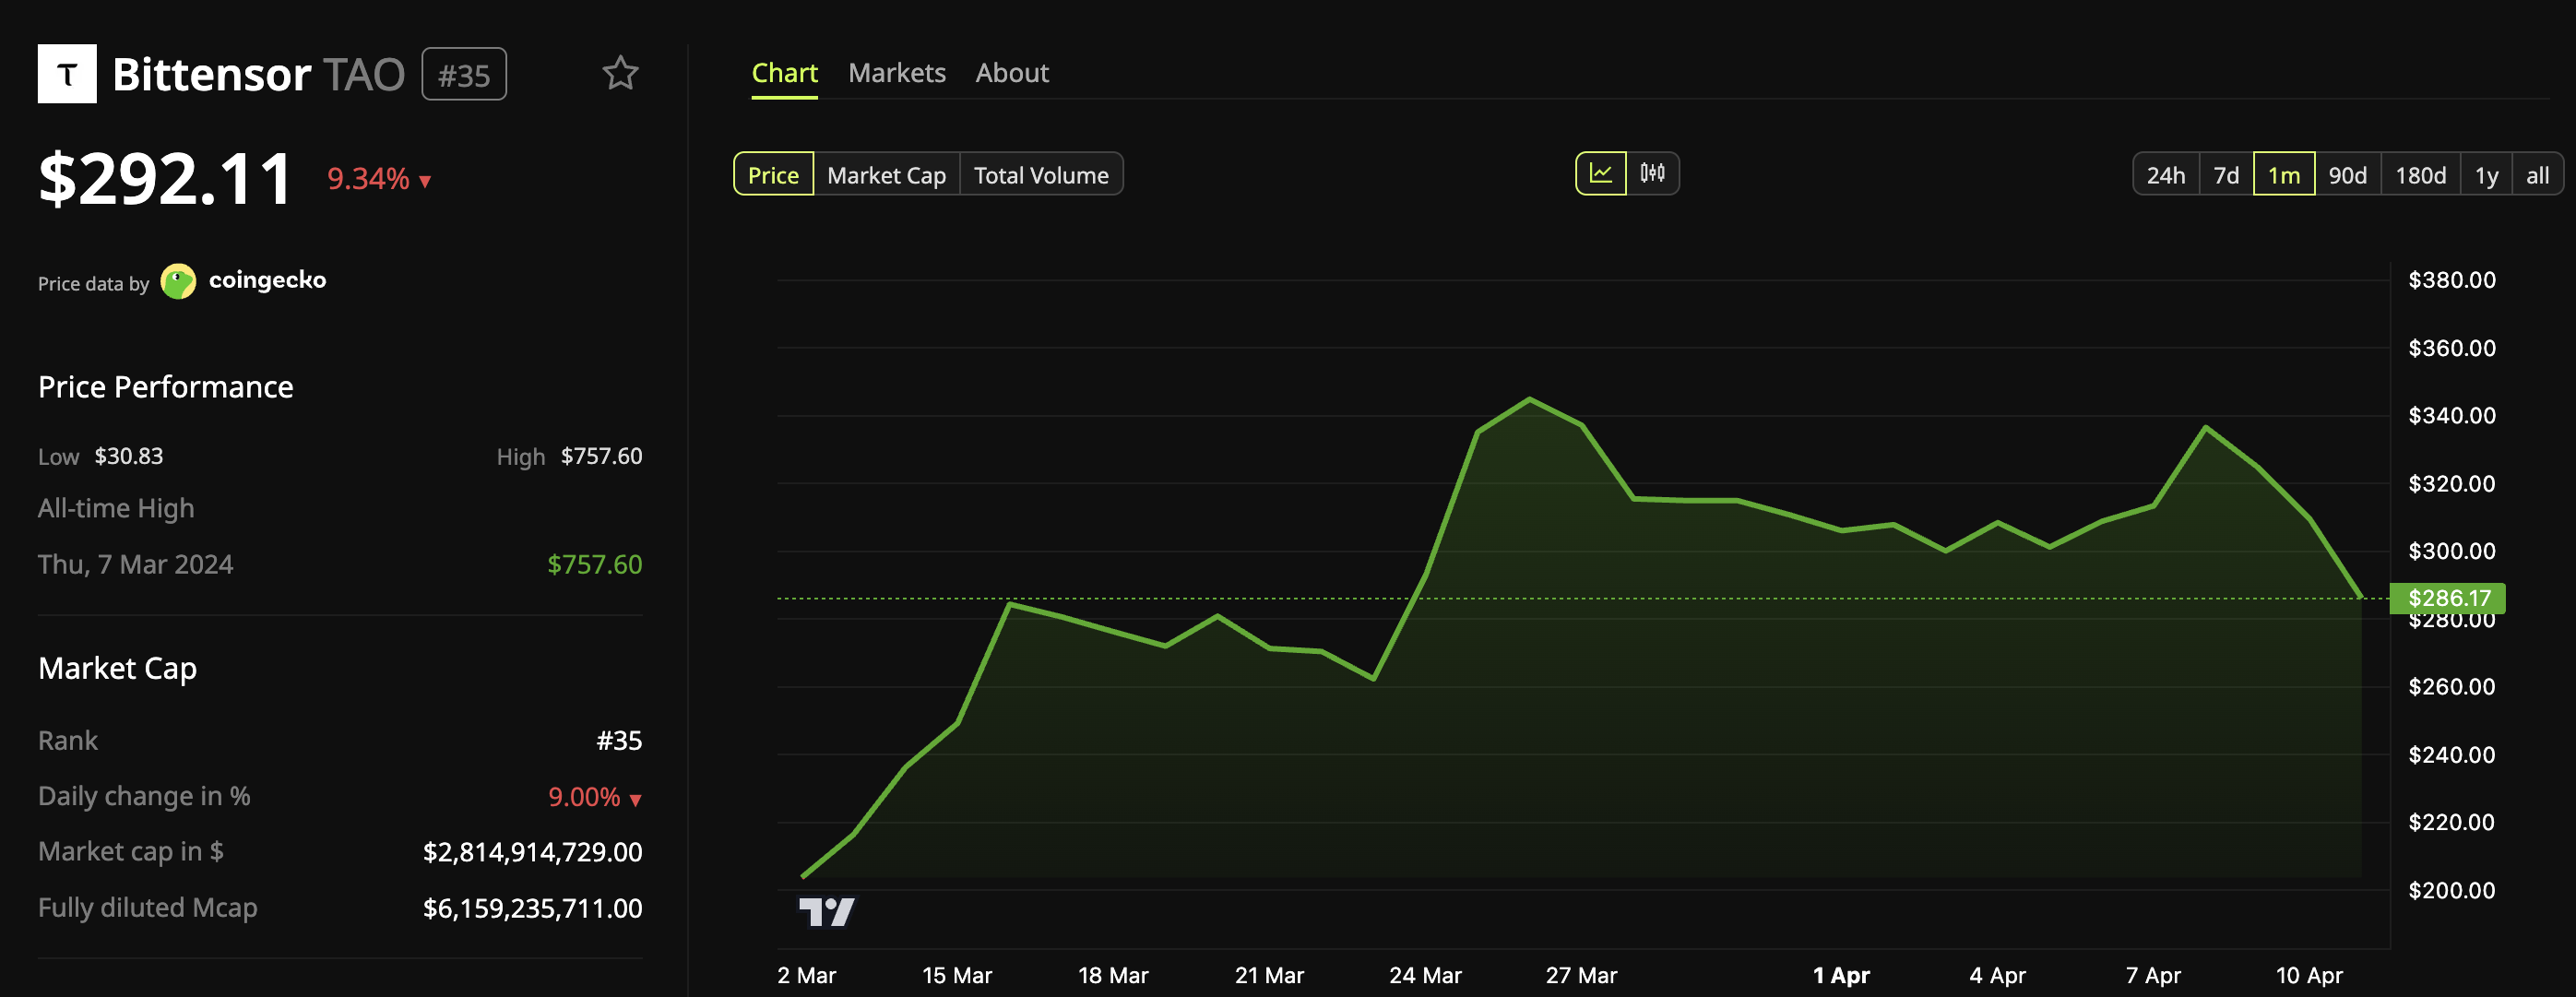
The selloff followed Covenant AI’s announcement that it is leaving the Bittensor network. The team operated three subnets, Templar (SN3), Basilica (SN39), and Grail (SN81), making it one of the protocol’s most prominent contributors.
Sam Dare, the founder of Covenant AI, cited concerns about decentralization as the reason for the departure. In a public statement, Dare accused Bittensor co-founder Jacob Steeves of exercising centralized control over what is marketed as a decentralized network.
Specifically, Covenant AI alleges that Steeves suspended emissions to its subnets, stripped its moderation access over its own community channels, unilaterally deprecated its subnet infrastructure, and applied economic pressure through strategically timed token sales.
“We cannot in good conscience continue to build on a network where the foundational claim we make to our investors, that this infrastructure is decentralized and permissionless, is contradicted by the reality of how the network is actually governed,” Dare wrote. “Bittensor operates a triumvirate structure, three individuals who manage the multisig for network upgrades, presented to the community as distributed governance. It is not. It is decentralization theatre.”
Follow us on X to get the latest news as it happens
The exit marks a dramatic shift in sentiment. Covenant AI’s Covenant-72B model was previously a key trigger for a significant TAO rally. The altcoin appreciated after NVIDIA CEO Jensen Huang referenced the model during an appearance on the All-In Podcast.
Despite leaving Bittensor, Covenant AI said it will retain its research team, existing work, and the models. The company indicated that new project announcements are expected soon.
“Covenant AI’s mission has not changed. Decentralized, permissionless AI training is not a Bittensor feature. It is a technological capability that our team is eager to advance,” the post added.
Whether the departure triggers further governance debate within the Bittensor community remains to be seen in the days ahead.
Subscribe to our YouTube channel to watch leaders and journalists provide expert insights
The post Bittensor’s TAO Leads Crypto Losers After Key Subnet Operator Departs appeared first on BeInCrypto.


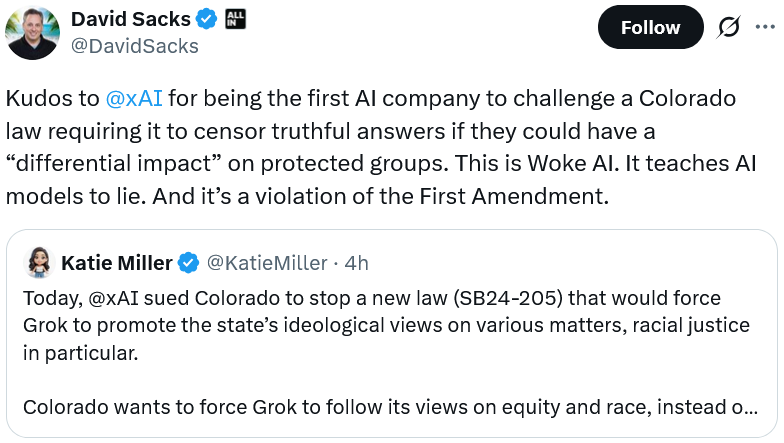
Elon Musk’s xAI is taking Colorado to court over a new set of regulations designed to govern artificial intelligence.
Summary
- xAI has filed a lawsuit against Colorado to block Senate Bill 24-205 which would mandate rules against discrimination in AI systems used for jobs and housing.
- The company argues that the state is attempting to force its own political views onto the Grok chatbot and is interfering with its goal to be a truth-seeking platform.
The lawsuit, filed in a US district court on Thursday, seeks to stop Senate Bill 24-205 from taking effect. This law was created to prevent “algorithmic discrimination” by AI in sensitive sectors such as housing, finance, and employment.
The legal challenge centers on the idea that the state is overstepping its bounds by influencing how AI models communicate.
In the court filing, xAI claimed that “Colorado cannot alter xAI’s message simply because it wants to amplify its own views on the highly politicized subjects of fairness and equity.” The company also noted that the mandate would hinder its mission for Grok to be “maximally truth seeking.”
Legal representatives for xAI pointed out what they see as a contradiction in the bill, which is scheduled to start on June 30. They argued that the law actually encourages “differential treatment” under the guise of trying to “increase diversity or redress historical discrimination.”
Last December, xAI sued California over the Generative AI Training Data Transparency Act. In that case, the company argued that being forced to disclose data sources violates the First and Fifth Amendments by revealing trade secrets and compelling specific types of speech.
Amidst these state-level fights, some federal officials are calling for a change in how the industry is managed.
David Sacks, the White House AI czar and co-chair of the President’s Council of Advisors on Science and Technology, has been vocal about the need for a national standard.
“The problem that we’re seeing right now is that you’ve got 50 different states regulating this in 50 different ways, and it’s creating a patchwork of regulation that’s difficult for innovators to comply with,” Sacks stated in late March.
President Donald Trump appointed Sacks as co-chair of the newly established President’s Council of Advisors on Science and Technology to help streamline these rules and prevent a fragmented legal landscape across the country.
Trump recently signed an executive order aimed at centralizing these policies, with the goal of “nationalizing AI policy in place of the current patchwork of state laws.”
The administration has signaled that state-level mandates requiring AI to alter its output could be viewed as an obstruction to national interests and American leadership in the sector.


Bitcoin’s push past $73,000 quickly lost steam as the market shifted focus back to a shaky truce between the U.S. and Iran.
Summary
- Bitcoin failed to hold above $73,000 as Iran tensions and weak US data weighed on sentiment.
- Oil near $97 and a 0.4% rise in core PCE added pressure on risk assets.
While a brief rally took place after rumors surfaced that Iran might accept Bitcoin as payment for cargo ships moving through the Strait of Hormuz, the excitement faded. Investors are now worried that geopolitical friction could undo the progress Bitcoin has made in the U.S. market recently.
Tensions flared when Iranian parliamentary speaker and former IRGC general Mohammad Bagher Ghalibaf criticized the ongoing military actions in Lebanon.
Ghalibaf, a key figure in the regime, warned that any “illegal entry” or “denial of uranium enrichment” would be seen as a move to “violate the ceasefire” and could trigger a larger conflict.
This instability pushed crude oil prices back up to $97 per barrel. Rising energy costs typically pull money away from speculative assets like crypto as investors become more cautious about risk.
However, the pressure isn’t just coming from overseas; data from the U.S. Bureau of Economic Analysis showed that the core PCE index rose by 0.4% on Thursday. This suggests that inflation is stickier than expected, making it harder for the Federal Reserve to pivot.
Economic growth is also slowing down significantly. The fourth quarter GDP was revised down to a tiny 0.5% annualized rate, signaling that the economy is almost at a standstill.
Usually, signs of stagnation lead traders to expect the government to step in with more liquidity, but this time, the data has sparked genuine fear. A lack of faith in the plan to avoid a recession has already softened the U.S. dollar against a basket of other major currencies.
Will Bitcoin price go up?
Currently, Bitcoin is stuck in an awkward spot between these two narratives. It is trying to find a clear path while being pulled by war headlines on one side and a possible economic crash on the other. This lack of direction is visible on the charts, as the price struggles to stay above $72,000.
For the rally to continue, Bitcoin needs to chew through a massive wall of selling pressure. There are roughly $6 billion in leveraged short positions sitting between $72,200 and $73,500. Even though yesterday’s rally cleared $427 million in these bets, the remaining sell orders are acting as a heavy lid on the price.
Bitcoin needs to firmly break $73,000 and turn that level into support before it can chase new highs. If it fails to clear this liquidity soon, traders may lose heart and start taking profits, which could easily send the price sliding back toward $68,000.
Disclosure: This article does not represent investment advice. The content and materials featured on this page are for educational purposes only.
A new CoinGecko report found that roughly 90% of newly listed altcoins on top centralized exchanges fall below their listing price within 12 months.
The findings paint a grim picture for retail buyers chasing new token listings across the industry’s biggest trading platforms.
Most New Altcoin Listings Lose Value Fast
According to the report, only about 32% of new altcoin listings record positive price action immediately after going live across the top 12 centralized exchanges (CEXs). That means nearly two out of three tokens start losing value from the moment they begin trading.
Follow us on X to get the latest news as it happens
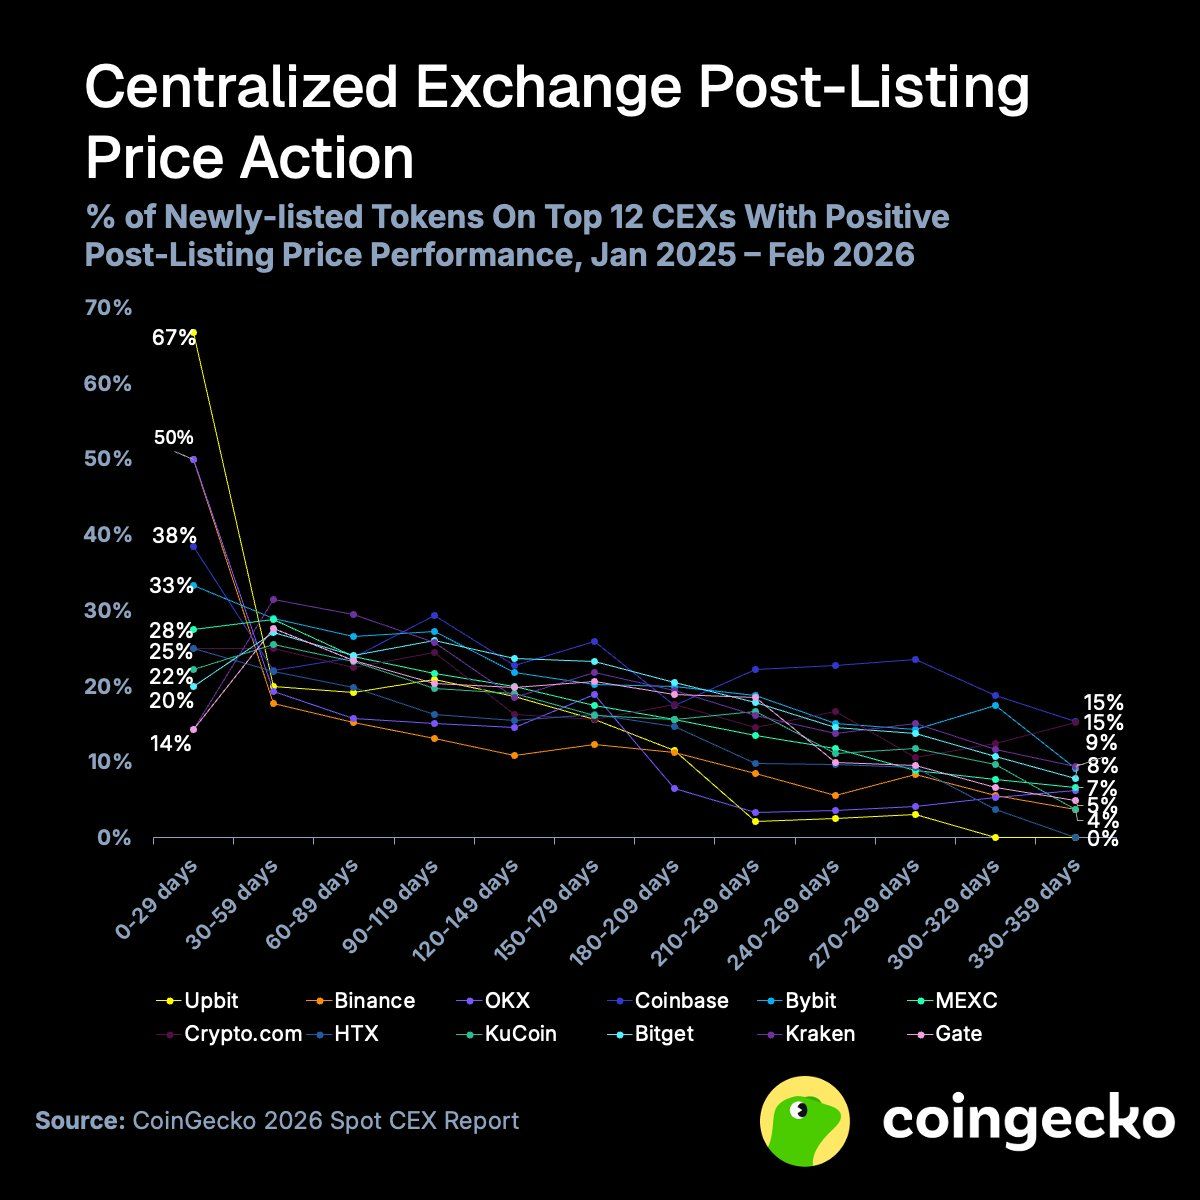
Exchange-level data reveals sharp differences in early performance. Upbit stood out with 67% of its listings showing gains 30 days after debut, though CoinGecko noted that the South Korean exchange has one of the lowest listing rates. Binance followed at 50%, while Kraken and Gate trailed at just 14%.
However, those early gains faded quickly. By days 30 to 59, only 25% of tokens remained in positive territory on average.
“Across longer time frames, this percentage declines somewhat linearly across all exchanges. The only exception is Coinbase, whose listed coins catch a second wind after the half-year mark of being listed on the exchange,” the report read.
Even Upbit’s Winners Eventually Lose
Upbit’s trajectory tells the most striking story. Despite starting with the strongest 30-day performance, every one of its newly listed altcoins fell below its debut price by the 300- to 329-day mark.
That 67% to 0% collapse suggests early gains were driven by hype and limited supply rather than sustainable demand. By the 12-month mark, fewer than 10% of listed tokens on most top exchanges remained above their listing price.
Ultimately, the data reveals a consistent pattern: hype-driven rallies around new listings rarely translate into lasting value. While some tokens see short-term gains, the vast majority struggle to sustain momentum beyond the initial trading window.
Subscribe to our YouTube channel to watch leaders and journalists provide expert insights
The post 90% of New CEX Token Listings Fall Below Debut Price Within a Year, Report Finds appeared first on BeInCrypto.
Elon Musk’s artificial intelligence company, xAI, has filed a lawsuit against the state of Colorado, seeking to block incoming AI rules that restrict speech from AI chatbots like Grok.
The AI company is specifically challenging Colorado’s Senate Bill 24-205, which aims to protect AI users from “algorithmic discrimination” in areas like employment, housing and finance.
However, in a filing to a US district court in Colorado on Thursday, xAI argued that “Colorado cannot alter xAI’s message simply because it wants to amplify its own views on the highly politicized subjects of fairness and equity.”
The company further argued that the law, set to take effect on June 30, is contradictory as it promotes “differential treatment” in an effort to “increase diversity or redress historical discrimination.”
Forcing xAI to change Grok would also interfere with its goal of being “maximally truth seeking,” it said.

Colorado isn’t the first state that xAI has sued over AI regulations. In December, it sued California over its Generative AI Training Data Transparency Act, arguing that disclosure requirements compel speech and reveal trade secrets in violation of the First and Fifth Amendments.
Related: AI agents overwhelmingly prefer Bitcoin over fiat in new study
The Colorado and California AI laws come after accusations of Grok making racist, sexist and antisemitic comments in the past.
AI rules should be left to federal regulators: David Sacks
White House AI czar David Sacks has led a push for state regulators to steer clear of crafting AI rules, arguing for a single federal standard for AI instead of a “patchwork” of state laws.
“The problem that we’re seeing right now is that you’ve got 50 different states regulating this in 50 different ways, and it’s creating a patchwork of regulation that’s difficult for innovators to comply with,” Sacks said in late March.
Sacks was appointed as co-chair of the newly established President’s Council of Advisors on Science and Technology to address that issue.
Magazine: IronClaw rivals OpenClaw, Olas launches bots for Polymarket — AI Eye
A solo Bitcoin (BTC) miner has beaten extraordinary odds to successfully mine a solo block. The miner earned roughly 3.128 BTC, worth about $222,000, including subsidy and transaction fees.
Wu Blockchain reported that the Bitcoin miner was operating at an estimated hashrate of just 70 terahashes per second (TH/s). That hash power represented approximately 0.0000074% of Bitcoin’s total network hashrate, which sat at over 940 EH/s on April 9.
At that scale, the probability of mining a block on any given day is estimated at around 1 in 100,000, translating to a statistical expectation of roughly one successful block every 300 years.
Follow us on X to get the latest news as it happens
For context, major publicly listed miners operate at tens of exahashes per second, dwarfing the 70 TH/s rig. Thus, that scale gap illustrates how improbable the outcome was.
Meanwhile, the rare win comes amid shifting mining conditions. Global Bitcoin hashrate declined to around 1,004 EH/s in the second quarter of 2026, down from approximately 1,066 EH/s in the previous quarter.
The drop has been largely attributed to weaker mining profitability, which has forced less efficient machines offline.
At the same time, the mining industry is undergoing a structural shift. Many operators are increasingly diversifying into artificial intelligence and high-performance computing workloads.
“Based on recent company announcements, listed miners could derive as much as 70% of their revenues from AI by the end of this year, up from roughly 30% today. What began as a marginal diversification strategy is increasingly becoming the core business,” CoinShares noted.
While such solo mining successes remain exceedingly rare, they serve as a reminder that Bitcoin’s decentralized design still allows for unexpected wins, even in an increasingly competitive space.
The post Solo Bitcoin Miner With 70 TH/s Wins Full Block Against 1-in-100,000 Odds appeared first on BeInCrypto.

Coinbase has rolled out a notable upgrade to the x402 protocol, introducing usage-based pricing for agentic AI compute tasks and moving away from the longstanding flat-fee model. The new “Upto” scheme is live, according to Coinbase’s Developer Platform, and is designed to unlock variable-cost services such as large language model inference, data queries, and other AI-backed compute operations.
According to Coinbase, the change addresses a key limitation of the earlier model: fixed prices for all requests, which worked well for deterministic APIs but capped the economics of services where cost scales with usage, token counts, or query complexity. The Upto framework is built as an Ethereum-compatible layer, with ERC-20 support on the tokens side and the CDP Facilitator enabling fully gasless payments on the client side.
Key takeaways
- Upto introduces usage-based pricing on x402, replacing the prior fixed-fee approach for agentic AI tasks.
- Sellers can set maximum prices for tasks; buyers authorize these caps, while actual charges reflect the real resources consumed, potentially reducing overpayment.
- The scheme operates on an EVM-compatible layer and supports ERC20 tokens; the underlying CDP Facilitator enables gasless payments.
- Adoption of x402 has cooled since its November peak, with data from Dune Analytics showing a sharp decline in weekly transactions through Q1 2026.
- Governance has shifted toward broader industry participation, as the Linux Foundation now hosts the protocol, with major tech players like Google, Microsoft, and AWS holding stakes through the x402 Foundation.
From flat fees to flexible usage: what Upto changes for AI compute payments
Under the Upto scheme, sellers can cap the price they’re willing to accept for a given task, while buyers pre-authorize a ceiling. If costs are lower than the maximum, the system charges only what the task actually requires. This marks a shift from the previous regime, where simple and complex requests were priced the same, leaving users exposed to overpayment or underpayment depending on task complexity.
The practical effect for developers and AI operators is twofold. First, it introduces price discovery at the task level, aligning payments with real resource usage rather than a blanket rate. Second, it can reduce friction for experiments with agentic AI workflows, where costs can be highly variable based on token streams, compute duration, and the intricacy of the queries being processed.
In addition, the architecture remains compatible with existing crypto rails: Upto is described as an EVM-compatible layer, while the CDP Facilitator supports gasless transactions, which can streamline experiences for end users who expect near-instant, fee-free onboarding and execution from their wallets. These elements are crucial as developers explore widespread AI agent deployment, where the cost of inference and data access can swing dramatically over time.
Market backdrop: adoption trends and what this means for agentic AI payments
Even as Coinbase markets Upto as a practical remedy to pricing frictions, the broader x402 ecosystem has faced a notable retrenchment in 2026. Dune Analytics data shows that after peaking during a standout week in early November, the network’s activity faded considerably. During the week of November 4–10, x402 processed about 13.7 million transactions — its all-time high for weekly volume — but weekly transaction counts have since fallen below the 1 million mark in early January and continued to slide into the first quarter. By the last week of March, total activity stood at roughly 112,708 transactions, underscoring a sharp deceleration in adoption.
The shift matters for any assessment of agentic AI’s economics. A pricing regime that ties costs more tightly to actual usage could help rebuild demand if buyers and sellers can reliably predict costs for complex AI tasks. It also heightens the importance of on-chain efficiency, instant settlement, and cost transparency as usage grows. While Upto directly targets cost alignment for AI workloads, the broader question remains: will pricing flexibility alone reverse the recent downtrend, or will buyers demand additional incentives—faster settlement, more interoperable primitives, or deeper tooling support for AI agents?
Governance and industry backing: Linux Foundation and big-tech stake
In a significant governance development, the x402 protocol’s ownership was moved to the nonprofit Linux Foundation earlier this month. The shift signals an emphasis on open governance and standardization as AI agentic services expand. The ecosystem is already backed by a coalition of large technology companies that hold stakes in the protocol through the x402 Foundation, including Google, Microsoft, and Amazon Web Services. This collective involvement reflects industry-wide interest in creating interoperable payment rails that can scale with AI agent usage.
Beyond pure technical advantages, the move toward neutral stewardship and broad platform participation could influence how future deployments are designed and audited. For developers and enterprise users, such governance structures may offer greater assurances around compatibility, security standards, and long-term maintenance, which are critical as agentic AI services move from experiments to production workloads.
What to watch next
Several development vectors will shape x402’s trajectory in the near term. First, the uptake of Upto will be measured by real-world pilots and early adopters testing AI agent workloads with variable costs. Observers will be watching whether usage-based pricing can rekindle activity on a network that saw a steep decline through Q1 2026. Second, ecosystem momentum around the x402 Foundation will matter: any new collaborations, standardized interfaces, or tooling improvements could accelerate diffusion among developers and enterprises who want frictionless payment primitives for AI services.
Finally, the industry’s ongoing conversation about agentic AI economics—how to monetize autonomous compute, data access, and inference at scale—will intersect with pricing innovations like Upto. If the model proves durable, it could influence other protocols seeking to support dynamic workloads and near-instantaneous settlements in AI-driven ecosystems.
Readers should monitor updates from Coinbase and the x402 Foundation for pilots and performance metrics as usage-based pricing becomes more widely tested in practical AI workflows. As the market weighs these changes, the central questions remain: will usage-based pricing unlock renewed demand, and can governance-backed protocols deliver the reliability that builders and users require for agentic AI at scale?

Yorkshire Rose Candles of Thirsk success with county themes

Australia inks fresh fuel supply deal with Singapore
Bitcoin (BTC) Surges Past $72K Following Netanyahu’s Lebanon Ceasefire Announcement


-

 Fashion7 days ago
Weekend Open Thread: Spanx – Corporette.com
-

 Business4 days ago
Three Gulf funds agree to back Paramount’s $81 billion takeover of Warner, WSJ reports
-

 Sports5 days ago
India men’s 4x400m and mixed 4x100m relay teams register big progress | Other Sports News
-

 Business6 days ago
Expert Picks for Every Need
-

 Tech2 days ago
How Long Can You Drive With Expired Registration? What Florida Law Says
-

 Business5 days ago
No Jackpot Winner, Prize to Climb to $231 Million
-

 Fashion4 days ago
Massimo Dutti Offers Inspiration for Your Summer Mood Board
-

 Fashion3 days ago
Let’s Discuss: DEI in 2026
-
Politics7 days ago
Wings Over Scotland | The quality of mercy
-

 Crypto World2 days ago
Bitcoin recovers as US and Iran Agree a Ceasefire Deal
-

 Business5 days ago
Akebia Therapeutics, Inc. (AKBA) Discusses Pipeline Progress and Strategic Focus on Kidney Disease Treatments at R&D Day – Slideshow
-

 Crypto World18 hours ago
Canary Capital Files SEC Registration for PEPE ETF
-
 Business7 days ago
HPS FY 2025 slides: SaaS inflection drives 22% revenue growth
-

 Fashion7 days ago
Frugal Friday’s Workwear Report: Hammered Metallic Button Sweater Vest
-

 Politics6 days ago
The UK should not pay a penny in slavery reparations
-

 Tech4 days ago
Haier is betting big that your next TV purchase will be one of these
-

 Fashion7 days ago
Tory Burch’s Spring 2026 Campaign Goes on a Getaway
-

 Fashion7 days ago
Weekly News Update, 4.3.26 – Corporette.com
-

 Tech4 days ago
Samsung just gave up on its own Messages app
-
 NewsBeat7 days ago
Rory McIlroy hopes to emulate greats as he aims to make more history
You must be logged in to post a comment Login