
Crypto World
Dogecoin price analysis: profit-taking stalls rally attempts as breakout setup forms


- Dogecoin (DOGE) stalls near $0.095 as profit-taking caps upside.
- DOGE price is currently compressing between the $0.089 and $0.095 range.
- A breakout is likely as volatility builds ahead of April 20.
The price action around Dogecoin continues to sit in a tight and indecisive range, with recent trading showing very little directional strength.
At the time of writing, DOGE was trading around $0.092, moving inside a narrow 24-hour band between $0.091 and $0.0947.
Each attempt to push higher has been met with immediate resistance at $0.0947, while pullbacks continue to find support around $0.091, creating a balanced but fragile structure, where price remains stable on the surface but increasingly tense underneath.
Profit-taking pressure keeps bulls in check
A key factor limiting DOGE’s upside momentum is consistent profit-taking near local highs.
Over the past trading sessions, price has repeatedly failed to hold above $0.094–$0.095, with every move into this zone triggering selling and pushing price back toward the mid-range near $0.092.
This behaviour is reinforced by the broader weekly structure.
Despite minor gains of around 1% over the past 7 days, DOGE remains largely unchanged across longer timeframes, with only +0.8% over 30 days.
This lack of trend continuation suggests that buyers are not committing beyond short-term trades.
On top of that, derivatives positioning has added scepticism to the upside.
The presence of notable short positions in the market shows that some traders are actively betting against sustained rallies.
This does not guarantee downside movement, but it does explain why upward pushes struggle to build momentum.
Compression builds as technical structure tightens
From a technical perspective, DOGE is clearly in a compression phase.
The 24-hour range of roughly $0.091 to $0.0947, combined with a 7-day range of just over $0.089 to $0.095, highlights how tightly the price is coiling.
This structure aligns with a descending triangle pattern, where lower highs continue to form while support remains anchored near the $0.089–$0.090 zone.

At the same time, price is also trading inside a broader Ichimoku cloud on the 4-hour chart, which typically signals indecision and equilibrium rather than a trending market.
These overlapping structures matter because they all point to the same conclusion: volatility is being compressed.
When multiple technical signals converge like this, the market often prepares for a sharp expansion move.
However, direction remains undefined until either support or resistance breaks convincingly.
Liquidity positioning and the “Doge Day” factor
Beyond chart structure, short-term market dynamics are also shaping sentiment.
Robinhood transferred 327 million DOGE (valued at about $30 million) from cold storage to hot wallets on April 9.
While this is not direct buying pressure, it is widely interpreted as preparation for increased trading activity.
This timing is notable as it coincides with growing attention toward the upcoming “Doge Day” period around April 20.
Historically, these events tend to increase retail participation and short-term volatility, even if they do not always produce sustained trends.
At the same time, broader crypto conditions have provided only mild support.
Bitcoin’s modest gains have helped stabilise sentiment across the market, but DOGE has not shown strong independent momentum. Instead, it continues to trade within its own compressed structure.
Key Dogecoin price levels that will define the next move
For now, DOGE remains in a consolidation phase where patience matters more than prediction.
Once price finally breaks out of the current range, the move is likely to be fast, sharp, and decisive, simply because the market has already spent days building pressure without releasing it.
As the market awaits the next move, the most important DOGE price level for traders remains the $0.09 psychological support zone.
Dogecoin price has held above this level consistently, and any sustained breakdown below $0.089 would mark a clear shift in structure.
Below that, the next area of interest sits near $0.088, where previous accumulation has occurred.
On the upside, resistance remains firmly in place between $0.094 and $0.095.
A daily close above $0.095 would be an important technical signal, suggesting that buyers are finally absorbing overhead supply.
If that happens, the next potential target would be the $0.104 region, which marks a previous local high.

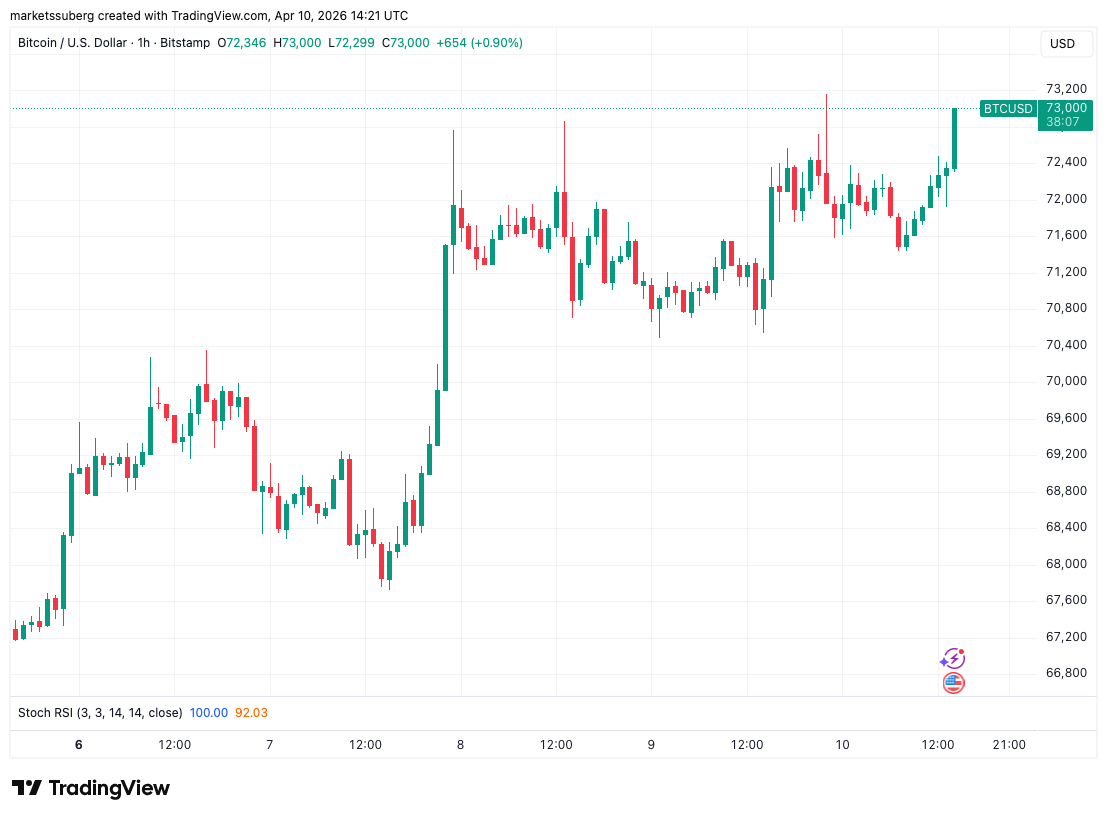
Bitcoin (BTC) tagged $73,000 following Friday’s Wall Street open as crucial US inflation numbers came in below expectations.
Key points:
-
Bitcoin edges higher as US CPI data remains slightly below market expectations.
-
Gasoline prices see a historic surge within the CPI release.
-
Bitcoin traders plan out key resistance levels overhead.
BTC price seeks new local highs after CPI
Data from TradingView showed BTC price eyeing new multi-week highs as markets digested the March print of the Consumer Price Index (CPI).

This was the week’s key macro data release, and the first CPI report to reflect the impact of the US and Israel war in Iran.
Gasoline prices jumped over 21% month-on-month, the Bureau of Labor Statistics (BLS) confirmed, but overall CPI finished 0.1% lower than markets’ expectations.
“Over the last 12 months, the all items index increased 3.3 percent before seasonal adjustment,” an official news release read.
“The index for energy rose 10.9 percent in March, led by a 21.2-percent increase in the index for gasoline which accounted for nearly three quarters of the monthly all items increase.”

Reacting, trading resource The Kobeissi Letter noted that the gas-price CPI jump was the largest monthly gain since 1967. The energy increase, it added in a further post on X, was the largest since 2005.
With the resulting mixed picture of inflationary forces, US stocks were mostly flat at the open, while BTC price action also avoided major moves up or down.

Markets, however, had no hope for the Federal Reserve cutting interest rates — a conclusion already in place on the back of Thursday’s Personal Consumption Expenditures (PCE) index release, per data from CME Group’s FedWatch Tool.
Bitcoin traders draw the next resistance zones
Among Bitcoin market participants, there was modest reason for optimism over the short-term price outlook.
Related: Bitcoin analysis sees $55K BTC price ‘iron bottom’ by December 2026
In their latest X analysis, trader JDK Analysis flagged BTC/USD acting within a narrowing wedge — a topic of debate since February.
“If price makes another attempt at the current key high, the reaction there will be critical!” they wrote in accompanying commentary.

Trader Daan Crypto Trades meanwhile eyed exchange order-book liquidity below $74,000.
$BTC Liquidity levels to watch in close proximity are that ~$71K region below, and $73K-$74K above (local high). pic.twitter.com/BlKsaZXdpb
— Daan Crypto Trades (@DaanCrypto) April 10, 2026
Earlier, Cointelegraph reported on a copycat signal from Bitcoin’s relative strength index (RSI) that began to echo the end of the 2022 bear market.
This article is produced in accordance with Cointelegraph’s Editorial Policy and is intended for informational purposes only. It does not constitute investment advice or recommendations. All investments and trades carry risk; readers are encouraged to conduct independent research before making any decisions. Cointelegraph makes no guarantees regarding the accuracy or completeness of the information presented, including forward-looking statements, and will not be liable for any loss or damage arising from reliance on this content.


Binance offered its staff in the United Arab Emirates the option to temporarily relocate to Hong Kong, Tokyo, Kuala Lumpur and Bangkok amid regional tensions, the company told CoinDesk Friday.
“Given the recent regional tensions, we offered employees the option to temporarily relocate as a precautionary, employee-first measure to provide flexibility and support during a period of uncertainty,” a Binance spokesperson said. “As a remote-first organization, we are well set up to support this kind of flexibility without disruption to our operations.”
The spokesperson also said its operations in the UAE remain unchanged and that many employees have chosen to stay.
“Our operations in the UAE continue as normal — a large number of our team has chosen to remain in the UAE. We remain deeply committed to the UAE as a key hub for Binance and to the broader region,” the spokesperson said. “As a global company, we continue to operate seamlessly and serve our users without interruption.”
The offer of relocation comes after a ceasefire agreement, following roughly six weeks of escalating regional conflict that has disrupted business activity in the UAE. The country has intercepted hundreds of missiles and drones since hostilities began in late February, according to the UAE Ministry of Defense, with additional interceptions reported on April 8.
The Middle East conflict has already disrupted major crypto, business and sports events across the UAE. TOKEN2049 Dubai has been postponed to 2027, while TON Gateway was canceled due to security and travel concerns. Other large events, including Middle East Energy Dubai and the Dubai International Boat Show, have also been delayed, and the Bahrain and Saudi Arabian Formula 1 races, key for crypto sponsorship exposure, are set to be canceled.
In December, Abu Dhabi Global Market (ADGM) said Binance’s global platform would operate under its regulatory framework, marking a significant step in formalizing the exchange’s structure.
Binance, which reportedly has 1,000 staff members or 20% of its total global workforce in the UAE, has also indicated that its worldwide operations are supported from Abu Dhabi, though it has not clearly defined a single global headquarters.


Securitize announced integration with TRON Network to bring tokenized assets to one of the world’s largest blockchains, expanding its multichain presence.
Securitize integrated with TRON Network on April 10, enabling tokenized assets issued by Securitize to be deployed on TRON, one of the world’s largest blockchains. The partnership expands Securitize’s multichain footprint and brings institutional-grade assets to a high-performance network designed for efficient, programmable financial systems.
The integration aligns with growing demand for tokenization infrastructure that bridges traditional finance and blockchain networks. TRON operates as a high-throughput blockchain platform, and this partnership enables Securitize’s tokenized assets—which typically include securities and institutional products—to access TRON’s user base and ecosystem.
Sources: Securitize
This article was generated automatically by The Defiant’s AI news system from publicly available sources.

Bittensor token price has collapsed by 17% in less than 6 hours after one of the network’s most prominent subnet developers publicly torched its relationship with the ecosystem, and the price prediction is getting bearish. The governance bombshell driving this selloff raises a harder question than most traders are asking right now.
On Thursday, Covenant AI, the team behind the Covenant-72B model, widely credited as the largest decentralized LLM pre-training run in history, announced its exit from Bittensor.
— BSCN (@BSCNews) April 10, 2026
 LATEST: BITTENSOR DROPS 16% AS COVENANT AI EXITS THE NETWORK OVER CENTRALIZATION CONCERNS
Covenant AI (@covenant_ai) has exited Bittensor citing concerns over centralized control.
The team said governance is not truly decentralized in practice. It alleged key decisions remain… pic.twitter.com/QlA4AoMWbG
Founder Sam Dare stated that “the promise that drew builders, miners, validators, and investors into this ecosystem is a lie,” accusing co-founder Jacob Steeves of asserting centralized control over Covenant’s subnet after it grew too prominent to ignore.
Steeves has not publicly responded. The statement hit markets like a circuit breaker. TAO had surged 140% over six weeks, with 105% of those gains coming since March 8 alone, largely on the back of Covenant-72B’s success narrative and Grayscale’s filing for a TAO Trust. That entire credibility stack just developed a serious crack.
Discover: The best crypto to diversify your portfolio with
Bittensor Price Prediction: Can TAO Recover?
At current levels near $280, TAO sits in genuinely dangerous technical territory. $300 was the immediate support level, and the price is already trading below it, which means the level has effectively been lost.
On-chain data confirms the severity of the move, with TAO’s 24-hour decline registering among the steepest in the large-cap AI token sector. The April 9 rejection at $360 resistance preceded a bearish MACD crossover, with sellers already positioning before the news dropped.
Social dominance for TAO reached a one-year high in early April, yet retail sentiment shows only 1.5 positive comments per negative comment, suggesting conviction in the prior rally was thinner than price action implied.
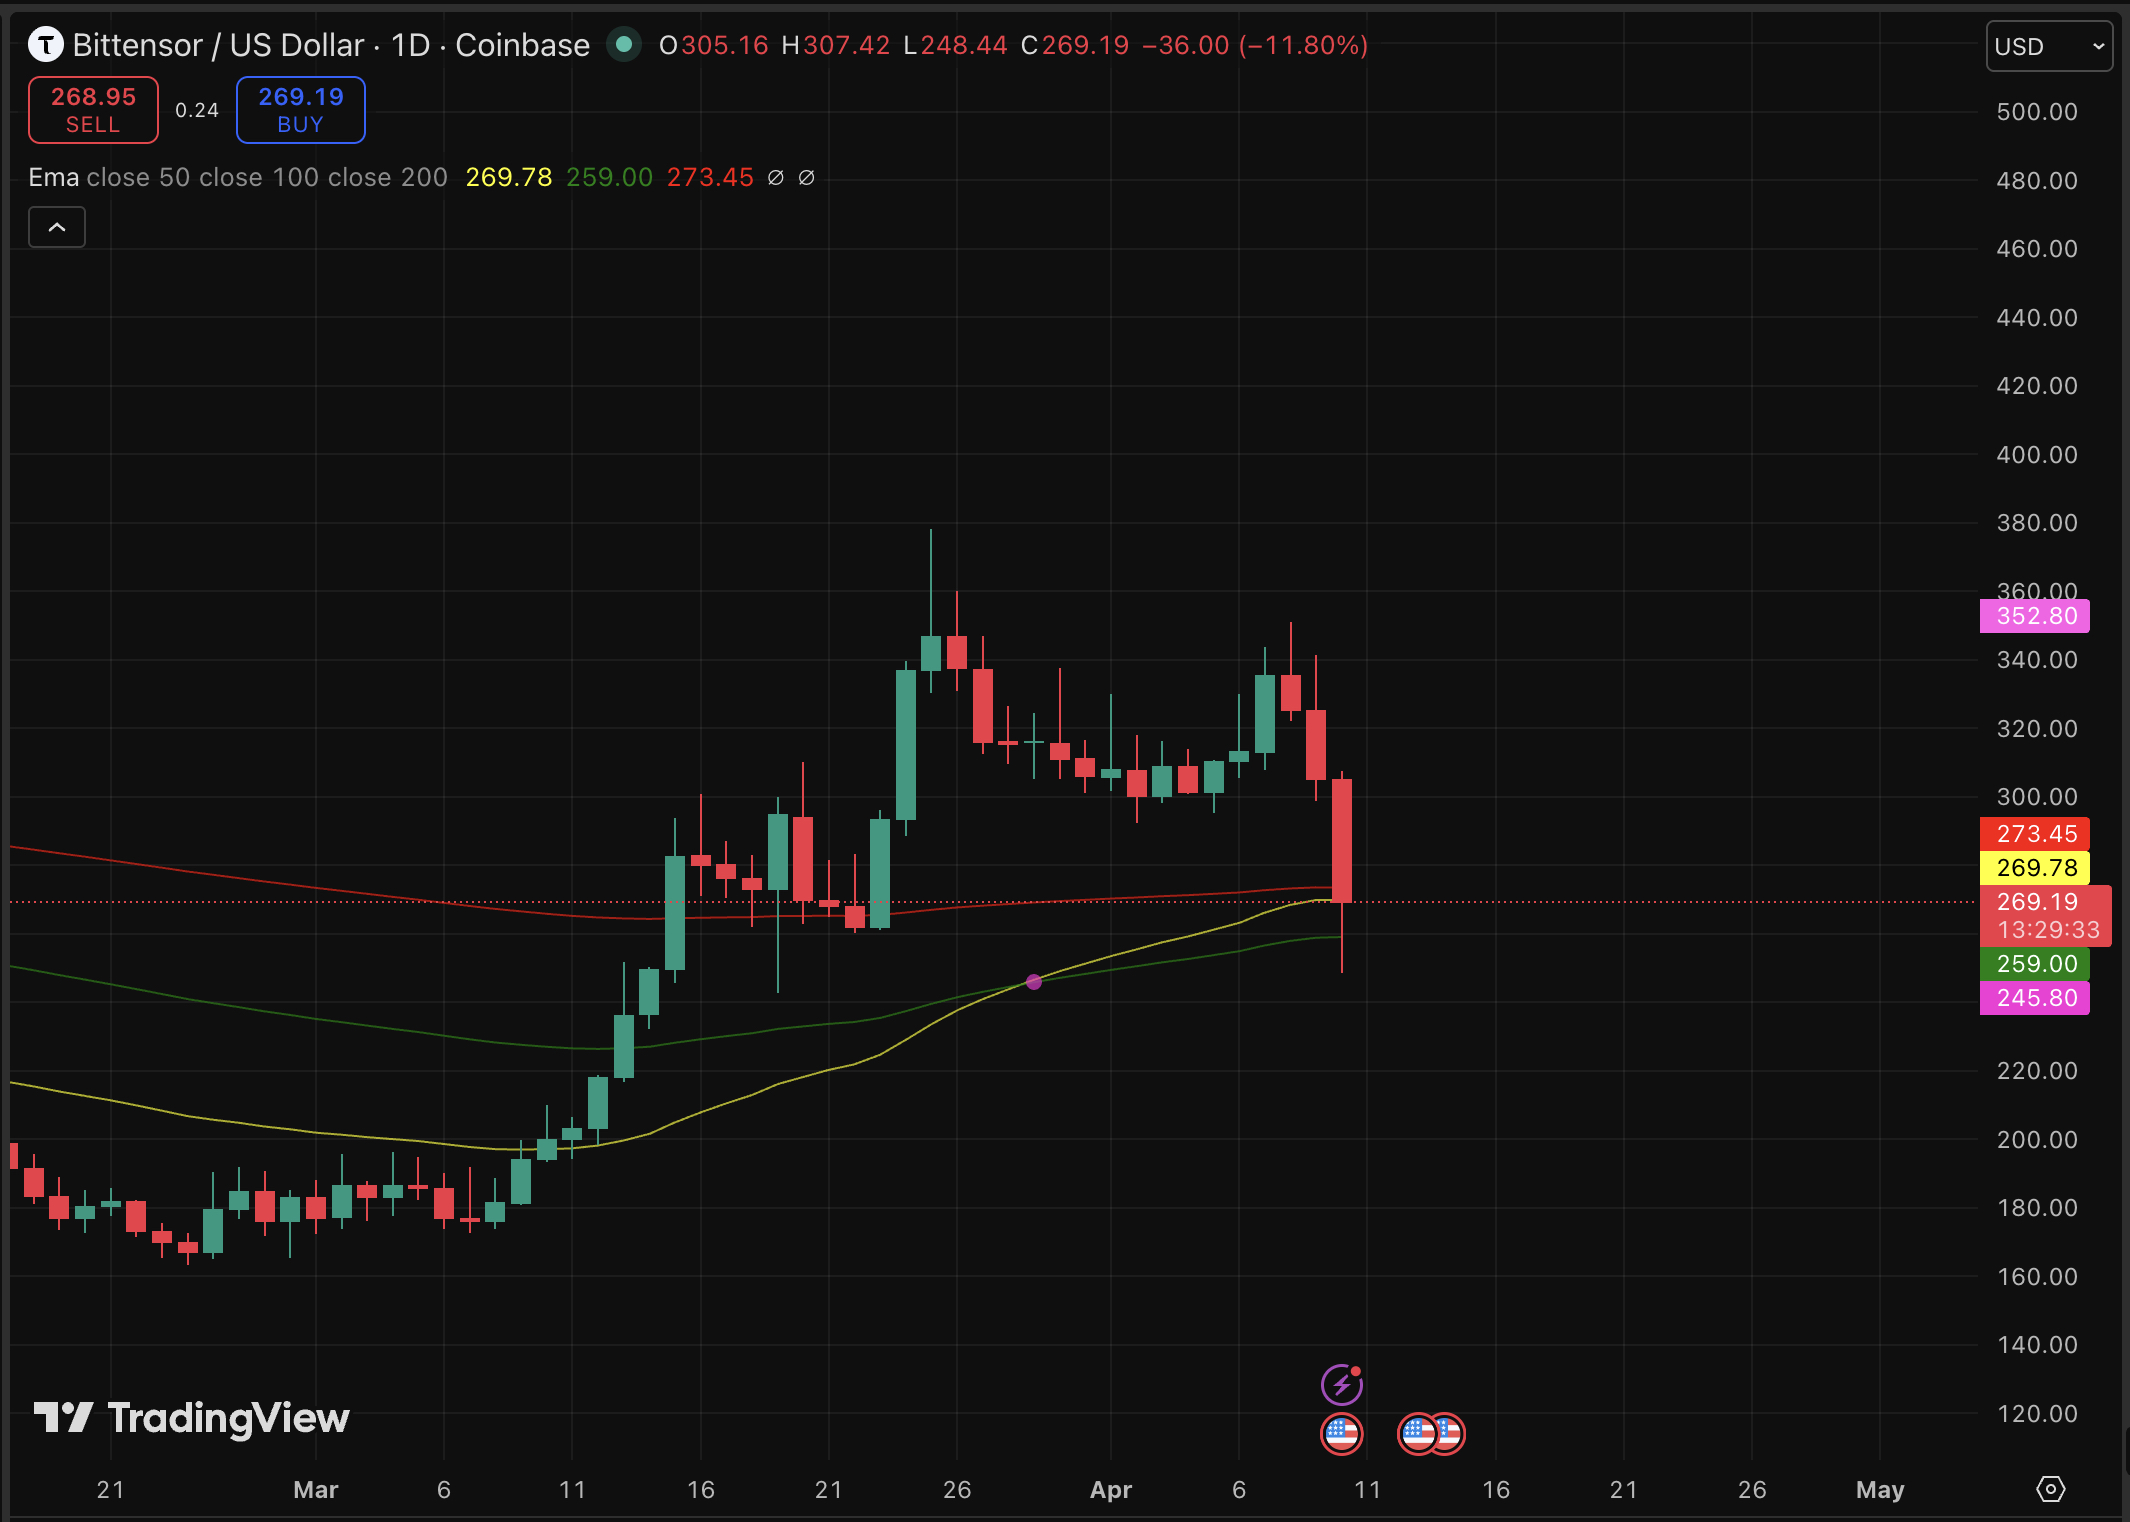
TAO needs to reclaim $300 within 48 hours on a credible response from Steeves or Bittensor’s governance structure for it to stage a recovery toward $320–$330. But continued silence from leadership and further subnet departures can accelerate selling pressure toward $250 or lower.
The parallel to other ecosystem selloffs triggered by major internal exits suggests recoveries can take weeks, not days. Watch the $300 level; this is the line.
Discover: The best pre-launch token sales
Bitcoin Hyper Draws Early Movers as TAO Tries to Recover
Governance risk just repriced TAO’s entire decentralization premium, and that’s the precise vulnerability traders with longer memory have warned about. When a network’s core value proposition gets called a lie by its most successful builder, rotating capital doesn’t wait for confirmation. It moves.
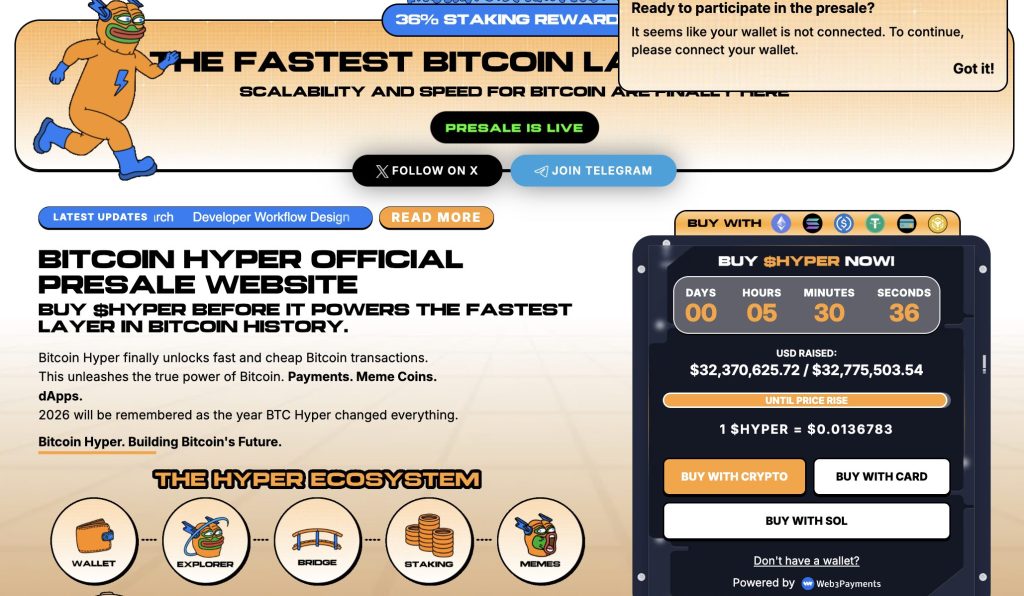
One destination attracting that rotated attention is Bitcoin Hyper ($HYPER), a Bitcoin Layer 2 project positioning itself as the first-ever BTC chain with Solana Virtual Machine (SVM) integration.
The pitch is structural: Bitcoin’s security and liquidity combined with sub-Solana-speed smart contract execution, breaking through BTC’s native limitations of slow transactions, high fees, and zero programmability. No governance triumvirate. No subnet politics.
The presale has raised $32 million at a current price of $0.0136, with staking available for early participants. The project’s Decentralized Canonical Bridge handles BTC transfers natively.
Research Bitcoin Hyper before the next price step triggers.
The post Bittensor Price Prediction: Covenant AI Exits TAO, Forcing 16% Drop appeared first on Cryptonews.


“I am happy to bet $1 billion USD,” Binance founder Changpeng Zhao (CZ) told OKX founder Star Xu, “that: I am officially divorced.”
That escalated quickly.
With one of the largest peer-to-peer bets ever publicly offered, the Binance-OKX feud went nuclear this week.
As if the bet wasn’t interesting enough on its face, according to Xu’s responses, gambling isn’t legal for United Arab Emirates residents, yet polygamy is.
For context, CZ worked at Xu’s crypto exchange, OKCoin, but left under contested circumstances before creating Binance. The two exchanges have been fierce competitors ever since, with periodic public spats over listings and various market practices.
CZ left OKCoin in early 2015 after Xu attempted to renegotiate his equity stake. OKCoin’s 2015 Reddit statement accused CZ of contributing no code, running his own trading bots on company systems, and mounting a campaign of “lies and desperate nonsense” after his departure.
CZ’s memoir characterizes his departure more vaguely, as a clash of vision.
Anyway, what happened that escalated their disagreement to $1 billion?
CZ’s memoir airs years of dirty laundry
When CZ published his book Freedom of Money on April 8, Xu called him a “habitual liar.” Among many accusations, Xu claimed CZ lied about his marital status.
CZ doubled-down, calling Xu’s bet and pushing in $1 billion in chips.
Xu also claimed CZ published falsehoods about his career at OKCoin, his contract dispute with Roger Ver, his alleged manipulation of crypto markets, and whether he was a government informant against Justin Sun.
Fed up, CZ demanded of Xu, “You can apologize now.” He offered “$1 billion USD (or any number you choose),” giving Xu 24 hours to accept.
A refusal, according to CZ’s characterization, would “clearly show who has been mis-representing to the public.”
Xu declined, citing not only the illegality of gambling in his country of residence, but also his professional obligations.
“As the ultimate beneficial owner of a regulated company, publicly offering a $1 billion bet is hardly professional conduct,” he said.
Yi He backs up CZ
Xu demanded details about the largest source of CZ’s personal wealth. “Has your Binance stake been legally separated with your ex-wife or not?”
Yi He, the mother of CZ’s children and obviously implicated in the debate, didn’t stay quiet on social media. In 2014, after meeting CZ at a blockchain event, Yi helped CZ join OKCoin as chief technology officer.
Soon, they were romantically involved.
Yesterday, she promoted a Binance on-chain prediction market asking users to wager on whether Xu would publicly apologize to CZ.
She taunted Xu to engage.
CZ claimed Star Xu got Leon Li arrested
The memoir’s most explosive new allegation concerns Huobi (now HTX) founder Leon Li.
In his book, CZ wrote that Xu (using Star Xu’s real name, Mingxing) reported Li to Chinese police, leading to Li’s November 2020 detention.
Xu called that claim “purely false information.”
The disagreement is yet another example of the CZ versus Xu battle.
Contested details of an OKCoin agreement
This week, Xu resurfaced a 2015 video showing an OKCoin accountant’s QQ account, allegedly accessed in the presence of a notary.
Within that QQ account, a video shows CZ apparently sending two versions of a Bitcoin.com domain agreement. The video shows Version 7 first, then a modified Version 8 with a six-month termination clause absent from Version 7.
CZ had previously attributed the chat records to an unauthorized account intrusion.
“Do you believe such an explanation?” Xu asked rhetorically.
Roger Ver sued OKCoin’s Hong Kong entity for approximately $570,000 over the contract dispute.
In other words, CZ and Xu are essentially arguing this week about that contract via a decade-old QQ video.
Read more: CZ cries FUD as anti-Binance posts flood X
More feuds
Xu had spent months previewing his arguments in public before CZ’s book arrived.
Following the 2025 flash crash, Xu blamed Binance for the de-peg of Ethena’s USDE stablecoin.
“October 10 was caused by irresponsible marketing campaigns by certain companies,” Xu wrote. “No complexity. No accident.”
He also accused Binance of repeatedly launching what he called Ponzi-like schemes and using influencer campaigns to suppress dissent.
CZ said he’d “try not to comment on this topic further” and retweeted rebuttals from allies.
In 2023, CZ pleaded guilty to failing to maintain effective anti-money laundering programs, paid a $50 million criminal fine, and watched the company he founded pay over $4.3 billion in penalties.
After serving a four-month prison sentence, he received a presidential pardon from Donald Trump last year.
Got a tip? Send us an email securely via Protos Leaks. For more informed news, follow us on X, Bluesky, and Google News, or subscribe to our YouTube channel.
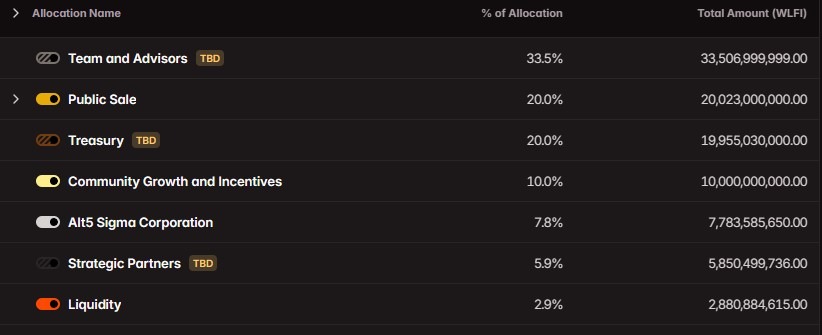
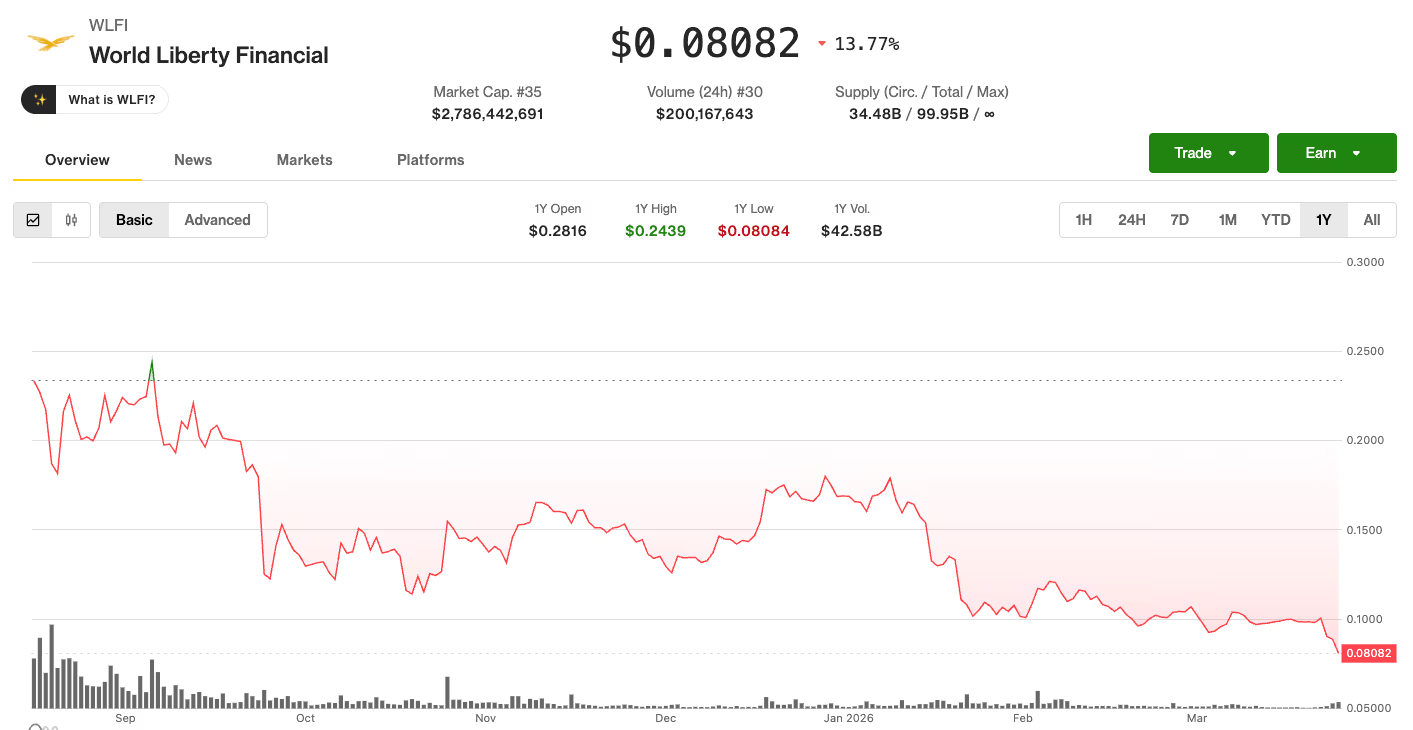
Decentralized finance (DeFi) platform World Liberty Financial said Friday it plans to put forward next week a governance proposal that would set a phased unlock schedule for WLFI tokens held by early retail purchasers.
The Trump family-linked DeFi platform said the proposal will be opened for community input before proceeding to a formal vote. According to the project, the vote will not cover a full, immediate unlock, but instead a structured, long-term vesting plan designed to release tokens in stages.
WLFI tokens remain largely locked for early buyers, with transferability tied to governance-approved unlocks. Tokenomist data shows that about 24.67% of WLFI’s 100 billion token supply has been released, while roughly 75.33% remains locked or pending future unlock decisions.
The proposal could determine when early buyers can finally access liquidity in WLFI, whose use is largely limited to governance. It comes as some holders publicly push back against the prolonged lockups and threaten legal action.
The concerns add to earlier governance decisions around token restrictions. On March 16, WLFI token holders approved a proposal introducing a six-month lock-up rule for certain transfers, marking one of the first formal changes to the project’s transferability framework.

Retail buyers challenge prolonged WLFI lockups
World Liberty’s early sale materials said WLFI tokens were non-transferable and could remain locked indefinitely, with any future unlock subject to a governance vote no earlier than 12 months after the token sale and with no guaranteed timeline.
That 12-month threshold has already passed, with WLFI’s public sale beginning around mid-October 2024, placing the current proposal roughly 18 months after the initial sale. The company raised at least $550 million from WLFI token sales across two funding rounds.
Some self-identified WLFI presale buyers have publicly complained that most of their holdings remain locked, even as parts of the broader token supply have become transferable.
At least one self-identified buyer said they had filed legal notices and were pursuing claims in the United States and the Netherlands against World Liberty Financial and its backers. Cointelegraph could not independently verify that any lawsuit had been filed.
Cointelegraph reached out to World Liberty Financial for comments, but had not received a response by publication.
Related: WLFI proposes governance staking system and USD1 usage incentives
Onchain borrowing activity adds to holder concerns
One community member said in an X post that the project’s borrowing activity raised concerns among token holders, questioning how treasury funds were being used. Onchain data shows that World Liberty Financial’s treasury borrowed roughly $75 million in stablecoins from Dolomite using WLFI as collateral.
Magazine: Should users be allowed to bet on war and death in prediction markets?


Simplechain raises $15m to build an RWA‑first layer 1 and dataipo protocol, extending ex‑jd.com and ant group execs’ push into compliant asset tokenization.
Summary
- SimpleChain closed a $15 million seed round to build an RWA‑focused Layer 1 blockchain.
- The core team includes former executives from Shuqin Technology, JD.com, and Ant Group, extending prior compliant fintech work.
- The project is also developing the DataIPO protocol to support on‑chain real‑world asset issuance and trading.
Real‑world asset (RWA) startup SimpleChain has raised $15 million in seed funding to build a dedicated Layer 1 blockchain aimed at tokenizing assets such as credit, energy infrastructure and other off‑chain collateral at scale. The company said the new capital will go toward engineering, compliance and ecosystem incentives as it races to position its infrastructure as a base layer for regulated RWA issuance. The round comes amid a broader rush by Chinese and Asia‑based fintech players to move asset tokenization on‑chain, with Hong Kong emerging as a key testing ground.
According to Chinese outlet PANews, SimpleChain’s founding team includes former executives from Shuqin Technology, JD.com and Ant Group, who previously helped build compliant fintech and supply‑chain finance platforms for traditional markets. Their new blockchain is pitched as a continuation of that work, but with settlement and asset logic moving fully on‑chain. “The launch of SimpleChain and the DataIPO protocol is an extension of years spent building compliant infrastructure for real‑world assets,” the team said in comments reported by industry media, framing the project as a way to “bridge institutional capital with public blockchains without sacrificing regulatory standards.”
Beyond the base Layer 1, SimpleChain is developing an ecological protocol called DataIPO, designed to standardize how real‑world asset deals are originated, tokenized and distributed to investors. In promotional materials shared on X, the DataIPO team said it wants to “turn structured deals into programmable on‑chain IP,” making it easier for asset originators to issue compliant tokens tied to revenue‑generating projects. That approach echoes broader RWA trends tracked by analytics platform RWA.xyz, where tokenized treasuries, private credit and infrastructure have grown into a multi‑billion dollar segment over the past two years.chain+4
The raise underscores how competition over RWA infrastructure is heating up, particularly in Greater China. Ant Group’s digital arm has already led pilots tokenizing up to $8.4 billion in renewable‑energy assets, including electric‑vehicle charging networks and solar plants, according to Bloomberg, while exploring dedicated chains such as its Jovay and Pharos projects. As regulators in Hong Kong and other hubs refine rules for tokenized securities, projects like SimpleChain are betting that purpose‑built Layer 1s, rather than generalized smart‑contract chains, will win a growing share of institutional RWA flows.

Key Takeaways
- Bridge vulnerability contained swiftly by Aethir, keeping damages under $90,000
- Major cryptocurrency exchanges mobilize rapidly to freeze attacker accounts
- Core Ethereum token reserves remain uncompromised throughout incident
- User compensation framework set for rollout following security breach
- Multi-chain forensic investigation underway to track stolen assets
Aethir demonstrated rapid incident response after detecting a vulnerability in its bridge infrastructure connecting multiple blockchain networks. Through immediate coordination with exchange partners and security specialists, the decentralized computing platform successfully capped financial losses at approximately $90,000. The company has assured users that its primary Ethereum-based token inventory remained untouched and that services continued without interruption.
Multi-Chain Bridge Vulnerability Quickly Isolated
Security monitoring systems at Aethir flagged suspicious transactions targeting bridge contracts that facilitate cross-chain token transfers between Ethereum and other blockchain networks. The technical team immediately took defensive action by disconnecting vulnerable contract components and halting unauthorized token movements. This prompt intervention significantly curtailed potential financial damage and restored operational stability.
Blockchain intelligence services had already begun tracking the malicious activity and documented fund flows spanning several networks. Security firm PeckShield’s analysis revealed that perpetrators routed stolen assets from BNB Chain through Tron using a network of intermediary addresses. Aethir’s internal investigation pinpointed the AethirOFTAdapter smart contract module as the compromised component.
The platform immediately engaged with major cryptocurrency trading venues to implement restrictions on identified malicious wallets. Leading exchanges including Binance, Upbit, Bithumb, and HTX executed swift wallet blacklisting measures. This collaborative security approach proved instrumental in preventing further asset dispersion.
Token Integrity Preserved, Recovery Measures Announced
Aethir provided assurance that its main ATH token reserves hosted on the Ethereum blockchain escaped compromise during the security incident. The platform’s core tokenomics and distributed network infrastructure maintained full operational continuity throughout the event. Standard services across the decentralized GPU network proceeded without disruption.
Management revealed plans to unveil a comprehensive user reimbursement initiative within the coming week. Alongside compensation details, the organization will publish complete attacker wallet information and a detailed technical breakdown of the incident. These transparency measures are designed to rebuild confidence and document remediation steps.
Meanwhile, Aethir continues collaborating with law enforcement agencies and specialized blockchain forensics teams to recover misappropriated funds. Security partner ZeroShadow provided in-depth investigative analysis supporting the ongoing recovery effort. Current activities concentrate on mapping attack methodologies and implementing enhanced protective protocols.
Platform Expansion Amid Broader Security Challenges
Aethir functions as a distributed GPU cloud infrastructure serving artificial intelligence development, gaming applications, and corporate computing needs. Rather than depending on traditional centralized server farms, the network distributes computational capacity worldwide. This architecture enables flexible scaling across diverse geographical locations.
Financial disclosures indicate Aethir generated $127.8 million in platform revenue throughout 2025, demonstrating robust market acceptance of its decentralized physical infrastructure model. By year’s end, the network had deployed over 440,000 GPU container units spanning 94 nations globally. Strategic investment from prominent backers including Animoca Brands and HashKey fueled this rapid ecosystem expansion.
The decentralized finance industry as a whole continues confronting escalating security threats targeting protocol infrastructure. Malicious actors successfully extracted nearly $170 million from various DeFi platforms during the opening quarter of 2026. Events such as this Aethir bridge compromise underscore the critical importance of advancing cross-chain security frameworks.

Crypto World
Bitcoin Price Tests $72K Resistance as Traders Hedge Against ‘Fragile’ Middle East Truce

Bitcoin price is sitting at $72,000 resistance, up 8% on the week, and the chart is telling two stories at once. The Iran-Israel truce gave traders a reason to cover shorts.
It hasn’t given them a reason to go long with conviction. Bulls point to $411 million in April ETF inflows and rising open interest.
Bears point to a two-week ceasefire window that Bybit’s chief market analyst Han Tan describes as sitting on ‘shaky ground.’ Both are right. That’s the problem.
The setup heading into the weekend is binary. Either the Iran-Israel truce holds and institutional investment flows accelerate, or it doesn’t – and crypto volatility returns fast, in thin liquidity, on a Saturday.
Discover: The best pre-launch token sales
Can Bitcoin Price Break $75,000 as Geopolitical Risk Unwinds?
Bitcoin is trading in a tight band between $71,800 and $72,100 as of Thursday. The $72,000 level is functioning as both psychological resistance and a technical ceiling – the zone where the rally stalled twice in the past six sessions.
Volume context matters here: the breakout above $70,000 was real, but the follow-through has been thin, which itself is a signal.
Bybit’s derivatives data put $56 million in bearish liquidations on Bitcoin perpetual contracts during the surge.
But open interest climbed alongside price, meaning traders were adding fresh exposure rather than simply covering. Funding rates stayed contained. That’s controlled risk-taking, not euphoric leverage – and it’s the more durable kind of rally base.

The support cluster we’re watching sits at $70,000–$71,000 on a closing basis. A clean break below $70,000 opens the path toward $63,000–$65,000, the range where ETF demand materialized during the February-March selloff from near $90,000.
The bull case requires clearing $75,000–$76,000 with volume confirmation – that’s the level that would shift the structure from relief rally to trend resumption.
For us, the activation conditions are straightforward: the ceasefire holds through the weekend, spot volume expands on the next leg up, and Bitcoin closes above $72,500 on the daily. Until then, the chart is mending. It hasn’t healed.
Iran-Israel Truce: Why Traders Are Bracing for a ‘Flight to Liquidity’
The geopolitical backdrop driving Bitcoin’s price is more mechanically complex than a simple risk-on/risk-off toggle.
The conditional two-week truce includes steps tied to reopening the Strait of Hormuz – the shipping corridor that carries roughly one-fifth of global LNG supply.
Five weeks of disruption turbocharged inflation fears and raised the credible prospect of central bank rate hikes, a direct headwind for risk assets including crypto.
If the ceasefire fractures, the sequence runs: oil spike, inflation repricing, rate hike expectations rise, risk-off rotation accelerates.
Bitcoin gets sold first – not because it’s the problem, but because it’s liquid and margined. The ‘flight to liquidity’ dynamic is the institutional hedge that never fully came off, even as it got cheaper to maintain.
Tan’s note flagged that options skew has eased but downside protection hasn’t been abandoned. Traders are paying less for the hedge. They haven’t dropped it.
The weekend dimension makes this structural. US-Iran diplomatic contacts are scheduled in Pakistan on Saturday. Traditional markets are closed. Exchange liquidity thins materially after Friday’s close – bid-ask spreads widen, and outsized price moves on any headline become more likely in both directions. The inflow data is bullish. The calendar is not. Those two realities coexist, and neither cancels the other out.
Discover: The top crypto to diversify your portfolio with
Bitcoin Hyper Targets Early-Mover Upside While BTC Consolidates at $72K
Bitcoin at $72,000 resistance with a geopolitical overhang is a particular kind of frustrating for spot holders. The macro case is improving.
The chart needs confirmation. The weekend introduces a binary risk. That’s a slow-moving setup – and the math on asymmetric returns at current levels is harder to justify than it was at $65,000.
Bitcoin Hyper is the asymmetric play worth examining in this environment.
The project is built as a Bitcoin layer-2 infrastructure protocol targeting the speed and programmability gaps that limit BTC’s utility as an active settlement layer – addressing Bitcoin’s structural weaknesses of slow transactions, high fees, and absent programmability in a single architecture.
Institutional appetite for Bitcoin-adjacent infrastructure is growing alongside spot ETF demand, and early-stage positioning in that layer captures upside the spot price can’t offer at $72K.
Key presale stats: $32 million raised to date, current token price at $0.0136783, with staking APY running at 36% for early participants. The presale window closes as the protocol approaches mainnet launch sequencing.
Visit the Bitcoin Hyper presale website here
The post Bitcoin Price Tests $72K Resistance as Traders Hedge Against ‘Fragile’ Middle East Truce appeared first on Cryptonews.
Crypto World
Trump-backed WLFI token drops 12% to record lows after team defends multi-million lending position
World Liberty Financial’s WLFI token fell about 12% in the past 24 hours after the Trump-linked crypto venture published a thread on X defending its lending position on Dolomite, the DeFi protocol whose co-founder advises WLFI.
The thread came in response to CoinDesk’s reporting that WLFI had deposited its own governance token as collateral, borrowed stablecoins against it, and drained the USD1 lending pool to the point where other depositors could not withdraw.
WLFI did not dispute the transactions but instead argued that the position was intentional and beneficial.
“We are one of the largest suppliers and borrowers on WLFI Markets,” the X account posted. “Yes, we supplied WLFI as collateral and borrowed stablecoins. No, we are nowhere near liquidation, and frankly, even if markets moved dramatically against us, we’d simply supply more collateral.”
The statement that WLFI would add more of its own token as collateral to avoid liquidation further highlights, rather than resolves, the concern raised in CoinDesk’s reporting.
Adding more WLFI to back a position denominated in WLFI on a protocol advised by WLFI’s own advisor is a form of circularity that investors may want to keep track of.
WLFI framed its role as “anchor borrower,” saying the borrowing generates yield for other users at a time when traditional markets offer little. The team disclosed $65.58 million in open-market buybacks of 435.3 million WLFI tokens at an average price of $0.1507 over the past six months, and said a governance proposal to unlock tokens for early holders would be posted next week.
The token is now trading roughly 48% below the buyback average, meaning WLFI’s own treasury purchases are significantly underwater.

WLFI has now hit its lowest level since its 2025 launch.
Meanwhile, three billion additional WLFI tokens sit in an intermediary wallet after the treasury transferred them on April 2 and April 7. That stash is worth roughly $234 million as of current prices, down from $266 million a week ago.
The math works against WLFI on every side if those tokens follow the same path into Dolomite. Lower prices mean less borrowing power per token, and depositing more tokens to borrow more stablecoins from a pool that is already nearly drained makes it harder for other depositors to withdraw. The collateral backing the position becomes even more concentrated in a token that just lost 12% in a day.

David de Gea makes Michael Carrick feelings crystal clear with ‘unbelievable’ Man United claim

A basic TV sound booster

Bitcoin Heading to New Lows?


![[KLPGA 2026] iM Financial Group Open 2026 / Round 2 (ENG Commentary)](https://wordupnews.com/wp-content/uploads/2026/04/1775832050_maxresdefault-80x80.jpg)

-

 Fashion7 days ago
Weekend Open Thread: Spanx – Corporette.com
-

 Business5 days ago
Three Gulf funds agree to back Paramount’s $81 billion takeover of Warner, WSJ reports
-

 Sports6 days ago
India men’s 4x400m and mixed 4x100m relay teams register big progress | Other Sports News
-

 Business6 days ago
Expert Picks for Every Need
-

 Tech3 days ago
How Long Can You Drive With Expired Registration? What Florida Law Says
-

 Business5 days ago
No Jackpot Winner, Prize to Climb to $231 Million
-

 Fashion4 days ago
Massimo Dutti Offers Inspiration for Your Summer Mood Board
-

 Fashion3 days ago
Let’s Discuss: DEI in 2026
-

 Crypto World2 days ago
Bitcoin recovers as US and Iran Agree a Ceasefire Deal
-

 Business6 days ago
Akebia Therapeutics, Inc. (AKBA) Discusses Pipeline Progress and Strategic Focus on Kidney Disease Treatments at R&D Day – Slideshow
-

 Crypto World1 day ago
Canary Capital Files SEC Registration for PEPE ETF
-

 Politics6 days ago
The UK should not pay a penny in slavery reparations
-

 Tech4 days ago
Samsung just gave up on its own Messages app
-

 Tech4 days ago
Haier is betting big that your next TV purchase will be one of these
-

 Tech7 days ago
Flat tire? Dead battery? Speedy’s serves stranded Seattle riders as a quicker e-bike picker-upper
-

 Fashion7 days ago
Weekly News Update, 4.3.26 – Corporette.com
-
Sports7 days ago
A Kevin O’Connell Theory Can Now Be Retired
-

 NewsBeat7 days ago
Kemi Badenoch talks ‘spring cleaning’ Reform defections
-

 Tech4 days ago
Gamer Restores the Original PlayStation Portal From Two Decades Ago
-

 Tech4 days ago
The Xiaomi 17 Ultra has some impressive add-ons that make snapping photos really fun
You must be logged in to post a comment Login