
Crypto World
Ether Holds $2K as $242M Spot ETH ETF Outflow Could Reignite Downside
Ether continues to hover near the $2,000 area, but the bulls facesheadwinds from a suite of macro and market dynamics that could cap any bounce. Traders are parsing corporate earnings guidance, the trajectory of US government debt refinancing, and mounting global tensions that can keep risk assets on a sensitive leash. After a brief rebound earlier in February, Ether has struggled to muster sustained upside as funding costs stay elevated and investors rotate toward liquidity in short-term Treasuries. The balance of on-chain activity, investor sentiment, and macro indicators will likely determine whether $2,000 acts as a magnet or a battleground for the next leg of this cycle.
Key takeaways
- Institutional demand for Ether is cooling as investors shift toward the safety of short-term US government bonds.
- High interest rates and rising ETH supply make the current staking yield less attractive for long-term holders.
- US-listed Ether ETFs posted net outflows, underscoring a shift in liquidity away from Ether-related products in the near term.
- Markets are pricing in the potential for further rate cuts by the Fed in 2026, as signs of economic stagnation temper inflationary risks.
Tickers mentioned: $ETH
Sentiment: Bearish
Price impact: Negative. Ether is facing renewed downside pressure amid macro headwinds and fading ETF inflows.
Market context: The broader crypto landscape remains heavily correlated with macro liquidity and risk sentiment. As investors reassess growth trajectories and central bank paths, flows into Ether ETFs and related instruments have become a bellwether for institutional appetite. With the 2-year US Treasury yield echoing the low- to mid-3% regime seen in recent sessions, traders anticipate a possible easing cycle later in the year, a dynamic that often trades off against appetite for higher-risk, high-utility assets like Ether.
Why it matters
Ether’s ability to sustain price strength is intimately tied to both on-chain economics and external financial conditions. The network’s staking yield—already a focal point for long-term holders—faces increased scrutiny as the annual ETH supply growth persists at roughly 0.8%. Against a backdrop of a stagnant or sluggish macro backdrop, a 2.9% staking yield becomes less compelling for risk-averse investors when the Fed’s target rate sits higher, and bond markets offer a comparatively safer carry. This dynamic can dampen the incentive to stake, potentially dampening network security metrics and long-term price resilience if the flow of fresh ETH to stake is subdued.
Market momentum has also been influenced by ETF mechanics. Recent outflows from US-listed Ether ETFs, totaling around $242 million over a short window, have erased earlier inflows that followed Ether’s bottoming around the mid-$1,700s in February. Although the outflows represent a fraction of total assets under management, they signal a shift in sentiment among institutional participants who previously sought exposure through regulated wrappers. Net flows matter because they influence price discovery and liquidity, especially in a market where players weigh the relative safety of traditional assets against the potential upside of a more scalable and active network.
From a technical and derivatives perspective, traders have grown more cautious. The options market shows a tilt toward downside protection, with the delta skew for Ether options tracing above longer-term averages as investors pay a premium for put-driven hedges or neutral-to-bearish bets. This mood aligns with the observation that the asset trades substantially below its all-time highs, and even a mid-cycle recovery may be met with sellers who view rallies as opportunities to exit risk exposure.
Even as macro narratives push risk-off tendencies, Ether’s position as the leading smart contract platform remains intact in terms of activity and TVL leadership. Yet, the near-term price path hinges on a confluence of factors: corporate earnings resonance, the pace of debt refinancing, and the macro impulse toward or away from expansionary fiscal measures. The market is also watching policy signals and potential regulatory clarity that could influence appetite for crypto assets overall. In parallel, other networks offering base-layer scalability and faster on-chain throughput keep pressuring ETH’s relative competitive stance, particularly when investors seek higher efficiency at a similar risk profile.
Overall, the market narrative remains cautious. Traders acknowledge that a meaningful downside could be tempered by supportive macro cues or favorable liquidity conditions, but the immediate trajectory appears tethered to external events rather than purely on-chain developments. In this environment, Ether’s price reactivity is likely to depend on the collectivity of earnings surprises, debt management decisions, and the speed at which risk appetite re-emerges after episodes of volatility.
What to watch next
- Upcoming corporate earnings season and guidance revisions that may influence broader risk sentiment.
- US government debt refinancing milestones and any shifts in fiscal policy that affect liquidity conditions.
- Net ETF flows for Ether products in the next reporting period and any changes in investor allocations.
- Macro data releases and Fed commentary that could solidify or alter expectations for rate cuts in 2026.
- On-chain activity and staking metrics that could alter the relative attractiveness of ETH staking over time.
Sources & verification
- US-listed Ether ETF net flow data and related commentary from market trackers and issuer analyses.
- Pricing and yield data for the US 2-year Treasury, with context on regime expectations for Fed policy.
- Historical ETH price actions, including the February bottom around $1,744 and subsequent recovery patterns.
- Derivatives metrics for ETH, including delta skew readings from Deribit via data providers.
- On-chain and market commentary describing total value locked and network leadership dynamics in short- to mid-term cycles.
Ether under pressure as macro cues weigh on ETH
Ether (Ether (CRYPTO: ETH)) has spent recent sessions hovering near the $2,000 level, with constraints on a sustained move above roughly $2,150 since early February. The hesitation is not solely technical; it reflects a complex interplay between macro policy expectations, investor risk appetite, and the evolving structure of liquidity in crypto markets. After a brief bounce off a February trough around the mid-$1,700s, Ether’s price action has cooled as traders reassess the durability of any rally in the face of higher funding costs and competing opportunities in fixed income.
One of the critical macro signals comes from the bond market. The US two-year Treasury yield has moved toward the lower end of its range, around the 3.4% area, signaling that participants anticipate a more accommodative stance from the Federal Reserve in the coming years. This shift in rate expectations tends to push investors toward safer assets, including government debt, and away from higher-beta risk assets like Ether. The dynamic is reinforced by growth signals that, at least in the near term, point toward a more tepid expansion, which reduces inflationary pressure and can further support a cautious easing bias by the Fed.
In the near term, the ETF landscape remains a focal point. After a period of resilience, US-listed Ether ETFs posted net outflows that overshadowed earlier inflows tied to the recovery from the February dip. The outflows—calibrated against a substantial asset base—suggest that some institutional participants have scaled back their near-term exposure, contributing to soft price action. This is particularly relevant given that the broader crypto market often tracks risk-on/risk-off sentiment as much as, if not more than, internal on-chain metrics.
On-chain and derivatives metrics offer a complementary view of sentiment. The ETH options market has shown elevated demand for hedges, with the delta skew for 30-day options remaining elevated and indicating a willingness among professional traders to pay for protection against downside moves. The dataset, drawn from sources measuring the put-call balance, underscores a prevailing mood of caution among market participants who are mindful of the higher probability of further drawdowns given the current macro backdrop. This sentiment aligns with the six-month bear-market narrative, as Ether trades well below its all-time high and investors weigh the risk/reward of staking versus holding for appreciation.
Supply dynamics also weigh on the long-term narrative. Ether’s annualized supply growth sits modestly positive, while the immediate yield offered by staking remains modest in comparison to the prevailing interest rate environment. For long-term holders, the attractiveness of staking becomes a function of both yield and the perceived safety of ETH as a platform with continued innovation and network effects. The tug of war between yield, risk, and network activity will help determine whether staking becomes a stronger driver of price stability or a source of selling pressure if yields fail to outpace risk premia in traditional markets.
Market leadership in on-chain activity and TVL remains a strength of the Ethereum ecosystem, which helps to anchor Ether’s longer-term narrative even as near-term price action exhibits caution. However, the combination of macro sensitivity, ETF flow dynamics, and derivatives positioning means that the path forward is likely to be incremental rather than transformative in the near term. Investors will be watching not only macro indicators and corporate earnings but also regulatory clarity and liquidity shifts that could redefine the risk landscape for crypto assets in the months ahead. The outcome will shape whether Ether can regain momentum or continue to trade in a constrained range as the market reconciles macro expectations with the evolving use cases on Ethereum’s network.
For readers tracking the broader macro and on-chain narrative, the next few weeks will be telling. If inflation eases more rapidly than anticipated or if the Fed signals a clearer path toward rate cuts, risk appetite could stabilize and support a healthier Ether environment. Conversely, if growth indicators surprise to the downside or if liquidity conditions tighten further, ETH could test new near-term lows as traders search for safety and retreat from higher-risk exposures.


Algorand price shot up over 20% on Wednesday, becoming the best performer among the leading 100 crypto assets by market cap.
Summary
- Algorand price surged over 20% to an eight-week high of $0.105, rebounding sharply after recently hitting an all-time low.
- The rally followed its mention in a Google Quantum AI paper highlighting its post-quantum cryptography efforts, boosting investor visibility.
- Rising futures open interest and a bullish technical breakout above key moving averages point to strengthening upside momentum.
According to data from crypto.news, Algorand (ALGO) price hit an 8-week high of $0.105 on Wednesday while bringing its market cap to over $936 million. The move follows just two days after the token hit an all-time low.
The main catalyst that drove the Algorand price rebound today is its citation by Google Quantum AI in a recent paper focused on the threats major blockchains face from quantum computing. Notably, the project was mentioned over 32 times in the document, ranking just after Bitcoin and Ethereum for its proactive stance on post-quantum cryptography.
In contrast, some of the top crypto projects, such as Solana and XRP, were mentioned nearly half as often, while Hedera and Avalanche received zero mentions in the report.
Being cited in one of the most prestigious research papers gave Algorand a big boost in visibility and enhanced its technical appeal to investors who felt they got a massive discount from the token hitting its lowest level since inception.
A recent major development that has also supported its gains today includes Algorand’s integration into the Swiss retail bank PostFinance, which enabled its 2.5 million customers to directly trade and hold ALGO using their existing accounts.
Demand from derivative traders has also buoyed the token price. Data from CoinGlass shows that the open interest dedicated to Algorand futures rose 55% over the past day to $58.9 million.
Meanwhile, its weighted funding rate has shifted to a positive reading, suggesting that long position holders were paying short traders to maintain their positions, which is widely seen as a bullish signal for the market.
On the daily chart, Algorand price has broken out of a descending parallel channel pattern, a major bearish structure that had been capping gains since the beginning of this year.
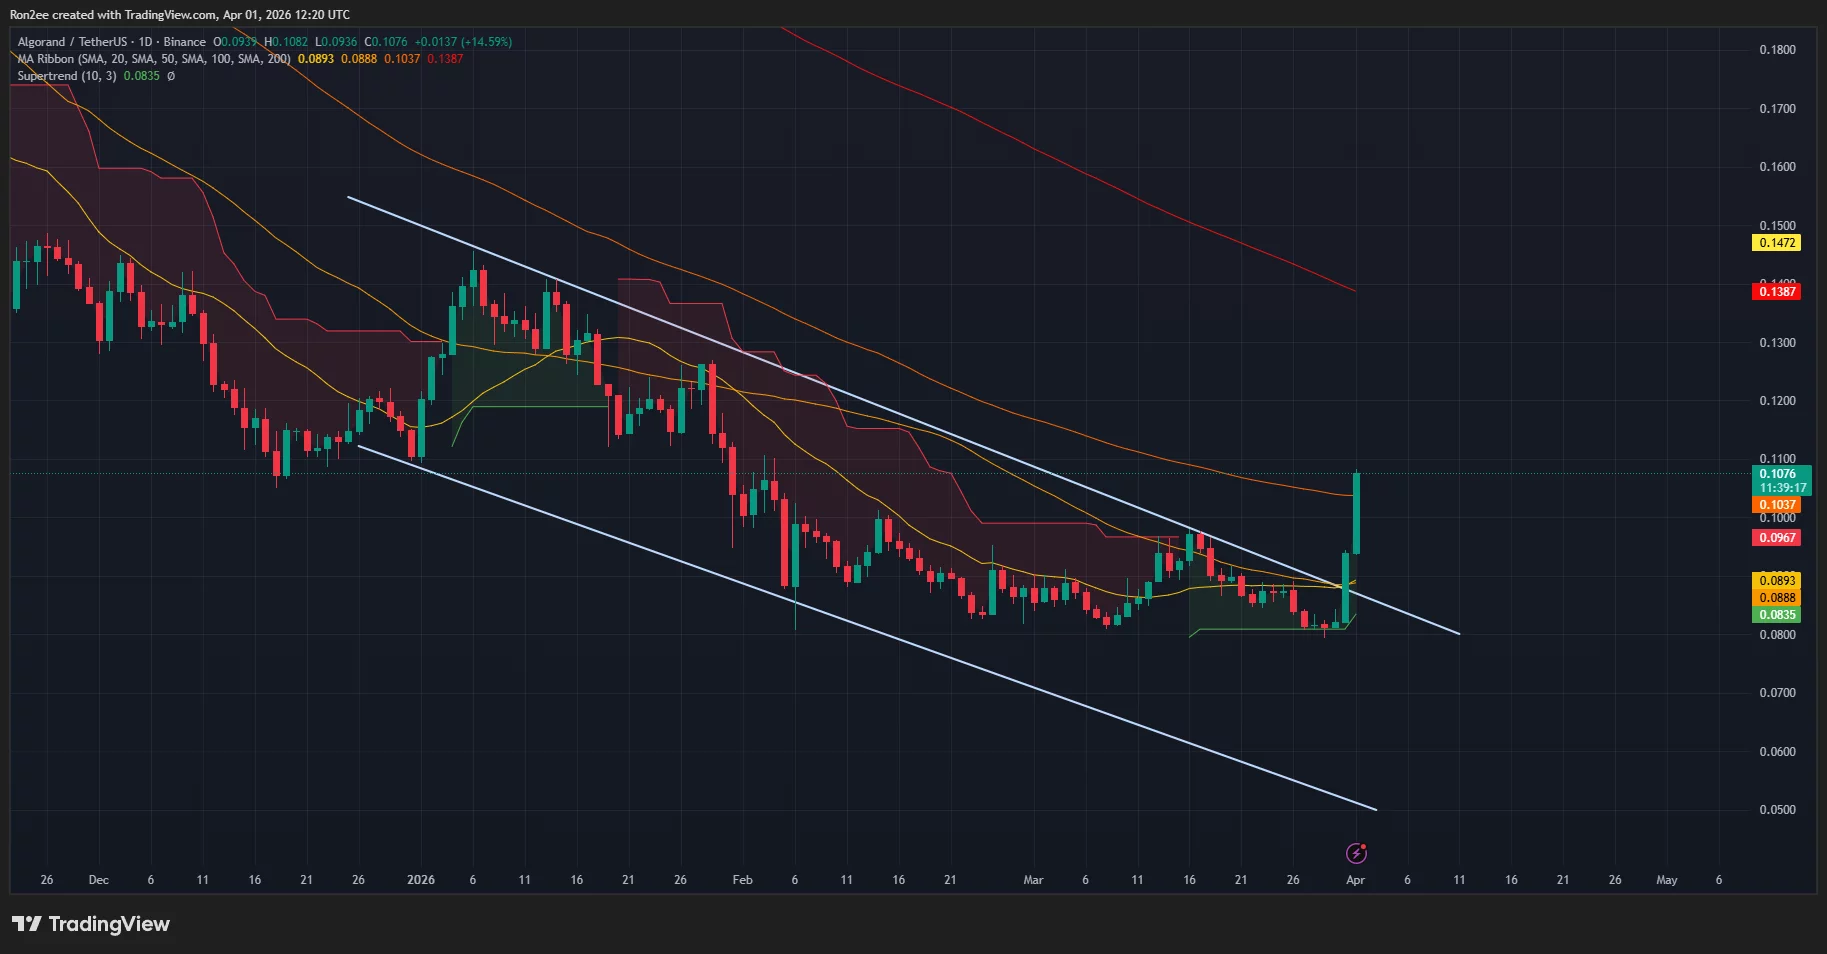
Algorand price has crossed over the 20-day, 50-day, and 100-day SMA back-to-back over the past two days, a sign that short-term momentum is turning aggressively bullish. Furthermore, the supertrend indicators, which traders use to gauge market direction, remain in the green, suggesting the path of least resistance is currently to the upside.
For now, $0.138, which marks the 200-day SMA, is the most important resistance level that traders would be keeping a close watch on. A break above that could signal a long-term trend reversal and open the door for a much larger recovery toward previous yearly highs.
However, if Algorand price falls below the 50-day SMA at $0.088, it would invalidate the current breakout and likely lead to a retest of the recent all-time lows.
Disclosure: This article does not represent investment advice. The content and materials featured on this page are for educational purposes only.


Disclosure: This article does not represent investment advice. The content and materials featured on this page are for educational purposes only.
NOW DeFi launches quantum cloud mining as Bitcoin consolidates and XRP liquidity rises.
Summary
- Bitcoin and XRP consolidation increases risks for spot holders, driving demand for alternative yield strategies.
- NOW DeFi launches “quantum computing cloud mining” to deliver automated returns without relying on market direction.
- The platform converts crypto into cloud hashrate, enabling passive income without hardware or active trading.
As Bitcoin (BTC) enters a high-level, wide-ranging consolidation zone driven by global macroeconomic factors, and Ripple (XRP) sees increasing liquidity in cross-border payments, the crypto asset market is undergoing a new paradigm shift.
For the massive number of spot holders, the time cost of “holding and waiting for a pump” and the risks of market pullbacks are rising sharply.
Against this backdrop, NOW DeFi, the world’s leading automated wealth ecosystem, officially announced today the full launch of its highly anticipated “Quantum Computing Cloud Mining” architecture.
By introducing exponentially advanced quantum computing power, NOW DeFi has successfully broken through the profit bottlenecks of traditional spot holding, providing global crypto investors with a brand-new path to ignore market bulls and bears, offering stable hashrate dividends of up to $20,000 per day.
In-depth market analysis: The “profit vacuum” for spot holders
According to Q1 on-chain data and technical analysis (TA), both BTC and XRP exhibit strong “supply lock-up” characteristics. However, during volatile price wicks, retail investors’ spot holdings are highly susceptible to paper losses.
The vast majority of investors’ crypto assets remain in a “dormant” state, unable to generate compound interest while enduring immense psychological pressure from constantly monitoring charts. Furthermore, traditional DeFi staking yields have plummeted, leaving the market in urgent need of a high-return alternative backed by strong technical barriers.
NOW DeFi’s disruptive innovation: How does quantum computing generate yield?
To address this industry pain point, NOW DeFi integrates cutting-edge quantum computing with high-frequency node verification technology. The core advantage of quantum hashrate lies in its ability to process massive hash collisions and cross-market arbitrage models in mere milliseconds.
NOW DeFi “fragments” this top-tier computing power into cloud-based contracts. Holders of BTC, XRP, and other mainstream assets simply need to convert their assets into NOW DeFi’s hashrate fuel to earn 100% fully automated hashrate outputs — requiring zero hardware investment or market monitoring.
Core hashrate contract matrix: A wealth path from retail to institutional
To meet the needs of investors of all sizes, NOW DeFi has unveiled its latest quantum hashrate yield model. Data shows that top strategic investors can achieve explosive wealth growth through compound interest and high-frequency hashrate clusters:
Strategy Level
Entry Threshold(USD)
Strategic Cycle(Days)
Est. Total Strategic Yield(USD)
Strategy Positioning
Entry-Level Quantum
$100
2
$8
Algorithm trial, ultra-short-term arbitrage
Standard Quantum
$1,500
10
$235.5
Mid-term trend capture, compound growth
Advanced Quantum
$5,000
15
$1,215
Deep learning-driven, long/short hedging
Elite Quantum
$25,000
25
$11,250
Institutional execution logic, high-frequency arbitrage
Quantum Strategy
$90,000
20
$36,000
Top-tier hashrate cluster, full market coverage
(For more strategy details and real-time dynamic data, please visit the official website)
How to earn passive income via NOW DeFi’s quantum hashrate?
NOW DeFi was designed to make cutting-edge quantum technology accessible to everyone. Eliminating tedious hardware configurations and complex trading models, any investor can unlock exponential wealth growth in just four simple steps:
- Register and claim a welcome bonus: Instantly receive a $22 welcome bonus. Register today to claim a cash reward and start the passive income journey with zero risk.
- Select and Activate a Hashrate Contract: Choose a quantum hashrate package that suits a particular capital size. Once a strategy package is purchased, the system takes over immediately.
- 100% Fully Automated Yield: Say goodbye to staring at plunging charts. Without any market monitoring, profits will be automatically and accurately credited every 24 hours.
- Ultimate Liquidity and Flexible Withdrawals: Take full control of wealth. Once the account balance reaches $100, it can be withdrawn directly to a crypto wallet or reinvested to unlock exponential compound interest. Absolutely transparent, with zero hidden fees, no maintenance fees, and no surprise charges—100% of the money you earn belongs to you.
About NOW DeFi: The ultimate consensus for global safe-haven capital
NOW DeFi provides an elite-level automated wealth accumulation ecosystem, with the core vision of helping global investors stop losses in the spot market and achieve maximum returns with complete peace of mind. In the unpredictable crypto market, NOW DeFi has built a powerful global safe-haven consensus:
- Global Safe-Haven Consensus: Trusted by over 10 million smart investors across more than 198 countries and regions who have successfully broken free from market volatility.
- Fortress-Like Security: Equipped with industry-leading dual-layer protection from McAfee® and Cloudflare®, allowing you to sleep soundly knowing your funds are secured by military-grade encryption.
- Seamless Multi-Asset Support: Offers unparalleled flexibility with direct settlement in top digital assets, including XRP, BTC, ETH, SOL, DOGE, USDC, USDT, BNB, and BCH.
Conclusion and action guide: Seize the early-adopter dividends of the quantum era
The ultimate goal of technical analysis is to guide trading. In 2026, as crypto market trends become increasingly complex, stopping senseless gambling in the spot market and shifting assets to the highly certain quantum hashrate track has become the consensus among smart investors.
For more information, please visit the official NOW DeFi website and download the application.
Email: [email protected]
Disclosure: This content is provided by a third party. Neither crypto.news nor the author of this article endorses any product mentioned on this page. Users should conduct their own research before taking any action related to the company.

Australia has passed legislation that will bring many digital asset platforms and tokenised custody platforms under the country’s financial services licensing regime.
The Corporations Amendment (Digital Assets Framework) Bill 2025 has now cleared both houses of the Australian Parliament, according to parliamentary records, marking the biggest step yet in Canberra’s push to create a dedicated regulatory framework for digital assets.
Introduced in November 2025, the bill amends the Corporations Act and ASIC Act to regulate digital asset platforms and tokenised custody platforms, with the stated aim of improving consumer protection, market integrity and regulatory certainty.
The bill now awaits royal assent, the final step before becoming law. It is set to take effect 12 months after assent, with an additional transition period for businesses to comply.
The bill requires crypto operators, including exchanges and custody platforms, to obtain an Australian Financial Services Licence (AFSL) from the Australian Securities and Investments Commission (ASIC), the country’s financial regulator.

The Digital Economy Council of Australia (DECA), an industry group representing Australia’s digital economy, praised the development in a statement on LinkedIn.
“For the first time, we have a legislative framework that directly addresses digital asset platforms and it provides long-awaited clarity for businesses, investors and regulators, and marks a shift from uncertainty toward implementation,” DECA said.
Related: Australia fines local Binance unit $6.9M over client onboarding failures
Addendum clarifies treatment of MPC and crypto custody under new law
Jazz Ozvald, former assistant director of digital asset policy at the Commonwealth Treasury, took to LinkedIn to express delight at the milestone in passing the bill.
He noted that the government also tabled an Addendum to the Explanatory Memorandum, which includes additional detail about how the bill is intended to apply where digital tokens are factually controlled through multi-party computation (MPC).

MPC is a cryptographic technology used to secure crypto wallets by splitting control between multiple parties, so no single person has full control. Transactions can only be approved when enough parties work together, making it harder for funds to be stolen or misused.
Related: Google targets 2029 post-quantum migration as threats draw nearer
The addendum says that the law only applies to platforms that actually hold crypto for customers, rather than just providing technology that helps control it, even in shared-control setups like MPC.
Magazine: Nobody knows if quantum secure cryptography will even work

SpaceX, Elon Musk’s aerospace powerhouse, has reportedly filed confidentially for an initial public offering with the U.S. Securities and Exchange Commission. The move, described by Bloomberg as citing people familiar with the matter, positions the company for what could be one of the largest public listings in U.S. history and signals a potential shift in how a private space and AI conglomerate marshals capital for its next phase.
According to Bloomberg’s reporting, the IPO could be timed for a June close, should the process move forward as planned. While details remain shielded behind confidentiality, insiders told Bloomberg that the offering could value SpaceX well above $1.75 trillion and could raise as much as $75 billion, a scale that would dwarf many prior debutings and reimagine the company’s public-market footprint.
The listing could feature a dual-class share structure designed to preserve control for insiders, including SpaceX founder Elon Musk, even as public investors participate. In line with such structures, the offering is expected to allocate up to 30% of shares for individual investors, according to the coverage.
On the banking and advisory front, the process is anticipated to involve a cadre of Wall Street firms, with Bank of America, Goldman Sachs, JPMorgan Chase, Morgan Stanley and Citigroup commonly cited as likely participants in steering SpaceX through its transition to a public company.
Beyond the IPO chatter, SpaceX’s crypto footprint remains a recurring point of interest. The company is widely reported to hold a substantial Bitcoin position—8,285 BTC on its balance sheet, valued at more than $565 million at current prices. Notably, SpaceX moved its Bitcoin to a new wallet address in October, fueling speculation about whether the company intends to maintain a long-term crypto strategy or adjust holdings in response to market conditions.
Market structure and access to private holdings are also on the radar as SpaceX eyes broader investor participation. Trading venues and tokenization platforms have been examining opportunities to offer tokenized shares or similar vehicles for high-profile private companies, including SpaceX and other AI leaders. Robinhood and Kraken, among others, have discussed how retail investors might gain access to nonpublic companies through blockchain-based tokenized instruments, a development Robinhood’s CEO has described as potentially widening participation even as high-profile private tech firms pursue public-market exits.
Key takeaways
- SpaceX reportedly filed confidentially for an SEC IPO, with a possible June timeline and a valuation above $1.75 trillion; potential raise up to $75 billion.
- The deal could use a dual-class structure preserving insider voting control, with up to 30% of shares reserved for individual investors.
- Major banks—Bank of America, Goldman Sachs, JPMorgan Chase, Morgan Stanley and Citigroup—expected to advise on the transition to a public company.
- SpaceX reportedly maintains 8,285 BTC (worth over $565 million) on its balance sheet, with a October wallet move prompting questions about long-term crypto strategy.
- Tokenized private-share concepts are circulating in crypto markets, with Robinhood and Kraken cited as exploring access to SpaceX, OpenAI and other nonpublic firms for retail investors.
- In the AI space, SpaceX’s acquisition of xAI places it in a broader race with OpenAI and other private AI labs; OpenAI recently closed a funding round with about $122 billion in committed capital, lifting its implied valuation toward the hundreds of billions, and Bloomberg notes potential IPO activity for both OpenAI (as early as 2026) and Anthropic (potentially as soon as October).
Context: SpaceX’s AI ambitions and the public market timing
The reported IPO comes on the heels of SpaceX’s February move to acquire xAI, Elon Musk’s AI venture, signaling a ramp-up in the company’s participation in the fast-evolving AI ecosystem. The combination of aerospace prowess and AI development positions SpaceX to leverage a broader technology and capital-market narrative as investors assess how private companies transition to public ownership.
OpenAI, the creator of ChatGPT, has been central to the AI funding landscape. Bloomberg notes that OpenAI concluded its latest funding round with about $122 billion in committed capital, driving its estimated value higher—a point underscoring the growing parallel between AI capital intensity and public-market appetites. The firm has been widely discussed as a potential IPO candidate in 2026, a signal to market participants that large AI players could become regulars on public exchanges in the coming years. Anthropic, another important name in the field, is also reported to be weighing a public listing, with Bloomberg indicating a possible listing as soon as October of this year.
As SpaceX contemplates a potential public listing, retail and institutional investors alike are watching how the company would balance the demands of a public-filed governance framework with its private-market strategies and multi-vertical ambitions. The prospect of a dual-class structure remains a point of contention for some market observers, given how it concentrates voting power among insiders even as it enables faster strategic execution and longer-term investment horizons.
For crypto-market observers, the overlap between SPAC-like tokenization concepts and traditional IPOs adds another layer of consideration. Tokenized shares and blockchain-based participation could, in theory, broaden access to a private giant like SpaceX for retail buyers who traditionally have had limited entry points. While these products are still gaining regulatory clarity and market traction, the ongoing interest from platforms such as Robinhood and Kraken indicates a broader industry push to bridge private-market participation with public-market liquidity via tokenization tools.
What this means for investors and the AI ecosystem
If SpaceX proceeds with an IPO in the proposed size and structure, it would be among the largest listings in U.S. history and would place the company at a valuation tier previously seen with mega-cap tech and consumer platforms. For investors, the potential blend of aerospace breadth and AI stakes could create a diversified exposure within a single name, while the dual-class voting framework could shape how quickly and how decisively SpaceX can execute long-term strategy in a volatile market environment.
From a broader market perspective, the convergence of SpaceX’s public-market ambitions with the AI arms race highlights a trend where tech giants are building vertical integrations across space, transportation, and artificial intelligence. OpenAI’s and Anthropic’s public-market trajectories, while not guaranteed, add a tailwind to this narrative, suggesting that the next wave of big listings could include private AI labs alongside more diversified technology conglomerates. Investors should watch regulatory developments, the timing and terms of any anchor shareholders, and how SpaceX plans to balance public reporting requirements with its rapid, multi-domain execution plan.
Whether or not the SpaceX IPO materializes on schedule, the reporting underscores a larger dynamic: the market’s willingness to value private, highly strategic technology entities at multi-trillion-dollar levels and to explore new models of ownership and participation, including tokenized access to private-equity-like positions. For crypto markets, the ongoing dialogue around tokenization, crypto holdings, and public-market access remains a live space to watch as these conversations intersect with traditional capital-raising mechanisms.
Readers should monitor upcoming disclosures and investor briefings, which Bloomberg notes SpaceX has signaled will occur later this month. How the market perceives SpaceX’s balance between leadership in aerospace and AI, and how the company navigates governance, capital structure, and crypto exposure, will likely shape the scope of future public-market activity among technology-first, asset-light conglomerates.
As the IPO discourse unfolds, investors and builders will need to weigh not only the size of the offering but also the governance implications, the strategic roadmap for AI initiatives, and the evolving role of crypto in corporate treasury strategies. The next steps—from regulatory filings to investor roadshows—will reveal how SpaceX intends to translate its private-market momentum into a lasting public-market narrative.
Stay tuned for updates on next steps, regulatory milestones, and any refinements to SpaceX’s proposed capital structure as the market awaits a potential landmark listing that could redefine the contours of big-tech and AI investing.


Disclosure: This article does not represent investment advice. The content and materials featured on this page are for educational purposes only.
AI crypto trading bots reshape investing as automation replaces manual execution and emotional decision-making.
Summary
- AI crypto trading bots simplify investing by automating strategies and removing the need for constant monitoring.
- SaintQuant targets beginners with pre-configured strategies and no coding or complex setup required.
- Its fully automated system offers a hands-off approach for users seeking simple, consistent crypto trading.
The rise of AI trading bot crypto solutions has transformed how people approach cryptocurrency trading. What once required deep technical knowledge, constant monitoring, and emotional discipline can now be handled by intelligent automation.
Today, both beginners and experienced traders are exploring automated crypto trading platforms to improve efficiency and reduce manual effort. But key questions remain:
- Do AI trading bots work?
- Can you build one without coding?
- Is there a free crypto trading bot worth trying?
In this guide, we’ll break down everything that is needed to know — from how these bots work to how to choose the best platform — while sharing practical insights to help anyone get started.
What is an AI trading bot in crypto?
An AI trading bot is a software program that uses artificial intelligence to analyze market data and execute trades automatically. Unlike traditional bots that follow fixed rules, AI-powered bots adapt to changing market conditions using:
- Machine learning algorithms
- Predictive analytics
- Real-time data processing
These bots are widely used in:
- Crypto trading online for automated execution
- Portfolio management
- Arbitrage opportunities across exchanges
In essence, an AI-powered Bitcoin bot acts as a 24/7 trading assistant, capable of making decisions faster than any human trader.
Do AI trading bots work? (Realistic expectations)
The short answer: Yes — but with limitations.
Advantages
- 24/7 trading without downtime
- Emotion-free decisions, reducing impulsive trades
- Fast execution in volatile markets
Limitations
- No guarantee of profits
- Performance depends on strategy quality
- Vulnerable to extreme market conditions
AI trading bots work best when used as tools to enhance strategy, not as “set-and-forget money machines.”
How to build an AI Crypto trading bot without coding, and are there free options?
One of the biggest myths in crypto trading is that there’s no need for programming skills to use automation. Fortunately, that’s no longer true.
Simple no-code setup process
For those wondering how to build an AI crypto trading bot without coding, here’s a simplified path:
- Choose a platform
- Select pre-built AI strategies
- Configure risk settings
- Backtest strategies
- Deploy live trading
Modern platforms now provide intuitive dashboards, making the process accessible even to complete beginners.
Tools that make it easy
- Plug-and-play platforms
- Strategy marketplaces
- Managed cryptocurrency trading services
These tools eliminate complexity and allow users to focus on outcomes rather than technical setup.
Is there a free crypto trading bot?
Yes — but most “free” options come with trade-offs.
What “Free” Usually Means:
- Limited features
- Trial-based access
- Restricted performance tools
Hidden Costs to Consider:
- Exchange fees
- Spread and slippage
- Paid upgrades for full functionality
Real example: Try before committing
Some platforms offer a better alternative through trial-based access to premium features.
For instance, SaintQuant provides a beginner-friendly experience with:
This allows users to experience a real automated crypto trading platform — not just a limited demo.
When free bots make sense
Free or trial bots are ideal for:
- Beginners exploring AI trading bots
- Testing strategies safely
- Learning how automation works in real markets
Key takeaway
There is no need for coding skills or a large upfront investment to start using an AI trading bot crypto solution. With no-code tools and trial offers, entry barriers are lower than ever.
Best AI trading bot crypto platforms (expert insights)
Choosing the right platform is critical. Based on usability, features, and accessibility, here are some top options:
1. SaintQuant – Simplified AI Trading for passive income
SaintQuant stands out as a beginner-focused platform designed for simplicity and efficiency.
Key Features:
- Pre-configured AI trading strategies
- No coding or complex setup required
- Fully automated trading system
Advantages:
- Ideal for beginners and passive investors
- Quick onboarding process
- Focus on consistent, automated performance
If you’re looking for a hands-off automated bitcoin trading platform, SaintQuant offers one of the easiest entry points.
2. Cryptohopper – Advanced customization
Cryptohopper is a well-known platform offering:
- Strategy customization
- Signal marketplace
- Advanced trading tools
Pros:
Cons:
- Steeper learning curve for beginners
3. Other AI trading bots worth considering
There are also various:
- Bots for sale in strategy marketplaces
- Hybrid platforms combining AI and manual controls
When evaluating options, always prioritize:
- Security
- Exchange integration
- Transparency
Key features to look for in the best AI trading bot
When choosing the best AI trading bot crypto, consider:
- Automation quality
- Backtesting capabilities
- Risk management tools
- Exchange compatibility
- Performance transparency
These features determine whether a bot is truly effective or just hype.
Risks and best practices
Even the best bots require responsible usage.
Best Practices:
- Start with a small capital
- Diversify strategies
- Monitor performance regularly
- Use secure API configurations
Avoid relying entirely on automation—human oversight still matters.
AI trading bots vs manual trading
| Factor | AI Trading Bots | Manual Trading |
| Speed | Instant execution | Slower |
| Emotion | Emotion-free | Emotion-driven |
| Control | Less direct control | Full control |
Best approach: combine both for optimal results.
Future of AI in crypto trading
The future of AI trading bots is promising, with trends including:
- Integration with DeFi ecosystems
- More advanced predictive models
- Increased adoption among retail investors
As technology evolves, automation will likely become a standard part of crypto trading online.
Conclusion
AI trading bots are reshaping the crypto landscape by making trading more accessible, efficient, and data-driven.
- They work — but require smart usage
- They can be built and deployed without coding
- Free and trial options make it easy to start
Platforms like SaintQuant are helping bridge the gap for beginners, offering a streamlined way to enter the world of automated trading.
If you’re new, start small, experiment with strategies, and gradually scale your involvement. With the right approach, AI-powered cryptocurrency trading services can become a valuable part of your investment toolkit.
Disclosure: This content is provided by a third party. Neither crypto.news nor the author of this article endorses any product mentioned on this page. Users should conduct their own research before taking any action related to the company.


Art on Tezos is no longer a niche experiment; at TezDev 2026 in Cannes, it felt like a working model of where digital culture is going next.
Summary
- At TezDev 2026 in Cannes, “Art on Tezos” staged an immersive, projection-mapped environment that framed on-chain work as a living model for digital culture.
- Speakers highlighted how Tezos lowers costs and barriers so artists from Kurdistan, Africa and South America can build sustainable practices and even escape repression.
- Trilitech’s planned Tezos-powered exhibition at HEK Basel signals that on-chain art is moving deeper into museum ecosystems, compressing photography’s century-long legitimation curve.
TezDev 2026 in Cannes shows how Tezos art has evolved from NFTs into global, politically charged and increasingly institutional grade digital culture and infrastructure.
Hosted at the Hôtel Martinez on March 30, “Art on Tezos: The future of digital creativity” unfolded as an immersive environment rather than a standard panel. Projection‑mapped works wrapped the room in moving images while a conversation between artists, curators, and ecosystem builders traced how on‑chain art has evolved from early NFTs into complex generative systems and responsive installations.
For curator and art advisor Brian Beccafico, Tezos’ real innovation is who it brings into the conversation. Drawing on his work with marketplaces like Objkt, he stressed that on Tezos “you get to meet a lot of artists coming from places that usually just don’t have access to the broader art markets… artists from Africa… South East Asia, South America,” a sharp contrast with a global art economy where “pretty much 70 percent of global value auctioned… is auctioned in New York.” Lower costs and open tooling translate into economic reality: “even if you’re selling artwork for 100 bucks a piece… in a country where the average income is 300 bucks a month, that’s… sustainable for an artist.”
Aleksandra Art, Head of Arts at Trilitech, placed this shift in a longer media history that runs from early photography to Instagram and now blockchain. She reminded the audience that photography itself was once dismissed—“wait, photography is art? What? Like, no, it’s just a picture”—before fairs, critics, and collectors built a new ecosystem around it. The same dynamic is now playing out in digital art: “we had Instagram launch and all of a sudden there are Instagram artists… that don’t need gallery representation,” and blockchains plus marketplaces extend that logic by “creating these networks that congregate people who are passionate about it.” For her, the crucial break is that digital work “doesn’t have to be a confined gallery space… it can be a vertical screen, horizontal screen, HTML, site specific work,” accessible globally “at any point of time” with “similar experiences for different people.”
Beccafico pushed the political edge of this transformation. He recalled exhibitions where artists from Kurdistan “used crypto to flee terrorism, to flee ISIS during the war in Syria,” arguing that cypherpunk ideals still matter: “being able to free yourself from state‑owned currency, state‑owned control, and censorship is still very much a reality in today’s art world.” The result is a scene in which artists from Iraq, Turkey, South America, and beyond are no longer at the margins but, in his words, “the future of both crypto and the future of the art world.”
Alongside Aleksandra and Beccafico, the session’s participants—Vinciane Jones (Art Partner Manager, Trilitech), artists Patrick Tresset and Georg Eckmayr, and others—situated Tezos inside a broader genealogy of systems‑driven practices, from algorithmic drawing to AI‑assisted installations, now made verifiable and tradable on‑chain. Their discussion aligned with the wider TezDev 2026 program, which underscored how protocol upgrades like Tezos X and faster Etherlink confirmations are intended to support richer real‑time art and gaming experiences, not just finance.
Trilitech signaled that TezDev’s immersive exhibition is not a one‑off but part of a longer institutional arc. The team previously announced plans for a forthcoming Tezos‑powered show at HEK (Haus der Elektronischen Künste) in Basel, curated by the established duo Dr. Alfredo Cramerotti and Auronda Scalera, known for pioneering projects at Art Dubai Digital and other major venues that connect blockchain, NFTs, and critical media art. Their involvement points to a future in which on‑chain practices move even further into museum contexts, bringing Beccafico’s emerging‑market artists and Aleksandra’s “fluid,” screen‑native works into dialogue with decades of digital and conceptual experimentation.
If photography’s journey from “just a picture” to museum cornerstone took a century, Tezos (TEZ) artists are compressing that curve into a few intense years, using blockchains not only as markets but as infrastructure for new forms of authorship, community, and survival.

Hedera price has been in a downtrend over the past month as the token continues to be bruised by the geopolitical concerns that have pushed investors away from risk assets.
Summary
- Hedera price dropped to a six-week low of $0.083, down over 12% in a month amid weak market sentiment and geopolitical tensions.
- On-chain activity declined, with DeFi app revenue falling nearly 70% and stablecoin supply dropping 6%, signaling reduced network usage and liquidity.
- Technical indicators remain bearish, with price trading in a descending channel and key support seen at $0.087.
According to data from crypto.news, Hedera (HBAR) price fell to a six-week low of $0.083 on Tuesday, down over 12% in the past month and over 20% from its year-to-date high.
Hedera price fell amid weakness in its underlying ecosystem activity as key performance indicators started to flash red. Data from DeFiLlama shows that revenue generated by DeFi apps on the network had slumped nearly 70% from the previous month’s high.
A drop in app revenue means that a lower number of users are interacting with the Hedera ecosystem, signaling weakening demand for its decentralized applications and reduced overall network usage.
Third-party data also show that the total supply of stablecoins on the network has fallen 6% over the past 7 days to $52.71 million. Declining stablecoin supply typically reflects reduced liquidity and capital inflows on the network, further reinforcing signs of slowing activity.
Hedera price has also remained in a downtrend due to reduced investor appetite for risk assets amid the ongoing U.S.-Iran war that has led to a flight to more traditional safe-haven assets such as gold and U.S. equities.
On the daily chart, Hedera price has been trading within a descending parallel channel pattern, a formation where the asset consistently makes lower highs and lower lows. As long as an asset trades within such a pattern, it will likely continue to face persistent selling pressure as it bounces between the upper and lower boundaries.
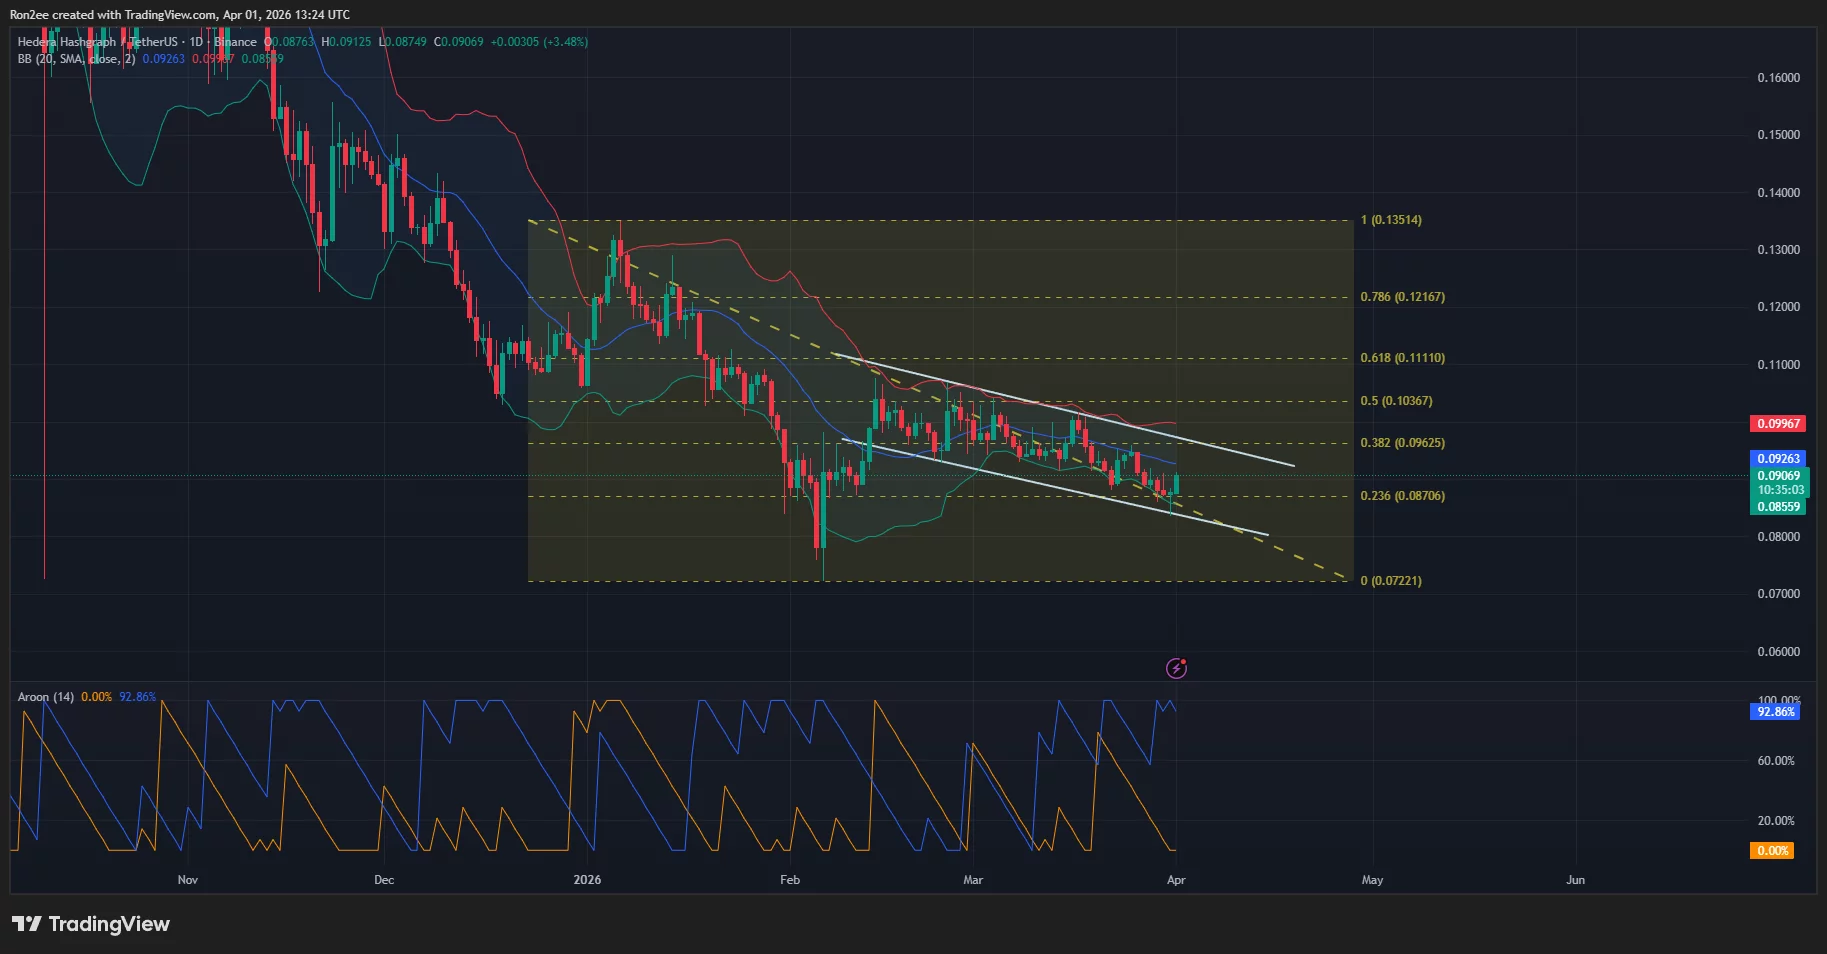
Technical indicators also appear to portray a bearish outlook for Hedera price in the upcoming sessions. Notably, the Bollinger Bands have begun to narrow, with the price trading below the middle band, suggesting contracting volatility while the short-term trend remains tilted to the downside.
The Aroon Down is at 92.86% while the Aroon Up remains at 0%, indicating strong downward momentum and that a recent low has likely been established within the current trend.
For now, the immediate support level for Hedera price lies at $0.087, which aligns with the 23.6% Fibonacci retracement level. A drop below this level could increase selling pressure and open the door for a move toward lower support zones.
Disclosure: This article does not represent investment advice. The content and materials featured on this page are for educational purposes only.


Coinbase is folding regulated prediction markets into its “everything exchange” vision, using The Clearing Company to clear on‑chain event contracts beside crypto and stocks.
Summary
- Coinbase is moving prediction markets from a Kalshi integration toward an on‑chain, in‑house stack after acquiring The Clearing Company, aiming to keep them inside a regulated perimeter.
- In Europe, financial‑underlying prediction markets fall under MiFID while politics and sports are pushed into fragmented national gambling regimes, leaving most current on‑chain volume in regulatory limbo.
- Coinbase is already experimenting with cross‑margining via perpetual futures and sees long‑term scope to extend collateral efficiency across prediction markets, crypto, and tokenized assets on a single venue.
Coinbase’s push to become an “everything exchange” will increasingly run through regulated prediction markets rather than just spot crypto, according to Côme Prost‑Boucle, the exchange’s head of international listings, speaking with crypto.news at ETHGlobal Cannes on March 31.
For Prost‑Boucle, prediction markets are not a novelty bolt‑on. They sit at the core of Coinbase’s plan to become what he calls an “everything exchange.” “The whole strategy is pretty simple,” he told crypto.news.
“We want to build the everything exchange with Coinbase, meaning that we want to bring under one regulated umbrella all of the asset classes that you can imagine and offer this to both our retail customers and our institutional customers.”
Coinbase leading the way to become an ‘Everything Exchange’
That umbrella now stretches beyond spot crypto into derivatives, options, tokenized stocks and equities, token sales and, crucially, event‑based contracts that let users trade on future outcomes. “We have this whole breadth of different products that we’re bringing into one umbrella, which is Coinbase,” he said. “Our goal is to push this to as many users as possible across the world, and the reaction has been pretty tremendous so far.”
Coinbase’s debut in prediction markets was deliberately conservative. The initial launch in the U.S. leaned on Kalshi, the CFTC‑regulated event‑contract venue, giving the product an immediate regulatory backbone but also clear constraints on geography and design.
“The first iteration of the product is available in the US and in a couple of regions, but for instance, it’s not available in Europe because of lack of regulatory clarity,” Prost‑Boucle said. That version effectively pipes Kalshi’s markets into the Coinbase interface, letting users trade small‑ticket contracts on elections, sports, macro data and other real‑world events while staying inside a U.S. event‑contract framework.
The second phase is more aggressive. In December, Coinbase agreed to acquire The Clearing Company, a specialist prediction‑market clearing startup with roots in the existing event‑contract ecosystem.
Prost‑Boucle referred to it in the interview as “a company called The Clearing House,” but the strategic intent is clear. “The goal is for us to bring these capacities internally so that we can develop this product on chain and we can develop with the DNA that we have to bring all asset classes on chain,” he said. In effect, Coinbase is moving from renting regulated rails to owning the clearing and risk stack, and then pushing more of the lifecycle on‑chain while staying within the event‑contract perimeter. That stands in contrast to crypto‑native venues such as Polymarket, which prioritizes unconstrained on‑chain liquidity first and only later began to grapple with regulatory structure.
Prediction markets dominate conversation at ETHGlobal
If prediction markets are to sit alongside crypto, derivatives and tokenized stocks in a single app, collateral efficiency will determine whether users actually route meaningful size through Coinbase. Here, Prost‑Boucle says institutional desks are already applying pressure. “That’s also something that institutional clients have been pushing for,” he noted when asked about cross‑margining prediction markets with other Coinbase products. “We’re currently doing cross‑margining for our perpetual futures product, and that’s something that our institutional clients have been craving,” he added, pointing to demand for “always‑on exposure possibilities, weekend hedging, all of this that perpetual futures have as internal features.” The logical goal is to have a single collateral pool backing BTC perpetuals, tokenized equity and a portfolio of geopolitical or macro event contracts, rather than trapping capital in isolated silos across venues. “At the moment we’re working on this product,” he said of cross‑margining, “but I think that’s a good vision for us in the longer term—to have cross‑margining across the different asset classes, I guess.”
The main structural obstacle to that vision is Europe. “Prediction markets in the EU are pretty difficult to apprehend because there’s no unified regulatory framework,” Prost‑Boucle said. “It all depends on what you have as an underlying asset.” He draws a sharp line that mirrors emerging legal commentary: a contract on the future price of Bitcoin is treated as a financial derivative under MiFID, while a contract on an election or football match is pushed into gambling. “If the contract lies on a financial underlying asset, that would be regulated by MiFID,” he explained. “But all of the other classes, where currently all of the volumes are—on politics, on sports, this would be regulated under gambling laws in Europe.”
That split leaves most of today’s on‑chain volume—heavily skewed toward politics and sports—in regulatory limbo from the perspective of a regulated exchange. Any operator that wants to offer political or sports markets across the bloc has to navigate a patchwork of national gambling regimes, each with its own licensing, consumer rules and, in some cases, state monopolies. “It means you would have to go for every single European gambling law, because there is no unified regulatory framework,” Prost‑Boucle said. “These laws are pretty national, they’re quite country‑specific and they’re quite hard to get.” Despite that, he is not writing off the region. “I guess we’re still hopeful that at some point we’re going to have regulatory clarity on prediction markets and a better structure in Europe that enables this type of contract to flourish as well,” he said.
Beyond trading revenues, Coinbase clearly sees prediction markets as an information layer that competes with polling, research, and even traditional media. Prost‑Boucle points to cases in the U.S. where broadcasters are already embedding live market odds, such as CNBC, CNN, the Dow Jones and other media recently integrating Polymarket odds into the ‘traditional’ newscycle.
That, in turn, brings the problem of truth into focus. Once markets start pricing geopolitics, conflicts, and leadership changes, disputes over what actually happened can become payout disputes. That means oracles used to resolve contracts may be facing increasing scrutiny from not only bettors, but also regulators.
Prost‑Boucle argues that most of the damage begins with poor contract design. “It’s crucial when you enter a contract to look at what the event criteria are,” he said. “Obviously you want to diversify sources of truth and have kind of fixed criteria to make sure there is no ambiguity when an event like this happens,” he added. Asked whether AI agents could help by aggregating across outlets and delivering a consolidated verdict, he is open but cautious. “Potentially, AI could be helping with sorting out across different sources‑of‑truth venues and making sure that we have a consolidated view and a fixed view that is not biased by any specific media or even a group of people,” he said.
For now, Coinbase’s approach is less about chasing the wildest version of prediction markets and more about proving they can live inside the same rule‑set as everything else on the platform: keep them in a regulated perimeter, pull clearing and risk in‑house via The Clearing Company, and wire the whole thing into a broader multi‑asset venue where collateral actually earns its keep across products. As Brian Armstrong has put it in other contexts, Coinbase wants to be “the most trusted bridge” into the crypto economy, and in that frame, everything else—from MiFID hair‑splitting in Brussels to the next generation of AI‑driven oracles—is just another set of constraints to engineer around, not a reason to sit out a market.
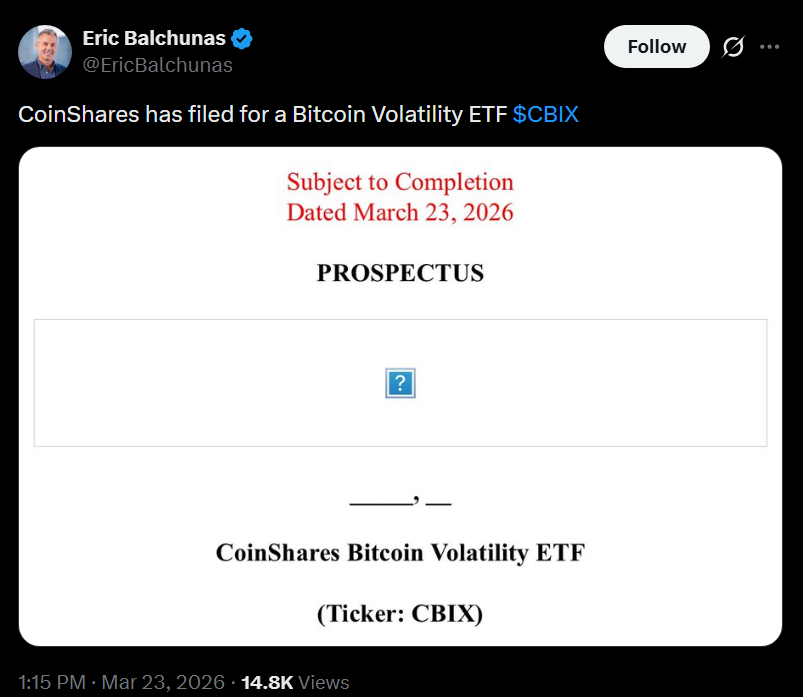
CoinShares, a European-based digital asset manager, is slated to make its US public markets debut today following the completion of a special purpose acquisition company (SPAC) merger, highlighting the crypto industry’s deepening ties with public markets.
The company announced Wednesday that it had finalized a previously announced business combination with Vine Hill Capital Investment Corp., resulting in the formation of a new holding entity, CoinShares PLC. The combined company begins trading on the Nasdaq on Wednesday under the ticker symbol CSHR.
The transaction, first unveiled in September, values CoinShares at approximately $1.2 billion and includes a $50 million capital commitment from institutional investors.
Although the Nasdaq debut marks CoinShares’ entry into US public markets, the company was already publicly traded in Europe prior to the listing.
A US listing aims to attract institutional capital, wider analyst coverage and increased visibility, while positioning CoinShares to expand its footprint in the world’s largest financial market. The move also comes as the regulatory backdrop for digital assets in the United States continues to evolve.
CoinShares manages more than $6 billion in assets and is one of Europe’s largest crypto-focused investment firms. It is best known for its crypto exchange-traded products (ETPs), which are listed on European exchanges.

A tougher backdrop for crypto stocks
The backdrop for digital asset companies has shifted dramatically since September, when CoinShares’ SPAC deal was first announced.
The exchange-traded fund issuer’s CoinShares Bitcoin Mining ETF (WGMI) is down more than 22% in the last six months, Yahoo Finance data shows.
The crypto market has since lost more than half its value, following a broad correction in digital asset prices, declining trading volumes and the fallout from the Oct. 10 crypto liquidation event that triggered widespread deleveraging, alongside a more volatile environment for capital raising and investors.
Crypto-linked equities have been among the hardest hit. Companies such as Coinbase, Gemini and Figure Technologies are down sharply this year, while Circle has bucked the trend amid continued growth in stablecoins.

However, analysts at Bernstein don’t expect the downturn to persist. In a recent note, they said crypto-related stocks could be nearing a bottom heading into first-quarter earnings, which are widely expected to reflect weak performance.
Related: Circle plunged on CLARITY Act fears, but fundamentals unchanged — Bernstein


At Kaiko’s Cannes conference, S&P DJI and Kaiko unveiled plans to tokenize the iBoxx U.S. Treasury index on Canton, turning it into programmable on-chain IP.
Summary
- iBoxx U.S. Treasuries is being brought natively on Canton alongside DTCC’s on-chain Treasuries to support index-linked product issuance on the same infrastructure.
- S&P will distribute the index as a smart contract token embedding full index data, IP rights, licensing terms, fees and access controls.
- The model treats index data “like a financial asset,” enabling traceability, automated fee collection and reusable, scalable licensing on-chain.
At the Agora Kaiko conference in Cannes on March 31, S&P Dow Jones Indices’ Chief Product and Operations Officer Cameron Drinkwater and Kaiko CEO Ambre Soubiran unveiled a partnership to tokenize one of S&P’s flagship fixed-income benchmarks, the iBoxx U.S. Treasury index, on the Canton network, turning the index itself into a programmable on-chain IP product rather than a simple price feed.
New Canton, Kaiko and S&P DGI partnership announced
Kaiko CEO Ambre Soubiran announced that “Kaiko and S&P DGI, we’ve been partnering now in tokenizing one of the biggest S&P benchmarks, the iBoxx index, and bringing that onto the Canton Network.” The move follows DTCC’s decision to bring U.S. Treasuries natively onto Canton (CC), which Drinkwater described as “a natural opportunity for us to bring the iBoxx Treasury index also on Canton to give product developers or counterparties a tool to use with the physical underlying also on that chain.”
Soubiran emphasized this is “not just publishing the price of the benchmark on the network.” Instead, S&P is “actually creating a smart contract token that contains all of the index data,” so that clients receive “a smart contract containing the index data but also explicitly having licensing and fees and access control all embedded into a smart contract.” She framed it as “more about a distribution play rather than a data play,” delivering the full index product on-chain.
Drinkwater said choosing iBoxx was a “total no-brainer” because with DTCC putting U.S. Treasuries on Canton, “you have the underlying” and “a very active kind of treasury institutional trade landscape on Canton” plus “real demand for the iBoxx Treasury index to be used as a underlying for product issuance on the Canton chain.”
On-chain IP and data-as-asset
For S&P, tokenizing indices as full IP products changes how licensing and economics work. Drinkwater argued that “one of the great advantages for an IP issuer like ourselves on chain is we actually have better auditability, visibility in how IP is being used, reporting on that use case and… instantaneous reporting and potentially commercial exchange based on that smart contract.” In traditional markets, he noted, S&P is “dependent on delayed reporting on volumes,” often disputed, followed by “multiple months on contract settlement,” whereas on chain “the whole timeline pulls in quite considerably” with “far less opportunity for dispute.”
Soubiran linked this to a broader shift: “the more we bring capital markets applications on chain, the more we bring data on chain, especially private and IP protected data, the more we need to treat data like a financial asset.” Blockchain infrastructure, she said, enables “traceability of data and treat data like a financial asset and trace where that data goes,” which is “great from a IP protection standpoint” and for “programmatically” managing monetization of IP in financial products.
Drawing on Kaiko’s own index business, she noted that many index fee arrangements are tied to AUM and turnover, with end-of-year reconciliations still “quite heavily manual.” Moving indices on-chain allows firms to “on chain verify what is the AUM related to the financial product that is linked to your index or your benchmark” and enable “daily fee collection based on daily turnover.” It is, she said, “not necessarily a novel product, it’s just a novel way of distributing” existing benchmarks.
Composability, evergreen contracts and Canton
Both speakers highlighted composability as a key benefit of this design. “The idea of tokenizing an index is for product issuers… to consume that index product natively on chain and wrap it into a index-linked financial product,” Soubiran explained, calling the application of composability to data products “extremely new and powerful.”
Drinkwater described the structure as layered: “you can think of the token being the index and then the smart contract being wrapped around it and that’s the use case, the use case specific terms and conditions, audit rights, etc.” That wrapper “can be tailored to whatever use case clients come to us for, but then it’s repeatedly usable. It’s evergreen. It’s on chain.” Compared with today’s model, where “clients have to come to us for every use case, it’s a new schedule on their MSA,” he said this offers “a very frictionless process of getting new product issued on chain, massively speeding up timelines,” and a “reusable infrastructure that really benefits all parties.”
On why Canton matters, Drinkwater pointed to its ability to straddle public and private workflows. On fully public chains like Ethereum, “that reporting is going to be public,” which does not fit “a lot of our use cases” such as “private exchange swaps… between institutions and they don’t want that public.” Canton’s setup, he said, lets reporting be “private when it needs to be private, public where it can be public, but back to us nonetheless,” unifying reporting across use cases in a way that “in TradFi is not the case.”
Soubiran framed the broader aim as servicing “almost a new addressable market that is your existing clients moving to an infrastructure that is programmatic and a little bit more disintermediated,” stressing that “a lot of great things exist in our current financial system,” but that the opportunity lies in “making things more automated… more programmatic in the transfer of information, the transfer of data.”
S&P’s broader digital roadmap
Drinkwater placed the Kaiko and Canton partnership within S&P’s longer digital asset strategy. He recalled that SPY “was not SPY for the first decade of its life, but it flag planted,” and said S&P understands “the power of moving first and establishing real use cases in new technology.” With a brand “known and trusted by institutions and retail alike,” S&P wants “to move first and early when we have conviction in new products and new technologies because we need our brand to be firmly planted there as an established entity.”
Over the last year, he said, S&P has “very selectively” chosen “high quality players as partners and putting IP on chain where we saw very discrete and tangible use cases,” citing the on-chain S&P 500 token with Centrifuge and the Digital Markets 50 index with Genari that bundles blockchain-exposed equities and cryptocurrencies in a structure “hard to replicate in TradFi.” Even so, he signaled he is “most excited about the innovation that we’re pushing today” with tokens wrapped in smart contracts that are “tailored to use cases, but extensible and evergreen on chain,” because this “unlocks so many use cases and scalability of our IP.”

Algorand price surges over 20% as Google quantum paper brings attention to ALGO
Why the Masters—and Augusta National—beguiles us so endlessly
4 Cool Bluetooth Gadgets You Can Connect To Your Echo Dot


-

 Business6 days ago
Instagram, YouTube Found Responsible for Teen’s Mental Health Struggle in Historic Ruling
-
 Tech6 days ago
Intercom’s new post-trained Fin Apex 1.0 beats GPT-5.4 and Claude Sonnet 4.6 at customer service resolutions
-

 NewsBeat5 days ago
The Story hosts event on Durham’s historic registers
-

 Sports5 days ago
Sweet Sixteen Game Thread: Tide vs Michigan
-
Entertainment2 days ago
Fans slam 'heartbreaking' Barbie Dream Fest convention debacle with 'cardboard cutout' experience
-
 Entertainment4 days ago
Lana Del Rey Celebrates Her Husband’s 51st Birthday In New Post
-
Crypto World2 days ago
Dems press CFTC, ethics board on prediction-market insider trades
-

 Tech3 days ago
The Pixel 10a doesn’t have a camera bump, and it’s great
-

 Crypto World6 hours ago
Gold Price Prediction: Worst Month in 17 Years fo Save Haven Rock
-

 Sports1 day ago
Tallest college basketball player ever, standing at 7-foot-9, entering transfer portal
-

 Tech2 days ago
EE TV is using AI to help you find something to watch
-

 Tech2 days ago
Apple will hide your email address from apps and websites, but not cops
-

 Entertainment7 days ago
HBO’s Harry Potter Series Will Definitely Fail For One Big Reason, And It’s Not J.K. Rowling Or Snape
-

 Tech2 days ago
Flipsnack and the shift toward motion-first business content with living visuals
-

 Tech2 days ago
How to back up your iPhone & iPad to your Mac before something goes wrong
-

 Fashion6 days ago
En Vogue in Brown Leather and Tailored Neutrals by Atelier Savoir, Styled by J Bolin
-

 Politics2 days ago
Should Trump Be Scared Strait?
-

 Crypto World2 days ago
U.S. rule change may open trillions in 401(k) funds to crypto
-

 Fashion6 days ago
What Are Your Favorite T-Shirts for the Weekend?
-

 Fashion5 days ago
Weekly News Update, 3.27.26 – Corporette.com
You must be logged in to post a comment Login