
Crypto World
Ethereum Dust Attacks Surge After Fusaka Upgrade

Stablecoin-driven dusting attacks are increasingly shaping Ethereum’s daily activity profile. After the Fusaka upgrade, which aimed to cut on-chain data costs and streamline postings from layer-2 networks back to Ethereum, observers say cost reductions have coincided with a rise in tiny-value transfers. In practical terms, dusting is now contributing a meaningful share of on-chain activity, even as the majority of transfers remain economically meaningful.
Key takeaways
- The Fusaka upgrade lowered data-availability costs on Ethereum, leading to a noticeable uptick in overall transaction volume and active addresses. Daily transactions have exceeded 2 million on average, with a mid-January peak near 2.9 million and about 1.4 million daily active addresses—roughly a 60% uptick from prior baselines.
- Dusting activity tied to stablecoins now accounts for about 11% of daily transactions and 26% of active addresses on an average day, a sizable jump from pre-Fusaka levels of roughly 3–5% of transactions and 15–20% of addresses.
- Analyses of USDC and USDT on Ethereum from November 2025 to January 2026 show growing decentralization effects: approximately 43% of dust-related updates involve transfers under $1, and 38% under a single cent, highlighting wallets seeded with tiny amounts.
- Security researchers flag a surge in address creation linked to dusting, with a reported 170% rise in new addresses during the week of January 12, often tied to low gas fees and the ability to move minuscule sums cheaply.
- Despite the dusting trend, the majority of stablecoin activity remains organic. Roughly 57% of balance updates exceed $1, suggesting meaningful, economically relevant use alongside the dusting flow.
Tickers mentioned: $ETH, $USDC, $USDT
Sentiment: Neutral
Market context: The surge in on-chain activity coincides with broader shifts in gas economics and the adoption of layer-2 data posting, signaling a transitional period in Ethereum’s usage patterns as users navigate cheaper transaction costs and new data handling efficiencies.
Why it matters
Ethereum’s post-Fusaka landscape presents a nuanced picture for users, developers, and market observers. On the one hand, the upgrade has delivered tangible benefits: lower costs and improved throughput for posting data from layer-2 networks, which translates into more affordable interactions on the main chain. On the other hand, the same efficiency gains appear to have lowered the friction barrier for dusting campaigns—malicious attempts to seed wallets with tiny, nearly worthless amounts designed to contaminate transaction analytics and entice recipients to transact with the wrong counterparties.
Coin Metrics recently analyzed more than 227 million balance updates for USDC (USDC) and USDt (USDT) on Ethereum from November 2025 through January 2026. The findings show a shift in composition: while a portion of this activity clearly reflects genuine use (payments, settlements, liquidity provisioning), a non-trivial slice now consists of very small transfers that serve as digital footprints, wallet seeding attempts, or poisoning attempts. The data show that 43% of observed dust transfers were under $1, and 38% were under a single penny, underscoring the economic minimalism of many such transactions.
The number of addresses holding small “dust” balances, greater than zero but less than 1 native unit, has grown sharply, consistent with millions of wallets receiving tiny poisoning deposits.
Before Fusaka, stablecoin dust accounted for roughly 3–5% of Ethereum transactions and 15–20% of active addresses. Post-Fusaka, those figures climbed to about 10–15% of transactions and 25–35% of active addresses on a typical day, representing a two- to threefold increase in the dust footprint. Yet, the remaining 57% of balance updates involved transfers above $1, indicating that a significant portion of activity continues to reflect genuine economic activity rather than precautionary or malicious watering of the chain.
Post-Fusaka growth in activity reflects genuine usage, though dust activity is a factor worth noting when interpreting headline metrics.
Dusting has also produced tangible financial losses for some victims. One security researcher noted a reported $740,000 in losses tied to address poisoning attacks. In a striking display of scale, the top attacker executed nearly 3 million dust transfers at a cost of only about $5,175 in stablecoins, highlighting how cheap these techniques can be to deploy relative to the potential impact on victims and analytics platforms.
Dust does not represent genuine economic usage
Analysts emphasize that while stablecoin dust activity has surged, it does not necessarily reflect meaningful growth in demand for goods or services on the network. Rough estimates suggest that around 250,000 to 350,000 daily Ethereum addresses participate in stablecoin dust activity, a non-trivial but still partial window into Ethereum’s overall usage. The broader takeaway is that the network’s growth remains real in many dimensions, even as dust-related actions complicate the interpretation of raw metrics.
The majority of post-Fusaka growth reflects genuine usage, though dust activity is a factor worth noting when interpreting headline metrics.
What to watch next
- Monitoring the ongoing impact of Fusaka on gas pricing and data-posting efficiency across layer-2 ecosystems and any subsequent network upgrades.
- Tracking changes in dusting patterns as wallet hygiene tools and defender initiatives evolve, and as user education campaigns address address-poisoning risks.
- Observing whether regulatory guidance or industry standards lead to improved transparency around dust activity and its impact on on-chain analytics.
- Evaluating whether new anti-dust measures or protocol-level mitigations reduce the feasibility or profitability of dusting campaigns.
Sources & verification
- Coin Metrics, State of the Network, issue 349 (Substack) — analysis of stablecoin balance updates on Ethereum from November 2025 through January 2026.
- Coin Metrics balance updates for USDC (USDC) and USDt (USDT) on Ethereum — dataset cited in the analysis.
- Andrey Sergeenkov, observations on new wallet addresses and address-poisoning dynamics in January 2026.
- Cointelegraph — reporting on address poisoning attacks and the broader dusting phenomenon on Ethereum.
Dusting dynamics and the Fusaka uplift
Ethereum (CRYPTO: ETH) has become a focal point for evaluating how protocol upgrades reshape user behavior and on-chain signals. The Fusaka upgrade, completed in December, broadened the network’s capacity to absorb data from layer-2 bridges and rollups by reducing the cost of posting information. As a result, average daily transactions crossed the 2 million mark, with a sharp jump to nearly 2.9 million in mid-January. Daily active addresses also rose to about 1.4 million, marking a 60% uplift from prior baselines. In this shifting environment, dusting activity has moved from a relatively modest slice of the activity pie to a more prominent feature of the daily ledger, complicating the task of parsing “real” usage from artificial traffic.
Coin Metrics’ analysis, based on a substantial data sample from USDC (USDC) and USDt (USDT), underscores a nuanced narrative. While a meaningful portion of dust transfers is sub-dollar in value, there remains a substantial portion of the activity above traditional thresholds that implies legitimate use—staking, payments, liquidity provisioning, and other routine operations. By juxtaposing post-Fusaka metrics with historical baselines, the report illustrates a two- to threefold expansion in stablecoin dust prevalence, without dismissing the persistent proportionality of bona fide usage on the network. The conversation around dust thus sits at the intersection of efficiency gains, on-chain economics, and security considerations for users navigating a more permissive but also more complex transaction landscape.
As researchers continue to scrutinize the data, the narrative remains that dusting is a real factor in Ethereum’s on-chain activity—but not a wholesale indictment of the network’s growth. The balance between authentic demand and opportunistic traffic will likely shape how developers and researchers frame Ethereum’s success in the months ahead. In the near term, users should remain vigilant about dust-induced address-poisoning vectors and ensure they transact with clear, verified destinations to minimize risk. The broader market will watch how these dynamics influence perceptions of network health, gas economics, and the resilience of security models in the wake of evolving usage patterns.

Crypto World
Powell’s comments on oil, inflation may provide BTC price guidance: Crypto Daybook Americas
By Omkar Godbole (All times ET unless indicated otherwise)
Bitcoin and the wider crypto market are taking a breather in advance of today’s Federal Reserve rate decision, which could confirm that the interest-rate backdrop is becoming less of a tailwind.
The central bank is widely expected to keep the benchmark borrowing cost unchanged in the 3.5%-3.75% range, putting the focus on growth and inflation projections as well as Chairman Jerome Powell’s comments at the post-meeting press conference.
“For investors, the key question is whether the dot plot shifts toward fewer cuts and whether Powell emphasizes the danger of easing financial conditions too quickly,” said Fabian Dori, chief investment officer at Sygnum Bank, referring to the chart of where decision makers expect interest rates to be at year-end. “Either development would reinforce a ‘higher for longer’ bias and tighten financial conditions at the margin.”
According to Dori, the bitcoin price is at a critical juncture, where repeated failures to stay above $75,000 signals caution and mean-reversion behavior. Should the Fed raise alarm over the inflationary impact of the Iran war-related oil-price shock and reinforce expectations of slower or delayed rate cuts, then BTC is likely to remain below $75,000.
“A more hawkish stance could keep bitcoin capped below 75k and extend the current consolidation phase,” he noted.
Singapore-based QCP Capital said markets have pared easing expectations as the higher oil price complicates the case for interest-rate cuts, even as growth and labour data soften. This leaves the rates backdrop less supportive for crypto.
Bitcoin’s stalled upswing stalled comes despite renewed institutional appetite for spot ETFs and regulatory clarity from the SEC and CFTC.
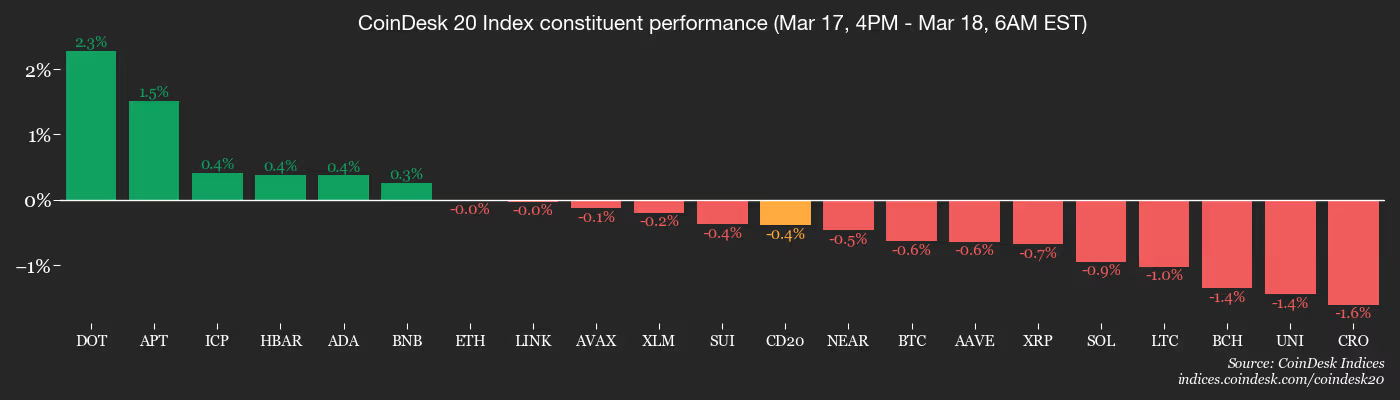
The broader market continues to mirror the largest cryptocurrency. The CoinDesk 20 Index has been largely steady for the past 24 hours, alongside similar action in ether (ETH), XRP (XRP), solana (SOL), and other majors. Smaller coins such as SIREN, M, and KAS, however, have gained about 10% each.
In traditional markets, futures tied to the S&P 500 index have risen by 0.5%, signaling an extension of a two-day rally. Meanwhile, the Dollar Index pulled back to 99.50 from Friday’s high above 100, and the 10-year Treasury yield receded to 4.17% from 4.30%. Taken together, these moves point to continued risk-on sentiment. Stay alert!
Read more: For analysis of today’s activity in altcoins and derivatives, see Crypto Markets Today
What to Watch
For a more comprehensive list of events this week, see CoinDesk’s “Crypto Week Ahead“.
- Crypto
- Macro
- March 18, 8:30 a.m. ET: U.S. PPI MoM for February est. 0.3% (Prev. 0.5%); Core PPI MoM est. (Prev. 0.8%)
- March 18, 8:30 a.m.: U.S. PPI YoY for February est. 3.7% (Prev. 3.6%); Core PPI YoY est. 3.2% (Prev. 3.6%)
- March 18, 9:45 a.m.: Bank of Canada interest-rate decision est. 2.25% (Prev. 2.25%)
- March 18, 10:00 a.m.: U.S. Factory Orders MoM for January (Prev. -0.7%)
- March 18, 2:00 p.m.: Federal Reserve interest-rate decision est. 3.50%-3.75% (Prev. 3.50%-3.75%); FOMC economic projections
- March 18, 2:30 p.m.: Fed Chair press conference
- Earnings (Estimates based on FactSet data)
- March 18: Bitfarms (BITF), pre-market, -$0.03
Token Events
For a more comprehensive list of events this week, see CoinDesk’s “Crypto Week Ahead“.
- Governance votes & calls
- March 18: Jupiter (JUP) to hold its weekly Planetary Call community session with team updates.
- March 18: head of marketing and PR to discuss ecosystem updates.
- WalletConnect Network is voting on allocating 50 million WCT tokens as a dedicated rewards budget for WalletConnect Pay in 2026. Voting ends March 18.
- ENS is voting on a one-time transfer of 900,000 USDC from the ENS Endowment to wallet.ensdao.eth to cover a shortfall in stream payments owed to ENS Labs. Voting ends March 18.
- Unlocks
- Token Launches
- March 18: Katana (KAT) to be listed on Binance, MEXC, KuCoin, and others.
Conferences
For a more comprehensive list of events this week, see CoinDesk’s “Crypto Week Ahead“.
Market Movements
- BTC is down 0.73% from 4 p.m. ET Tuesday at $73,825.38 (24hrs: +0.11%)
- ETH is down 0.44% at $2,307.45 (24hrs: -0.33%)
- CoinDesk 20 is down 0.78% at 2,148.73 (24hrs: -0.27%)
- Ether CESR Composite Staking Rate is down 6 bps at 2.75%
- BTC funding rate is at -0.0069% (-7.5643% annualized) on Binance

- DXY is unchanged at 99.56
- Gold futures are down 0.10% at $4,996.20
- Silver futures are up 0.65% at $80.05
- Nikkei 225 closed up 2.87% at 55,239.40
- Hang Seng closed up 0.61% at 26,025.42
- FTSE 100 is up 0.29% at 10,433.60
- Euro Stoxx 50 is up 1.02% at 5,828.33
- DJIA closed on Tuesday up 0.10% at 46,993.26
- S&P 500 closed up 0.25% at 6,716.09
- Nasdaq Composite closed up 0.47% at 22,479.53
- S&P/TSX Composite closed up 0.16% at 32,929.09
- S&P 40 Latin America closed down 3.50% at 3,459.11
- U.S. 10-Year Treasury rate is down 2 bps at 4.20%
- E-mini S&P 500 futures are up 1.30% at 6,809.00
- E-mini Nasdaq-100 futures are up 1.57% at 25,184.00
- E-mini Dow Jones Industrial Average futures are up 1.18% at 47,595.00
Bitcoin Stats
- BTC Dominance: 59.11 (0.15%)
- Ether-bitcoin ratio: 0.03139 (0.1%)
- Hashrate (seven-day moving average): 919 EH/s
- Hashprice (spot): $32.37
- Total fees: 3.08 BTC / $228,857
- CME Futures Open Interest: 115,080 BTC
- BTC priced in gold: 14.9 oz.
- BTC vs gold market cap: 4.93%
Technical Analysis

- The chart shows the number of BTC/USD longs, or bullish bets, on Bitfinex.
- The growth has stalled, with the tally now at 78,470 versus 79,115 early this month.
- As counterintuitive as it may sound, past data shows that declines in long positions on Bitfinex tend to be bullish for BTC, and vice versa.
Crypto Equities
- Coinbase Global (COIN): closed on Tuesday at $210.23 (+3.40%), +1.77% at $213.95 in pre-market
- Galaxy Digital (GLXY): closed at $23.50 (+1.73%), +0.89% at $23.71
- MARA Holdings (MARA): closed at $9.24 (+0.11%), +0.97% at $9.33
- Riot Platforms (RIOT): closed at $14.68 (+1.94%), +1.02% at $14.83
- Core Scientific (CORZ): closed at $16.42 (–3.24%), +1.46% at $16.66
- CleanSpark (CLSK): closed at $10.11 (+0.90%), +0.99% at $10.21
- Exodus Movement (EXOD): closed at $9.24 (–0.86%)
- CoinShares Bitcoin Mining ETF (WGMI): closed at $40.13 (–0.79%)
- Circle Internet Group (CRCL): closed at $132.31 (+5.15%), +1.50% at $134.30
- Bullish (BLSH): closed at $39.94 (+0.81%), +1.10% at $40.38
Crypto Treasury Companies
- Strategy Inc. (MSTR): closed at $150.28 (+1.87%), +0.32% at $150.76
- Strive Asset Management (ASST): closed at $11.10 (+2.21%), unchanged in pre-market
- SharpLink (SBET): closed at $8.31 (+1.34%), +0.48% at $8.35
- Upexi (UPXI): closed at $1.15 (+6.48%), –0.87% at $1.14
- Lite Strategy (LITS): closed at $1.21 (–3.20%)
ETF Flows
Spot BTC ETFs
- Daily net flows: $199.4 million
- Cumulative net flows: $56.51 billion
- Total BTC holdings ~1.29 million
Spot ETH ETFs
- Daily net flows: $138.2 million
- Cumulative net flows: $11.99 billion
- Total ETH holdings ~5.76 million
Source: Farside Investors
While You Were Sleeping


ETH is up 22% year-on-year while Bitcoin has shed nearly 11% over the same stretch, a divergence that is starting to show up in the charts.
Bitcoin’s market share is stuck between 58% and 60%, which is a six-month trading range that one expert says will decide whether Ethereum and smaller altcoins enter a bullish season or suffer more losses.
As such, the market observer urged keeping an eye on the level at which dominance could break, ushering in the next big move in the crypto market.
The Narrow Corridor Controlling Crypto’s Fate
Bitcoin dominance (BTC.D), which measures how much of the total cryptocurrency market cap BTC makes up, was stuck between 58% and 60% for the last 6 months. But according to analyst Ash Crypto, this consolidation has created a technical setup where a break above 60% could send dominance up to 63% or 64%.
And if that happened, it would mean that institutions are only buying Bitcoin, causing altcoins to bleed further and pushing the value of the ETH/BTC pair to new lows.
On the other hand, a break below 58% would mean that capital is leaving Bitcoin and going into Ethereum and other altcoins. The analysts said that this would confirm an ETH/BTC breakout above the 0.0320 level, which would mark the start of a genuine altcoin season.
The ETH/BTC pair itself is printing what Ash Crypto described as a bear trap, something it has done twice before.
“Break above 0.0320 and ETH starts outperforming Bitcoin,” the expert wrote. “Break below 0.0280 and new lows follow.”
At the time of writing, ETH/BTC was trading close to 0.0314, just below the critical threshold Ash Crypto had identified.
You may also like:
Ethereum’s Technical Picture Gets Interesting
BTC itself has been mostly flat over the past 24 hours, staying just above $74,000 after hitting a six-week high of about $76,000 on Coinbase on Tuesday. However, there’s much more action over longer periods, with the asset up more than 6% in the last seven days and about 8% across 30 days.
Ethereum has had a pretty good performance in the last few weeks, going up about 14% in the last seven days and about 18% in both the last 14 and 30 days. At the time of writing, it was trading above the $2,300 level, up 22% from the same time last year, compared to BTC’s nearly 11% drop in the same period.
At the same time, ETH’s SuperTrend indicator changed from “Sell” to “Buy” for the first time since September 2025. Recall, the last two times that signal showed up, the cryptocurrency rose by 52% and 174%, respectively, prompting analyst Ali Martinez to identify $2,400 and $2,600 as the next levels to watch.
Binance Free $600 (CryptoPotato Exclusive): Use this link to register a new account and receive $600 exclusive welcome offer on Binance (full details).
LIMITED OFFER for CryptoPotato readers at Bybit: Use this link to register and open a $500 FREE position on any coin!

3 Reasons This Drone Stock Soared 520% and Is Up Another 32% Today
Crypto World
BTC price treads water near $74,000 as derivatives signal caution: Crypto Markets Today

Bitcoin consolidated following Tuesday’s jump to $76,000 alongside a 33% drop in daily trading volume to $36.9 billion.
The largest cryptocurrency has added just 0.4% since midnight UTC after bouncing off $73,500 as it looks to establish a new level of support ahead of a potential bullish breakout.
While analysts predicted a fast move to $80,000 after $72,000 was taken out, price action has actually been much more measured. Traders with long positions took profits and those who were forced out of short positions are waiting on the sidelines to reenter.
Volatility has also retreated in commodities gold, silver and crude oil, with the war in Iran continuing to put complete risk-on mode on hold.
U.S. stocks are beginning to experience a period of prolonged upside; Nasdaq 100 futures are up 0.66% since midnight UTC, followed by the S&P 500, which has gained 0.5%.
Investors will be keeping a close eye on Wednesday’s Federal Reserve meeting because although a rate pause is all but certain, increased inflation numbers due to the surge in oil prices and weaker job numbers in the U.S. could influence sentiment at the post-decision press conference.
Derivatives positioning
- Growth in bitcoin futures open interest (OI) on major exchanges has stalled alongside slightly negative fund rates. That’s a sign that traders are not adding new bullish positions and bears are getting a slight edge.
- OI in ETH, XRP and SOL fell from early Tuesday highs as spot prices lost bull momentum. This suggests traders are unwinding positions, pointing to a cooling of speculative activity.
- OI in privacy-focused ZEC, which has gained nearly 4% in 24 hours and 31% in a week, has risen to 1.75 million ZEC, the most since Jan. 25. The increase in OI validates the recent price rise.
- Funding rates for XRP, BNB and SOL have flipped negative, indicating a bias for bearish short positions. Traders may be hedging for potential downside volatility after the Fed meeting.
- Bitcoin’s one-day implied volatility, or the expected price swing over 24 hours, remains steady at around an annualised 50%. That equates to a 24-hour move of about 2.6%. In other words, the market doesn’t see the impending Fed meeting as a major price mover for the largest cryptocurrency.
- The same can be said for ether, solana and XRP.
- On Deribit, options market positioning looks defensive in both bitcoin and ether, with skews showing a bias for put, or bearish, options.
- Block flows featured demand for limited profit potential strategies such as bitcoin call diagonal spreads and volatility bets like straddles. In ETH’s case, traders preferred risk reversals and straddles.
Token talk
- The altcoin market continues to show strength with the “Altcoin Season” index hitting its highest in six months. The reading of 54/100 is a far cry from early February, when it languished at 22/100.
- Privacy coin zcash (ZEC) was one of the best-performing altcoins on Wednesday, adding 3.4% since midnight despite the rest of the market trading relatively unchanged. It has now increased by 32% in the past week.
- Decentralized finance (DeFi) lending token MORPHO also continued its rich vein of form after rising by 2.3% since midnight to add to a monthly gain of 33%.
- The best-performing benchmark over the past 24 hours has been the
CoinDesk Smart Contract Platform Select Capped Index (SCPXC), with the index heavily weighted towards layer-1 tokens posting a 0.8% gain, while the CoinDesk Memecoin Index (CDMEME) lost ground, tumbling by 2.7%.

Ripple has expanded its financial infrastructure in Brazil, targeting deeper institutional adoption and regulatory approval. The company introduced payments, custody, and treasury tools for local institutions. Meanwhile, it plans to secure a Virtual Asset Service Provider license under Brazil’s evolving digital asset framework.
Ripple Expands Enterprise Services in Brazil
Ripple has launched a full enterprise platform tailored for Brazil’s financial institutions. The rollout includes cross-border payments, custody solutions, and treasury management tools. Moreover, the company added prime brokerage features to extend services beyond basic payment rails.
The expansion aligns with Brazil’s structured regulatory push for digital assets and financial innovation. Ripple continues to focus on compliance while scaling operations in regulated markets. Therefore, the planned VASP license application supports its long-term presence in the country.
Brazil offers a mature financial ecosystem, which attracts global fintech firms seeking growth opportunities. Ripple has maintained a regional focus due to increasing demand for efficient settlement systems. Consequently, the company positions its infrastructure as a solution for modern financial operations.
Institutional Adoption and RLUSD Growth
Ripple Payments now operates across more than 60 markets and has processed over $100 billion globally. The platform enables faster settlement using both fiat currencies and stablecoins. Additionally, several Brazilian institutions actively use the network for payments and liquidity management.
Banco Genial uses Ripple’s system for same-day U.S. dollar disbursements and plans to integrate RLUSD into payment flows. Braza Bank supports U.S. dollar transfers and issued its BBRL stablecoin on the XRP Ledger. Meanwhile, Nomad manages treasury flows between Brazil and the United States using Ripple infrastructure.
Other firms continue to adopt Ripple’s tools for various financial operations across the region. Azify supports currency exchange into major global currencies using the Ripple system. Similarly, Attrus and Frente Corretora use the platform for cross-border payments and foreign exchange settlements.
RLUSD adoption continues to rise across Latin America, supported by institutional demand for liquidity solutions. The stablecoin has surpassed a $1.5 billion market capitalization. Furthermore, regulators in the United States oversee RLUSD through established financial authorities.
Ripple Custody has also expanded into Brazil, offering secure digital asset storage for institutions. The platform integrates compliance tools and supports staking across multiple proof-of-stake networks. As a result, firms such as CRX and Justoken now use custody services for tokenized asset operations.
CRX has settled nearly $100 million on-chain using Ripple Custody and XRPL infrastructure. Meanwhile, Justoken has tokenized over $1.7 billion in assets and plans regional expansion. This growth reflects increasing institutional reliance on blockchain-based financial systems.
RLUSD now trades on platforms such as Mercado Bitcoin, Foxbit, and Ripio across Brazil. Additionally, several financial institutions support the stablecoin for treasury and settlement use cases. This integration strengthens Ripple’s broader payments ecosystem across Latin America.
A cross-party parliamentary committee in the United Kingdom has urged the government to impose an immediate moratorium on cryptocurrency donations to political parties until stronger safeguards are in place.
In a report published on Wednesday, the Joint Committee on the National Security Strategy said the government should amend the Representation of the People Bill to impose an “immediate moratorium on crypto donations” until the Electoral Commission produces statutory guidance ahead of the next general election, due by August 2029.
The committee also called for the creation of a Political Finance Enforcement Unit to oversee these activities and reduce the minimum threshold for declaring gifts tied to political donations from 11,180 British pounds ($14,900) to 500 pounds ($668), and proposed increasing the maximum custodial sentences to three years for wrongdoing involving foreign financing.
The committee cited growing foreign state threats and efforts to influence the UK’s positions on critical issues, including its relations with the US, the European Union and Ukraine.
The recommendation comes amid rising scrutiny of crypto-linked money in British politics. Nigel Farage’s Reform UK became the first party to start accepting crypto donations in 2025. Reform UK recently disclosed a $4 million donation from crypto investor Christopher Harborne in the fourth quarter of 2025, after a record $12 million gift in the previous quarter.

Crypto donations pose “unnecessary” risk for UK politics
Crypto donations pose an “unnecessary and unacceptably high risk” to the integrity of the political finance system and public trust, barring robust regulator guardrails, the report states.
“We see no democratic imperative to permit the use of crypto in political finance until adequate safeguards are in place.”
The committee also cited jurisdictions, such as Ireland, that have banned party members from accepting political cryptocurrency donations due to foreign interference concerns.
The report comes shortly after Matt Western, chair of the committee, urged the government to put a temporary halt on crypto donations to political parties, citing foreign interference risks, Cointelegraph reported on Feb. 26.
Related: UK Lords launch stablecoin inquiry as Bank of England moves to finalize rules
Crypto donations raise concern in the UK
Political cryptocurrency donations are legal in the UK, subject to permissible rules under the Electoral Commission guidance. UK lawmakers reportedly started considering a ban on political cryptocurrency donations in December 2025.
Weeks later, seven senior UK Labour Party MPs have urged Prime Minister Keir Starmer to ban crypto for political donations, Cointelegraph reported on Jan. 12.
“Crypto can obscure the true source of funds, enable thousands of micro donations below disclosure thresholds, and expose UK politics to foreign interference,” wrote business and trade committee chair Liam Byrne, one of the seven signatories of the letter.
Magazine: How crypto laws changed in 2025 — and how they’ll change in 2026
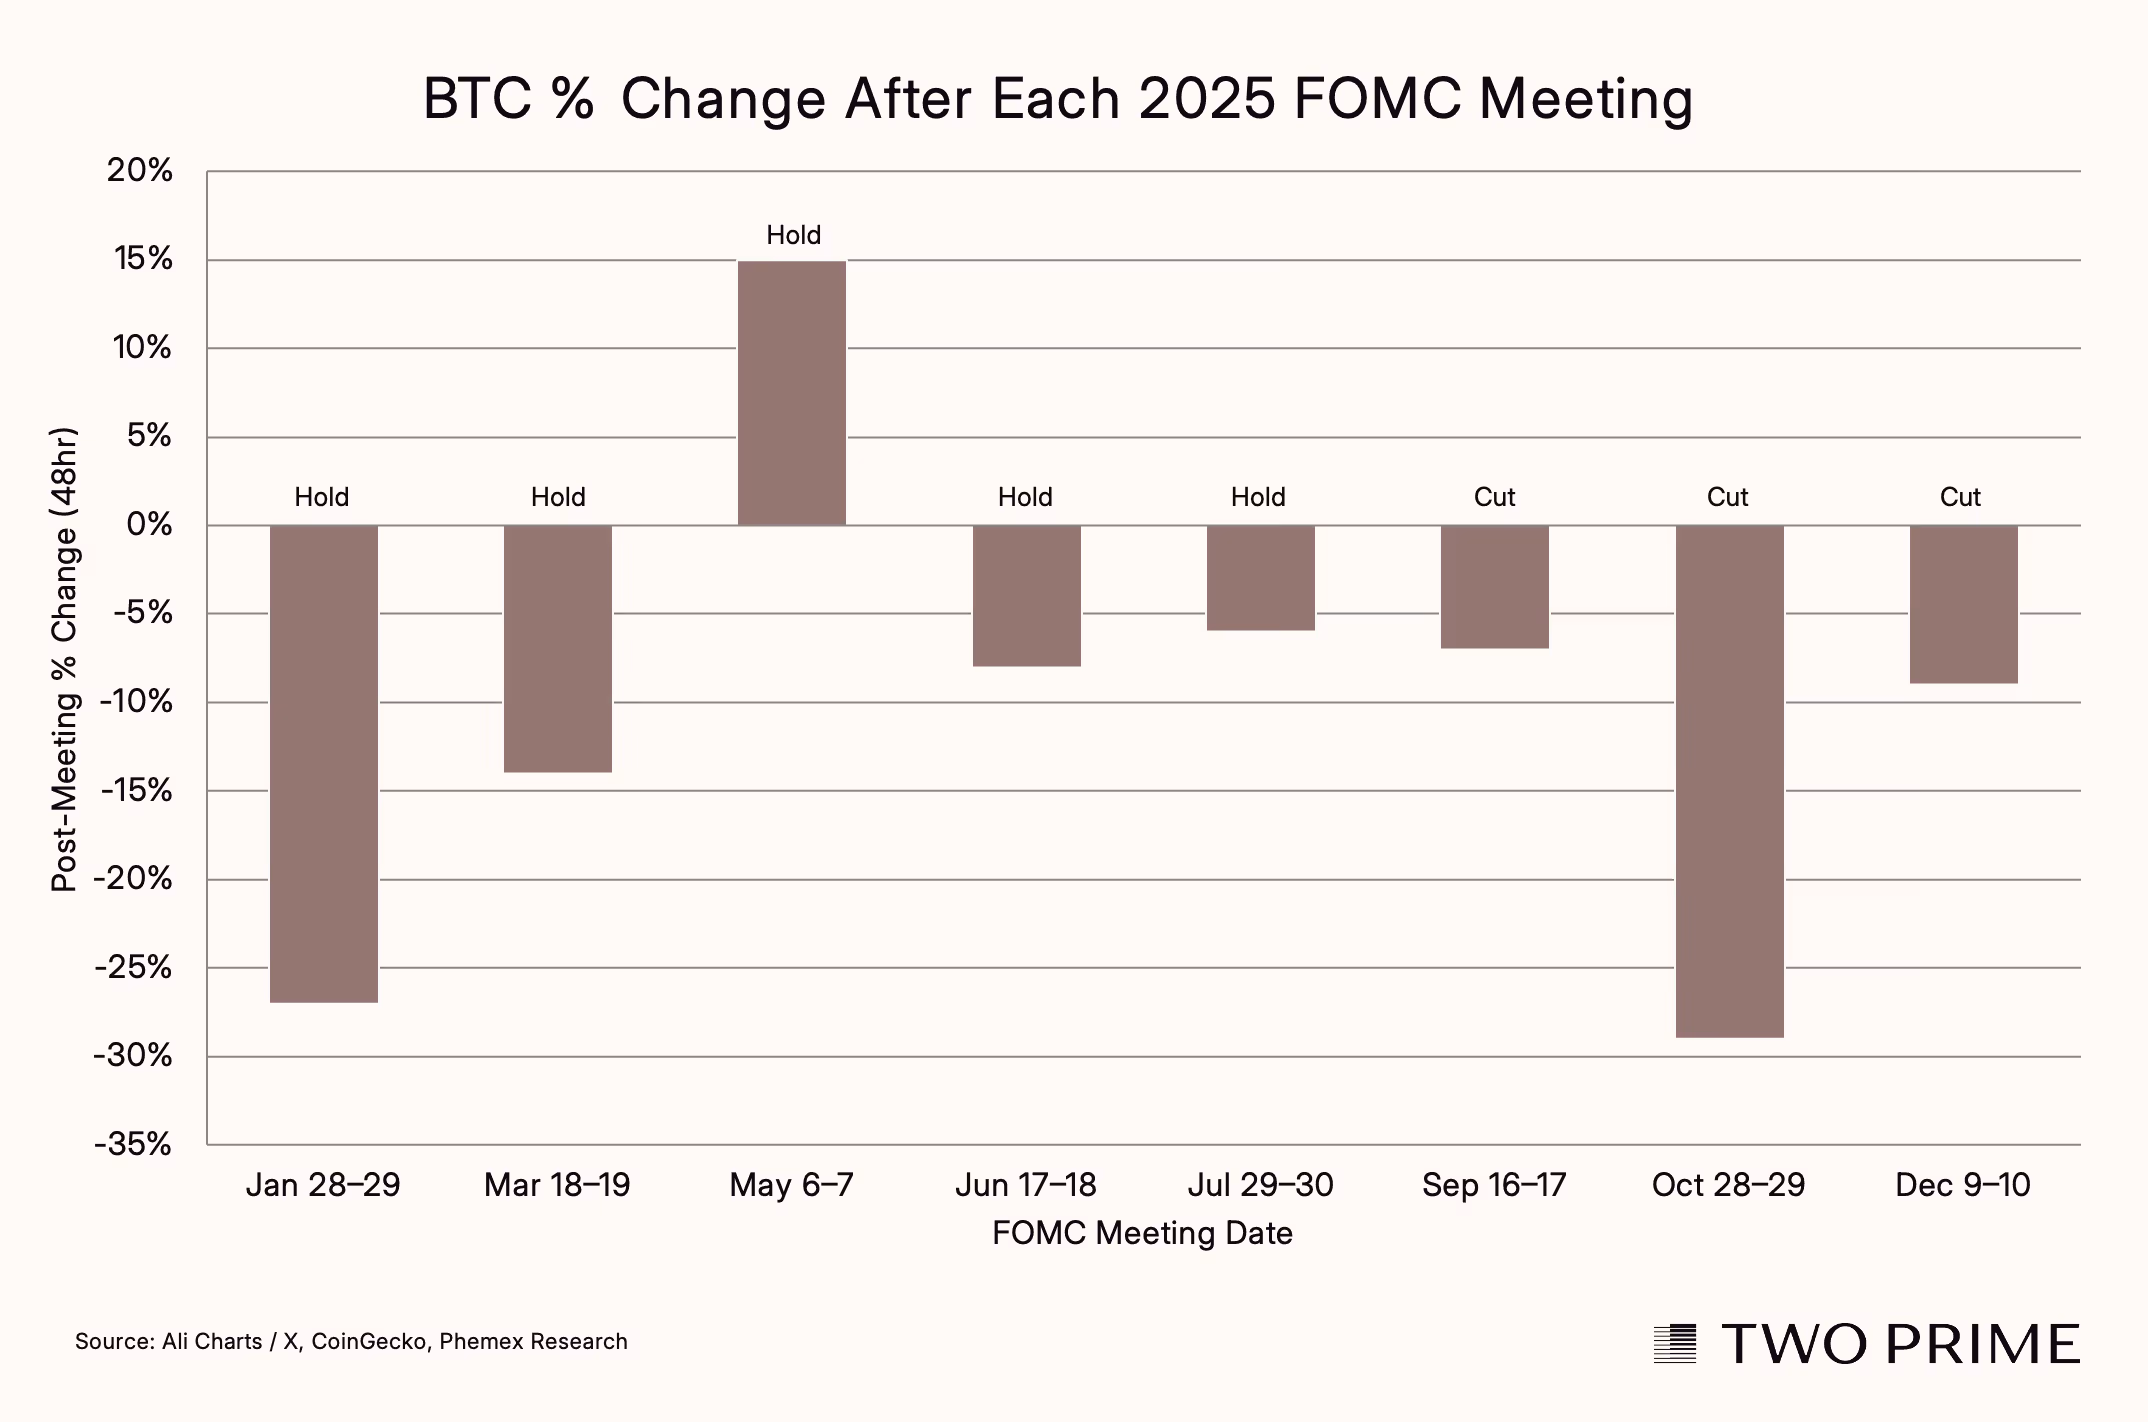
Bitcoin heads into the March Federal Open Market Committee (FOMC) meeting with strong momentum, trading above $74,000 after eight consecutive daily gains. However, data compiled by bitcoin lender Two Prime suggests this strength may mask a recurring pattern, FOMC meetings have historically acted as short term bearish catalysts for BTC.
Looking at 2025, bitcoin posted negative returns in the 48 hours following seven of eight FOMC meetings. Even in May, when BTC rallied sharply, the broader trend points to consistent post meeting weakness regardless of whether the Fed held rates or shifted policy direction. This reinforces the idea that the event itself, rather than the outcome, drives volatility.

The upcoming decision is unlikely to deliver surprises. Markets are pricing a near certainty, around 99%, that the Federal Reserve will hold rates steady in the 350 to 375 basis point range. Meanwhile, the futures market is only pricing in a single 25 basis point rate cut by the end of the year, reinforcing a higher for longer backdrop. Even with a new Federal Reserve chair, Kevin Warsh, expected to take over in June.
Macro risks further complicate the picture. Escalating conflict in the Middle East and oil prices hovering around $100 a barrel are likely to put upward pressure on CPI inflation numbers, limiting the Fed’s flexibility to ease policy on top of a weakening jobs market.
With bitcoin entering the meeting in a buoyant state, the risk shifts toward a classic sell the news reaction.

Spot Ethereum exchange-traded funds drew in $138.2 million in net inflows over the past day, their highest single-day inflows since Feb. 25.
Summary
- Spot Ethereum ETFs recorded $138.2 million in daily inflows, marking their highest since late February and extending a six-day inflow streak.
- Institutional demand strengthened amid Bitmine’s continued ETH accumulation, with Fundstrat’s Tom Lee calling a potential market bottom near $2,150.
- ETH price traded near $2,328, with price approaching a breakout above $2,400 as markets await the Federal Reserve rate decision.
According to data compiled by SoSoValue, BlackRock’s ETHA led the inflows of the day with $81.7 million entering the fund. The largest investment manager’s Staked ETH ETF (ETHB) followed with $67.2 million in net inflows.
More modest inflows came from Grayscale’s ETH and ETHE funds, which drew in $15.4 million and $9.4 million, respectively. Part of these gains were offset by Fidelity’s FETH, which experienced $35.4 million in withdrawals.
The latest inflows extend the investment products’ inflow streak to six straight days during which they managed to pull in over $385 million from investors. On a weekly basis, Ethereum ETFs have entered their fourth positive week, attracting nearly $440 million in total.
The surge in institutional interest comes as Bitmine, the leading Ethereum treasury company chaired by Fundstrat’s Tom Lee, continues its aggressive ETH accumulation strategy amid broader macroeconomic and geopolitical uncertainty rising from the Middle East.
Meanwhile, Lee has recently called a market bottom for Ethereum after it fell to a local low of $2,150 on Monday, suggesting that the recent pullback may have marked the end of the short-term downtrend and could pave the way for a recovery.
At press time, Ethereum (ETH) price was trading sideways at $2,328 after bulls failed to break past the $2,400 resistance on Tuesday.
Markets now appear to be awaiting the Federal Reserve interest rate cut decision scheduled to be revealed later today. It is largely expected that the Federal Open Market Committee (FOMC) will choose to hold interest rates steady in the current range of 3.5% to 3.75%, with CME FedWatch Tool data showing odds of over 98% for a pause.
On the 4-hour chart, ETH price has been trading within an ascending parallel channel pattern that it has respected since mid-February this year. A breakout from the upper trendline of the pattern has historically signaled a positive reversal in momentum. At press time, the ETH price was close to breaking out from that upper side.
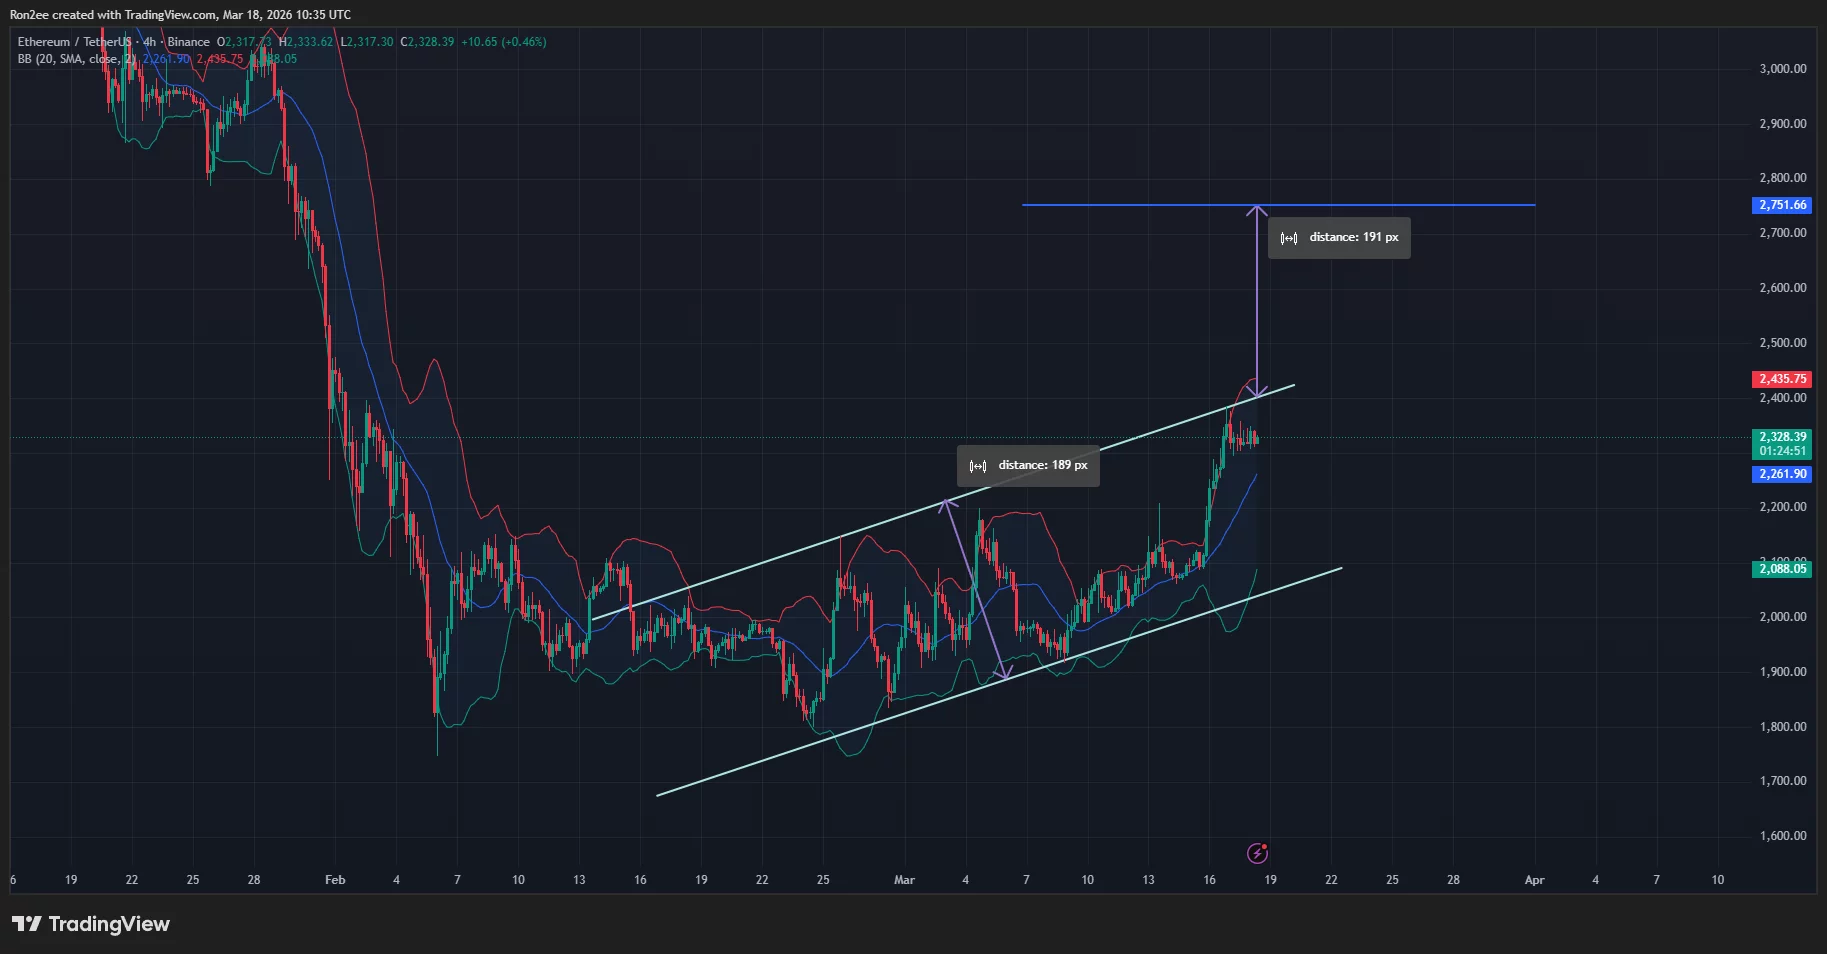
Ethereum price has crossed the middle band of the Bollinger Bands at $2,261 and was closing in towards the $2,435 level, which marks the upper band of the technical indicator.
Hence, ETH price eyes a break above the $2,400 psychological resistance, bound to $2,435 next. This rally could then extend to as high as $2,751 if bullish momentum lasts. That target is calculated by adding the height of the ascending channel formed to the point at which the breakout occurs.
Meanwhile, failure to hold the $2,262 support, which forms the middle band, will likely see the price retreat toward the lower trendline of the current channel.
Disclosure: This article does not represent investment advice. The content and materials featured on this page are for educational purposes only.
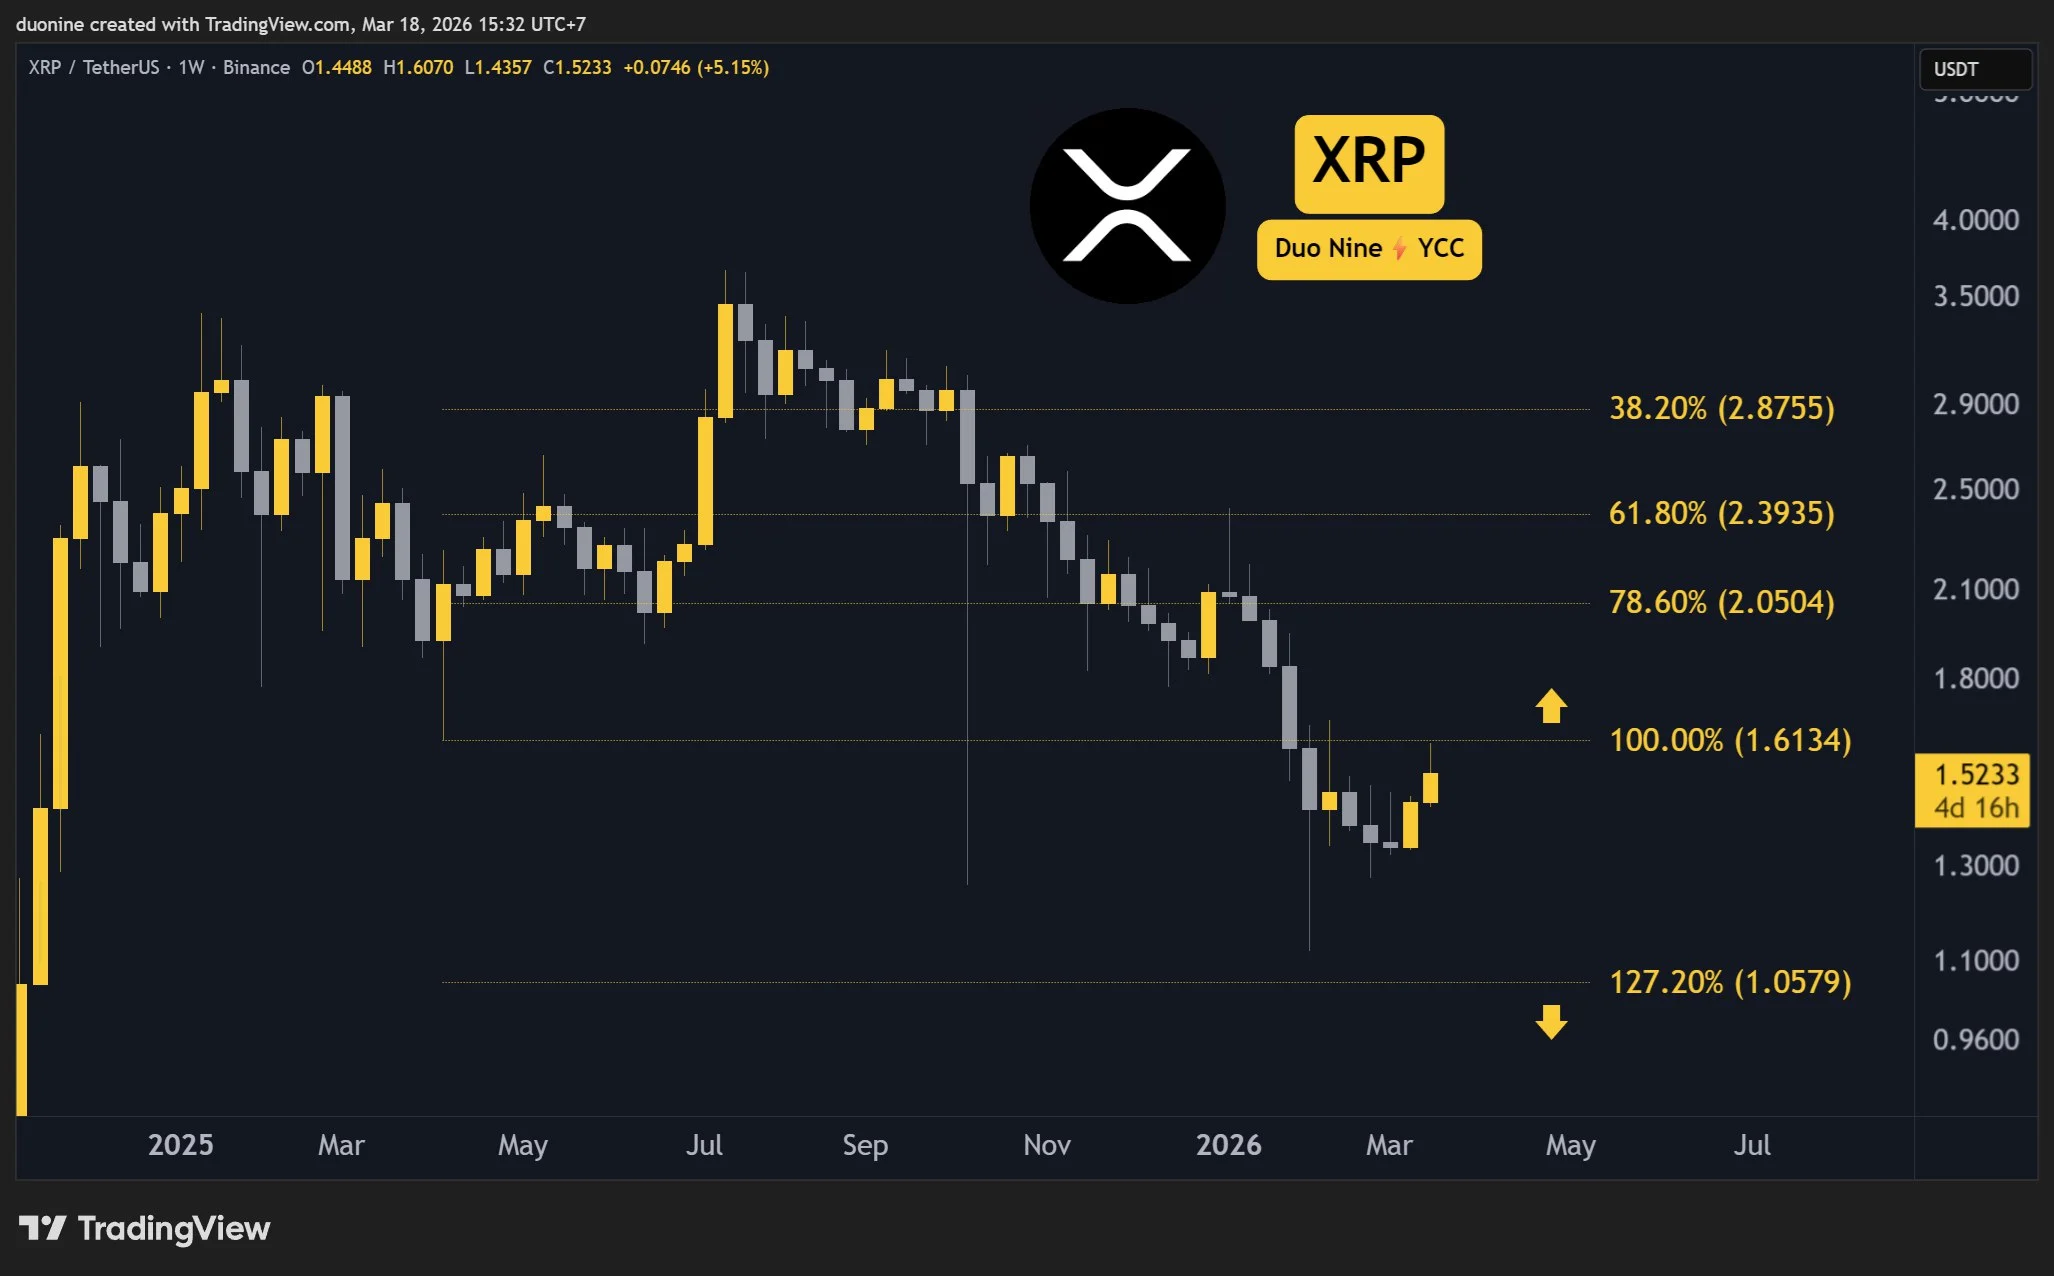
XRP just tested the key $1.6 resistance level. Can it break it?
Ripple (XRP) Price Predictions: Analysis
Key support levels: $1.4
Key resistance levels: $1.6
XRP is Challenging the Key Resistance
As expected, XRP has rallied all the way to the key resistance at $1.6. Buyers tried to break this level, but sellers returned to defend it. At the time of this post, the price is found in a pullback as it consolidates under this level.
Buyers will need more force and momentum if they want to break this resistance. That becomes possible if the volume increases, since so far, volume levels have been rather flat. This shows some hesitation here from market participants.

Is a Reversal Possible?
If bulls can turn $1.6 into key support, then this downtrend is likely over, and a sustained reversal will follow, sending XRP back to $2 and beyond. However, this price action remains too uncertain to be confident about such an outcome.
Should the overall market remain bullish with Bitcoin moving above $75k, then XRP has a good shot at higher levels. On the other hand, if the market remains flat, then XRP will also struggle to move above $1.6.
RSI Bullish Cross
On the weekly chart, the RSI just made a bullish cross, which is an early signal that a major reversal could be ahead of us. While this is still early, a price above $1.6 would confirm this breakout and see buyers return in force.
Best to be patient here and let the price develop to build confidence. Ideally, the RSI will continue to make higher highs, which would be a clear signal that sellers have lost control.

Binance Free $600 (CryptoPotato Exclusive): Use this link to register a new account and receive $600 exclusive welcome offer on Binance (full details).
LIMITED OFFER for CryptoPotato readers at Bybit: Use this link to register and open a $500 FREE position on any coin!
Disclaimer: Information found on CryptoPotato is those of writers quoted. It does not represent the opinions of CryptoPotato on whether to buy, sell, or hold any investments. You are advised to conduct your own research before making any investment decisions. Use provided information at your own risk. See Disclaimer for more information.
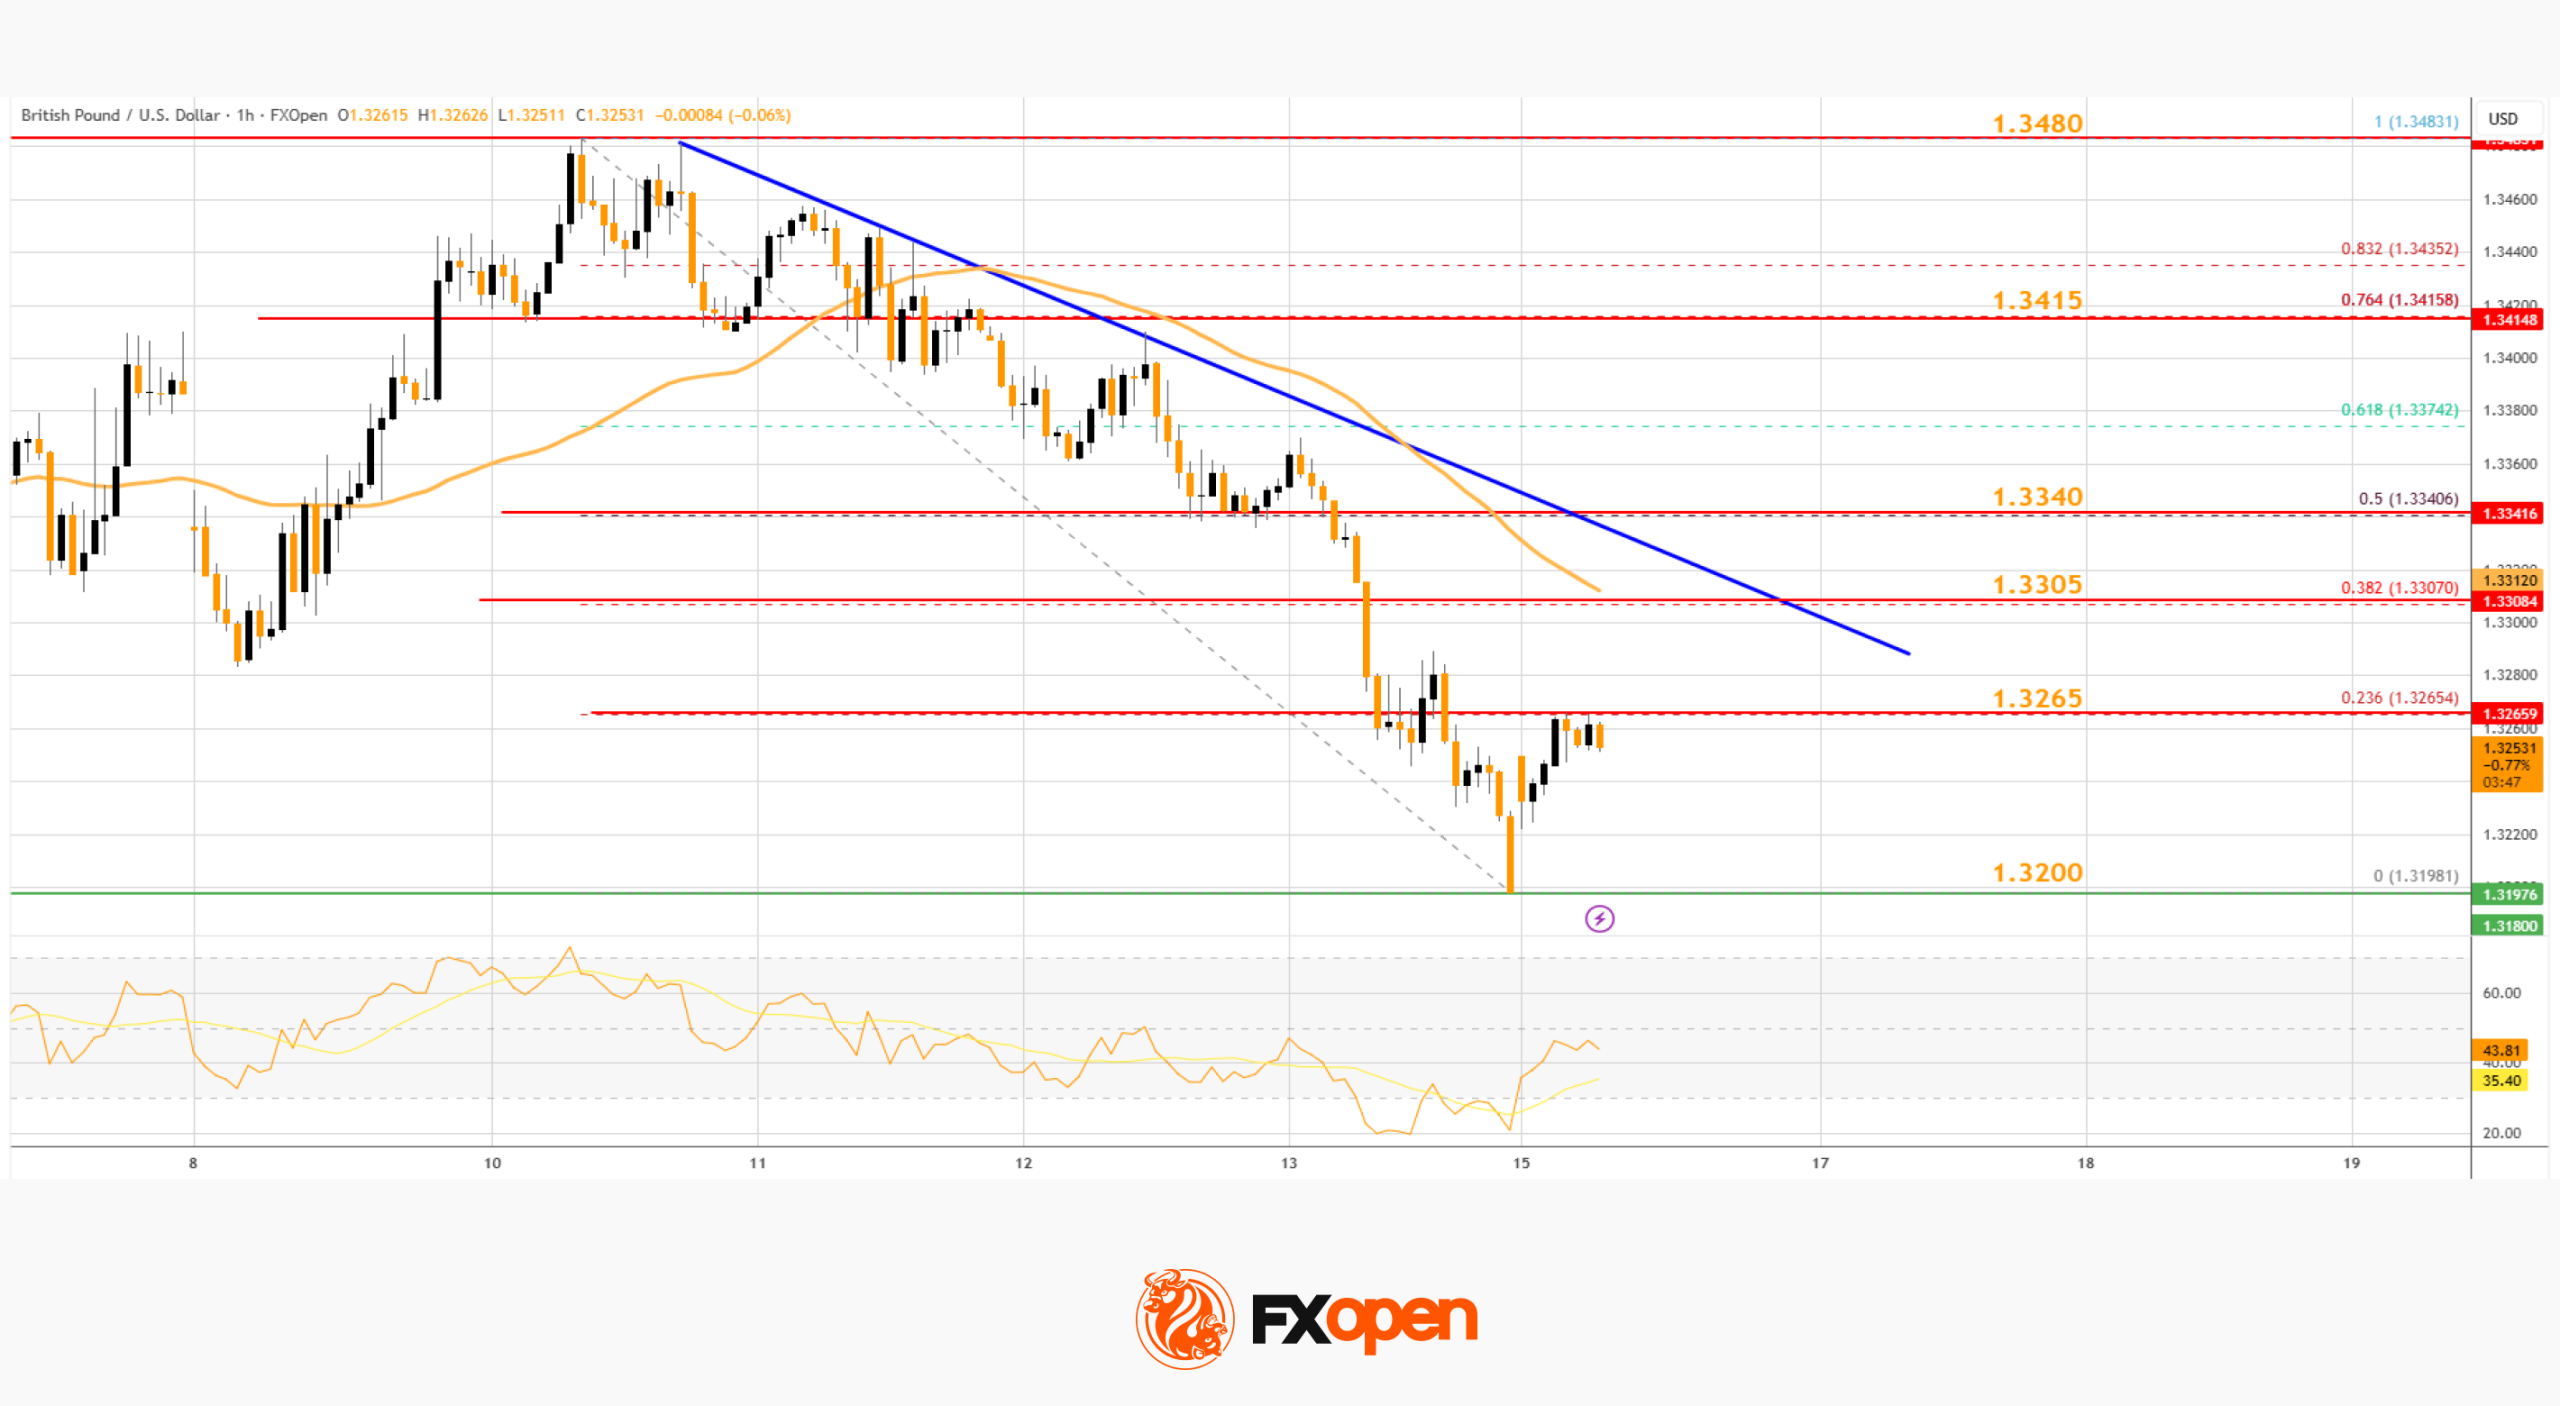
GBP/USD started a fresh decline below 1.3300. USD/CAD is consolidating gains and might aim for a fresh increase above 1.3750.
Important Takeaways for GBP/USD and USD/CAD Analysis Today
· The British Pound started another decline from 1.3500.
· There is a key bearish trend line forming with resistance at 1.3305 on the hourly chart of GBP/USD at FXOpen.
· USD/CAD is showing positive signs above the 1.3660 support zone.
· There is a key bullish trend line forming with support at 1.3610 on the hourly chart at FXOpen.
GBP/USD Technical Analysis
On the hourly chart of GBP/USD at FXOpen, the pair struggled to continue higher above 1.3500. The British Pound started a fresh decline and traded below 1.3400 against the US Dollar.
The pair even traded below 1.3300 and the 50-hour simple moving average. Finally, the bulls appeared near the 1.3200 level. The recent swing low was formed at 1.3198, and the pair is now consolidating losses.

On the upside, the pair is now facing hurdles near the 23.6% Fib retracement level of the downward move from the 1.3483 swing high to the 1.3198 low at 1.3265.
The first major breakout zone for a recovery wave could be near a key bearish trend line at 1.3305 and the 50-hour simple moving average. The next key pivot zone sits near the 50% Fib retracement at 1.3340. A close above 1.3340 could open the doors for a move to 1.3415. Any more gains might send the pair toward 1.3500 in the coming days.
If there is a fresh decline, initial support on the GBP/USD chart sits at 1.3200. The next major area of interest could be 1.3165, below which there is a risk of another sharp decline. In the stated case, the pair could drop toward 1.3050.
USD/CAD Technical Analysis
On the hourly chart of USD/CAD at FXOpen, the pair formed a strong base above 1.3500. The US Dollar started a fresh increase above 1.3600 and 1.3650 against the Canadian Dollar.
The bulls pushed the pair above the 1.3680 and 1.3700 levels. The pair cleared the 50-hour simple moving average and settled above 1.3700. A high was formed at 1.3741, and the pair is now consolidating gains.
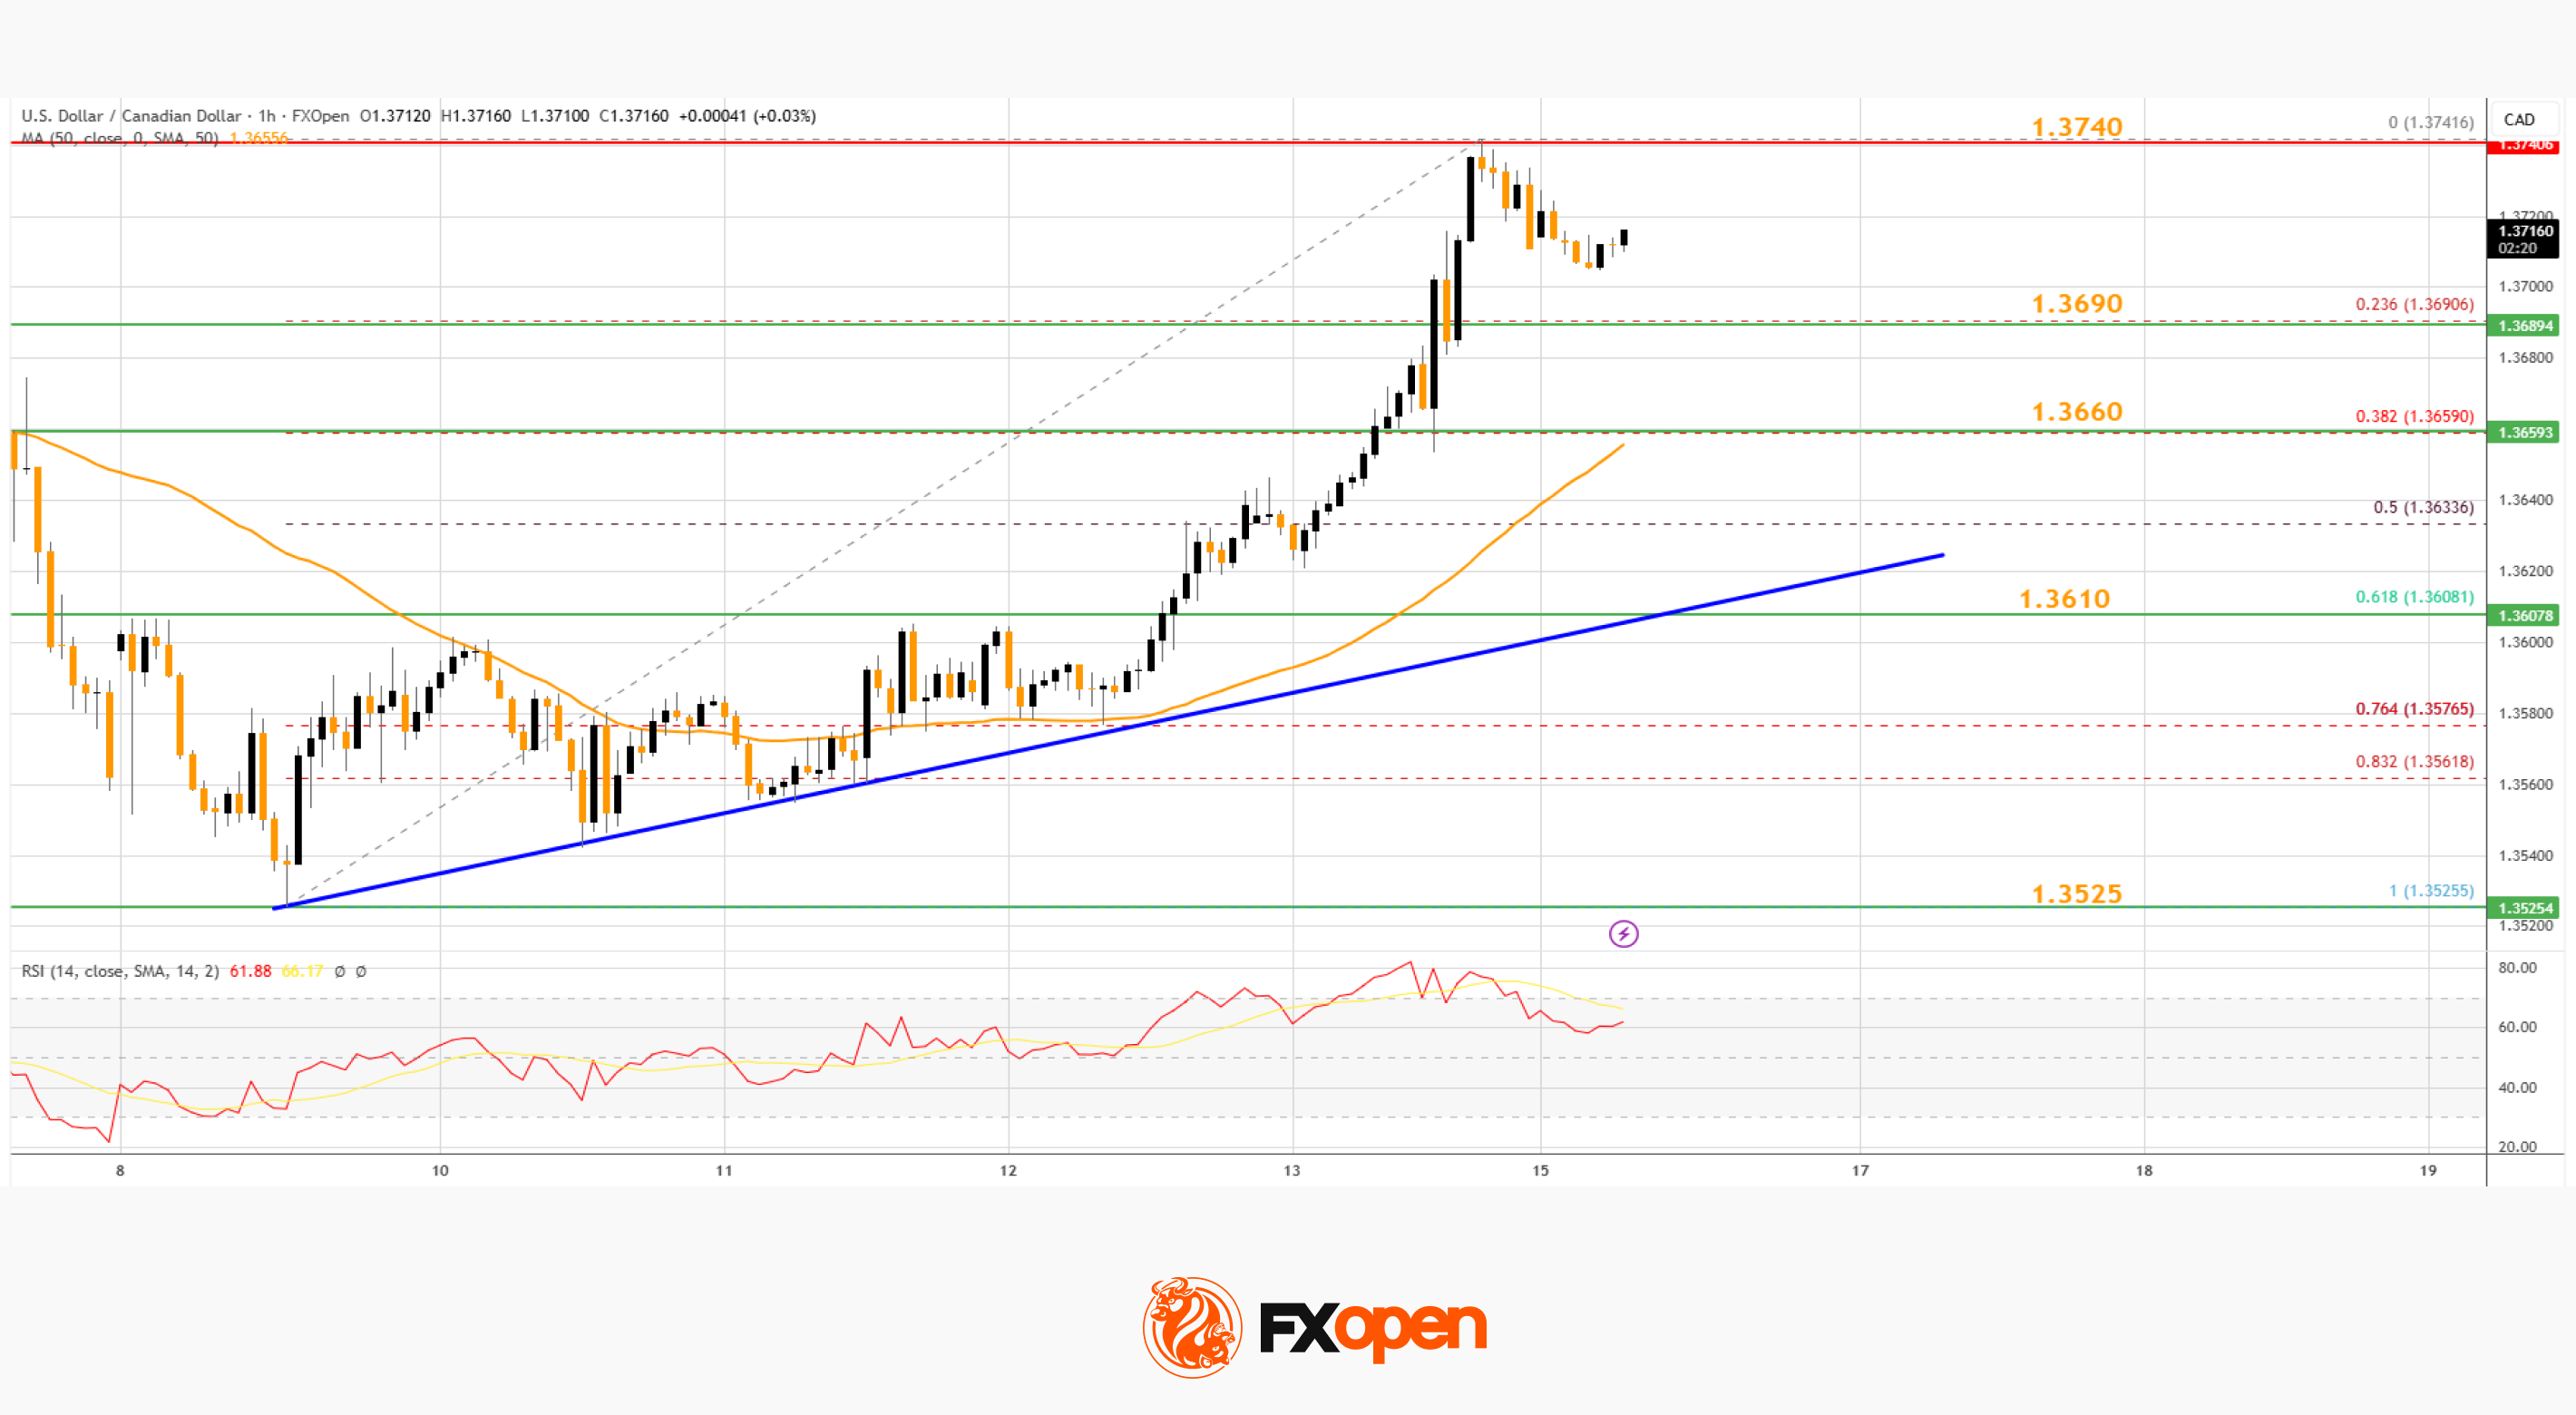
There was a minor pullback, but the pair remained stable above 1.3700 and the 23.6% Fib retracement level of the upward move from the 1.3525 swing low to the 1.3741 high.
The first key support is near the 50-hour simple moving average at 1.3660 and the 50% Fib retracement. The main breakdown zone seems to be forming near a key bullish trend line at 1.3610 on the same USD/CAD chart.
A downside break below the 1.3610 could push the pair further lower. The next key area of interest might be 1.3525, below which the pair might visit 1.3440.
If there is another increase, the pair might face hurdles near 1.3740. A clear upside break above 1.3740 could start another steady increase. In the stated case, the pair could test 1.3780. A close above 1.3780 might send the pair toward 1.3850. Any more gains could open the doors for a test of 1.4000.
Trade over 50 forex markets 24 hours a day with FXOpen. Take advantage of low commissions, deep liquidity, and spreads from 0.0 pips (additional fees may apply). Open your FXOpen account now or learn more about trading forex with FXOpen.
This article represents the opinion of the Companies operating under the FXOpen brand only. It is not to be construed as an offer, solicitation, or recommendation with respect to products and services provided by the Companies operating under the FXOpen brand, nor is it to be considered financial advice.

Ariana Grande & Swarovski Have a Fairy-Tale Moment

The BEST and WORST Cars for Financial Mutants (And Which Brands They Avoid)
We’re not asking for sympathy, but we do want to be listened to

Smart energy pays enters the US market, targeting scalable financial infrastructure

Why Israel is blocking foreign journalists from entering

Bitcoin: We’re Entering The Most Dangerous Phase
The BEST and WORST Cars for Financial Mutants (And Which Brands They Avoid)

How the Iran War Will Cause a Global Financial Crisis (Yanis Varoufakis) | The Chris Hedges Report

How to Build a Reusable Finance Workflow in Claude 2.0 (Full Tutorial)
-
 Crypto World4 days ago
HYPE Token Enters Net Deflation as HyperCore Buybacks Outpace Staking Rewards
-

 Fashion5 days ago
Weekend Open Thread: Addict Lip Glow
-

 Tech3 days ago
Your Legally Registered ‘Motorcycle’ Might Not Count Under Proposed US Law
-
Sports4 days ago
Why Duke and Michigan Are Dead Even Entering Selection Sunday
-

 Sports7 days ago
PWHL, Senators discussing plan to keep Charge in Ottawa
-

 NewsBeat7 days ago
Residents reaction as Shildon murder probe enters second day
-

 Business3 days ago
Search for Savannah Guthrie’s Mother Enters Seventh Week with No Arrests
-

 Business4 days ago
US Airports Launch Donation Drives for Unpaid TSA Workers as Partial Government Shutdown Enters Fifth Week
-
 Tech18 hours ago
Are Split Spacebars the Next Big Gaming Keyboard Trend?
-
Crypto World4 days ago
Coinbase and Bybit in Investment Talks: Could Bybit Finally Enter the US Crypto Market?
-

 NewsBeat7 days ago
I Entered The Manosphere. Nothing Could Prepare Me For What I Found.
-

 Business4 days ago
Country star Brantley Gilbert enters growing non-alcoholic beer market
-

 Business2 days ago
Australian shares drop as Iran war enters third week
-

 Crypto World2 days ago
Crypto Lender BlockFills Enters Chapter 11 with Up to $500M in Liabilities
-

 Sports5 days ago
College Basketball Best Bets: Conference Tournament Semifinal Picks
-

 Crypto World6 days ago
Three Binance Charts May Be Hinting at Bitcoin’s Next Move
-

 Politics2 hours ago
The House | The new register to protect children from their abusers shows Parliament at its best
-

 Business6 days ago
Trump demands Powell cut rates as Iran conflict raises energy prices
-

 Crypto World6 days ago
Senate Votes to Include CBDC Ban in Bipartisan Housing Bill
-

 Fashion2 days ago
25 Celebrities with Curly Hair That Are Naturally Beautiful


You must be logged in to post a comment Login