
Crypto World
Ethereum Lending Hits $28 Billion After Aave Proves DeFi’s Crisis Shield in Weekend Crash

Ethereum’s on-chain lending ecosystem has reached a new milestone, with active loans surpassing $28 billion as of January 2026.
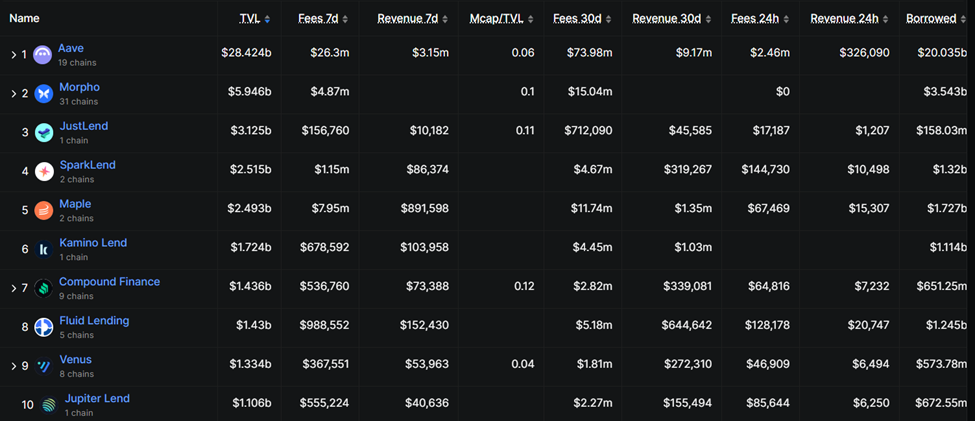
Central to this growth is Aave, the leading Ethereum-based lending protocol, which controls approximately 70% of the network’s active lending market.
Sponsored
Sponsored
Aave’s Automated Liquidations Prevent DeFi Contagion Amid Weekend Crash
Data on Token Terminal shows that the growth in active loans across Ethereum-based lending platforms achieved a tenfold increase from January 2023 lows.
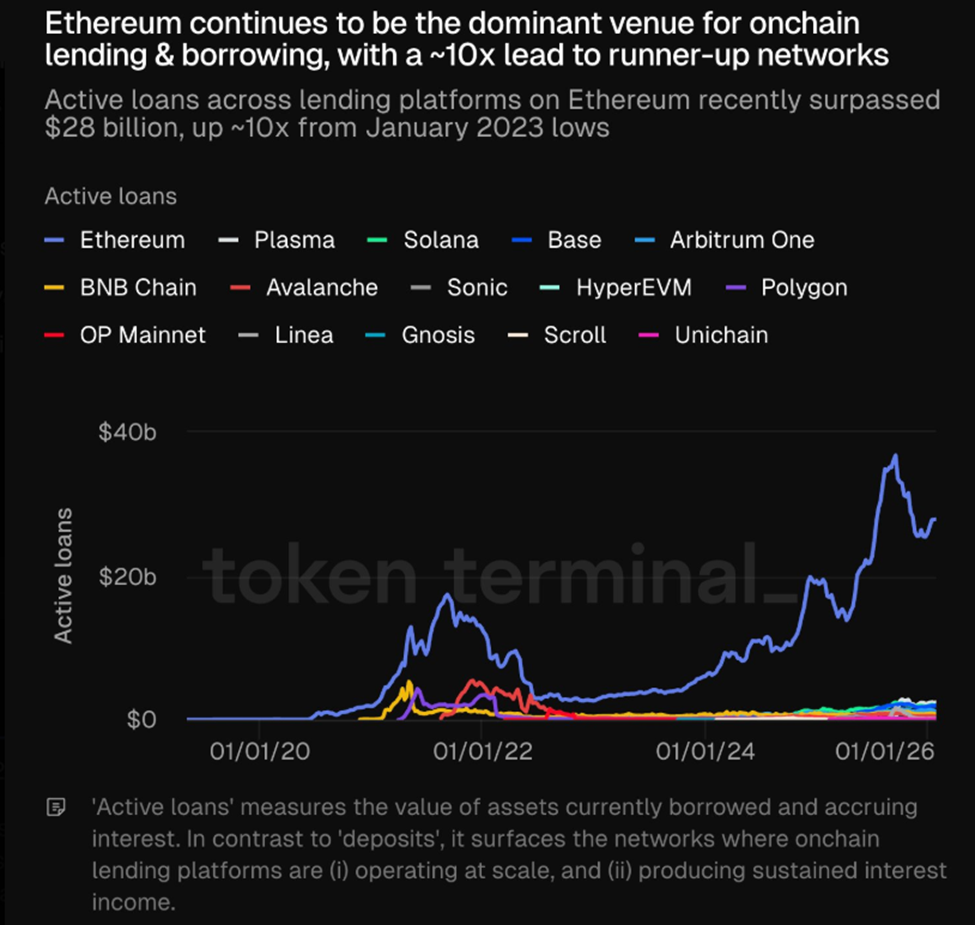
This milestone highlights Ethereum’s continued dominance in DeFi. It gives it a roughly tenfold advantage over competing networks such as Solana and Base.
The surge in lending activity, while a signal of DeFi’s expanding adoption, also raises questions about systemic risk.
In 2022, elevated loan volumes contributed to waves of liquidations that exacerbated broader market downturns. By Q3 2025, crypto lending had reached a record $73.6 billion. This represents a 38.5% quarter-over-quarter increase, and nearly tripling since the start of 2024.
According to Kobeissi analysts, this was driven largely by DeFi protocols benefiting from Bitcoin ETF approvals and a sector-wide recovery.
While leverage in DeFi remains far below that in TradFi sectors—representing just 2.1% of the $3.5 trillion digital asset market, compared to 17% in real estate—its concentration in algorithmic lending platforms like Aave amplifies the potential for rapid, automated liquidations.
Sponsored
Sponsored
Weekend Crash Highlights Aave’s Role as DeFi’s Stabilizer Amid $2.2 Billion Liquidations
The late January 2026 weekend market crash tested this system under extreme stress. Bitcoin dropped sharply from around $84,000 to below $76,000 amid:
- Thin weekend liquidity
- Geopolitical tensions in the Middle East, and
- Pressure from the US government funding uncertainties.
Over $2.2 billion in leveraged positions were liquidated across centralized and decentralized exchanges in just 24 hours.
Aave’s infrastructure played a crucial stabilizing role. The protocol processed over $140 million in automated collateral liquidations across multiple networks on January 31, 2026.
Sponsored
Sponsored
Despite high Ethereum gas fees spiking above 400 gwei, which temporarily created “zombie positions” where undercollateralized loans hovered near liquidation thresholds but could not be profitably cleared immediately, Aave handled the surge without downtime or bad debt.
Aave’s performance prevented what could have been a far more severe contagion across DeFi. Had the protocol failed, undercollateralized positions could have accumulated into bad debt. Such an outcome would trigger cascading liquidations and potential panic across the ecosystem.
Other protocols, including Compound, Morpho, and Spark, absorbed smaller liquidation volumes. However, they lacked the scale or automation to fully replace Aave.
Even large ETH holders, like Trend Research, who deleveraged by selling hundreds of millions of dollars in ETH to repay Aave loans, relied on the protocol’s efficiency to mitigate further market stress.
Sponsored
The weekend crash highlights both the opportunities and vulnerabilities inherent in Ethereum’s lending ecosystem.
While active loans and leverage are rising, Aave’s resilience signals that DeFi’s infrastructure is maturing.
The protocol’s ability to absorb large-scale liquidations without systemic failures highlights Ethereum-based lending as a stabilizing force in volatile markets. It reinforces its “flight-to-quality” reputation among both institutional and retail participants.
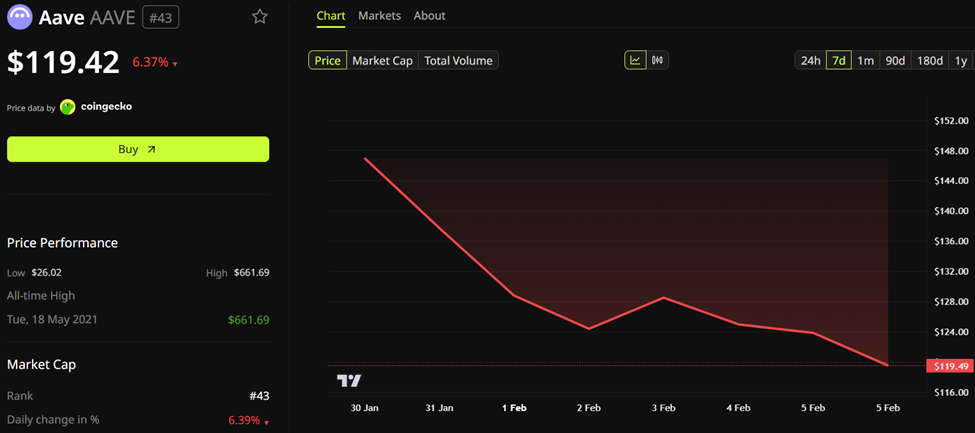
Despite this bullish outlook, the AAVE token is down by over 6% in the last 24 hours, and was trading for $119.42 as of this writing.


The global crypto market fell sharply on Thursday as new geopolitical and macroeconomic concerns threw cold water on investor appetite for risk assets.
Summary
- Crypto markets dropped sharply as escalating Middle East tensions and hotter U.S. PPI data weakened investor appetite, pushing Bitcoin down nearly 5% to around $70,600.
- Global markets declined alongside crypto, with stocks and precious metals falling while oil surged to record highs amid disruptions at key energy supply routes.
- Over $480 million in long positions were liquidated across crypto markets, amplifying downside pressure as rate cut expectations diminished following Powell’s remarks.
Bitcoin (BTC), the bellwether asset, dropped nearly 5% to $70,600 on Thursday, down from the $74,000 levels seen the previous day. Ethereum (ETH) fell 6% to $2,187, while XRP (XRP), BNB (BNB), Solana (SOL), and Dogecoin (DOGE) experienced losses ranging between 3% and 6%.
Zcash (ZEC), Worldcoin (WLD), and LayerZero (ZRO) bore some of the steepest losses amid the market-wide drop that brought the total crypto market capitalization down to $2.51 trillion.
Crypto prices fell sharply shortly after Israel launched an unprecedented cyber and drone attack on Iran’s largest gas facility, South Pars. According to reports, the massive complex powers nearly 70% of the nation’s domestic gas supply, the loss of which has threatened the country’s power grid.
The strike comes amid an escalating energy war between the U.S., Israel, and Iran, which has led to a blockade at the Strait of Hormuz, a key waterway for global oil transit, and sent crude oil and gas prices soaring to record highs. Iran had earlier vowed to push oil prices to as high as $200.
The latest attack has not only shaken the crypto market but has rippled across traditional finance as well. Notably, Gold has dropped 2.1% over the day, casting investors’ doubts over its safe haven status, while Silver fell 3.5%. Together, these precious metals erased nearly $150 billion from the market.
Traditional stock indices across the globe have also fallen in tandem with risk assets. Notably, Asian benchmarks like Japan’s Nikkei 225 and the Hang Seng have fallen over 2%. Even U.S. indices like the Dow Jones Industrial Average, Nasdaq 100, S&P 500, and Russell 2000 Index have all sharply fallen across the board.
However, oil prices took a different path, rising to new levels. Notably, Brent Crude has jumped 3% to a new record high of $112 on Thursday as traders price in a prolonged disruption in a region that remains a major source of global energy production.
Typically, when gold and cryptocurrency prices crash together, it means traders are fleeing to cash rather than rotating between alternative assets.
Hotter U.S. PPI data and Fed announcement deliver a double blow to bulls
Fears of sticky inflation also played a major role in the crypto market drop today. On Wednesday, the U.S. revealed that the PPI data came in much hotter than expected, with a record monthly gain in a year for wholesale costs. This came as the market was already cautious ahead of the Federal Reserve rate decision that was scheduled for later in the day.
In his speech, Fed Chair Jerome Powell echoed concerns surrounding elevated inflation levels. Powell clarified that the Federal Reserve is prepared to hold interest rates steady as it sticks to a data-driven strategy to combat rising inflation stemming from the oil shock. As such, market hopes for rate cuts this year have fallen slim.
The resulting crash from potential delays in rate cuts and the surging oil price as a result of Middle East tensions together triggered a liquidation cascade across leveraged crypto markets.
Data from CoinGlass shows that over $481 million in long positions were liquidated in the past 24 hours, with Bitcoin and Ethereum accounting for the majority of it, with $143 million and $127 million in long liquidations, respectively.
Long liquidations occur when investors bet on a price increase, and the asset price drops enough to hit their margin limits, forcing the exchange to automatically close their trades.
Disclosure: This article does not represent investment advice. The content and materials featured on this page are for educational purposes only.

TLDR:
- The PBOC added 30,000 ounces in February, pushing official gold reserves to a record 2,309 tonnes worth $387.6 billion.
- Analysts estimate China’s true gold holdings could be two to ten times its official figure due to undeclared accumulation channels.
- The Shanghai Gold Exchange processed 126 tonnes in physical withdrawals in January, with settled gold permanently leaving auditable systems.
- Gold now represents 10% of China’s foreign exchange reserves, a share that has doubled over the past twenty months amid global tension.
China gold reserves have reached a record 2,309 tonnes, valued at approximately $387.6 billion. The People’s Bank of China added 30,000 ounces in February, marking its 16th consecutive month of gold accumulation.
Analysts at Societe Generale, Goldman Sachs, and the World Gold Council estimate that undeclared holdings could be two to ten times the official figure.
Gold now makes up roughly 10 percent of China’s foreign exchange reserves, a share that has doubled in twenty months.
Multi-Channel System Keeps Chinese Gold Flows Out of Sight
The Shanghai Gold Exchange operates under mandatory physical settlement rules. Buyers receive bullion from one of 58 certified vaults spread across 56 Chinese cities.
Once gold exits a certified vault, it cannot re-enter the system. That rule renders the metal permanently invisible to outside auditors and flow-tracking mechanisms.
The SGE processed 126 tonnes of physical withdrawals in January alone. Hong Kong acts as the primary import gateway for routing bullion to the mainland.
London, Switzerland, and Dubai supply 400-ounce bars through over-the-counter channels that never surface in exchange records.
Russia settles bilateral gold deals in yuan, placing those flows outside both PBOC reserves and published trade statistics.
Analyst @shanaka86 described the operation plainly in a post this week. “This is not a central bank buying gold,” the post read. “This is a state operating a multi-channel physical accumulation system designed from the ground up for opacity.”
JUST IN: While the world watches missiles hit gas fields, China is buying gold. Quietly. Relentlessly. For the 16th consecutive month.
The PBOC added 30,000 ounces in February. Official reserves now stand at 2,309 tonnes, a record, valued at approximately $387.6 billion. Gold… pic.twitter.com/qihmdZQ9YS
— Shanaka Anslem Perera
(@shanaka86) March 19, 2026
The comment pointed to how far beyond conventional reserve management this activity extends.
These channels work together to keep the true total hidden from outside observers. China is also drawing commercial crude reserves at one million barrels per day and has suspended nitrogen and potassium fertiliser exports.
Each action appears aimed at building domestic supply buffers while reducing competitor access to key resources.
Gold’s Physical Market Diverges From Paper Pricing as Global Pressure Mounts
Gold is trading at $5,000 per ounce, with retail investors putting $70 billion into ETFs while institutions sell.
That split between physical demand and paper market behavior mirrors the pricing gap between Oman crude and WTI.
Both the retail buyer and the Chinese central bank appear to be reading the same underlying signals.
The Hormuz crisis has added fresh pressure across oil, fertiliser, and LNG supply chains. Physical chokepoints are repricing commodities at a pace that monetary policy cannot match. Gold, unlike oil or LNG, requires no strait, pipeline, or political approval to store value.
At its current pace, China could become the world’s largest sovereign gold holder within a decade. The PBOC’s official figure stands at 2,309 tonnes, while the undeclared total remains unknown.
The dollar still holds its position as the world’s reserve currency. Yet China is building a financial buffer that no sanctions regime can freeze.
That buffer has now been growing for sixteen consecutive months. Nitrogen is stuck behind Hormuz, and LNG faces disruption from burning refineries. Gold, meanwhile, continues flowing through every available channel into Chinese vaults.
The post China Gold Reserves Hit Record 2,309 Tonnes as PBOC Marks 16 Straight Months of Buying appeared first on Blockonomi.


Opinion by: Merav Ozair, PhD, blockchain and AI senior advisor.
Elon Musk and Peter Diamandis support the idea that “everything will be free.” They purport to believe that AI abundance will end poverty and provide a universal high income.
Others in the mega tech ecosystem mention the coming abundance. Demis Hassabis, for example, says AI could spark a “renaissance” of “radical abundance.”
Politicians at the World Economic Forum 2026 in Davos liked Musk’s vision. They were thrilled that their economic problems would soon be “set free.” This story is quite appealing. Who doesn’t like to get things for free?
What does it truly mean? Would all economic activities have no cost? Would all corporations become altruistic and seek no profit?
Let us unpack the narrative.
The cost of production can be cheap, but never zero
Let’s put things in perspective. In the age of AI abundance, products and services will not arrive out of “thin air.” They would still need labor, materials, energy and infrastructure.
The advances in AI and other emerging technologies may lead to very cheap energy and highly automated production. This evolution will result in the marginal cost of most digital and even physical goods approaching zero.
This is due to three main factors. First is the automation of labor, where machines and AI handle almost all production, logistics and many services. The second is advanced manufacturing and AI distribution, like 3D printing, robotics and AI logistics systems that drastically reduce waste and inventory, making “enough for everyone” technically feasible. Lastly, abundant energy — fusion or ultra‑cheap solar makes energy so affordable that it stops being the bottleneck.
Because energy underlies everything physical, all other costs fall.
Plans are already in place. Elon Musk is now prioritizing lunar manufacturing and AI, with a goal of over 1,000 gigawatts of solar power. Using solar energy instead of nuclear power will reduce energy cost to almost zero. The catch: the initial cost to establish the infrastructure on the moon is very high, and it would need to overcome major challenges.
Related: Energym AI dystopia goes viral as crypto projects tout user-owned AI agents
Under those conditions, it is plausible that education resources become somewhat free to the user because they are AI‑generated and infinitely replicable once the system is built. A large fraction of healthcare becomes extremely cheap, once the appropriate AI and robot infrastructure exists.
At the level of physics and engineering, if the real bottlenecks — energy and automation — are abundant, costs collapse, but they do not completely disappear.
Infrastructure is the missing layer that no one talks about
Robotics and energy need to run at scale and speed to create an “abundance” of everything for everyone. For this, it needs infrastructure.
Automation and robotics run on what Jensen Haung calls “AI factories.” This is AI infrastructure, representing a shift towards treating AI development as an industrial process, enabling organizations to continuously train and refine AI models for better safety and efficiency.
They are specialized, high-performance computing data centers designed to “manufacture” intelligence by converting raw data into trained AI models and tokens, rather than simply storing data. Using advanced GPUs and massive interconnected infrastructure, they are the engines of AI applications such as autonomous vehicles, robotics and generative AI.
AI factories are expensive. They need a lot of money to build and run. Companies that have already set up the infrastructure will keep growing and improving. For example, Nvidia is five times more profitable than IBM was in the 1980s, with only a tenth of the staff. Productivity and profits will increase, because AI greatly boosts efficiency. Investments will go to those who own AI models, platforms and especially the infrastructure.
This will lead to the biggest concentration of wealth in history.
Major players include tech giants like Nvidia, AWS and SpaceX. They will continue to dominate the market, making it tough for newcomers to compete.
Governments are also involved. China is using its huge solar energy capacity to boost the energy-heavy AI boom. This creates a unique “AI and energy” ecosystem. Here, artificial intelligence optimises renewable energy generation, while solar power supports data centres. China is seen as a leader in renewable energy use.
Cheap energy is not cheap
Energy is the fuel that runs AI factories, which are the engine of all robotics, automation and AI applications that will generate abundance. Energy fuels the infrastructure, and infrastructure runs the AI applications. Therefore, energy is the real bottleneck. Without cheap energy, this “free” theory fails.
Currently, electricity is the primary form of energy used to run the infrastructure. China is aggressively integrating renewable energy into its infrastructure and other regions are expanding renewable-powered energy into data centers as well. Electricity generation and grid capacity for AI-scale infrastructure is very costly and not scalable. To reach abundance at scale, energy must be very cheap and scalable.
What are the options?
Fission energy is a type of or nuclear energy. It is fully mature, providing stable power, but produces radioactive waste. It carries the risk of nuclear proliferation, and safety concerns regarding meltdowns. It is cheaper than current fossil-based electricity sources but still has a tangible cost, and, like the other electricity sources it is limited, and not scalable.
Fusion energy involves merging light atoms to create energy, mimicking the sun, while traditional nuclear energy splits heavy atoms. Fusion offers nearly limitless, cleaner energy without long-lived high-level waste.
Fusion is inherently safer with no risk of a runaway chain reaction.
The caveat, however, is that fission is what’s currently being used. Creating nuclear fusion for energy is extraordinarily expensive and requires upfront investments of hundreds of billions of dollars, and it is still experimental and likely decades away from large-scale commercial use.
Unlike nuclear fission, nuclear fusion is scalable. It is cheap but not does not cost zero. Someone has to pay the upfront costs to build the infrastructure, to create it and then maintain it.
Elon Musk is going to the moon
Lunar solar power provides ample energy without atmospheric issues. Yet, it has high costs for launching, building and maintaining in a vacuum. Musk’s plan is to move all production, including the AI factory, to the moon.
The moon has low gravity and plenty of resources, making it the cheapest place for AI infrastructure.
Robots will terraform and build infrastructure. Humans will come to oversee and expand, while AI data centres will fuel the space economy.
With Starlink, SpaceX, Optimus robots and xAI, Musk is in a strong position to make this happen.
However, machines for making advanced AI chips need to reach the moon. These bus-sized machines require very precise conditions.
The solution is a new method called Atomically Precise Manufacturing (APM). This builds atom by atom and aligns with Musk’s “first principle” thinking.
If successful, this could unlock unlimited solar energy and raw materials from the moon and asteroids. There would be no thermal limits or atmospheric interference.
This could lead to boundless AI at a low cost. Experts say that if lunar fabrication works, it could create a trillion-dollar, or even hundreds of trillions, opportunity.
Who will benefit most from this hundred-trillion-dollar chance? Will it be shared fairly?
The soft prison of “free”
When you have centralized infrastructures and systems, whoever owns the infrastructure sets the terms of engagement. Strongly centralized systems can provide extensive “free” services, but in exchange, they often demand high control over speech, movement, data and economic choices. Non‑authoritarian welfare states may trade some individual autonomy for security and guaranteed services. Many “free” digital services today are funded by surveillance, profiling and behavioral manipulation — your data and attention are the real price.
In a world of AI abundance, the infrastructure may be government owned. It may be owned by corporations. It could be owned through a public-private partnership. Either way, the infrastructure is centralized and the centralized power will dictate the distribution terms — how AI abundance is distributed, who gets what, under what conditions. If they wish to, they can abruptly “shut the valve” and nothing is distributed either to an individual or a group. Your dependency on their services becomes a “soft prison” stripped of your autonomy and self-sovereignty.
It might be a hundred-trillion-dollar opportunity, but the owner of the centralized infrastructure will get the lion’s share and will dictate what will trickle down to the masses.
They say if something is “free”, you are the product. This remains true in a world of sheer abundance. In that world, the product is your self-sovereignty.
Opinion by: Merav Ozair, PhD, blockchain and AI senior advisor.
This opinion article presents the author’s expert view, and it may not reflect the views of Cointelegraph.com. This content has undergone editorial review to ensure clarity and relevance. Cointelegraph remains committed to transparent reporting and upholding the highest standards of journalism. Readers are encouraged to conduct their own research before taking any actions related to the company.
Key Takeaways
- Bitcoin plummeted beneath the $70,000 threshold following the Federal Reserve’s decision to maintain current interest rates with minimal 2026 rate cut expectations.
- Federal Reserve policymakers elevated their 2026 inflation projection to 2.7%, attributing the increase to escalating petroleum prices linked to Middle Eastern tensions.
- Petroleum prices skyrocketed beyond $110 per barrel following Iranian strikes on regional energy infrastructure.
- Veteran Bitcoin investors liquidated more than 1,650 BTC, totaling approximately $117 million in value.
- Widespread declines affected cryptocurrency, equity, and precious metal markets, with the Nasdaq falling 1.5% and Ethereum declining over 6%.
Bitcoin (BTC) experienced a notable downturn this week, dropping beneath $70,000 following the Federal Reserve’s announcement to maintain current interest rate levels while indicating a slower pace of future rate reductions than market participants anticipated.
The central bank maintained its policy rate within the 3.5%–3.75% corridor. However, the primary source of anxiety for market participants stemmed from Federal Reserve Chairman Jerome Powell’s commentary during the subsequent press briefing.
Powell highlighted escalating petroleum costs as an emerging inflationary threat. “The oil shock for sure shows up,” he stated, acknowledging its influence on the Federal Reserve’s economic projections.
The Federal Reserve elevated its 2026 inflation outlook to 2.7%, surpassing its previous projection of 2.4%. This upward revision alarmed market participants who anticipated continued disinflation.
The central bank’s forward-guidance framework, commonly referenced as the “dot plot,” now indicates a median expectation of a single rate reduction in 2026. Just one month earlier, financial markets had priced in two to three rate decreases.
Prediction markets on Polymarket and CME Fed funds futures contracts responded immediately. The likelihood of only one rate cut this year surged to approximately 80%, compared to a mere 38% probability a month earlier.
Petroleum Market Volatility Intensifies Pressure
Oil prices had already been climbing before the Federal Reserve’s policy announcement. Crude oil prices jumped above $110 per barrel after Iran launched attacks on energy infrastructure throughout the Middle East, in retaliation for strikes on its South Pars natural gas complex.
Elevated petroleum prices drove bond yields higher and bolstered the U.S. dollar, factors that typically create headwinds for risk-sensitive assets such as Bitcoin.
The Bank of Japan similarly maintained its policy rate on Thursday and identified the Middle Eastern conflict as a potential threat to Japan’s inflation trajectory.
Bitcoin had been exchanging hands above $74,000 earlier in the week, momentarily approaching $76,000. By Thursday morning, it had declined to approximately $70,817, representing roughly a 4.2% decrease over the previous 24-hour period.
Ethereum dropped more than 6%, while XRP, Solana, and Dogecoin all registered declines ranging from 3% to 5%. The CoinDesk 20 Index decreased 3%.
Veteran Bitcoin Holders Liquidate Over $117 Million
On-chain analytics monitored by Lookonchain revealed that a minimum of two long-term Bitcoin investors sold during the market decline.
One early adopter who had previously liquidated an 11,000 BTC position sold an additional 650 BTC. A second veteran holder with a 5,000 BTC allocation liquidated their entire 1,000 BTC recent position.
Collectively, these two investors sold over 1,650 BTC valued at more than $117 million.
Cryptocurrency-related equity securities also experienced significant declines. Strategy (MSTR) and Bitmine (BMNR) decreased 5%–6%. Galaxy (GLXY) fell nearly 7%, while Gemini (GEMI) plunged 15%, reaching its lowest valuation since its public market debut.
Gold similarly extended its losses, declining 3.1% to below $4,850 per ounce — representing its weakest pricing in more than a month.
Powell rejected analogies to 1970s stagflation, emphasizing that unemployment remains near normal historical levels and inflation exceeds the target by only a modest margin. Financial markets are now incorporating expectations for a more restrictive monetary policy environment throughout the remainder of 2026.
The post Bitcoin (BTC) Tumbles Under $70K Following Hawkish Federal Reserve Stance appeared first on Blockonomi.
Crypto World
Bitcoin price drops to $70k as hot PPI data and Powell speech cast doubts over rate cuts
Bitcoin price erased all of its gains from this week as it crashed to a critical support level amid hotter-than-expected PPI data and Jerome Powell’s Federal Reserve speech that cast a shadow over any interest rate cuts for this year.
Summary
- Bitcoin fell over 5% to test the $70,000 support after hotter-than-expected U.S. PPI data and Powell’s hawkish remarks weakened rate cut expectations.
- Broader crypto markets declined, with total market cap dropping 3.8% to $2.51 trillion, while $455 million in liquidations amplified downside pressure.
- Technical indicators signal a potential rebound, but a breakdown below $70,000 could expose Bitcoin to further losses toward $65,000 and $60,000.
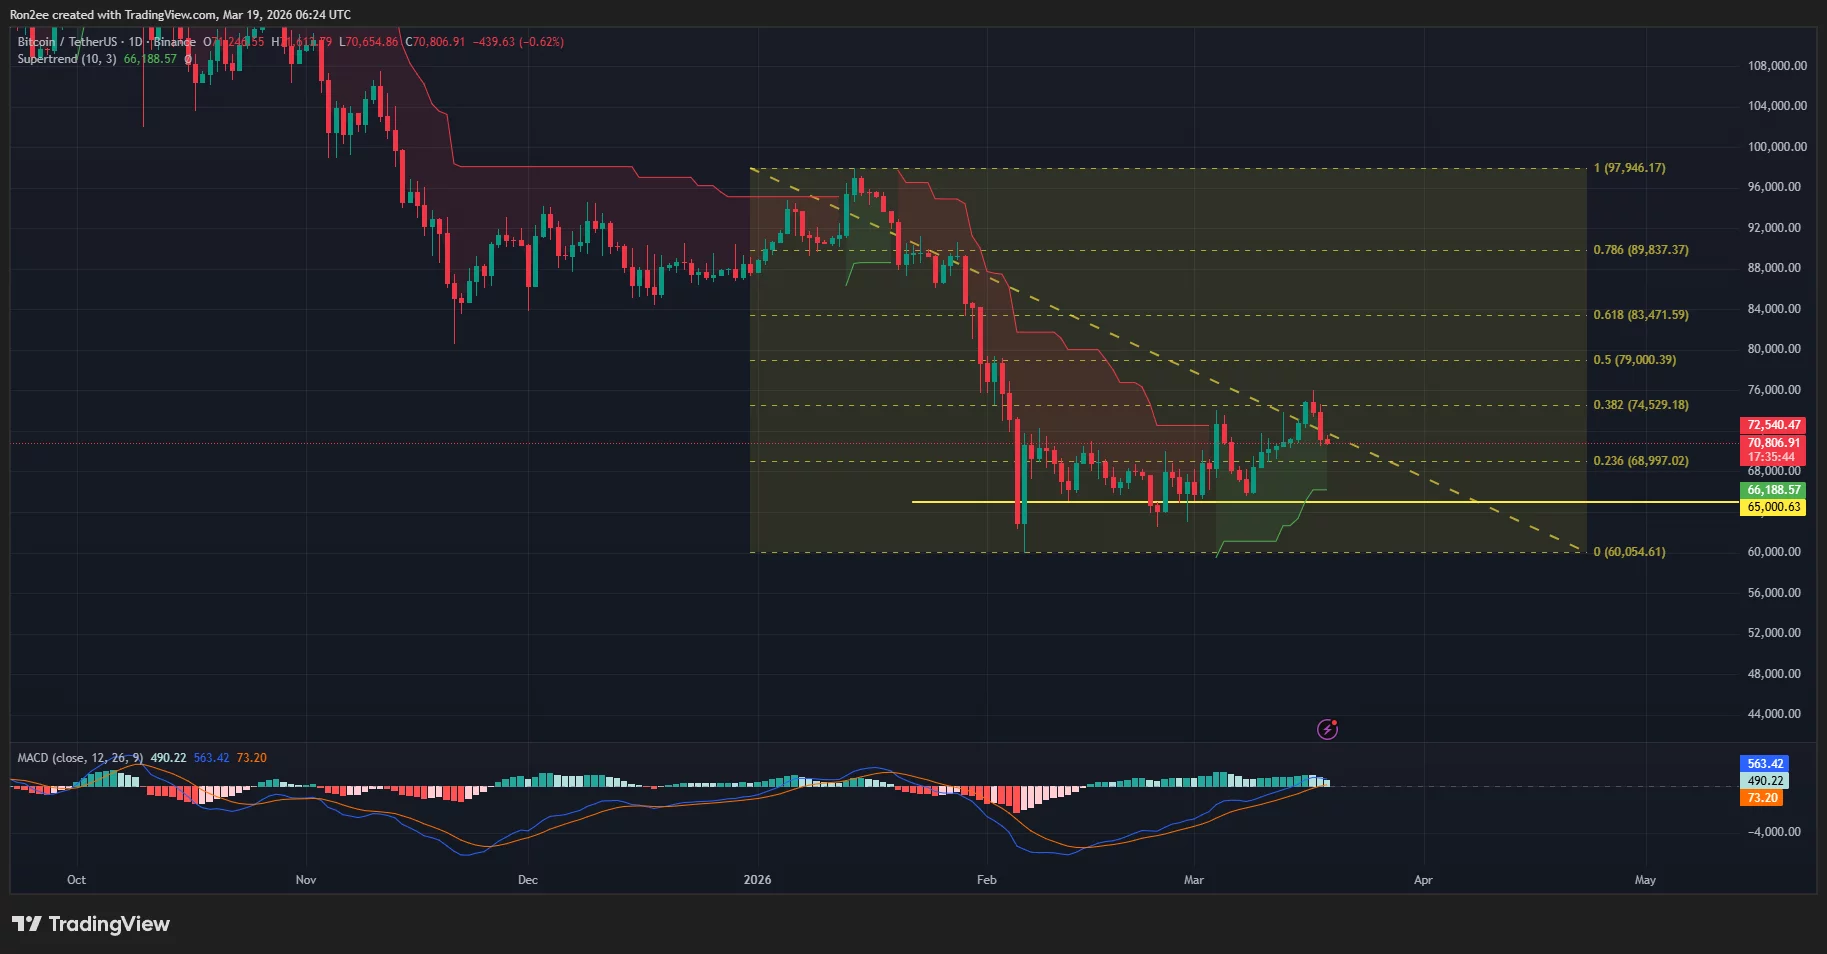
According to data from crypto.news, Bitcoin (BTC) price fell over 5% from its Wednesday high of $74,700 to an intraday low of around $70,660 on Thursday, March 19. The leading cryptocurrency was hovering at $70,879, down 27% from its year-to-date high of $97,538.
The global crypto market tanked alongside Bitcoin to $2.51 trillion, down 3.8% over the day, as major crypto assets such as Ethereum (ETH), XRP (XRP), Solana (SOL), and Dogecoin (DOGE) mirrored Bitcoin’s move.
Bitcoin price fell as fresh macroeconomic concerns lowered risk appetite among investors. This followed after the U.S. PPI data came in hotter than expected for February, with core PPI rising to 3.9% while headline PPI surged to 3.4%, beating market estimates of 3.0%.
A hotter reading typically signals that wholesale inflation is not cooling as fast as hoped, which could lead to higher consumer prices.
The inflation data hit sentiment harder as investors were already cautious ahead of Powell’s speech scheduled for later that day. Odds of a rate cut fell sharply, with markets pricing in a near certainty of a pause ahead of the FOMC meeting.
The Federal Reserve speech struck another blow to the market as Powell reiterated that the Fed would continue to hold interest rates steady while maintaining a strictly data-dependent approach. He attributed this to rising energy prices resulting from Middle East tensions, which have kept inflation elevated, with headline PCE around 2.8% and core inflation near 3.0%, both remaining above the Fed’s 2% target.
While the market had already expected a pause, the recent back-to-back hawkish signals rattled investors who pulled back in fear of further delays in monetary easing.
Meanwhile, the sharp drop in Bitcoin’s price triggered a liquidation cascade across leveraged markets as long positions were caught off guard. Data from CoinGlass shows that the total crypto market faced $455 million in liquidations, with $382 million liquidated from long positions. Bitcoin alone accounted for over $150 million of the total wipeout.
Bitcoin price fell close to the $70,000 support, a level analysts have identified as a key psychological and technical floor.

Several positive signals from technical indicators seem to point to a potential rebound that could be underway. Notably, the Supertrend indicator has flashed green. When this metric shows a green signal, it means the overall trend has shifted from bearish to bullish, often acting as a buy signal for momentum traders.
At the same time, the MACD, which measures the relationship between two moving averages of a security’s price, also pointed upwards, suggesting that the downward pressure is exhausting and a bullish crossover may be imminent.
For now, the immediate resistance to keep an eye on lies at $72,540, the upper boundary of the Supertrend. A break above it could push Bitcoin price to above $74,500, a level that aligns with the 38.2% Fibonacci retracement level.
On the contrary, if Bitcoin falls below the $70,000 support, a revisit to $65,000 and subsequently to $60,000 becomes a distinct possibility as the next major liquidity zones.
Disclosure: This article does not represent investment advice. The content and materials featured on this page are for educational purposes only.


A Coinbase user’s attempt to block an IRS summons for his financial records was blocked by a California court.
Summary
- A California court dismissed a Coinbase user’s attempt to block an IRS summons, citing failure to meet required notification rules within the 90 day deadline.
- The petition challenged the summons on privacy and scope grounds, even though the user had already amended his tax return and paid additional dues.
According to information from PACER, Roger Metz filed a petition in the Northern District of California in May last year to quash an IRS summons that sought his financial records in connection with an audit of his 2022 tax return.
Metz’s case was based on the argument that the summons violated his privacy rights and was overbroad. Metz’s lawyers had also argued that he had identified the error himself and had filed an amended return and paid the additional tax, but that did not prevent the IRS action.
However, US District Judge Araceli Martínez-Olguín ruled against the petitioner on Wednesday after finding that he failed to notify all required government parties within the 90-day window. The judge has dismissed the case on procedural grounds.
The ruling is based on federal civil procedure rules, where defendants must be formally notified of lawsuits to ensure they receive notice and the opportunity to respond. Court documents suggest Metz had served the US Attorney’s Office for the Northern District of California and the IRS, but had failed to notify the US Attorney General in Washington. Government lawyers argued this was sufficient grounds for dismissal.
“In his opposition brief, Metz does not offer any explanation for his failure to serve the United States within 90 days after filing his petition, much less that he had good cause,” Judge Martínez-Olguín said in the ruling.
The case has been dismissed without prejudice, as such Metz has the option to file the petition again at a later date.
As previously reported by crypto.news, last year, another Coinbase user, James Harper, accused the IRS of violating his Fourth Amendment rights following a John Doe Summons used to obtain his data from a crypto exchange. The court, however, sided with the IRS and declined to hear his case.
The outcome reinforces the IRS’s authority to obtain user financial records from centralized crypto exchanges.


It’s not all bad news, though, as there was at least one whale that made a big purchase in the past 24 hours.
Bitcoin’s price has nosedived once again in the past 24 hours, dropping below $71,000 for the first time since the weekend.
While the blame has been placed on the US Federal Reserve, certain OG whales have been disposing of large BTC portions, which can also be attributed to the correction.
OGs Selling
Lookonchain reported that an ancient BTC wallet sold another 1,000 units in the past day, worth around $71 million. The entity received 5,000 BTC (worth around $1.66 million at the time) over 12 years ago, but began selling off its assets in November 2024.
The unknown market participant has disposed of 3,500 BTC at an average price of over $96,000. According to the analytics company’s estimations, the whale profited around $442 million, or a 266x return.
A #BitcoinOG with 5K $BTC($356M) sold another 1,000 $BTC($71.57M) 8 hours ago.
This OG received 5K $BTC(cost $1.66M) at $332 12 years ago, and started selling $BTC on Nov 26, 2024, selling a total of 3,500 $BTC($337M) at ~$96,262.
Total profit: $442M — a 266x return.… pic.twitter.com/oErv0KccjN
— Lookonchain (@lookonchain) March 19, 2026
In another post on X, Lookonchain indicated that one more BTC OG wallet, flagged as belonging to Owen Gunden, has sold 650 BTC in the past day as well. This one followed a previous big dump of 11,000 BTC, worth over $1.1 billion at the time.
These substantial market sell-offs coincided with or even preceded bitcoin’s notable price drop in the past 24 hours. The asset traded above $74,000 by yesterday afternoon, when it nosedived to $71,000. Although it bounced at first after the Fed’s decision to maintain the interest rates, it dropped further in the following hours toward $70,000.
You may also like:
One Is Buying
It’s not all doom and gloom on the bitcoin whale scene, though. The analytics resource explained that another such market participant has been buying BTC “every day since Mar 10,” and splashed another $37 million yesterday to acquire over 500 units.
The post noted that the entity has accumulated a total of 2,656 BTC at an average price of just over $72,000 since March 10, worth around $190 million as of press time.
Whale bc1qfs has been buying $BTC every day since Mar 10, and bought another 500.78 $BTC($37.16M) ~30 minutes ago.
Since Mar 10, he has bought a total of 2,656 $BTC($191.43M) at an average price of $72,063.https://t.co/eaqtA9hwE4https://t.co/ZwV8QZ7eh9 pic.twitter.com/gOTfLItqLU
— Lookonchain (@lookonchain) March 18, 2026
Binance Free $600 (CryptoPotato Exclusive): Use this link to register a new account and receive $600 exclusive welcome offer on Binance (full details).
LIMITED OFFER for CryptoPotato readers at Bybit: Use this link to register and open a $500 FREE position on any coin!


- Bitcoin traded to intraday lows of $70,500 amid key macro and geopolitical-related events.
- Veteran trader Peter Brandt has highlighted a potential bearish retest of support.
- The Iran war and inflation concerns tick potential negative catalysts boxes.
Bitcoin price flipped lower to trade below $70,500 as sellers showed fresh strength, with BTC down as cryptocurrencies reacted to US inflation data, the Federal Reserve’s rate decision, and the escalation in the Iran war.
Veteran trader Peter Brandt has shared his outlook for BTC in terms of technical setup, noting that a constructive “horn” remains in play. However, it could also be an “ugly” flag pattern.
BTC price 24-hour performance
Bitcoin is currently trading at approximately $70,850 as of March 19, 2026.
The benchmark digital asset has declined by nearly 4% over the past 24 hours, sliding from highs near $74,800 amid a confluence of negative catalysts.
Notably, the price movement ties directly to global events.
The ongoing Iran-Israel conflict, now in its third week, has escalated with Iran’s missile strikes in the Gulf after Israel eliminated key Iranian figure Ali Larijani.
This has spiked oil prices, fueling inflation fears and contributing to Bitcoin’s risk-off sentiment, as seen in prior dips below $64,000 after initial attacks.
Meanwhile, the US Federal Reserve’s March meeting held interest rates steady, citing inflation and uncertainty over the direction of the war in Iran and its impact on global energy markets.
Fed Chair Jerome Powell emphasized a cautious stance, delaying cuts amid rising inflation risks, which prompted a retreat across risk assets.
Earlier in the day, US inflation data showed the producer price index (PPI) coming in hotter than expected. BTC fell from above $74,000 as traders turned their attention to the further impact of the war.
BTC price forecast: Brandt’s shares potential “ugly” outlook
Peter Brandt, known for his classical charting expertise, highlighted Bitcoin’s potential price setup via a post on the social media platform X.
“The horn is constructive. The flag is ugly. Take your pick,” he cautioned as downside pressure resurfaced.
Comment on Bitcoin
I am well aware that you cryptocultists cannot stand the idea of traders being flexible and not totally dogmatic like you, but Bitcoin is set up for me in two ways.
The horn is constructive
The flag is ugly
Take your pick
Opinions are a dime a dozen $BTC pic.twitter.com/ORFbiI5yo3— Peter Brandt (@PeterLBrandt) March 18, 2026
A look at the chart suggests a “horn” pattern that represents a volatile, widening formation.
In terms of technical setup, this signals a potential breakout momentum if Bitcoin pushes through upper resistance.
Brandt’s chart shows consolidation above macro support, with price poised near the range top. If bulls manage to reclaim $74,000, a move to the $80,000 could materialize.
However, the flag pattern suggests action could turn bearish amid the macro and geopolitical factors.
Bitcoin price on the daily chart indicates rejection at the recent top could be another bearish wedge pattern, ex-fund manager Aksel Kibar notes.
Potentially, bears could target a retest of $68,000. Any further decline may see BTC revisit the $65,000-$60,000 range.

Block Inc., the firm behind payment platforms Square, Cash App and Afterpay, has quietly brought back a small portion of workers it laid off in late February with its transition to rely more on artificial intelligence.
Multiple Block employees posted on LinkedIn this month that they were offered a place to return to the company after initially being part of the 4,000 employees who were fired.
Design engineer Andrew Harvard said on March 3 that he rejoined after being told that his layoff was due to a clerical error. “They offered me the opportunity to return, and I’ve accepted,” he added.
On March 8, technical lead Richard Hesse said he was the only member of his team who wasn’t impacted by the staff cut and that he spent two days convincing management that he needed more staff to continue working on “infrastructure highly critical to our customers.”
“I’m happy to share that they listened to my requests and have decided to re-hire some of those laid off,” he said. “While my teams were not returned to full levels, I’ll have enough to continue on.”

Chane Rennie, creative strategy lead, said on March 12 that he was asked to rejoin the company about a week after being laid off, but did not explain why.
Cointelegraph contacted Block on what staff were rehired, but did not receive an immediate response.
Block CEO Jack Dorsey acknowledged at the time of the layoffs that Block may have made some missteps in its staff cut decisions and had built in flexibility to correct course.
Dorsey said recent advances in AI tools forced Block to restructure its 6,000-strong workforce, adding that AI now “fundamentally changes what it means to build and run a company.”
The Guardian reported that several fired Block employees pushed back against Dorsey’s assertions that AI tools can effectively replace workers at scale.
Related: Nvidia’s Huang: AI will boost jobs as it needs trillions in infrastructure
Some of those laid off said they believed the staff cuts were Dorsey’s way of regaining investor confidence, with Block shares down double digits so far this year.
Block, which offers a range of Bitcoin (BTC) and crypto products with Square and Cash App, currently has 27 job listings on its website.
The only two position types currently listed are manager or account executive, and none of the roles specifically mention the use of AI in the job descriptions.
Meanwhile, the Algorand Foundation, the team behind the Algorand layer-1 blockchain, said it had made the “difficult decision” to reduce its headcount by 25% on Wednesday, blaming the crypto slump and macroeconomic uncertainty.
On Monday, blockchain analytics platform Messari also announced staff cuts as part of its transition to become an AI-first company.
Magazine: Big Questions: Can Bitcoin save you from the dreaded Cantillon Effect?
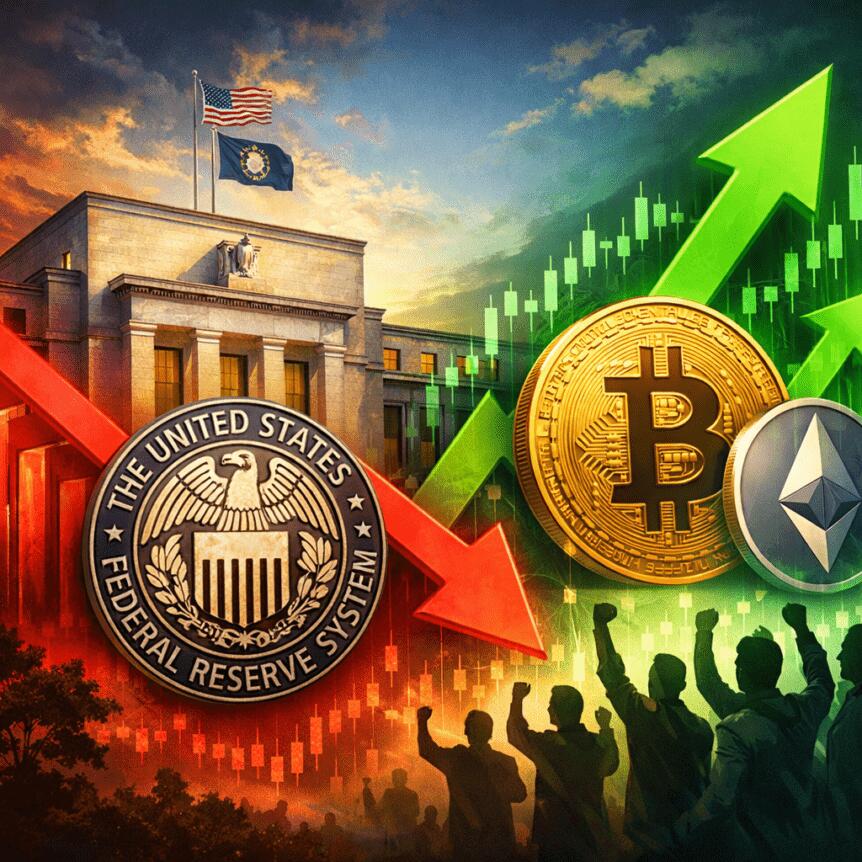
Crypto traders are parsing the Federal Reserve’s decision to hold rates and its implications for a possible market rally. With policy left unchanged, attention shifted to whether the pause can catalyze a relief bounce for Bitcoin and the broader crypto market, or whether the move simply defers the next leg in a cautious macro backdrop.
Santiment, a sentiment-tracking platform, reported a rapid shift in social mood in the wake of the central bank’s decision. Its metrics show the crypto social discussion score jumping from about 9 to 71 in the hours after the Fed’s expected outcome, as traders linked the hold to a potential upside for crypto assets. The firm noted that market participants appeared to focus less on immediate cuts and more on the prospect of later policy pivots that could support risk assets. Santiment said on X.
Bitcoin’s price action reflected a moment of cross-currents. At the time of writing, BTC traded around $70,790, having slipped about 4.35% over the past 24 hours, according to CoinMarketCap. Over the prior 30 days, the benchmark crypto had been modestly higher, up roughly 3.56%. The Fed pause has reinforced a narrative among traders that a relief rally could unfold even without an immediate move on rates, though many remain cautious about how durable any bounce will be in the face of broader macro headwinds.
Key takeaways
- Santiment’s social-sentiment metrics surged after the Fed pause, signaling heightened bullish chatter and a belief in a potential crypto rally ahead of any rate cuts.
- Bitcoin stood near $70,800, with a 24-hour drop of about 4.4% but a 30-day gain around 3.6%, illustrating a choppy near-term path despite the rate hold.
- Historically, Fed policy has been a strong catalyst for crypto optimism, with some observers looking to possible rate cuts in 2025 as a signal for a new Bitcoin bull year.
- Nevertheless, analysts warned that the relief could prove fleeting if macro catalysts do not materialize, and several voices raised concerns about a potential bull trap in the near term.
Fed pause reshapes trader expectations
By keeping the federal funds target rate steady in the 3.5%–3.75% range, the Fed reinforced a wait-and-see posture as markets weigh the path ahead. In crypto circles, the decision has often been treated as a macro backdrop that can lift risk assets if investors anticipate eventual rate relief. Several analysts noted that the absence of a rate cut yet did not erase the possibility of a future pivot; instead, the hold tended to shift the conversation toward timing rather than direction.
Industry observers have long linked monetary policy signals to crypto momentum. The prospect of rate reductions in 2025 remains a potential bullish catalyst for Bitcoin, even as near-term dynamics stay uncertain. The tension between expecting a policy pivot and defending a risk-off stance has created a bifurcated narrative: some participants anticipate a durable rally if the Fed begins cutting ahead of other central banks, while others caution that any move higher could stall without more concrete macro or liquidity support.
Signals vs. price action: market mood in flux
The latest price action sits at a crossroads. Bitcoin’s 24-hour decline underscores the fragility of short-term momentum, even as longer-term momentum metrics show intermittent strength. The Crypto Fear & Greed Index moved back into Extreme Fear territory on Wednesday after a brief return to Fear the day before, highlighting that overall sentiment remains jittery even as social chatter turns more optimistic. This dichotomy—elevated social bullishness alongside continued price weakness—illustrates the complexity of interpreting a Fed-driven impulse in a market that is simultaneously assessing liquidity, macro data, and broader risk appetite.
Analysts remain divided on the durability of any rally. On one hand, on-chain and technical commentary has pointed to a potential multi-month uplift should equities stabilize and macro conditions improve. On the other hand, a number of voices warn that the current up-move could be a “bull trap”—a short-lived ascent that reverses as soon as momentum fades or as real money exits risk assets. Bitcoin brokered a dramatic move in recent sessions, and traders will be watching both macro data releases and central-bank commentary for confirmation of a lasting shift.
Within the broader market context, there are competing signals. The S&P 500 has trended lower, with roughly a 3.7% decline over the past 30 days, according to Google Finance data cited in market briefs. This backdrop suggests investors remain cautious about chasing a near-term crypto rally without supporting upside from risk assets or a clear path to lower policy rates. Still, some voices remain constructive about a more pronounced rally in the medium term, arguing that a capitulation-like washout could open the door to renewed appetite for risk assets as liquidity conditions improve.
Commentary from notable voices in the space reflects this split. On-chain analyst Willy Woo warned that the market could be forming a bull trap, where early bullishness misreads the strength of the uptrend. Meanwhile, traders like Matthew Hyland suggested that a meaningful rally could emerge once broader markets find a bottom and begin to rebound. Hyland pointed to the current macro setup as a prerequisite for a broad crypto upside, aligning with the view that BTC tends to perform when equities recover from downturns.
Within social channels, sentiment remains a volatile gauge. A crypto trader known as Moustache echoed the hopeful sentiment, stating on X that a “massive rally” could unfold in the coming months. Whether that call translates into tangible price action will depend on the confluence of rate expectations, inflation data, and the speed at which liquidity returns to risk markets.
Broader context and what comes next
The Fed’s decision to pause reinforces a broader narrative about policy paths and crypto’s sensitivity to macro signals. If investors interpret the hold as a precursor to rate cuts, Bitcoin and other tokens could benefit from a renewed bid as risk appetite improves and liquidity conditions ease. Conversely, if the hold is read as evidence that the macro environment remains constrained, any rally could be shallow or short-lived, fading as momentum cools and traders reprice risk.
Going forward, market watchers will closely track several signals: upcoming inflation data, the Fed’s own communication on the trajectory of rates, and the pace at which other central banks respond to evolving macro conditions. The next few weeks could reveal whether the relief rally discussed by traders gains traction, or if the narrative shifts back toward caution and consolidation as macro cues darken risk sentiment.
In the meantime, sentiment indicators remain the most volatile barometer. The surge in social sentiment following the Fed decision suggests players are ready to test a higher-risk stance, but price action and macro momentum will ultimately determine whether the rally endures or merely proves transient.
Readers should keep a close watch on the development of rate expectations and the evolution of risk appetite in equities, as these will likely set the pace for crypto’s trajectory in the near term. The next major inflection point will be how quickly market participants price in possible rate cuts and how convincingly the macro data supports a shift from caution to confidence.
What to watch next: a clearer read on whether the Fed’s hold becomes a stepping stone to cuts, and whether Bitcoin can convert social buzz into sustained buying interest rather than a fleeting bounce. The landscape remains uncertain, but the emphasis on policy signals and macro resilience will shape the path forward for crypto markets in the days ahead.

Dow, S&P 500, Nasdaq fall after PPI inflation comes in hot ahead of Fed decision

Race Across the World start date and teams confirmed by BBC

Zalando SE (ZLNDY) Q4 2025 Press Conference Call Transcript


-
 Crypto World5 days ago
HYPE Token Enters Net Deflation as HyperCore Buybacks Outpace Staking Rewards
-

 Tech3 days ago
Your Legally Registered ‘Motorcycle’ Might Not Count Under Proposed US Law
-

 Fashion6 days ago
Weekend Open Thread: Addict Lip Glow
-
 Tech2 days ago
Are Split Spacebars the Next Big Gaming Keyboard Trend?
-
Sports5 days ago
Why Duke and Michigan Are Dead Even Entering Selection Sunday
-

 Business4 days ago
Search for Savannah Guthrie’s Mother Enters Seventh Week with No Arrests
-

 Business5 days ago
US Airports Launch Donation Drives for Unpaid TSA Workers as Partial Government Shutdown Enters Fifth Week
-
Crypto World5 days ago
Coinbase and Bybit in Investment Talks: Could Bybit Finally Enter the US Crypto Market?
-

 Business3 days ago
Australian shares drop as Iran war enters third week
-

 Business5 days ago
Country star Brantley Gilbert enters growing non-alcoholic beer market
-

 Crypto World3 days ago
Crypto Lender BlockFills Enters Chapter 11 with Up to $500M in Liabilities
-

 Sports6 days ago
College Basketball Best Bets: Conference Tournament Semifinal Picks
-

 Politics23 hours ago
The House | The new register to protect children from their abusers shows Parliament at its best
-

 Business6 days ago
Trump demands Powell cut rates as Iran conflict raises energy prices
-

 Fashion3 days ago
25 Celebrities with Curly Hair That Are Naturally Beautiful
-

 News Videos15 hours ago
RBA board divided on rate cut, unusually buoyant share market | Finance Report | ABC NEWS
-

 Crypto World6 days ago
Senate Votes to Include CBDC Ban in Bipartisan Housing Bill
-

 NewsBeat6 days ago
Deane Road crash near Bolton colleges and university
-

 News Videos6 days ago
Tom Lee: The 100x Opportunity EVEN Bigger Than Bitcoin (New Ethereum Prediction 2026)
-

 Crypto World15 hours ago
Canada’s FINTRAC revokes registrations of 23 crypto MSBs in AML crackdown


You must be logged in to post a comment Login