
Crypto World
Ethereum Loss Saturates, but Holder Exodus Caps Price Recovery
Ethereum continues to trade in a narrow range near $2,000. ETH has struggled to generate sustained upside momentum in recent weeks.
While on-chain data suggests selling pressure may be nearing exhaustion, another concern is emerging. A decline in new network participation could restrict fresh capital inflows.
Ethereum Holders Are Realizing Losses
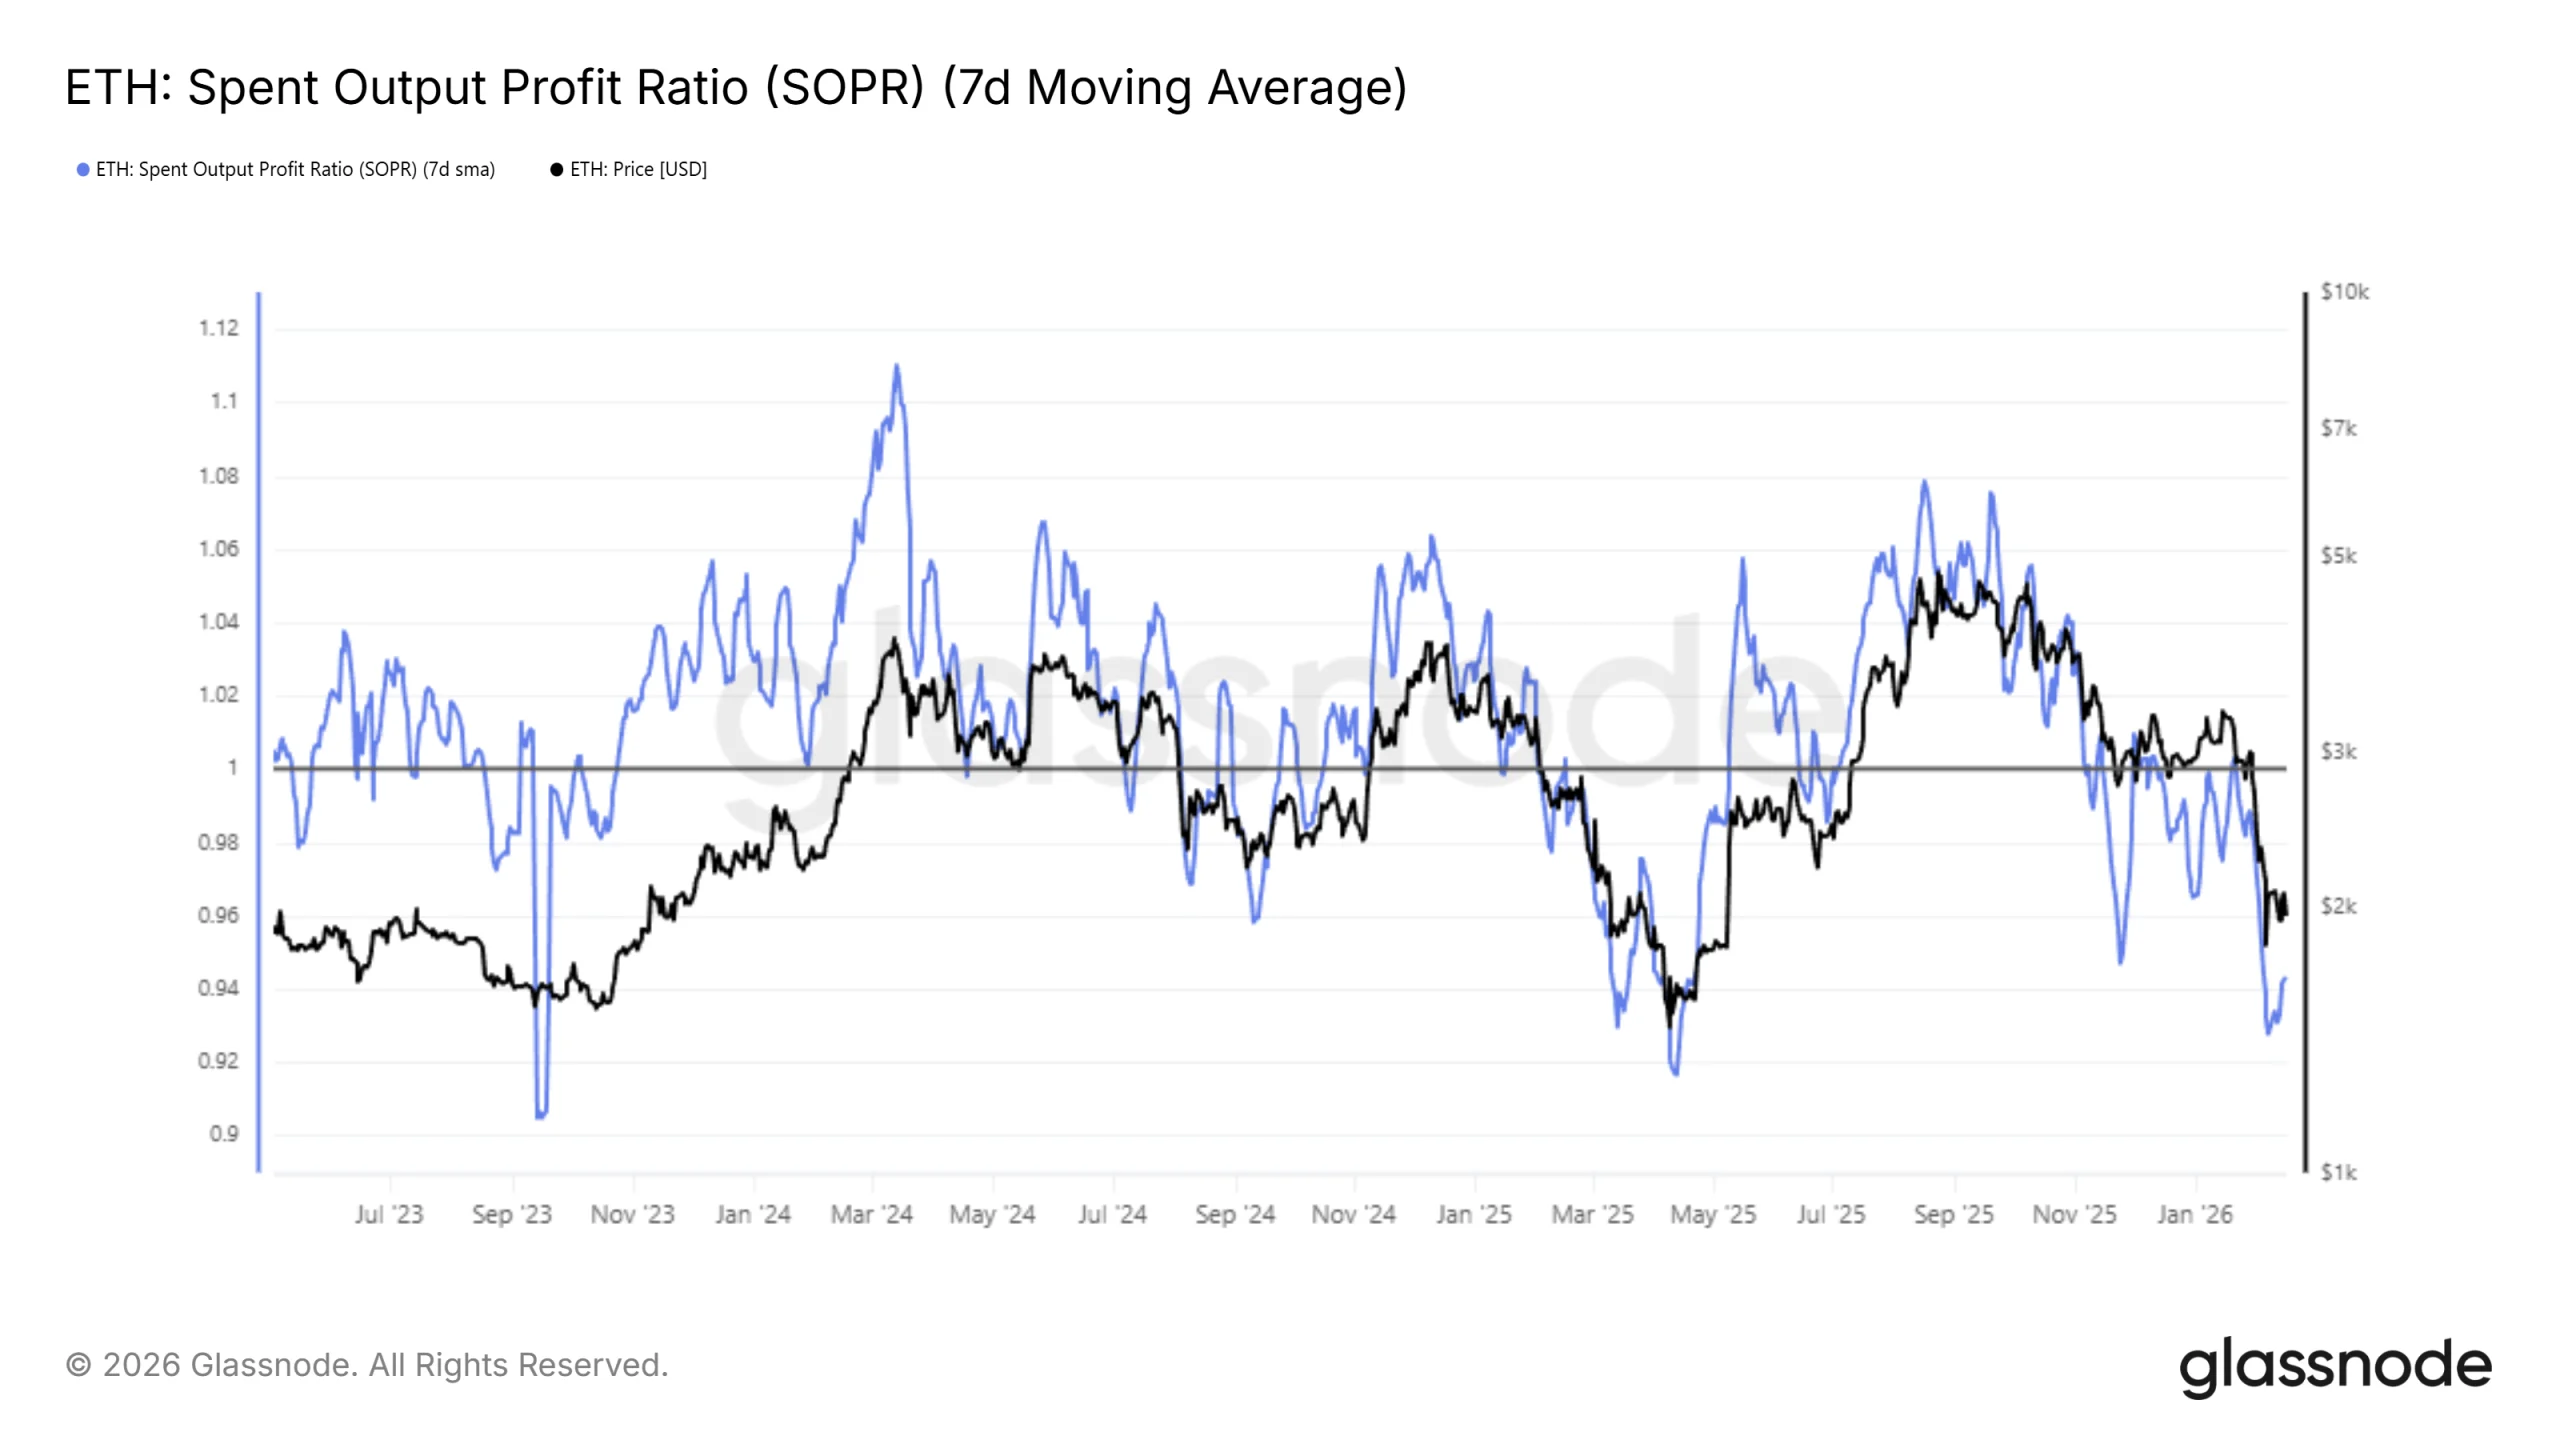
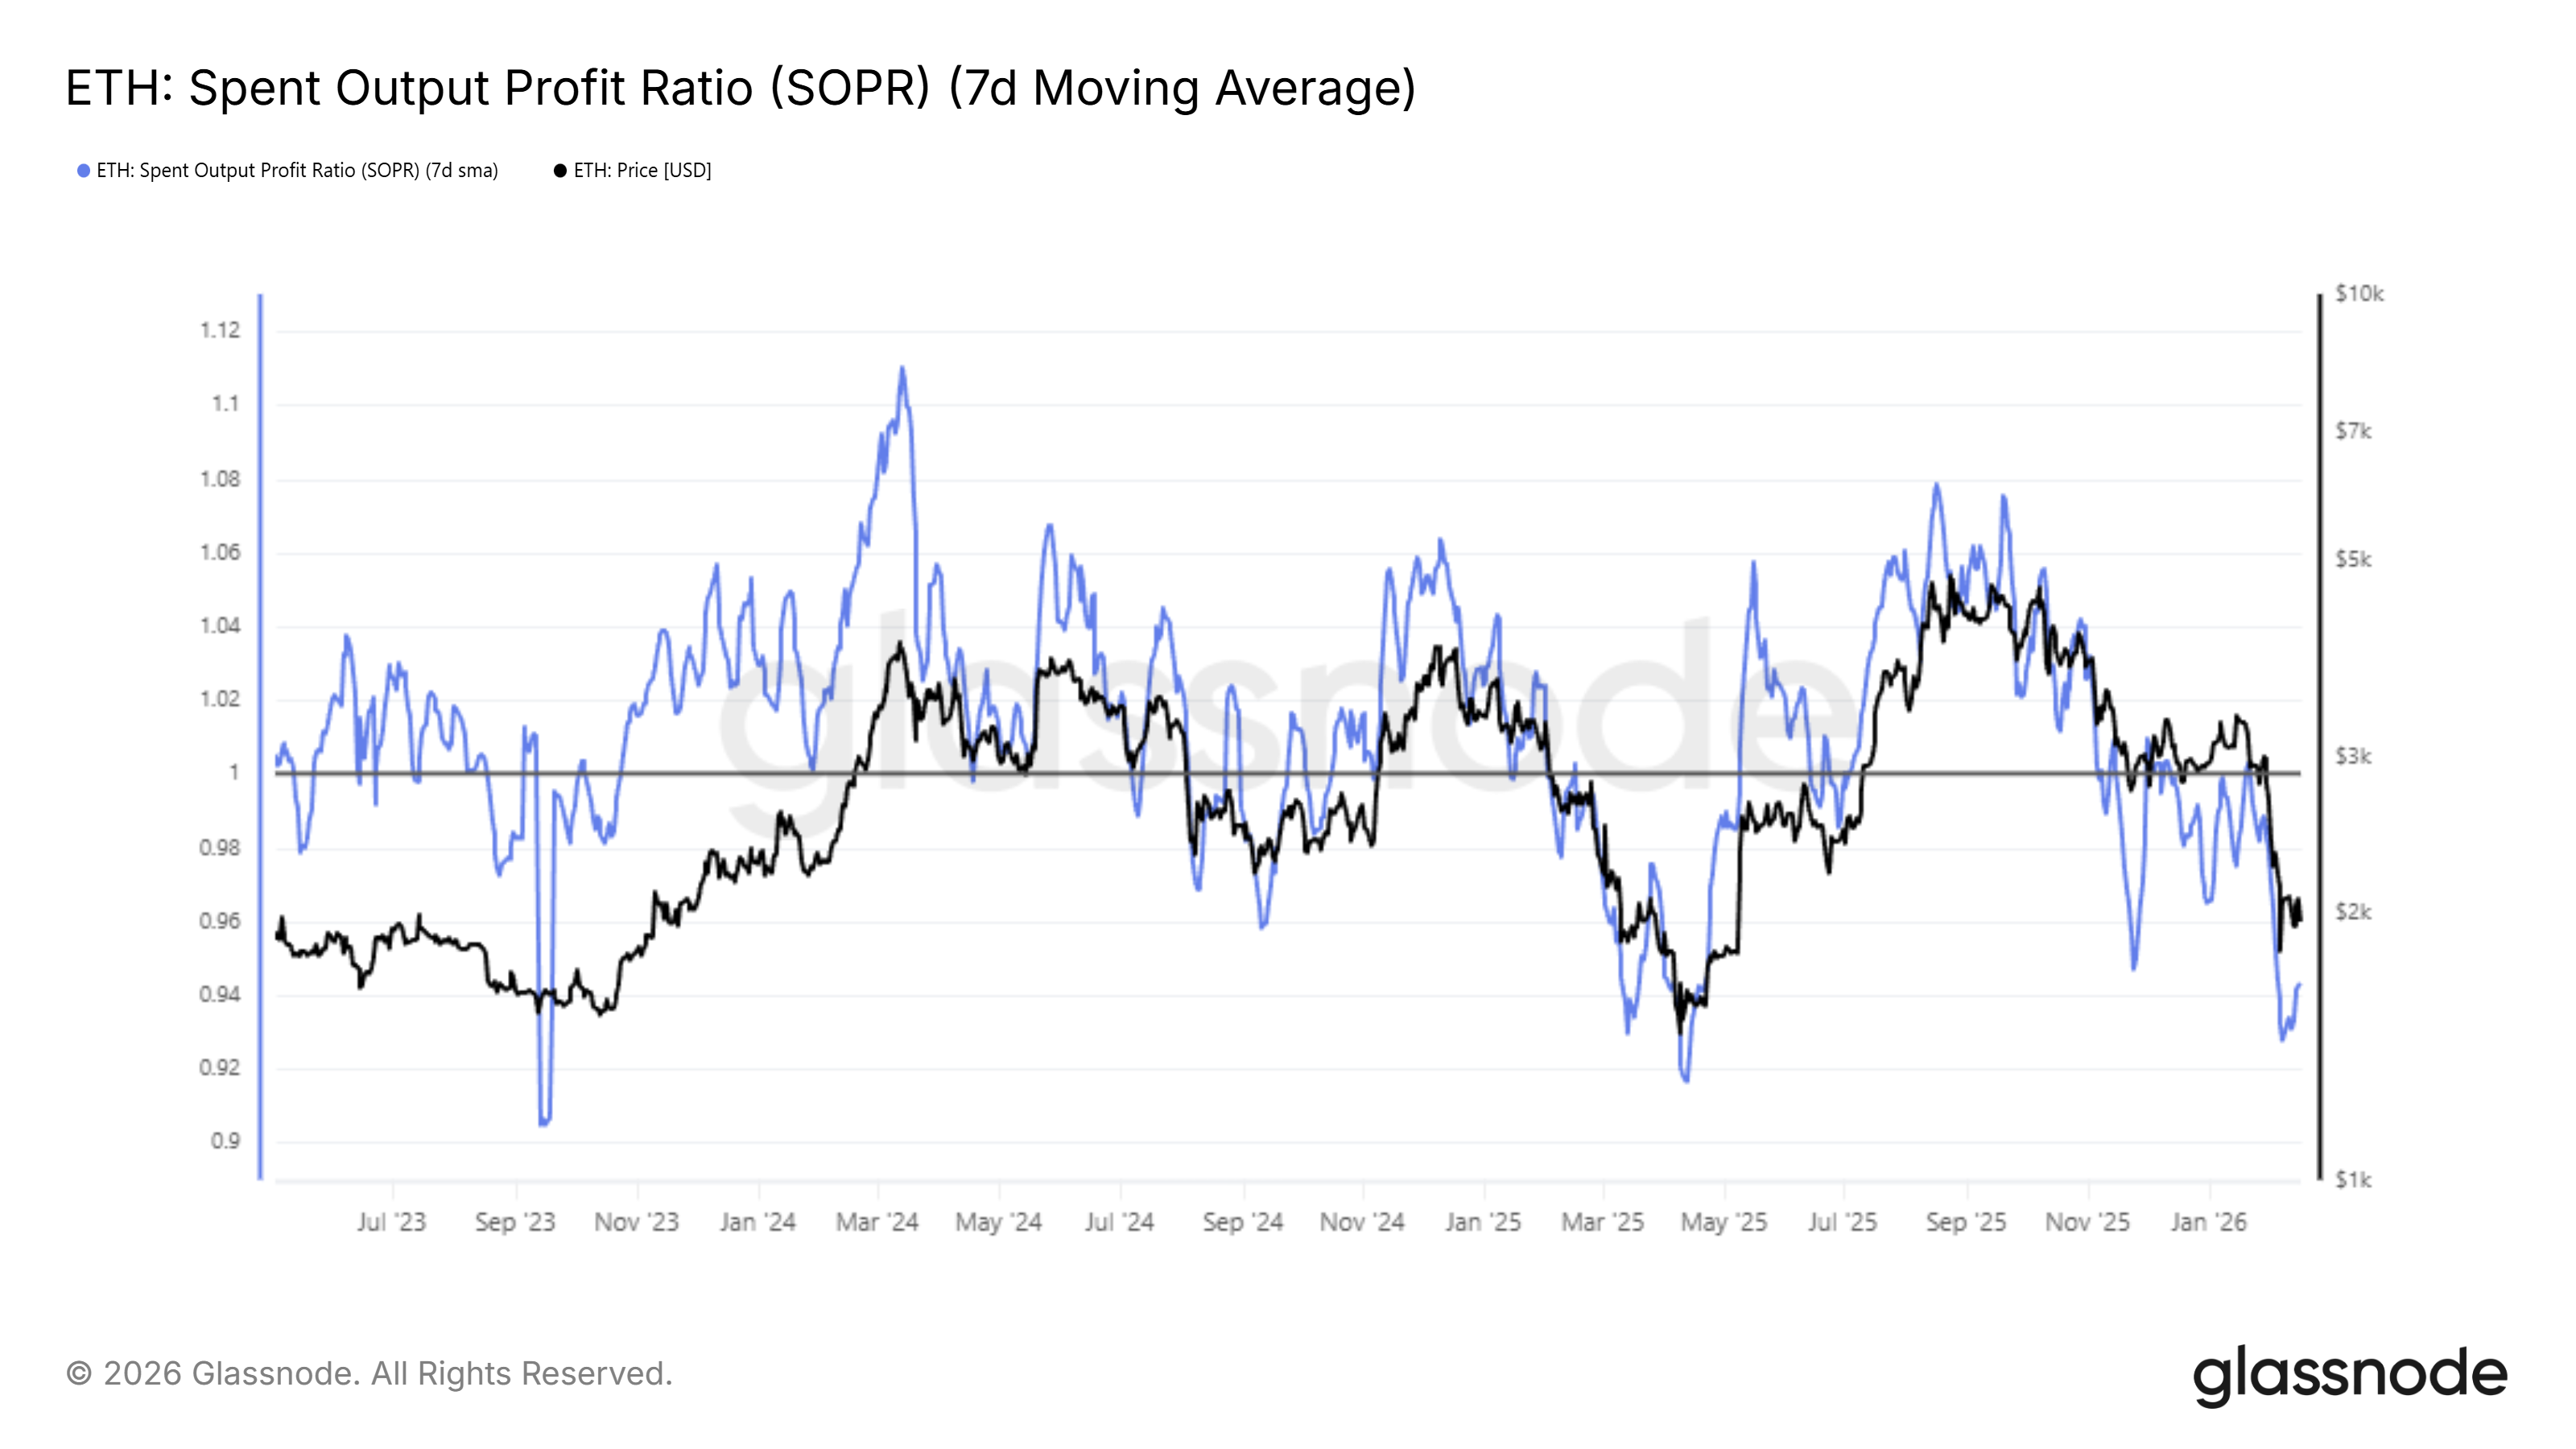
Ethereum’s Spent Output Profit Ratio, or SOPR, recently slid to 0.92. This marks the deepest level since April 2025. A reading below 1 indicates that investors are selling at a loss. Such behavior often reflects panic and fear during prolonged consolidation phases.
Sponsored
Sponsored
Historically, extreme lows in SOPR have preceded reversals. Selling at a loss tends to saturate at these levels. As panic fades, investors often shift to holding rather than exiting positions. Many choose to accumulate at discounted prices. Similar behavior could support ETH stabilization if confidence gradually returns.
Want more token insights like this? Sign up for Editor Harsh Notariya’s Daily Crypto Newsletter here.
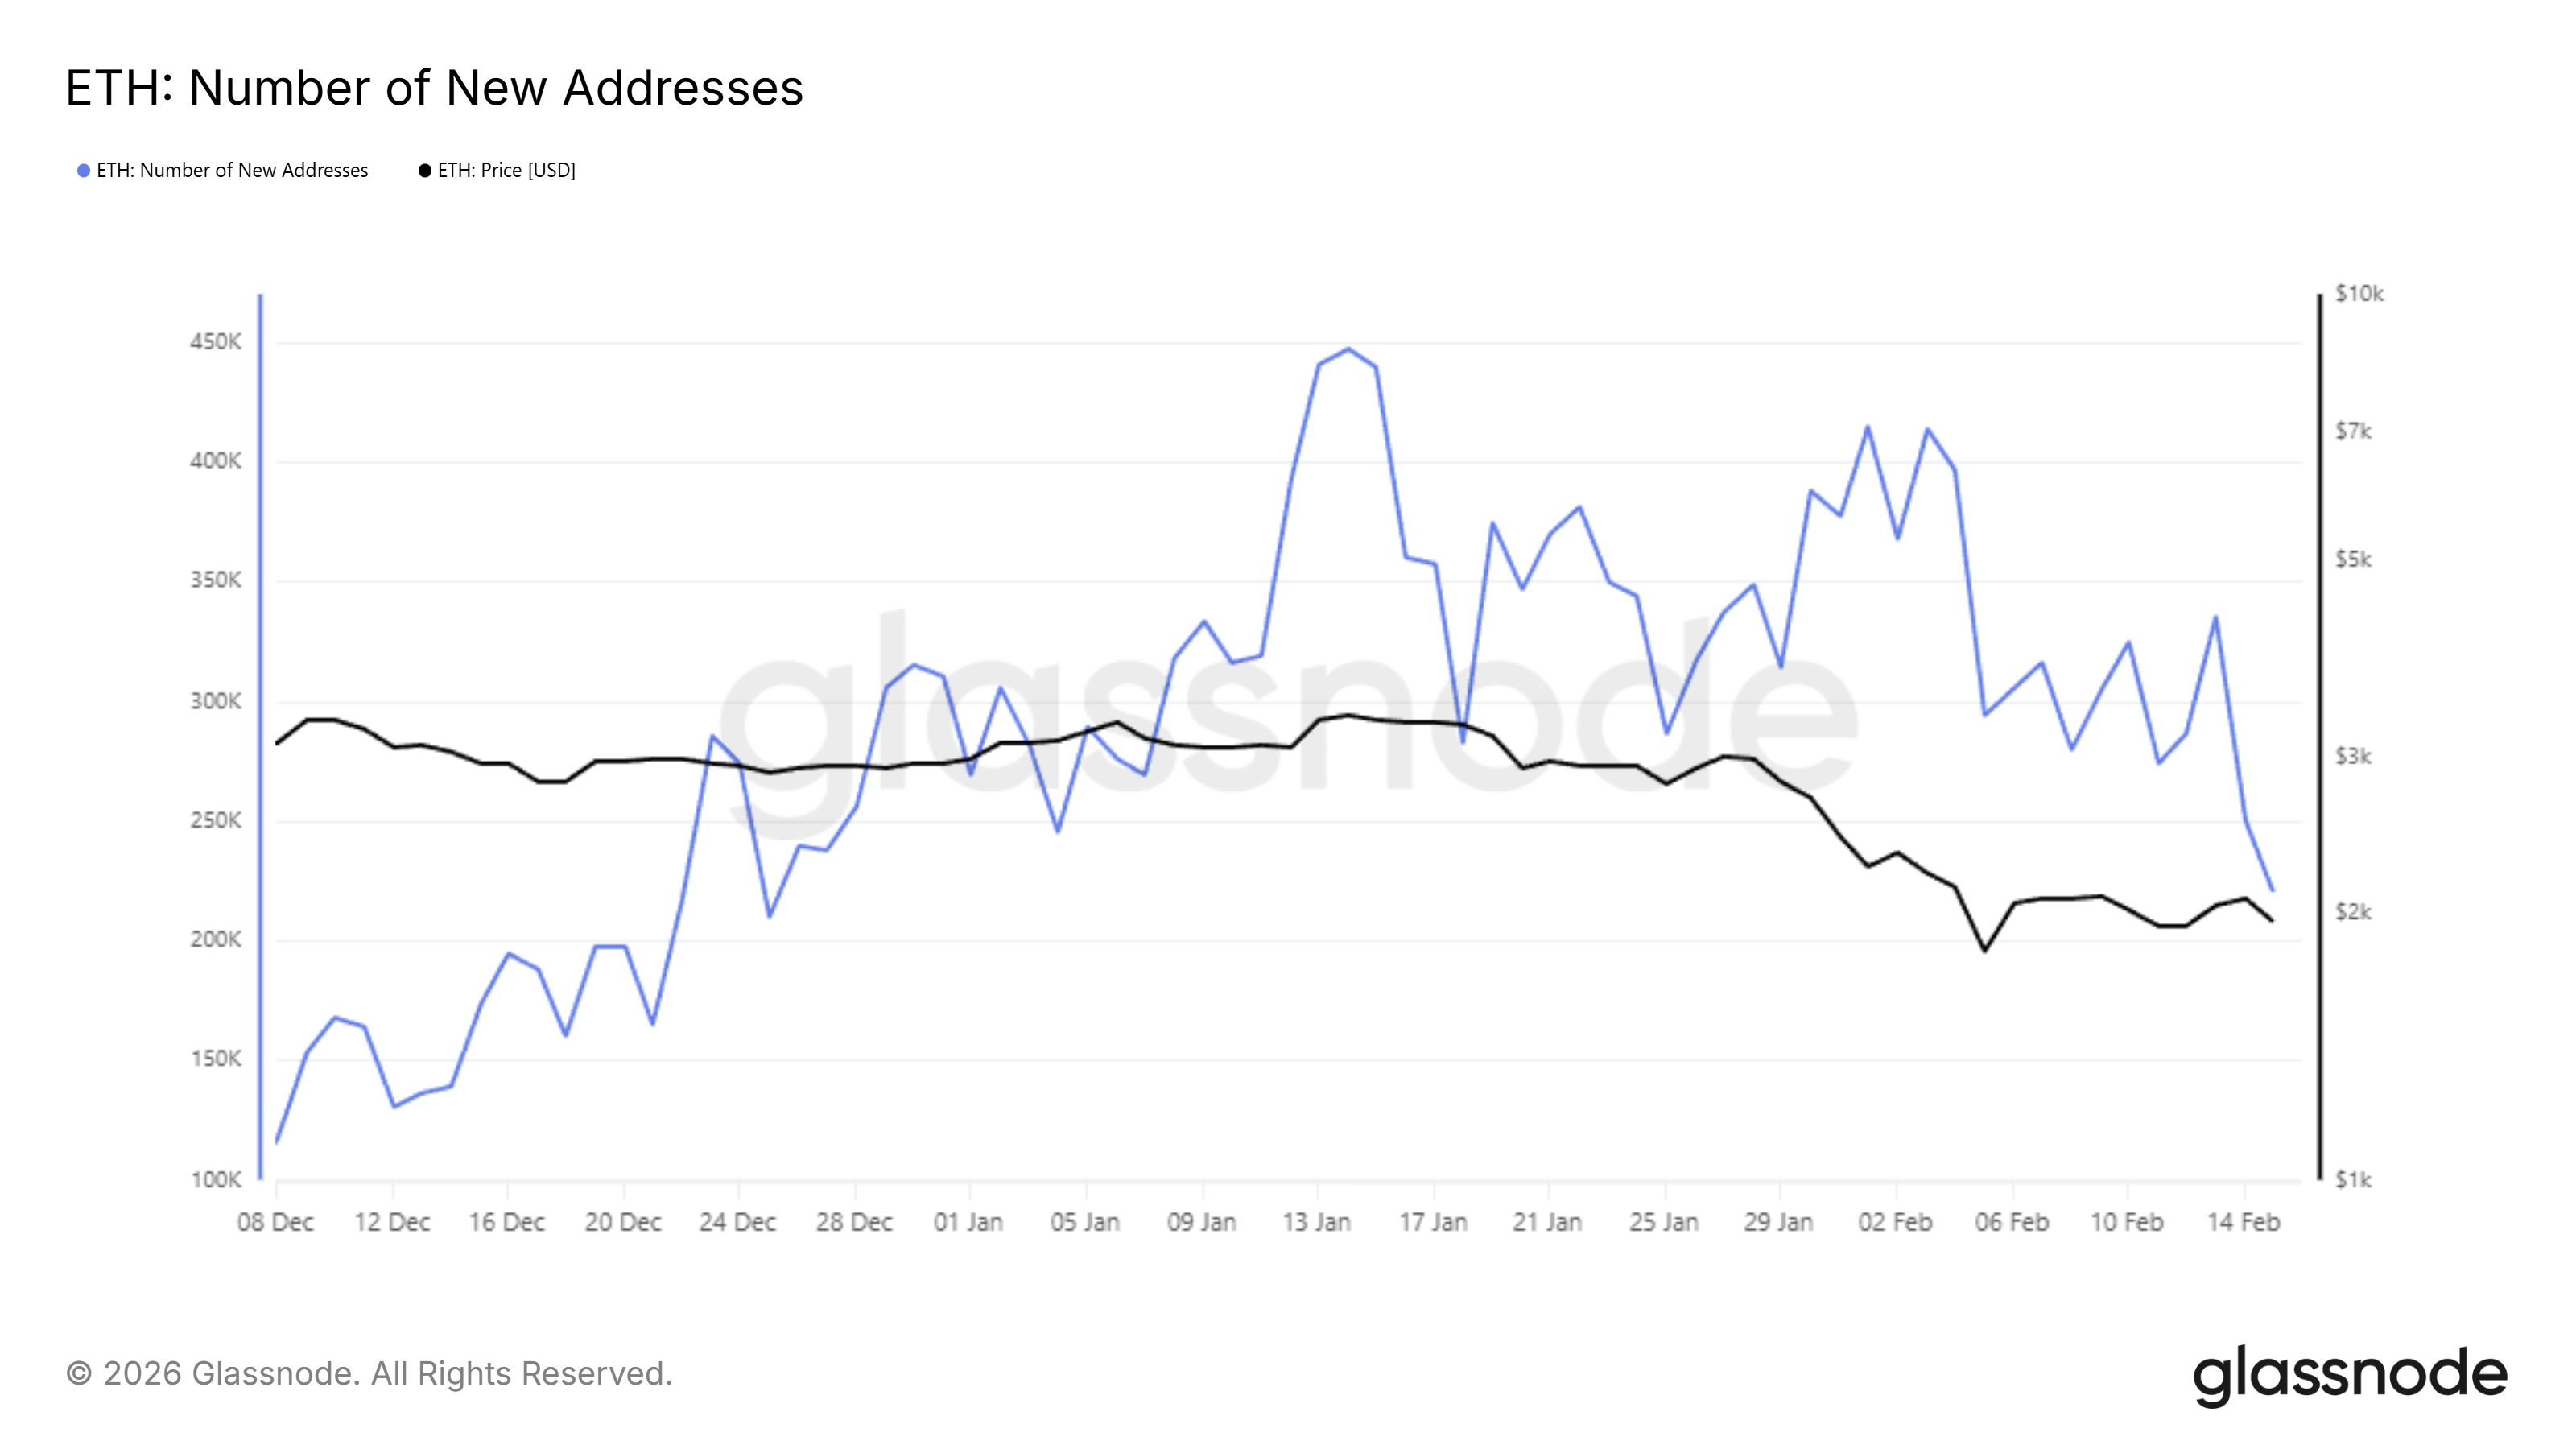
Despite potential loss exhaustion, broader network metrics raise caution. The number of new Ethereum addresses recently fell to an eight-week low. New participants typically inject fresh liquidity and support recovery phases.
Over the past 48 hours, new addresses declined by 34%. The figure dropped from 336,000 to 221,000. This sharp contraction suggests waning retail interest. Reduced onboarding can limit capital inflows, which may constrain short-term Ethereum price appreciation despite improving sentiment among existing holders.
ETH Price Is Stuck At $2,000
Ethereum is trading at $1,970 at the time of writing. The asset remains above the $1,902 support level. However, it continues to struggle below the $2,051 resistance, which aligns with the 23.6% Fibonacci retracement level. Failure to reclaim this zone keeps upside limited.
Current indicators suggest continued consolidation between $1,902 and $2,241. ETH may face repeated rejection near $2,051 until stronger demand emerges. Without confirmation of this level as support, recovery attempts are likely to remain capped, reinforcing range-bound price action.
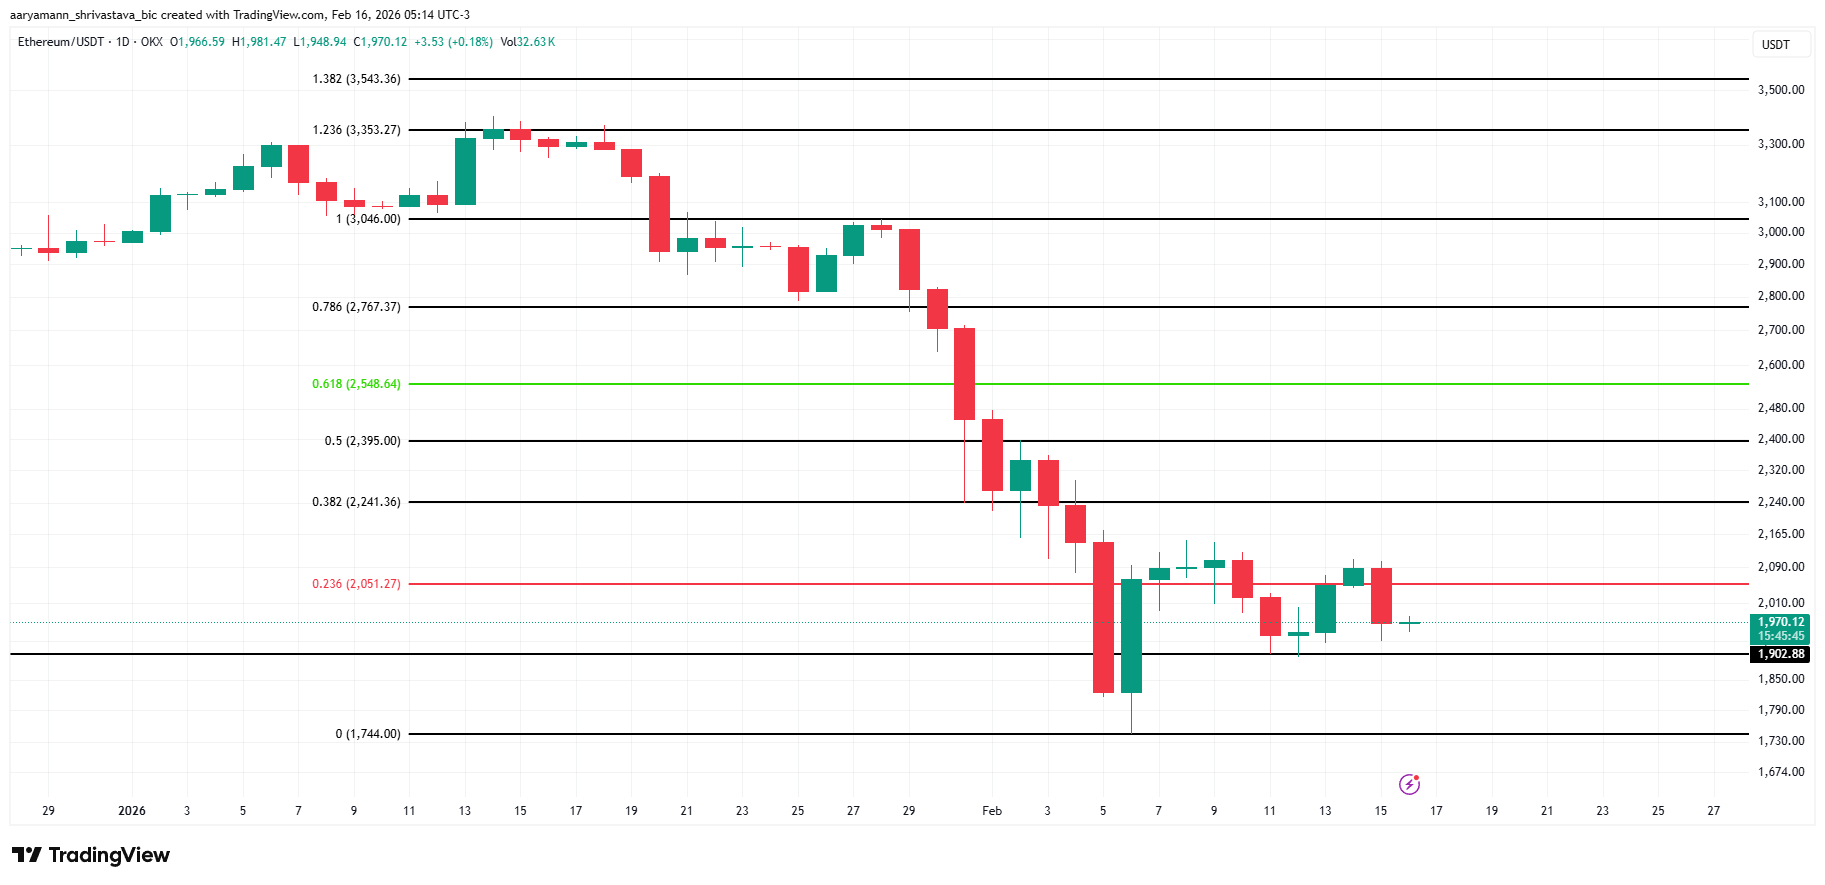
However, a decisive breakout could shift sentiment quickly. If Ethereum secures $2,051 as support and breaches the $2,241 resistance, bullish momentum may strengthen. Such a move could propel ETH toward $2,395 and higher, invalidating the prevailing bearish outlook and signaling renewed market confidence.


Bitcoin’s future resilience and decentralization hinge on how conservatively its core node software evolves. Jimmy Song, co-founder of ProductionReady—a non-profit funding open-source Bitcoin node development and education—argues for a “conservative” client approach. In his view, preserving Bitcoin’s monetary properties means resisting large-scale code changes unless there is overwhelming community support.
ProductionReady has a stated bias against major software overhauls, and Song told Cointelegraph the principle is simple: if a change isn’t clearly improving the money itself, it shouldn’t be implemented. A key area of interest for the group is data limits within transactions. Song said the organization intends to restore an 83-byte OP_RETURN data limit for non-monetary information, a move aimed at keeping node storage costs manageable and, by extension, broadening participation in running full nodes. He framed it as a practical way to enhance self-sovereignty: “The more self-sovereign Bitcoin users are, the more decentralized and resilient the network becomes. That means keeping the cost of running a node low enough for ordinary people to do it.”
Song’s stance underscores a broader industry debate: how to balance on-chain capability with decentralization. ProductionReady’s position is that excessive data requirements, if not carefully bounded, can deter everyday users from operating nodes and inadvertently centralize verification power among a smaller group of participants.
Key takeaways
- Conservative node design aims to preserve Bitcoin’s monetary properties and prevent centralization by keeping operational costs accessible to ordinary users.
- ProductionReady advocates restoring the 83-byte OP_RETURN limit for non-monetary data to curb data bloat while preserving self-sovereignty.
- Bitcoin Core’s latest upgrade era has intensified debates over data limits and on-chain spam, prompting renewed attention on node accessibility and network health.
- Bitcoin Knots has gained traction as an alternative node implementation, rising to roughly 4,700 nodes and about 21.7% of the network, according to Coin Dance data.
- The 2024 baseline for Knots was near 1%, highlighting a dramatic shift in the node ecosystem following Core’s changes.
OP_RETURN debate reshapes the node landscape
Central to the discussion is how non-monetary data is handled in Bitcoin transactions. In 2024–2025, the community has grappled with on-chain data limits and their impact on both spam prevention and node operability. The targeted 83-byte cap—designed to allow small metadata without enabling widespread data bloat—has become a focal point for those who see it as essential to maintaining lower running costs and broader participation in network validation. ProductionReady’s approach reflects a cautionary stance: if a protocol change risks making running a node expensive or technically daunting, it should be scrutinized carefully and backed by broad support.
Market observers note that data limits are more than technical details; they influence who can participate in securing the network. In a Bitcoin ecosystem where the number of full nodes acts as a gauge of decentralization, conservative limits can help keep the barrier to entry approachable for independent operators, hobbyists, and smaller operators alike.
Core v30 and the rise of Bitcoin Knots
The past year has seen a dramatic shift in how many participants run non‑core node software. In October 2025, Bitcoin Core version 30 rolled out with a controversial change: the OP_RETURN limit was removed from its 83-byte constraint, allowing much larger data payloads—up to 100,000 bytes. The move sparked a robust pushback from portions of the community, with the GitHub pull request for the change drawing roughly four times as many downvotes as upvotes, according to the PR page.
The outcome of Core 30’s rollout appears to have reshaped the node landscape. Bitcoin Knots—an alternative node implementation—surged in usage, with its share rising to multi-thousand nodes. Current figures show about 4,746 Knots nodes, accounting for roughly 21.7% of the Bitcoin network, while Bitcoin Core remains the dominant implementation at about 77.8% share. Coin Dance data firms the Knots share at around 21.7–21.8%, illustrating a material shift in the distribution of node software choices.
Prior to this shift, Knots represented a much smaller slice of the network—roughly 1% in 2024. The post‑Core 30 period has thus been pivotal in broadening the mix of node implementations, with implications for decentralization, governance, and resilience. These dynamics matter not just for operators choosing software, but for the broader community tracking how changes to consensus and validation are tested across diverse implementations.
As the ecosystem absorbs Core 30’s changes, observers are watching whether the increase in Knots adoption translates into deeper decentralization or if other forces—such as infrastructure costs, governance dynamics, or future protocol tweaks—reassert influence over which node implementations proliferate.
For readers and builders, the Bitcoin node conversation remains a practical reminder: the choice of node software affects who can participate in verification, what data can be stored on-chain, and how resilient the network remains against attempted centralization or manipulation. The balance between protocol evolution and accessible participation will likely determine the network’s long-term robustness.
Going forward, market watchers and network participants alike will want to monitor how proposals around OP_RETURN data handling evolve, how wallet and exchange operators respond to changes in node diversity, and whether any further steps are taken to harmonize performance, security, and cost across different node implementations.
What remains uncertain is how much of the ongoing decentralization push will hinge on formal governance signals from the broader Bitcoin community versus the practical realities of how many operators can realistically afford to run full nodes as data and bandwidth demands shift. In the near term, the trend toward greater node diversity appears to be accelerating, signaling a broader rebalancing of the network’s architecture as stakeholders weigh the trade-offs between scalability, data inclusivity, and fortifying the network’s distributed backbone.
The next phase will likely reveal whether more pragmatic limits, incremental improvements, or broader consensus on non-monetary data usage will prevail—an outcome that will shape who can verify transactions and how resilient the system remains to potential centralization pressures.

TLDR:
- MARA sold 15,133 BTC for $1.1B and used most funds to repurchase $1B in convertible debt.
- The company reduced total convertible debt by nearly 30%, lowering it from $3.3B to about $2.3B.
- Layoffs affecting 15% of staff come as MARA restructures operations across multiple departments.
- MARA is shifting focus toward AI and high-performance computing alongside its mining business.
MARA Holdings has begun workforce reductions shortly after executing a large Bitcoin sale and debt repurchase strategy.
The company sold over 15,000 BTC and used most proceeds to reduce outstanding convertible notes, while also adjusting operational priorities.
MARA Executes Bitcoin Sale and Workforce Reduction
A recent update on X shared by Bitcoin News confirmed that MARA Holdings sold 15,133 Bitcoin for about $1.1 billion.
The transaction came just days before the company initiated layoffs affecting roughly 15% of its workforce. The cuts span several departments, signaling a broad internal adjustment.
According to the same update, the company directed most of the sale proceeds toward repurchasing $1 billion in convertible senior notes.
This move aligns with efforts to reduce financial obligations and improve balance sheet strength. The timing of the layoffs alongside the financial restructuring has drawn attention across the crypto sector.
Data from NS3.AI indicates that the debt repurchase is expected to save approximately $88.1 million in cash. This reduction provides near-term relief in terms of interest and repayment pressure. At the same time, it lowers the company’s exposure to future conversion risks tied to those notes.
The company’s total convertible debt has decreased by nearly 30% following the transaction. It has moved from around $3.3 billion to approximately $2.3 billion. This marks a notable shift in MARA’s financial position within a short period.
The tweet referenced in the update outlines both the Bitcoin sale and the workforce reduction. It presents a clear sequence of actions, linking capital management decisions with operational changes. The information has circulated widely among market participants tracking mining firms.
Debt Reduction Strategy and Operational Shift
The decision to reduce debt appears closely tied to broader operational planning. By lowering its liabilities, MARA gains more flexibility in allocating capital toward future initiatives. This includes investments beyond its core Bitcoin mining business.
At the same time, the company is expanding into artificial intelligence and high-performance computing. These sectors require substantial infrastructure and energy resources, areas where mining firms already maintain expertise. The shift suggests a move to diversify revenue streams.
Workforce reductions may also reflect this transition. As the company reallocates resources, certain roles may become redundant while new technical demands emerge. This type of restructuring often accompanies strategic pivots in capital-intensive industries.
The use of Bitcoin reserves to manage debt highlights a practical treasury approach. Rather than holding assets passively, MARA converted part of its holdings into liquidity. This allowed the company to address financial obligations without relying on external financing.
Moreover, reducing convertible debt can help stabilize shareholder structure. Convertible notes often carry dilution risks if converted into equity. By repurchasing a portion of these instruments, MARA limits potential dilution over time.
The sequence of actions shows a coordinated financial and operational plan. The company adjusted its asset holdings, reduced liabilities, and streamlined its workforce within a short timeframe. Each step connects to a broader repositioning effort.
While the layoffs mark a challenging moment for employees, they form part of a larger restructuring process. The company appears focused on maintaining efficiency while preparing for expansion into adjacent sectors.
MARA’s recent moves reflect a shift in how mining firms manage capital during changing market conditions. The combination of asset sales, debt reduction, and operational adjustments points to an evolving business model within the industry.

TLDR:
- Solana Agent Skills allows developers to integrate AI tools with blockchain functions using a simple one-line installation.
- The toolkit provides prebuilt components, including security checks, error handling, and version compatibility tools.
- More than 60 community-built skills support areas such as DeFi services, payments, and blockchain infrastructure.
- Platforms like JupiterExchange, Raydium, Helius, dflow, and Metaplex contributed tools to the skills ecosystem.
The Solana Foundation has introduced Solana Agent Skills, a toolkit designed to help developers connect AI tools directly to the Solana ecosystem.
The initiative offers prebuilt components that simplify the creation of AI agents capable of performing on-chain actions.
Prebuilt Skills Aim to Simplify AI Integration With Solana
The Solana Foundation announced the launch of Solana Agent Skills through its official communication channels. The toolkit provides developers with ready-to-use components designed for AI applications interacting with the Solana network.
According to the announcement, developers can install these skills using a single line of code. This approach allows faster integration without complex development steps. As a result, builders can connect AI tools to blockchain functions more easily.
A post shared by the Solana Foundation on X described the purpose of the release. The update stated that developers can embed these skill components directly into AI tools. This setup enables AI agents to perform on-chain operations inside the Solana ecosystem.
The toolkit includes several official skills designed to support development and security practices. These features include common error handling tools and built-in security checklists. Developers can also access compatibility tools designed to maintain version stability during updates.
Another feature within the toolkit supports confidential transfers. This function allows developers to build AI agents that manage certain transactions while maintaining privacy parameters on the network.
Together, these components provide a standardized framework for building AI-powered tools on Solana. Developers can integrate the features quickly while maintaining consistent functionality across projects.
Community Skills Expand AI Capabilities Across the Solana Ecosystem
The Solana Agent Skills toolkit also includes contributions from the wider developer community. More than 60 additional skills are currently available through community development efforts.
These community-built tools extend the capabilities of AI agents interacting with the Solana blockchain. The skills cover several areas across the ecosystem, including decentralized finance services and payment integrations.
Developers can also access infrastructure-related tools designed to assist with blockchain data interactions. Other components focus on developer utilities that simplify AI-powered workflows inside blockchain applications.
Several ecosystem platforms contributed skills to the initiative. These include tools from JupiterExchange, Raydium, Helius, dflow, and Metaplex. Each platform provides specific functionality related to its service area.
Through these integrations, developers can combine AI systems with existing Solana-based platforms. The approach enables AI agents to access services such as trading tools, payment functions, and blockchain data infrastructure.
Foresight News also reported that the toolkit allows developers to build agents capable of interacting with Solana through simple installation steps. The report noted that these integrations require minimal setup compared with traditional blockchain development methods.
The release places AI integration within reach for a wider developer audience. As more contributors add skills to the library, the range of AI-enabled blockchain applications may continue to grow.
Solana Agent Skills therefore, provide a structured way for developers to build AI-powered tools that interact directly with the blockchain network. The framework combines official components with community-built extensions to support a broader range of use cases.
TLDR:
- Japan’s 10-year yield reached 2.393%, marking its highest level since 1999 amid shifting rate expectations
- Rising yields may unwind carry trades, reducing global liquidity that supported stocks and crypto markets
- The long-term chart shows a sharp reversal after years of near-zero rates under loose monetary policy
- Higher domestic yields could redirect capital flows back to Japan and influence global bond markets
Japan’s 10-year government bond yield has climbed to 2.393%, marking its highest level since 1999. The move signals a shift in Japan’s long-standing low-rate environment, drawing attention across global financial markets and raising concerns about tightening liquidity conditions.
Yield Surge Signals Shift in Monetary Conditions
A recent post by Wise Advice noted that Japan has broken a 25-year record as its 10-year yield moved above 2.39%. The update pointed to a changing rate environment that has remained subdued for decades.
The chart shows that yields stayed elevated in the late 1990s and early 2000s before entering a long decline. During that period, rates gradually moved toward near-zero levels. This trend aligned with weak growth and persistent deflationary pressures across Japan’s economy.
By 2016, yields had reached near-zero or negative levels. This phase followed aggressive monetary easing by the Bank of Japan. Yield Curve Control policies kept long-term rates tightly anchored for years.
However, the trend shifted after 2021. The chart shows a steady upward move that accelerated after 2023. The latest reading near 2.4% stands out compared to the flat conditions seen in prior years.
The sharp rise on the right side of the chart reflects a break from the earlier pattern. The move appears stronger than previous cycles, suggesting a change in direction for Japan’s rate structure.
Market participants are now watching for further adjustments in central bank policy. The rise in yields suggests that pricing is adjusting to a less accommodative stance.
Global Liquidity Concerns and Market Reactions
The same post explained that Japan has long served as a low-cost funding source for global markets. Low yields supported carry trades, where investors borrowed cheaply in yen to invest in higher-yield assets.
With yields rising, those trades may begin to unwind. As borrowing costs increase, the appeal of such strategies weakens. This shift can reduce liquidity flows that have supported global markets for years.
The post also noted that tighter liquidity conditions could affect risk assets. Stocks and cryptocurrencies may face periods of volatility as capital flows adjust.
At the same time, higher domestic yields may encourage Japanese investors to keep funds within local markets. This shift could reduce overseas investments, including positions in foreign bonds.
Currency movements are also part of the discussion. Rising yields tend to support the Japanese yen, which has remained weak for an extended period. A stronger currency could further influence global capital allocation trends.
The chart reflects a broader transition from prolonged low rates toward normalization. The pace of the recent increase suggests that markets are adjusting quickly to new expectations.
While the long-term direction remains uncertain, the current data shows a clear departure from past conditions. As a result, investors are closely monitoring policy signals and market responses in the coming months.
Crypto World
Coinbase CEO Brian Armstrong Calls for “Shenzhen-Style” Special Economic Zones in the US
TLDR:
- Brian Armstrong wants the US to create Shenzhen-style zones free from excessive regulatory barriers.
- Armstrong cited crypto, biotech, and drones as industries that would benefit most from these sandboxes.
- Coinbase’s “Next Bets” program lets employees pitch new ideas, keeping innovation active internally.
- Armstrong’s lawsuit against the SEC and apolitical stance ultimately strengthened Coinbase’s brand trust.
Special Economic Zones could be the next frontier for American innovation. Coinbase CEO Brian Armstrong made this case on the Relentless podcast. He urged the United States to create zones modeled after global innovation hubs.
These include Shenzhen, Hong Kong, Singapore, and Dubai. Armstrong described these areas as free from excessive regulatory barriers.
His proposal covers industries such as crypto, biotech, and drones. He also raised the idea of cyberpunk-style free cities in the long run.
Armstrong’s Push for Innovation Sandboxes
Armstrong argued that the United States needs dedicated spaces for new industries to grow. He believes excessive red tape slows down progress in fast-moving sectors.
According to Armstrong, removing regulatory friction could unlock economic potential at scale. These zones would act as controlled environments for testing emerging technologies freely.
Armstrong specifically cited Shenzhen as a model worth replicating in the US. That city grew rapidly under China’s special economic zone framework decades ago.
Similarly, Hong Kong, Singapore, and Dubai have attracted global talent through business-friendly policies. Armstrong sees a parallel opportunity for the US to remain competitive globally.
On the podcast, Brian_armstrong outlined how these sandboxes could benefit crypto development directly. He pointed to unnecessary compliance burdens that currently slow crypto adoption in America.
Reducing those barriers inside a designated zone could accelerate product development considerably. Moreover, biotech and drone industries could also benefit from such a framework.
Armstrong’s proposal aligns with a broader global trend of innovation-focused economic zones. Several countries have already seen strong results from adopting this model.
Looking further ahead, Armstrong envisions a future with cyberpunk-style free cities. These cities would operate with minimal government interference and maximum economic freedom.
Coinbase’s Mission and Leadership Approach
Armstrong built Coinbase around a central mission: increasing global economic freedom through crypto. He has consistently tied the company’s work to this broader purpose.
That narrative, he said, took time to craft and communicate effectively. But it has since become a guiding force behind the company’s decisions.
One example is Coinbase’s decision to remain apolitical in the workplace. That choice drew controversy at the time but later strengthened the brand.
Another was the lawsuit against the SEC, which also faced early criticism. Armstrong said both moves ultimately built greater trust with customers and the public.
To keep innovation alive internally, Armstrong introduced a program called “Next Bets.” This initiative lets employees pitch and pursue new business ideas within Coinbase.
It reflects his belief that large companies must still act like startups in key areas. Through this program, Coinbase has been able to explore new opportunities continuously.
Armstrong also spoke openly about the demands of leadership and managing burnout. He practices hiking and other wellness habits to maintain mental clarity.
He described a “wartime CEO” mindset as energizing rather than exhausting. For him, pushing forward through pressure is what drives meaningful progress.
Wall Street’s crypto footprint has never been larger. BlackRock alone reported nearly $150 billion in digital asset-linked AUM in its 2026 chairman’s letter. Public companies hold over 1.1 million BTC on their balance sheets. Institutions disclose more than 513,000 BTC through ETF wrappers.
Yet aggregate numbers obscure the question that matters most. Who actually holds what, through which infrastructure, and why?
This article maps Wall Street’s crypto ownership across five layers.
It starts with SEC 13F filings, moves through corporate balance sheets, follows the money into tokenized fund rails, traces the custodial chokepoints where keys concentrate, and ends where filings go dark, with on-chain OTC flows that reveal holders no quarterly report captures.
SEC 13F Filings Reveal Secrets About Wall Street Crypto ETF Holdings
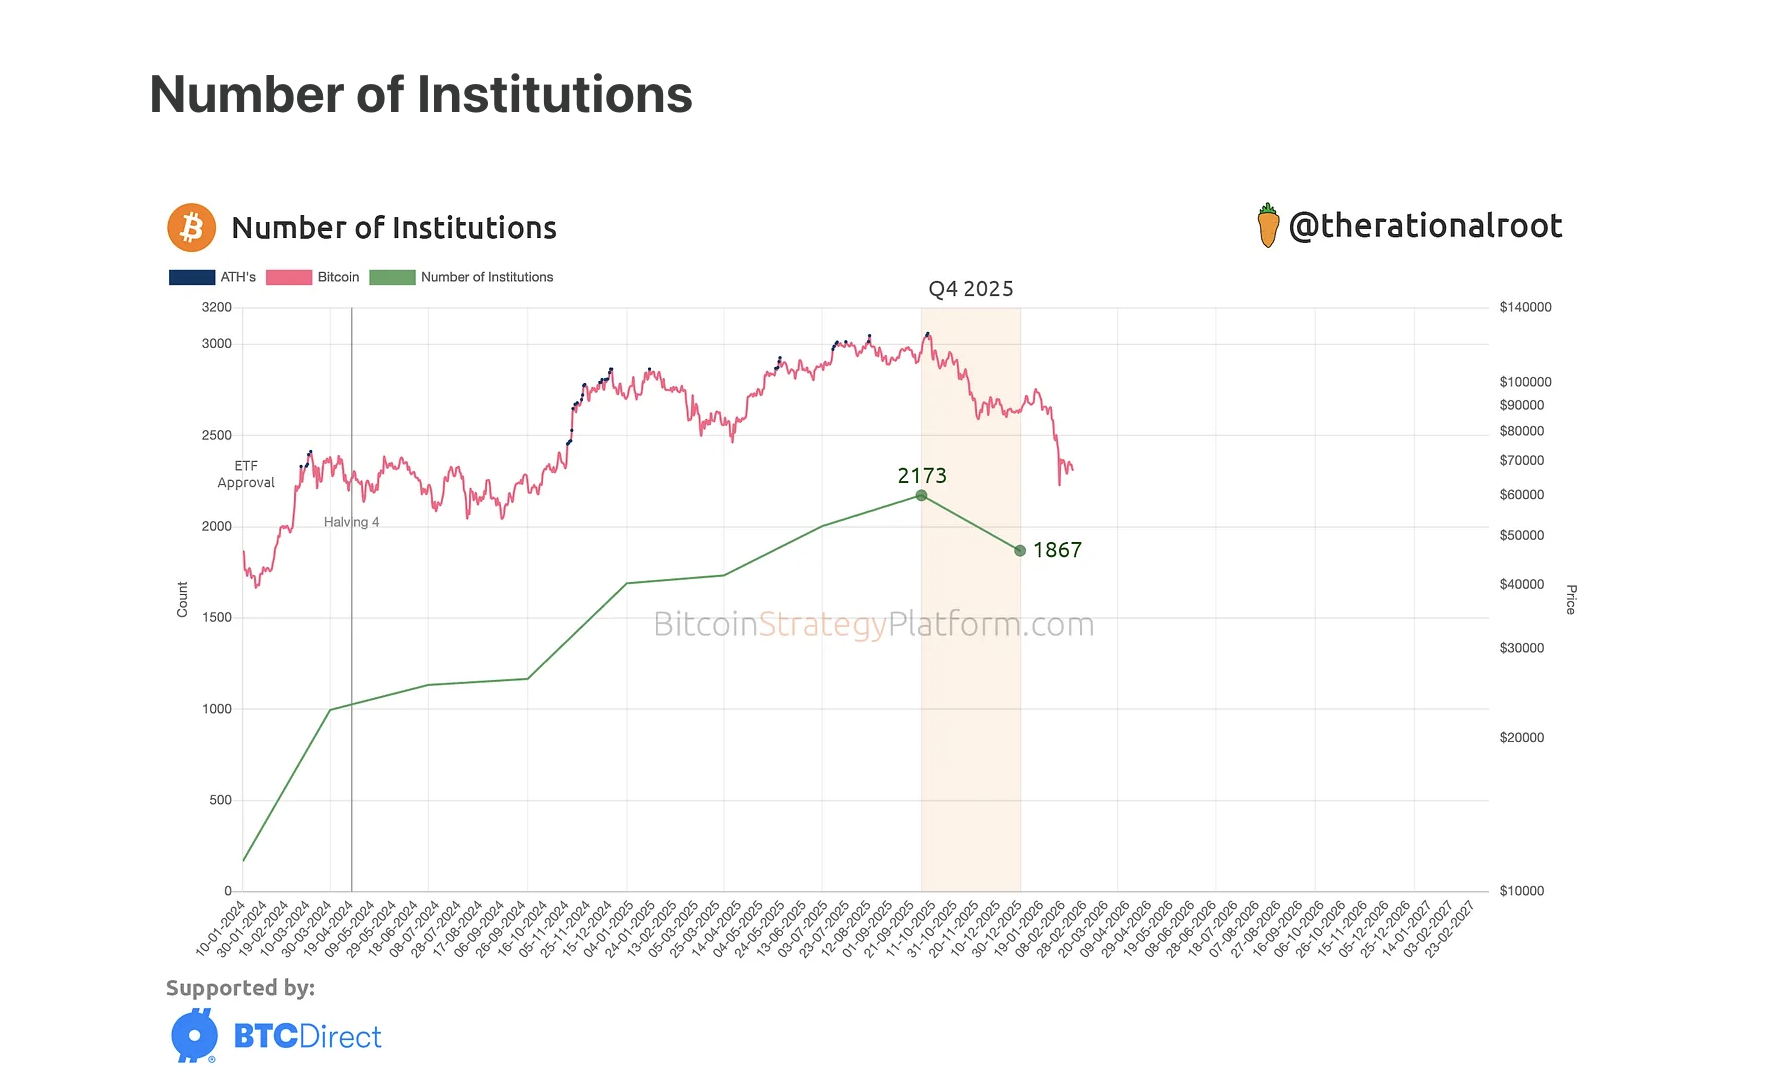
Despite a 23% price decline in Q4 2025, global Bitcoin ETF flows remained positive at $3.7 billion. Full-year professional ETF ownership grew 32% versus 18% for the broader ETF investor base.
Institutions still held over 513,000 BTC through ETFs, though filer count declined from 2,173 to 1,867.
Not all of this is conviction capital. The basis trade, a strategy involving a long spot ETF position paired with a short CME futures position, has been a primary institutional strategy since ETF approval.
Hedge fund exposure declined nearly 10% in Q4, as leverage unwound and the basis spread narrowed.
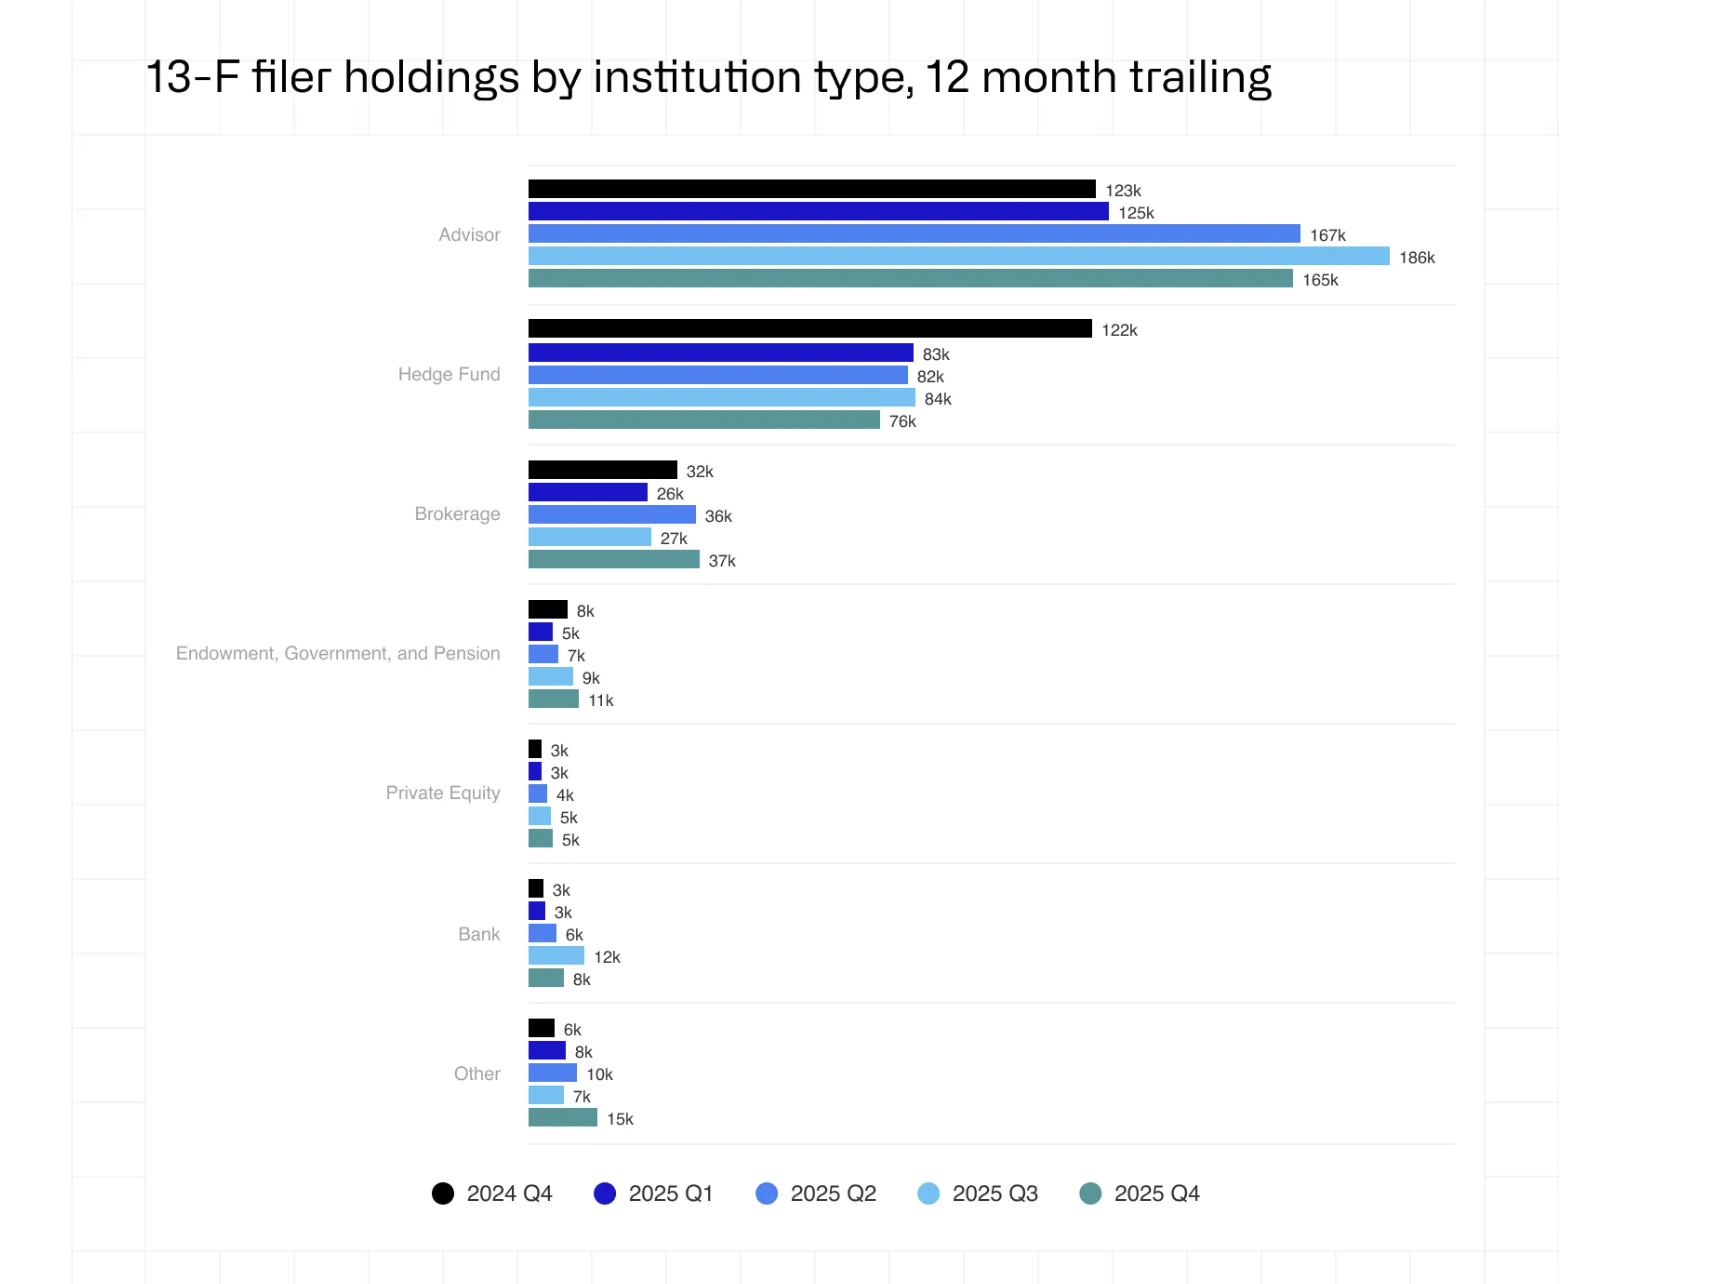
Cohort rotation, not capitulation, defined Q4. Millennium added 8,100 BTC. Abu Dhabi’s Mubadala added 2,300 BTC. Morgan Stanley added 1,900 BTC. Dartmouth became the fourth Ivy League endowment to enter.
On the other hand, Brevan Howard cut 17,700 BTC, Harvard trimmed roughly 20%, and Royal Bank of Canada fully exited, all of which are mentioned in the CoinShares Q4 2025 report.
Aggregate pension fund and endowment crypto holdings peaked at $1.48 billion in Q3 2025, then declined to $965 million in Q4.
However, ETFs only reveal who is buying the wrapper. For those who are holding the asset itself, the balance sheets tell a different story.
Corporate Treasuries Show Who Holds Bitcoin Directly on the Balance Sheet
Beyond ETFs, a growing number of public companies hold Bitcoin directly as a treasury reserve asset. As of March 31, 2026, publicly traded companies report a combined 1,134,324 BTC on their balance sheets.
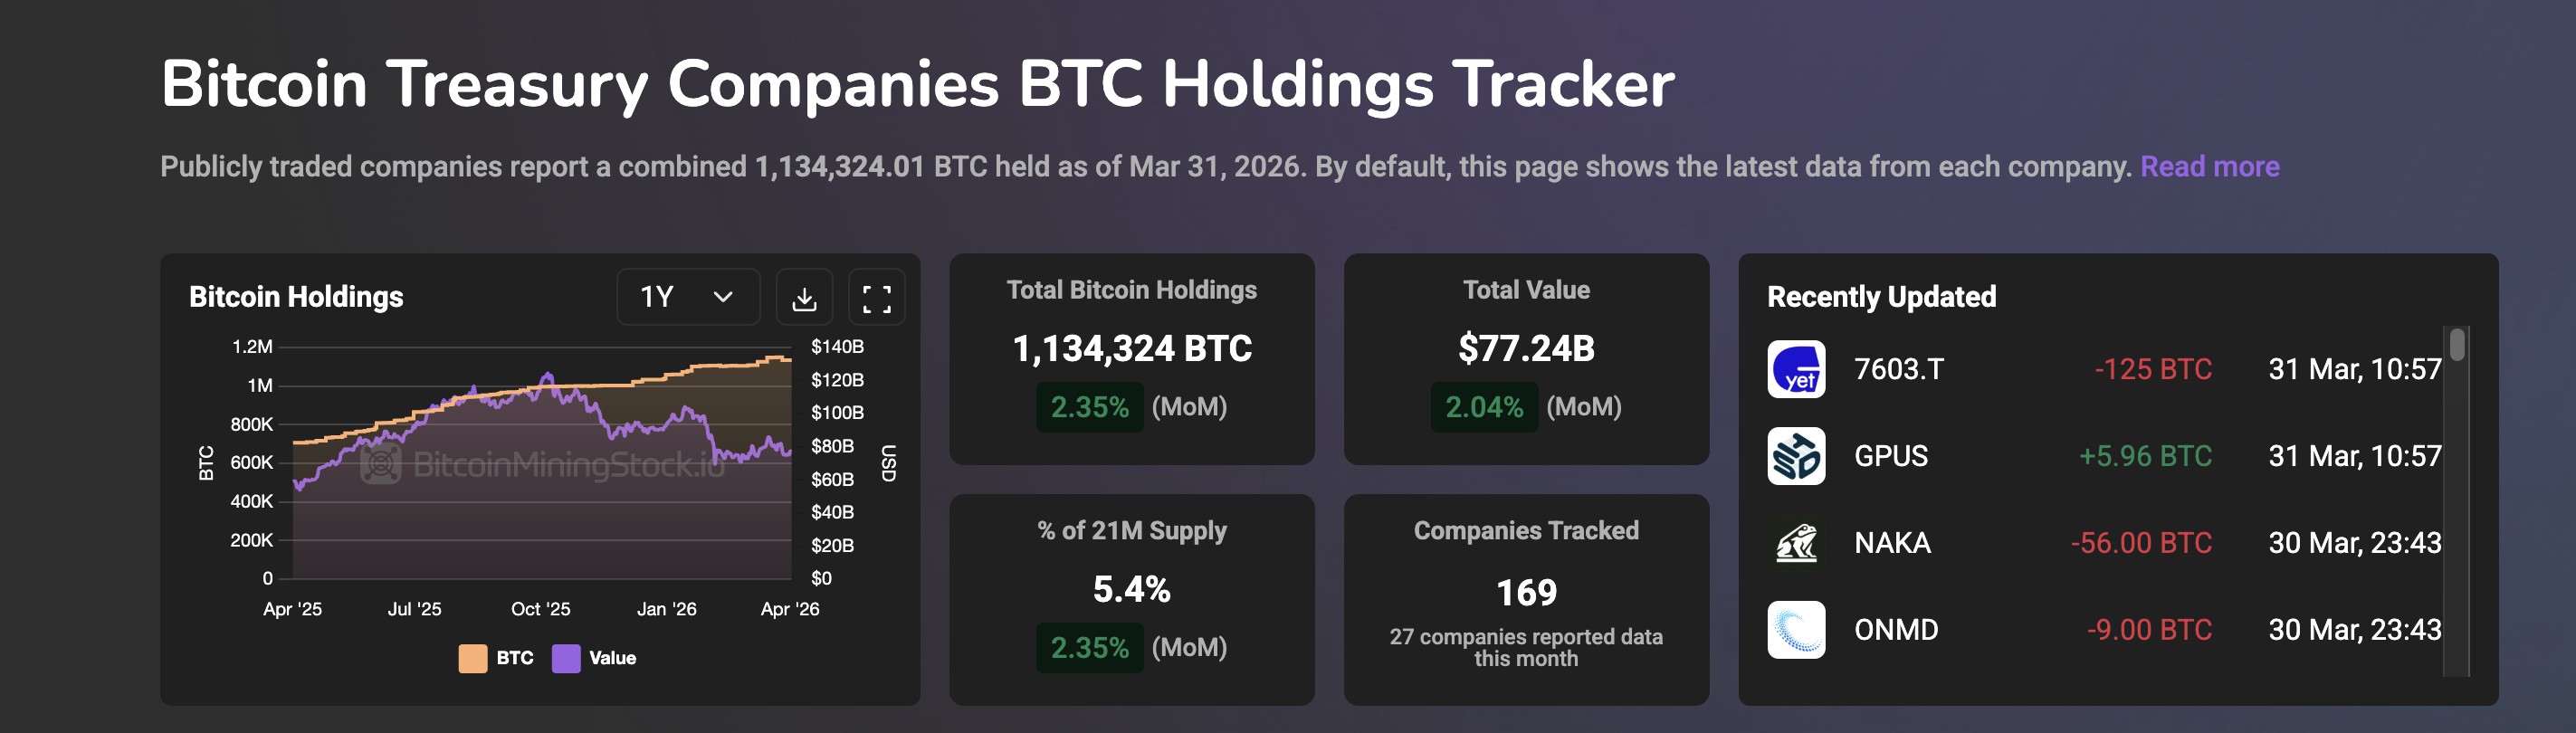
The concentration is extreme. Strategy Inc, formerly MicroStrategy, held 762,000 BTC as of April 2, 2026. Other big names in the space include Twenty One Capital, MARA Holdings, Japan’s Metaplanet, and more.
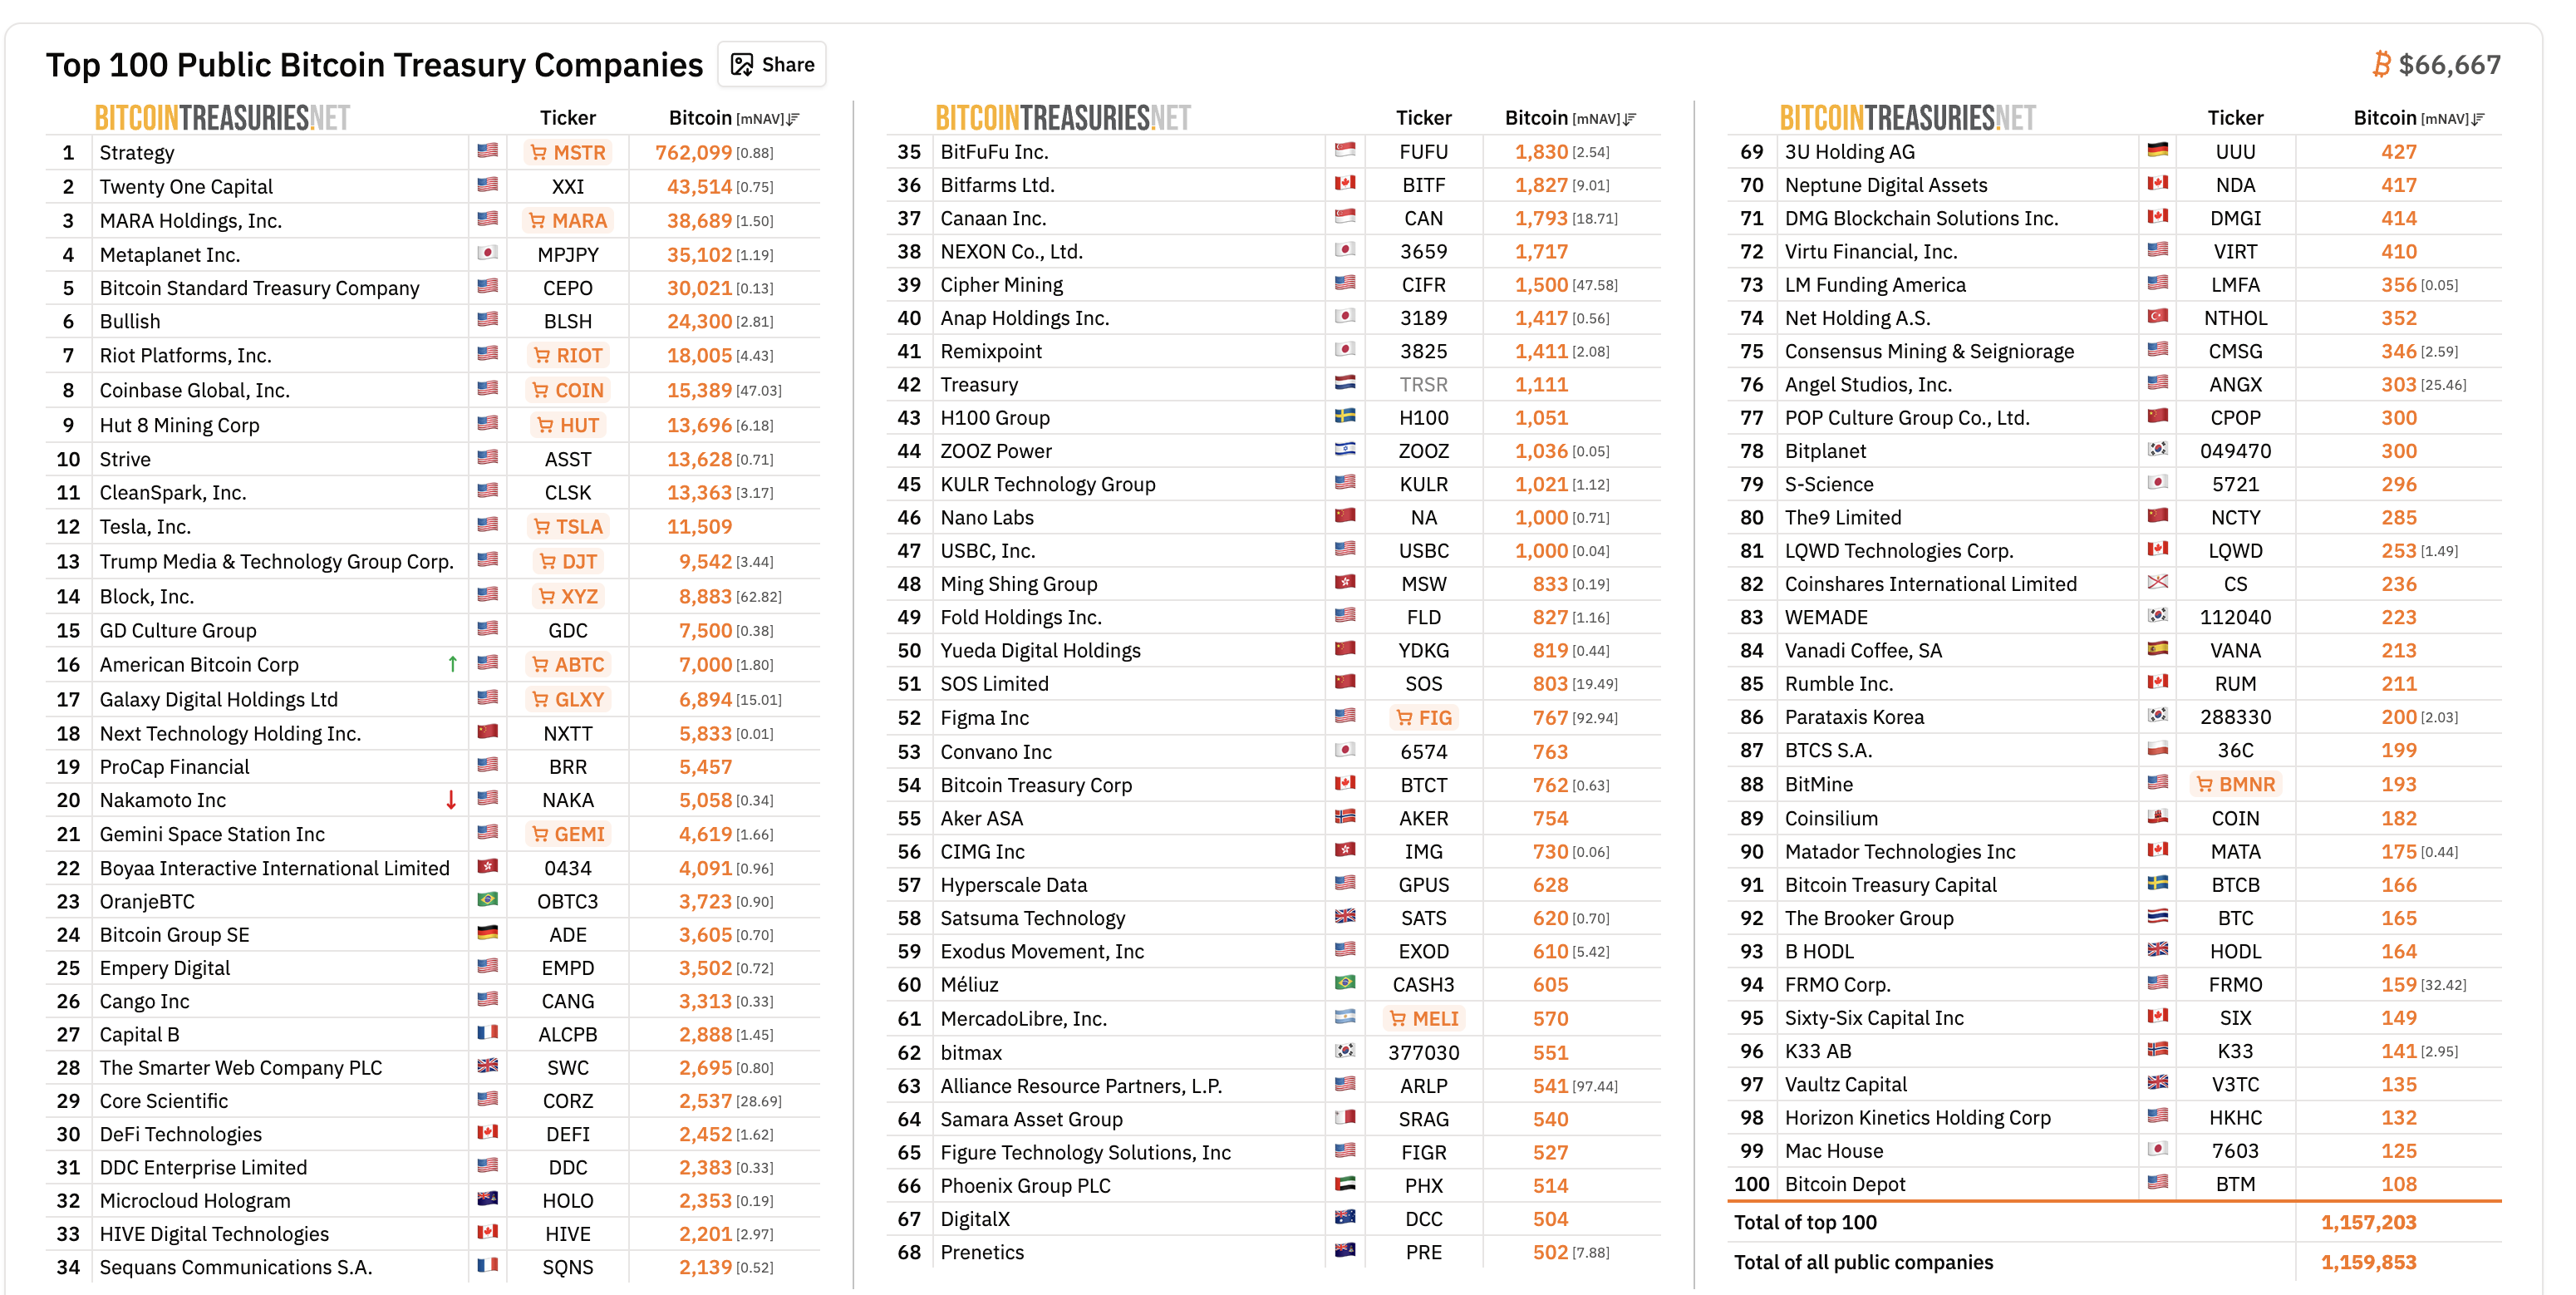
New entrants are reshaping the picture. Trump Media (DJT) held 11,542 BTC before pledging 2,000 BTC as collateral under a hedge arrangement with rehypothecation rights, reducing on-balance-sheet holdings to 9,542 BTC. MARA sold 15,133 BTC in March 2026 at a loss to service debt.
Yet corporate treasuries only account for direct spot ownership. Wall Street’s largest players are building crypto exposure through an entirely different mechanism, one that does not require holding a single Bitcoin.
Tokenized Funds and RWA Holdings Show Where On-Chain Meets TradFi
Some of Wall Street’s largest firms now build crypto exposure without holding a single token. Instead, they put traditional assets on-chain through tokenization.
BlackRock’s BUIDL fund, a tokenized US Treasury money market product, reached $2.85 billion in total assets ($2.17 billion at press time).
In February 2026, BlackRock began trading BUIDL on Uniswap’s decentralized exchange and purchased UNI governance tokens. That marked its first direct engagement with DeFi trading infrastructure.
The firm’s 2026 chairman’s letter reported $65 billion in stablecoin reserves, $80 billion in digital-asset ETPs, and nearly $150 billion in total digital asset-linked AUM.
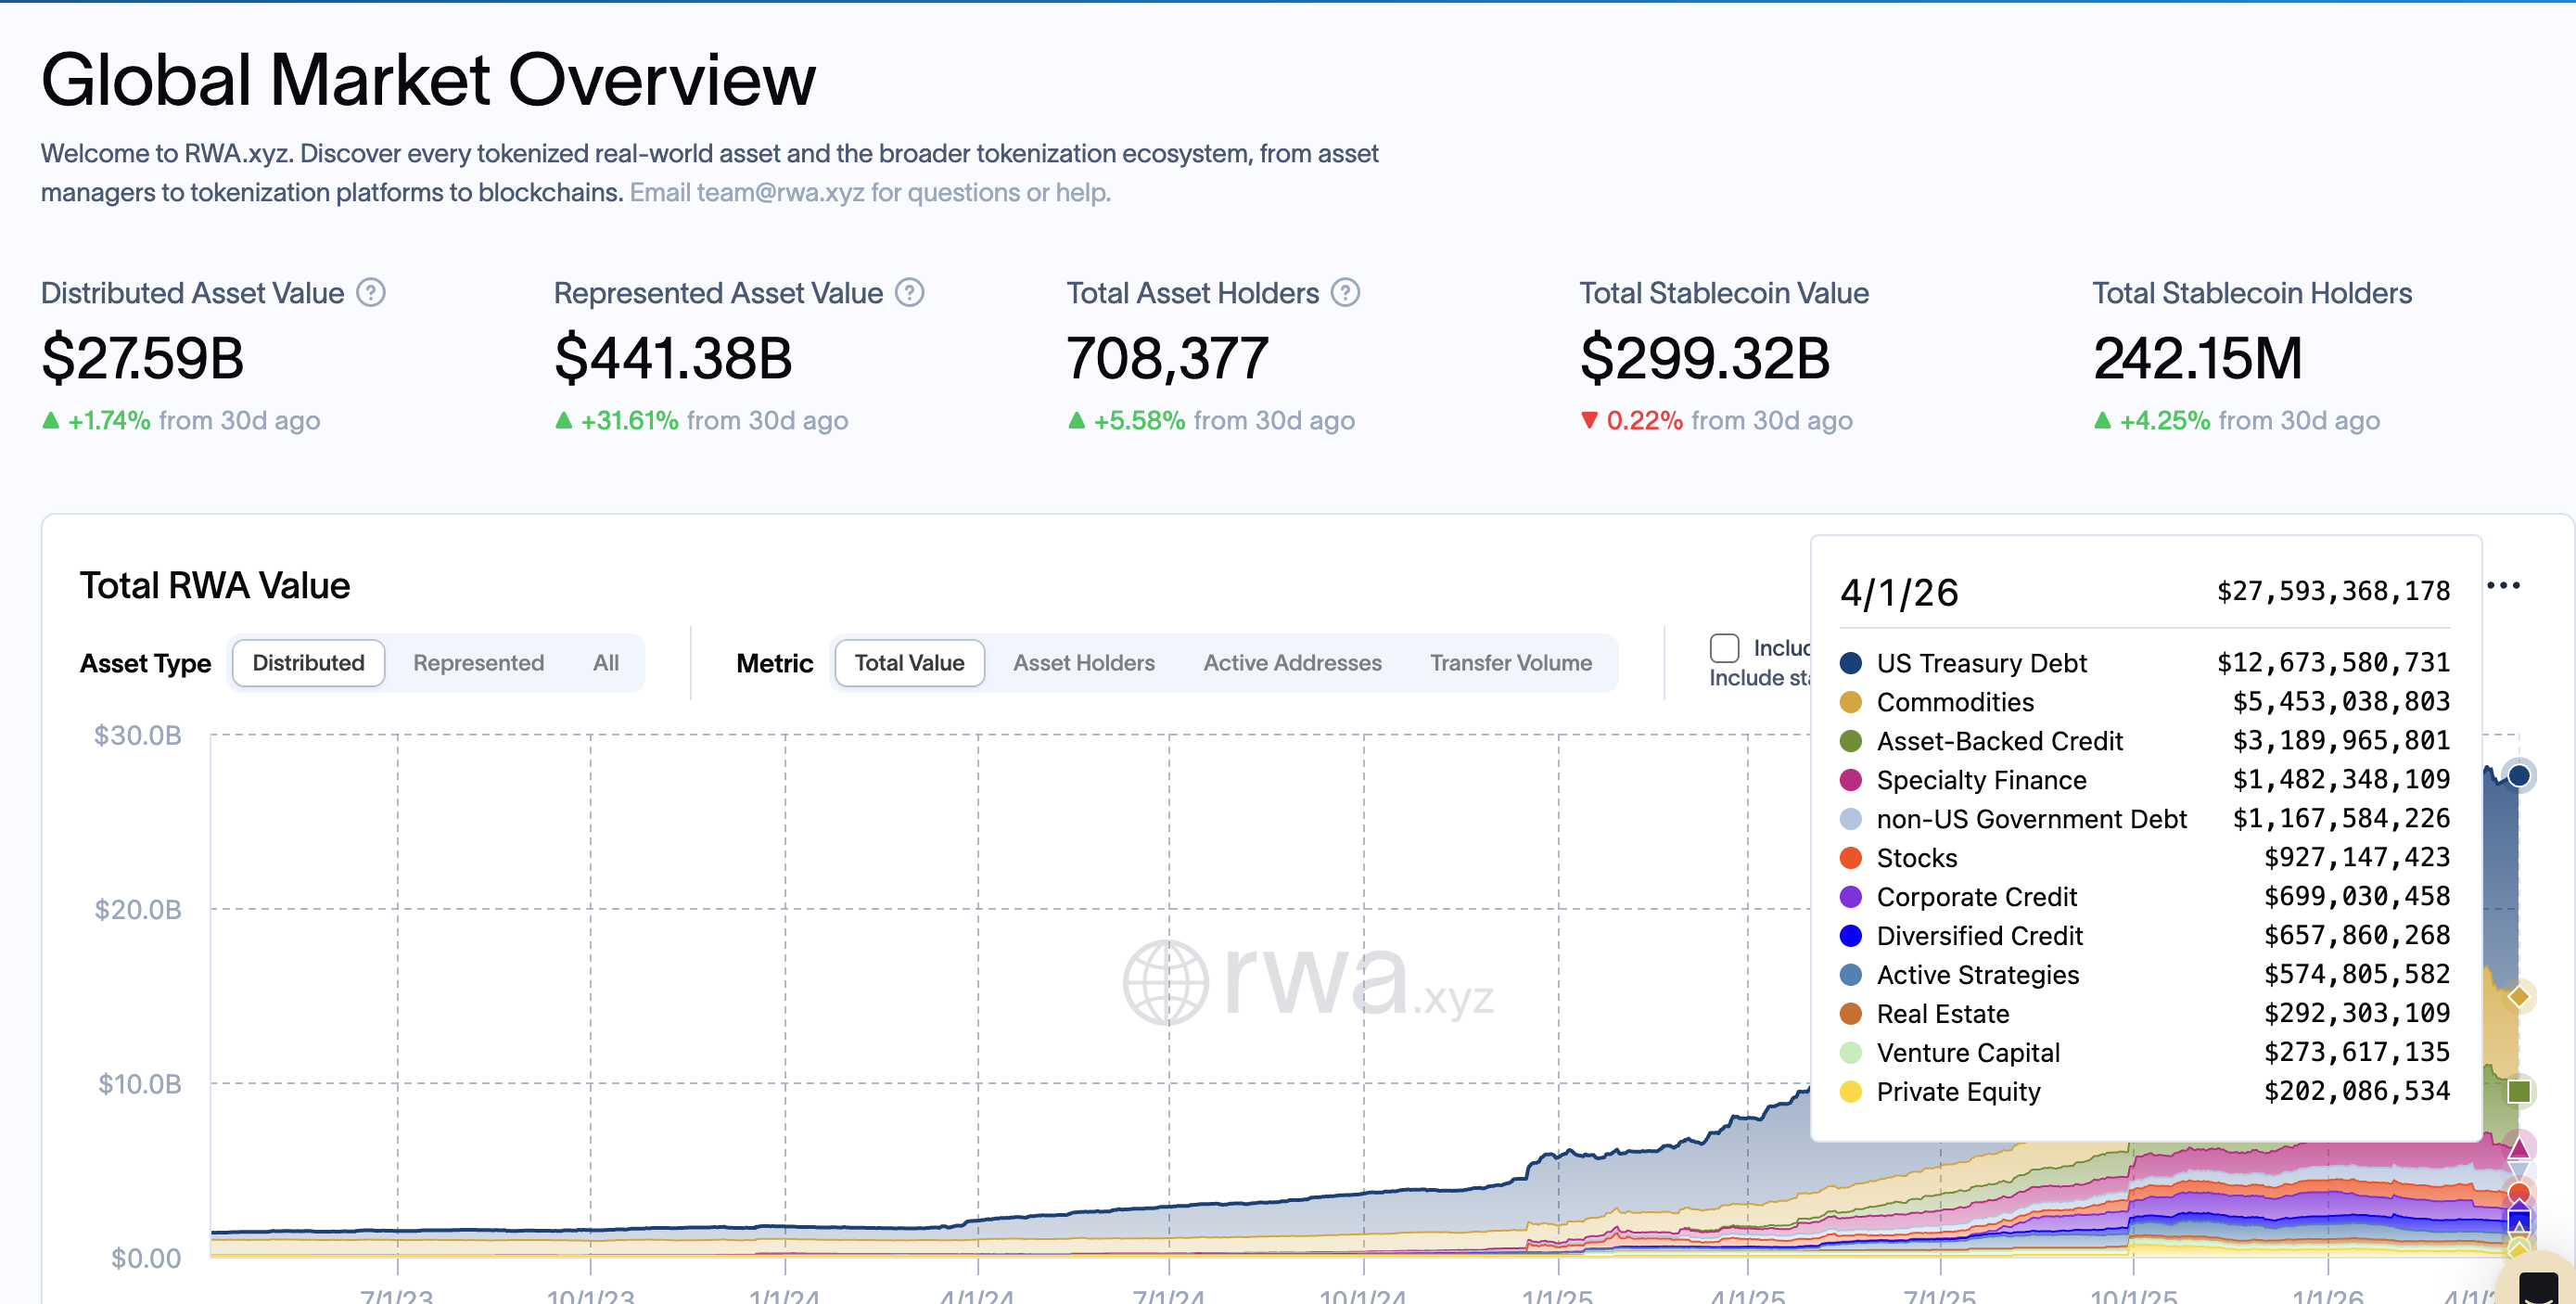
The broader market is scaling fast. RWA.xyz data as of April 2026 shows $12.67 billion in on-chain US Treasury debt, representing roughly 46% of the total $27.59 billion in tokenized real-world assets.
That total RWA figure grew 31.61% in just the last 30 days alone, with 708,377 asset holders across the ecosystem.
This is Wall Street holding crypto infrastructure, not crypto assets. However, all of it depends on one thing. Who has the keys.
The Custody Map Reveals a Single Point of Failure
Knowing who owns Wall Street’s crypto is only half the picture. The other half is who holds the keys.
Coinbase custodies over 80% of US Bitcoin and Ethereum ETF assets, a figure confirmed by CEO Brian Armstrong. Coinbase was the custodian for eight of the 11 spot Bitcoin ETF listings at launch. Only Fidelity self-custodies its own fund. VanEck selected Gemini.
This concentration creates a single-cluster dependency. A cyber incident, service disruption, or governance failure at one custodian could affect multiple funds simultaneously, with knock-on effects for creations, redemptions, and trading liquidity.
On the tokenized side, Bank of New York Mellon serves as BUIDL’s cash and securities custodian, while Anchorage Digital, BitGo, Copper, and Fireblocks support BUIDL subscribers.
As of March 2026, discussions are emerging around multi-party computation custody and multi-custodian mandates to spread risk. No structural changes have materialized yet.
The custody map reveals a paradox at the heart of Wall Street’s crypto exposure. A decentralized asset class funneled through increasingly centralized infrastructure. And that infrastructure still leaves major holders invisible, specifically those with no filing obligation at all.
The Shadow Holders and What No Filing Can Show
13F filings only apply to US institutional managers with over $100 million in qualifying assets. Family offices, offshore entities, and sovereign vehicles operating through intermediaries are not subject to disclosure obligations.
That creates a structural blind spot in Wall Street’s map of crypto ownership.
On-chain data reveals what filings cannot.
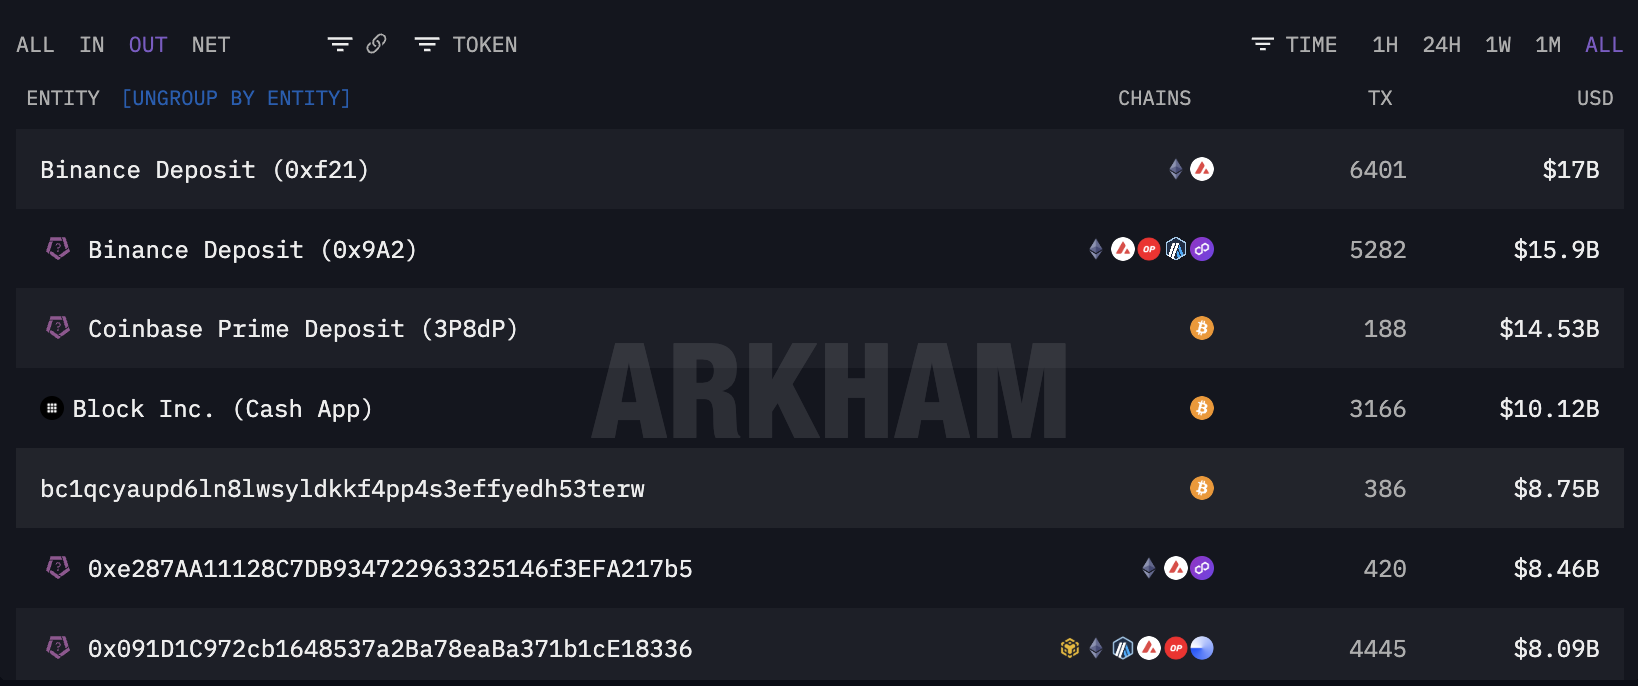
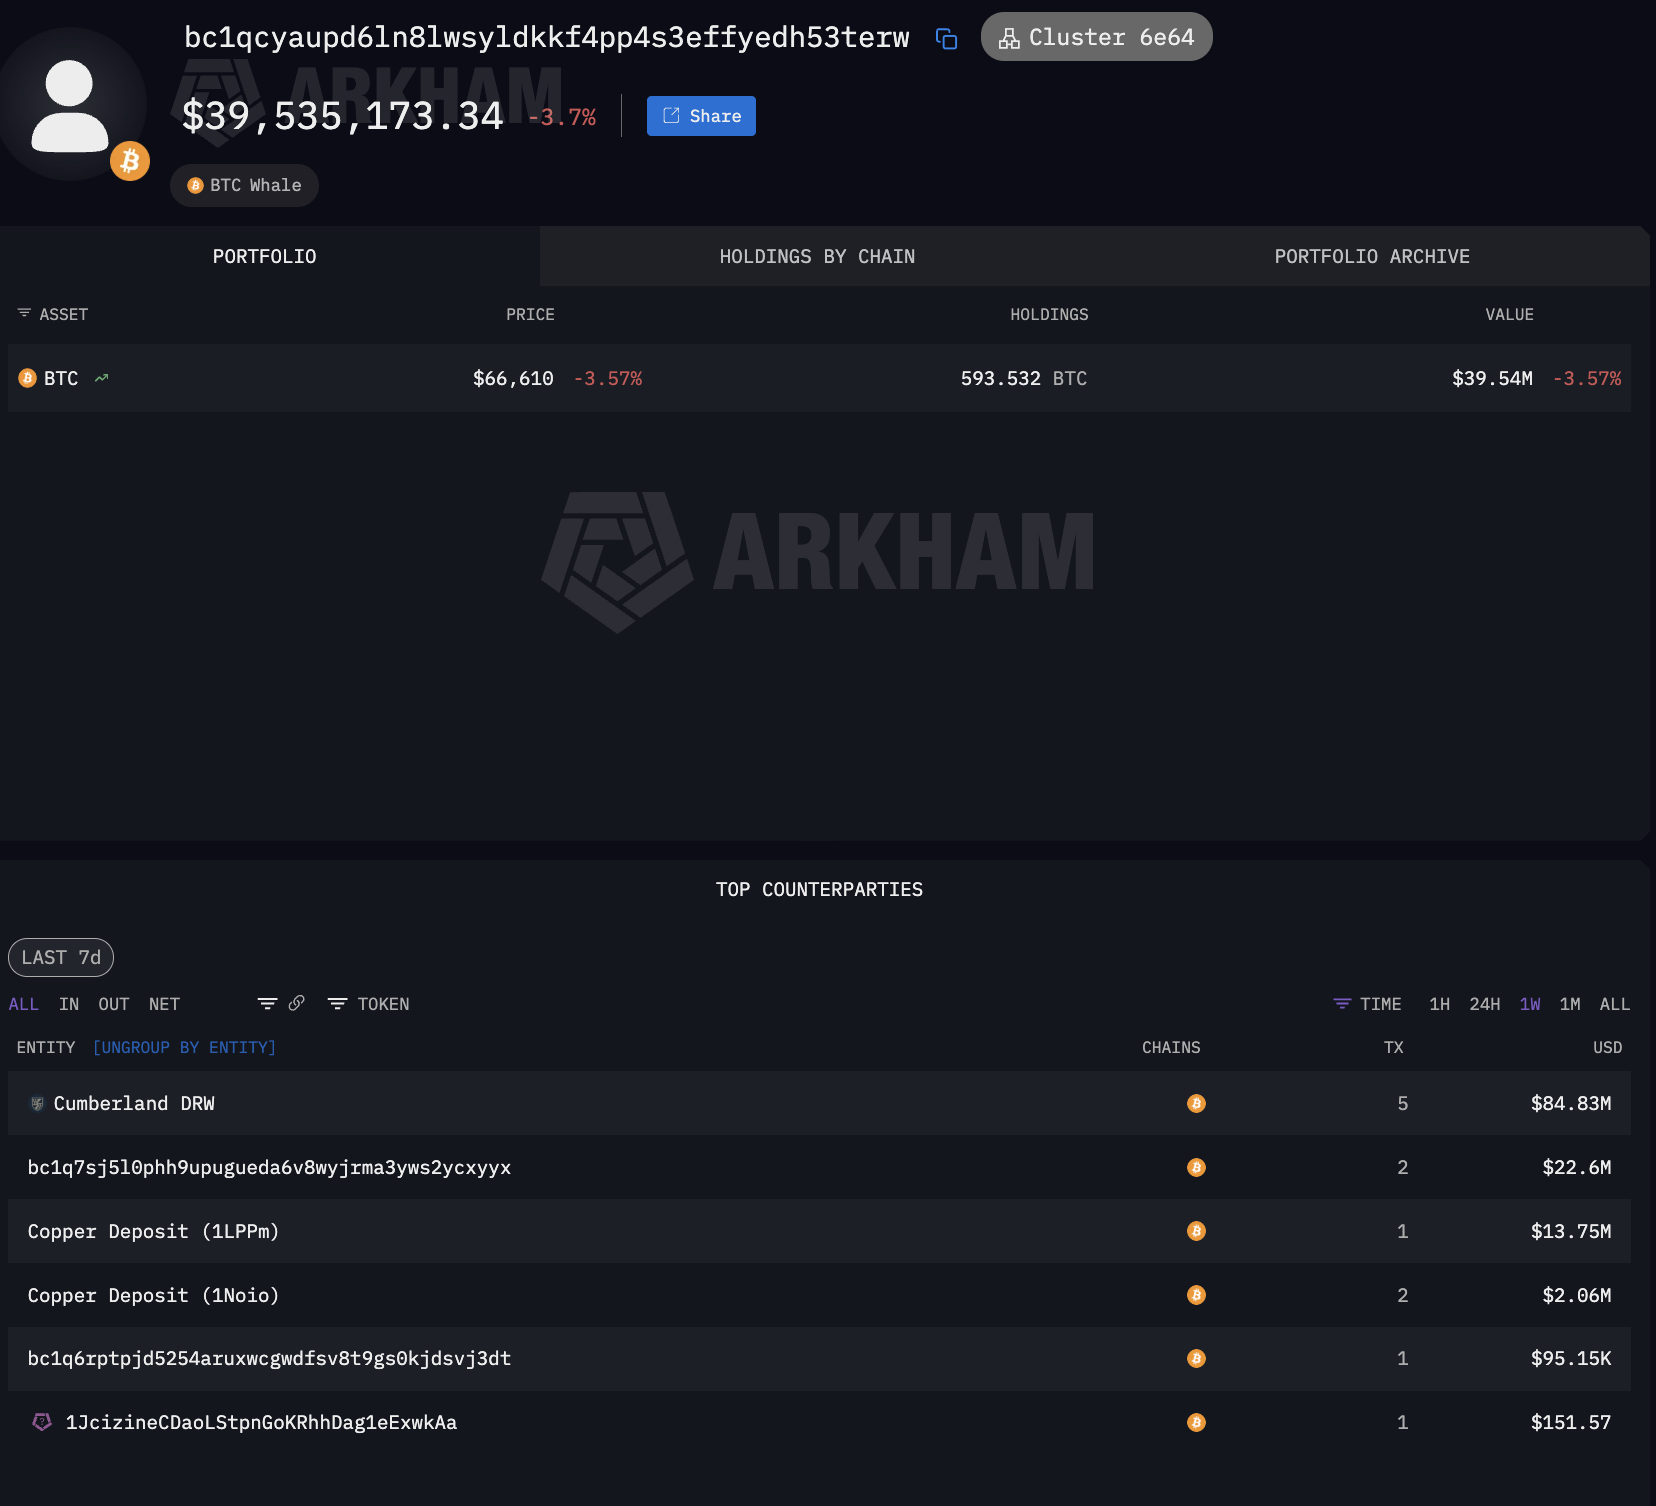
Cumberland DRW, one of Wall Street’s primary OTC desks, has processed a total of $123.58 billion in deposits and $97.71 billion in withdrawals across major exchanges since 2018.
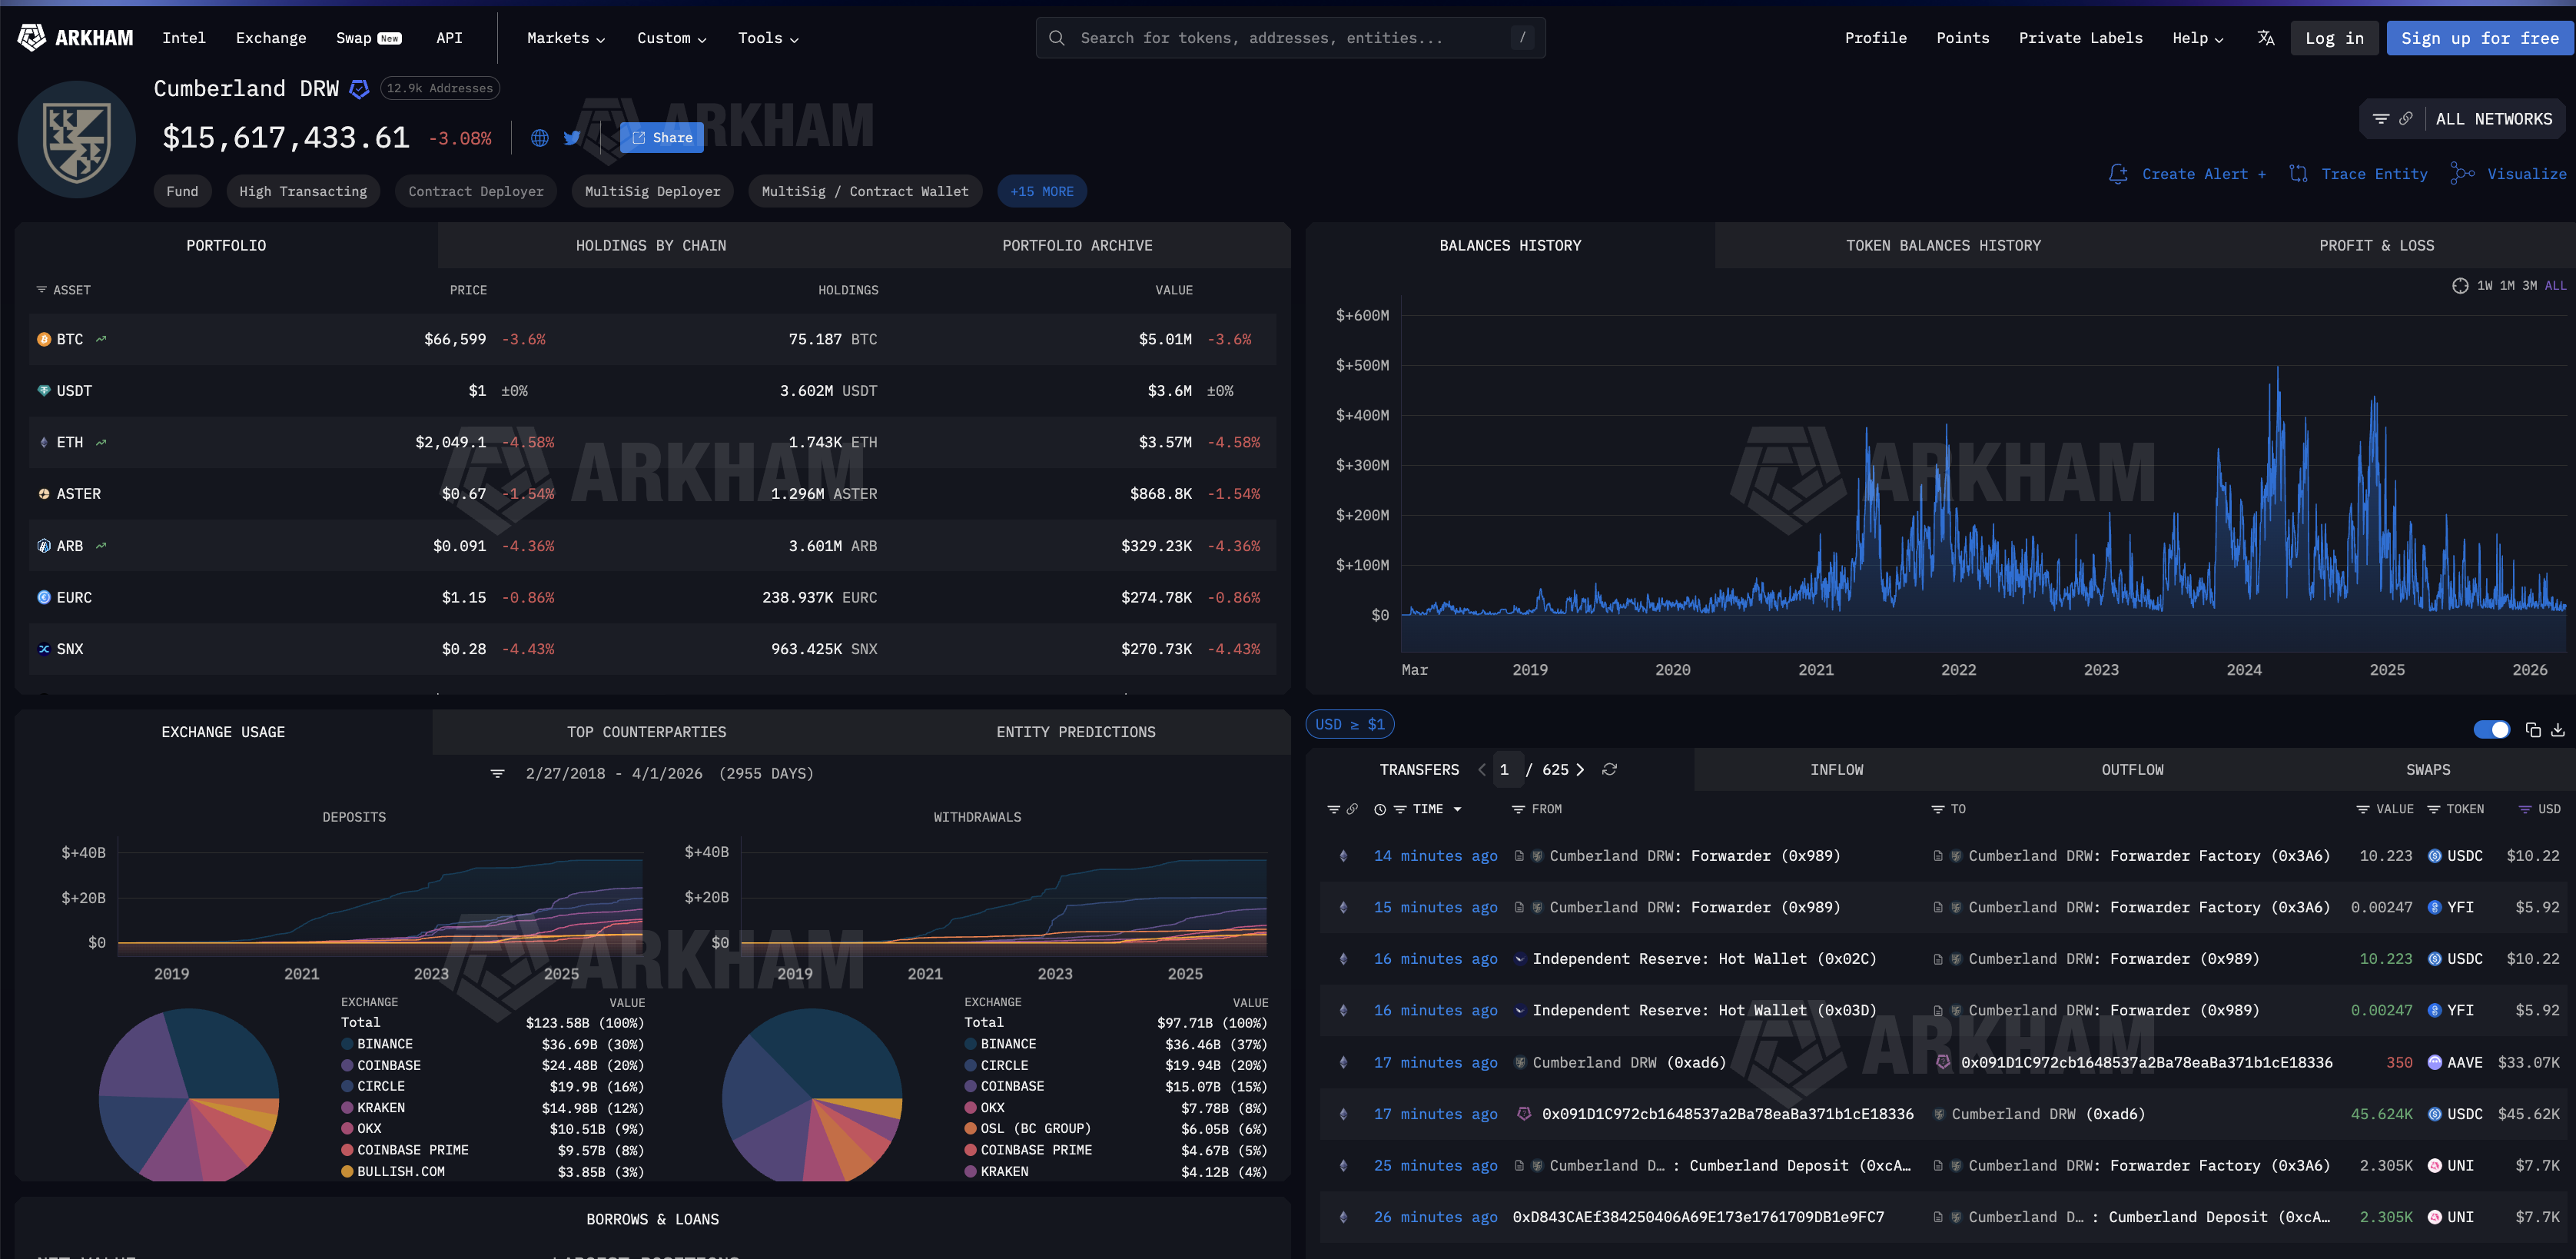
Filtering Cumberland’s outflows reveals where institutional capital actually goes. The top all-time outflow destinations include $17 billion to Binance, $14.53 billion to Coinbase Prime, likely for ETF creations, and $10.12 billion to Block Inc..
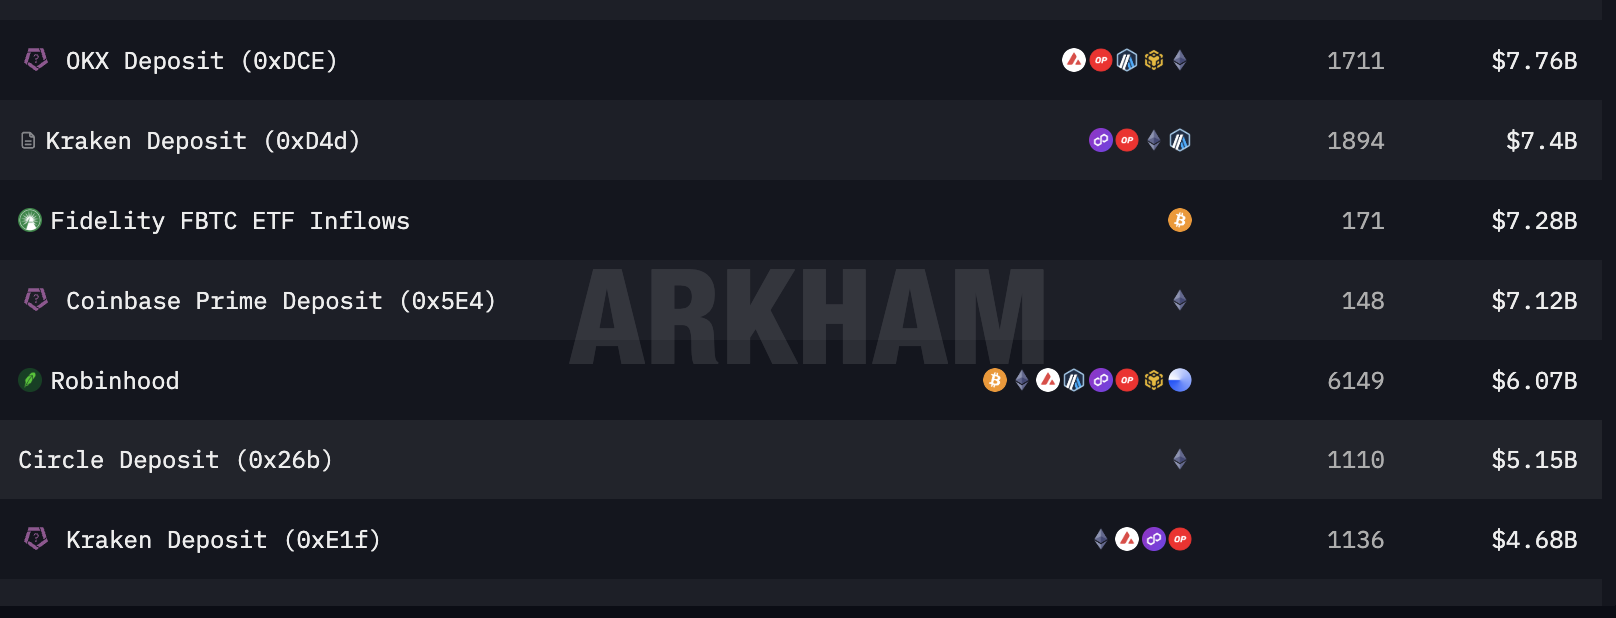
Scrolling further down the counterparty list confirms additional ETF and institutional plumbing. Fidelity’s FBTC ETF inflows appear at $7.28 billion across 171 transactions.
Alongside these labeled flows sit billions more directed to unlabeled wallets. The single largest unlabeled BTC recipient, wallet bc1qcyau..., received $8.75 billion across 386 transactions.
It currently holds 593 BTC and uses Copper’s institutional prime brokerage for custody.
That pattern, large OTC sourcing through a Wall Street trading firm paired with institutional-grade prime brokerage custody, is exactly the profile of a family office or sovereign vehicle operating through the same infrastructure as ETF issuers, just without the filing obligation.
The filings show part of the answer. The chain shows the rest.
The gap between the two hides durable demand from shadow holders who bought through a drawdown and still hold through institutional custody, suggesting deeper structural support than any ETF tracker captures.
That same gap also hides an untracked concentration that could crack it.
The post Who’s Really Holding Wall Street’s Crypto? appeared first on BeInCrypto.
TLDR:
- Bitcoin whales and sharks recorded over $30.9B in losses, averaging $337M daily in Q1 2026.
- Early February saw peak capitulation, with realized losses hitting $1.6B in a single day.
- Large holders led the sell-off, showing institutional-level distribution during market stress.
- Market stabilized post-February, with reduced losses and BTC trading within a tight range.
Bitcoin’s largest holders recorded steep realized losses during the first quarter of 2026, reflecting sustained selling pressure across major wallet groups. On-chain data shows whales and sharks collectively locked in over $30.9 billion in losses during the period.
Heavy Losses Driven by Early February Sell-Off
Glassnode data shared in a recent post on X by Coin Bureau pointed to an intense wave of selling in early February.
During this period, realized losses surged to nearly $1.6 billion in a single day. At the same time, Bitcoin’s price dropped sharply, signaling a coordinated market reaction.
Large holders played a central role in this movement. Wallets holding between 100 and 1,000 BTC recorded average daily losses of $188.5 million.
Meanwhile, wallets with 1,000 to 10,000 BTC posted daily losses of $147.5 million. Together, these groups accounted for a combined daily average of $337 million in realized losses.
This pattern suggests that selling activity was not limited to smaller participants. Instead, it involved entities often associated with institutional capital or long-term investors. The scale of these losses points to a broad liquidation phase rather than isolated exits.
At the same time, long-term holders continued to realize losses of nearly $200 million per day. This added further pressure to the market during the quarter. The combined effect marked the heaviest realized losses since the 2022 bear market.
Market Stabilizes as Selling Pressure Eases
Following the sharp downturn in early February, market conditions began to shift. Realized losses dropped into a lower range, typically between $200 million and $600 million per day. This change coincided with Bitcoin’s price stabilizing between $65,000 and $75,000.
As the weeks progressed, the market entered a consolidation phase. Price movements became more controlled, while large-scale panic selling appeared to subside. However, smaller spikes in realized losses continued to appear throughout March.
These repeated spikes reflected ongoing exits from weaker market participants. At the same time, price action remained choppy, with no clear directional trend. Both buyers and sellers appeared active, yet neither side gained sustained control.
By the end of March, realized losses had settled at moderate levels, ranging between $300 million and $500 million. This steady pattern suggested a more balanced environment compared to the earlier volatility.
The data shows that extreme selling conditions eased after the initial shock. Still, the presence of continued losses indicates that market confidence has not fully returned.
The absence of another major spike suggests a pause in aggressive selling rather than a complete shift in sentiment.
Overall, the first quarter of 2026 reflects a transition from heavy liquidation to a more stable but uncertain market phase.
Grayscale Investments posted consecutive endorsements of Sui (SUI) this week, praising its programming model for institutional use while calling current altcoin prices a potential buying opportunity.
The asset manager highlighted SUI alongside Ethereum (ETH), Solana (SOL), Chainlink (LINK), and Avalanche (AVAX) as tokens trading at historically low levels.
Why Grayscale Is Targeting SUI Now
Grayscale argues that financial institutions need speed, efficiency, and reliability, and highlights SUI’s programming model, built to preserve security while scaling performance.
It follows a recent post in which Grayscale Research called current altcoin levels a potentially attractive entry point.
“Grayscale Research believes that the current levels for leading altcoins like ETH, SOL, LINK, SUI, and AVAX, amongst others, offer a potentially compelling entry point,” they said.
Head of Research Zach Pandl expanded on the thesis in a separate report. He noted that the firm’s altcoin basket has fallen roughly 59% from its highs and gained only 2% from its lows since the January 2024 launch of the firm’s crypto ETP.
Pandl also pointed to relative strength in crypto markets during March. While the S&P 500 fell about 5%, the Grayscale Crypto Sectors Index rose about 4%.
“Current levels for leading altcoins…are quite compelling,” read an excerpt in the Grayscale report.
Broader Institutional Context
Grayscale’s SUI conviction extends beyond research. The firm recently launched its GSUI staking ETF on NYSE Arca and also operates trusts for SUI ecosystem tokens DeepBook and Walrus.
That makes SUI one of Grayscale’s deepest single-ecosystem bets outside Bitcoin and Ethereum.
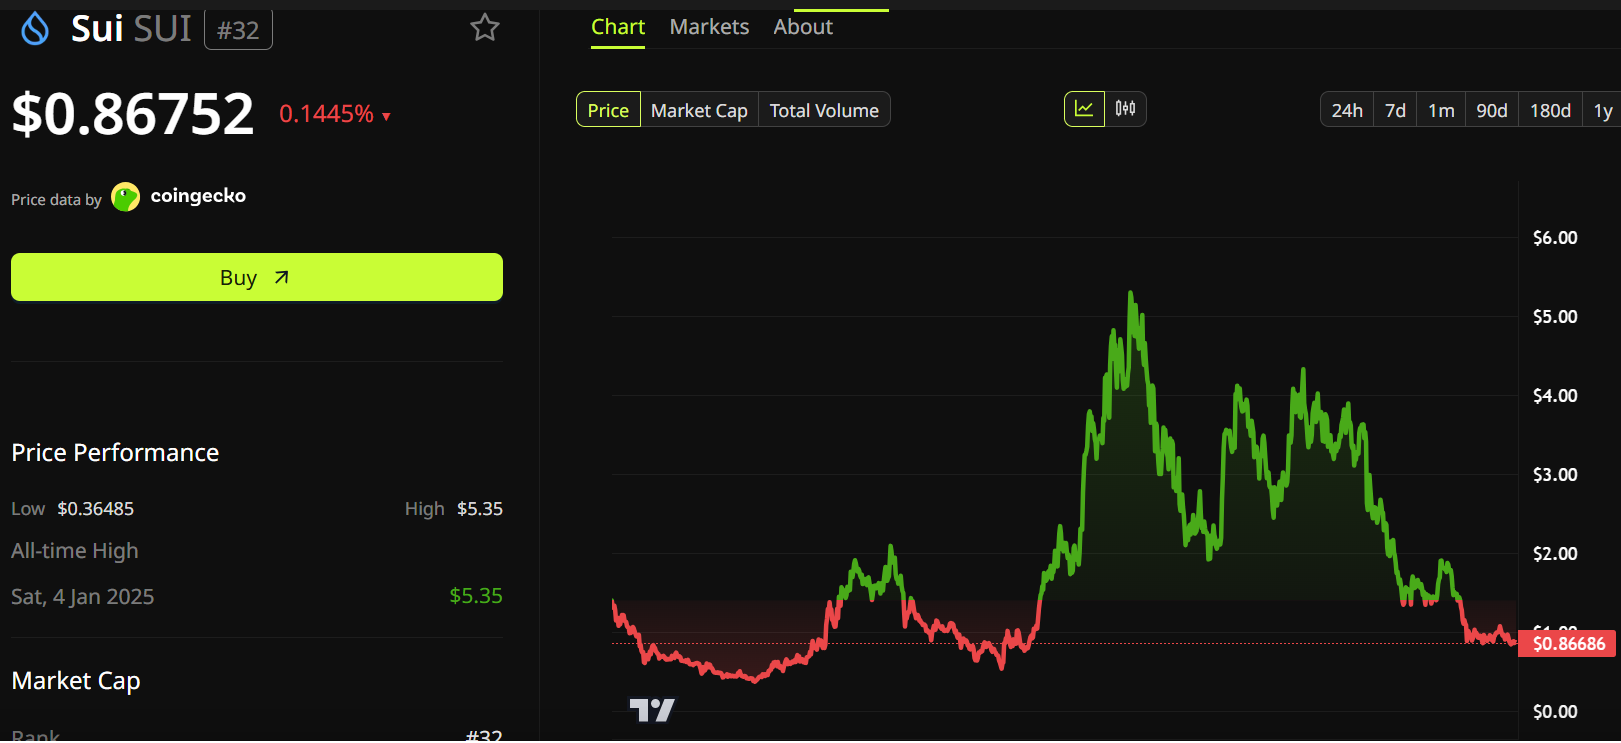
SUI currently trades near $0.87, having dropped over 80% from its cycle peak above $5.36.
Whether Grayscale’s repeated backing helps establish a floor at these levels will depend on whether institutional capital follows the firm’s public thesis.
The post Grayscale Says 5 Altcoins Are at ‘Buy Zone’ Levels appeared first on BeInCrypto.
Crypto World
XRP Price Prediction: Ripple’s 5B Token Reserve Hits Record as Pepeto Presale Goes Viral With $8.68M Raised
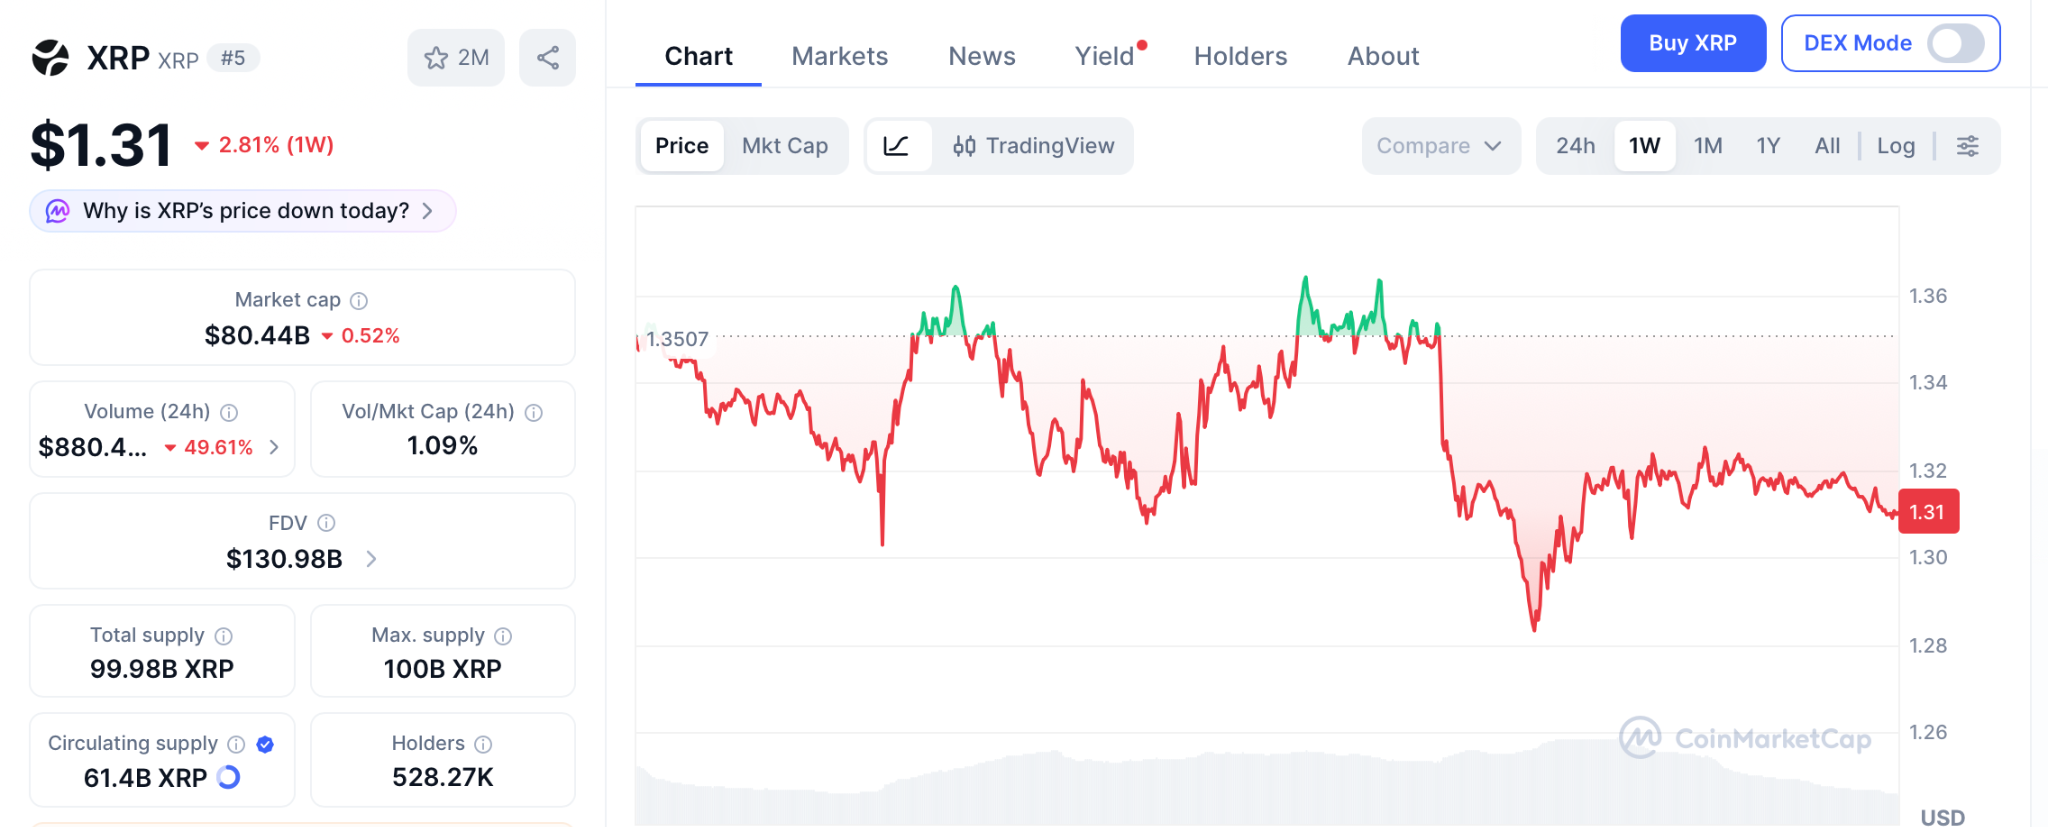
The xrp price prediction just absorbed its most significant supply event in months after Ripple unlocked 1 billion XRP worth $1.34 billion from escrow on April 1 and relocked 700 million the following day, pushing spendable reserves to 5 billion tokens for the first time, surpassing every monthly average from 2025, according to U.Today. With 300 million XRP now free to enter circulation, the supply overhang adds weight to a token already stuck in a tight range near $1.31.
But while XRP builds a case that could take years to fully play out, a different project has pulled $8.68 million in presale capital from wallets that recognized something the wider market has not priced in yet, and the fundamentals behind that conviction deserve attention before the listing reprices everything.
Ripple Pushes Spendable XRP to Record 5 Billion as Supply Pressure Builds
Ripple executed its scheduled escrow release on April 1 in two transactions of 500 million XRP each, then relocked 700 million on April 2, leaving approximately 300 million tokens available for distribution, according to CoinMarketCap. The company’s spendable reserves climbed from 4.968 billion in January to 5.08 billion by March, and the April unlock extends that trend further.
The xrp price prediction gets stronger on institutional timelines, but even aggressive analyst targets place XRP at $3, roughly a 2x from $1.31, and the wallets that created real portfolios in crypto understand that a slow double over years is not where generational returns live.
XRP Price Prediction Builds a Long Term Case While Pepeto Delivers the Entry That Creates the Stories People Remember
Pepeto: The Entry Where Every Signal Points in the Same Direction at the Same Time
The xrp price prediction carries real weight and the escrow dynamics add serious context, but the wallets that turned crypto into generational wealth did not get there by watching large caps grind higher over years. They identified the moment where a proven team, working infrastructure, and presale pricing all existed simultaneously, and they committed before the listing repriced everything. Pepeto is that moment right now.
The cofounder who grew Pepe into an $11 billion success now leads an exchange where AI screens every contract for risk before it goes live, where tokens move freely between Ethereum, BNB Chain, and Solana at zero cost, and where trading fees simply do not exist.
A former Binance executive shapes the exchange architecture while SolidProof verified every contract before the first dollar entered. The xrp price prediction to $3 requires years of institutional settlement volume to materialize. Pepeto operates on its own clock because its exchange model generates demand from the first trade, and BNB proved what that model produces by climbing from its own presale to a $90 billion valuation purely on platform activity.
$8.68 million entered during a correction because the wallets behind it calculated what exchange volume does to a token priced at six zeros. This is the setup that produced BNB millionaires, that rewarded early DOGE holders, that every cycle delivers exactly once. Once Pepeto’s Binance listing goes live, this presale price vanishes and every multiple attached to it closes permanently.
XRP Price Prediction After Escrow Unlock: Constructive Long Term but Timeline Stretches Forward
XRP trades near $1.31 according to CoinMarketCap with the xrp price prediction targeting $1.47, $1.61, and $2.40 on technical completions. The CLARITY Act faces its binary Senate markup in late April.
The escrow unlock and RLUSD’s $1.3 billion market cap reinforce the long-term thesis, but analysts note that scaling requires the CLARITY Act to pass and institutional settlement to grow, placing the largest gains in the 2027 to 2030 window.
Conclusion
Ripple’s treasury strategy is legitimate and the xrp price prediction has earned its constructive case, but the wallets that captured the biggest returns in every cycle did not do it by holding large caps through slow climbs. They locked in the window where a proven founder, live infrastructure, and presale pricing all overlapped before the listing closed it permanently.
Pepeto is that alignment right now with a cofounder behind $11 billion, an exchange verified and approaching launch, and $8.68 million from wallets that studied the fundamentals and acted while fear kept others frozen.
Skipping Pepeto at presale stage most likely means buying after listing at whatever price the early wallets decide to sell at, and watching the returns every trader dreams about belong to someone else. Visit the Pepeto official website while the presale window remains open.
Click To Visit Pepeto Website To Enter The Presale

FAQs
How does Ripple’s April escrow unlock affect the xrp price prediction?
The April 1 unlock added 300M XRP to circulation, creating short-term supply pressure while long-term fundamentals remain constructive.
Is $3 a realistic xrp price prediction target for 2026?
XRP needs BTC past $100K and the CLARITY Act signed into law. Without both, it stays rangebound near $1.30 to $1.50.
Why are XRP investors also entering the Pepeto presale?
The xrp price prediction offers roughly 2x while Pepeto at presale pricing with a $7B cofounder and verified exchange offers multiples XRP cannot match.
Disclaimer: This is a Press Release provided by a third party who is responsible for the content. Please conduct your own research before taking any action based on the content.
TLDR:
- Japan’s 2Y, 3Y, 5Y bond yields hit all-time highs while the 10Y yield reached its highest since 1999.
- The US-Iran conflict has blocked 90–95% of Japan’s oil route, driving inflation fears and BOJ pressure.
- There is currently a 55% probability of a 25BPS BOJ rate hike this month, unsettling crypto markets.
- Each BOJ rate hike since 2024 has caused Bitcoin to drop between 20% and 35% within weeks of the move.
Japan’s bond market crisis is drawing renewed attention from crypto investors worldwide. Bond yields across Japan’s 2-year, 3-year, and 5-year tenors have reached all-time highs.
The 10-year yield also climbed to its highest point since 1999. These shifts are raising concerns about a potential Bank of Japan rate hike. Analysts warn this could trigger a crypto market selloff similar to Q1 2026.
Rising Yields and the Strait of Hormuz Connection
Japan’s bond yields are climbing primarily because of growing inflation expectations. The ongoing US-Iran conflict has severely disrupted shipping through the Strait of Hormuz.
Nearly 90 to 95 percent of Japan’s oil supply passes through that route. With the strait largely blocked, energy prices for Japan are under significant upward pressure.
Higher energy costs feed directly into Japan’s broader inflation outlook. As a result, investors are pricing in the possibility of a hawkish shift from the Bank of Japan.
Crypto analyst Crypto Rover pointed to this connection on X. He noted that rising yields this week coincided with the shipping disruption.
When inflation expectations rise, bond yields typically follow. Japan is particularly vulnerable because of its heavy reliance on imported oil.
That dependence makes any disruption in Middle Eastern shipping a direct economic concern. Investors are now watching BOJ closely for any policy response.
Market data currently shows a 55 percent probability of a 25-basis-point rate hike by the BOJ this month. If the US-Iran situation remains unresolved, that probability is expected to climb further.
A confirmed rate hike could accelerate capital flows out of risk assets. Crypto markets would likely feel that pressure quickly.
BOJ Rate Hikes and Bitcoin’s Crash Pattern
Historical data shows a clear pattern between BOJ rate hikes and Bitcoin price drops. In March 2024, Bitcoin peaked near $74,000 and then fell roughly 20 percent.
In July 2024, it dropped 30 percent within a single week following a BOJ move. January 2025 saw Bitcoin fall 35 percent over several months after another hike.
The most recent example came in December 2025, when Bitcoin lost 34 percent in just six weeks. Crypto Rover attributed these drops to the unwinding of yen carry trades.
Traders who borrowed cheap yen are forced to sell assets when borrowing costs rise. That selling pressure then strengthens the yen and creates further liquidation.
The cycle tends to feed on itself once it starts. Asset prices fall, triggering more margin calls and further selling. Crypto markets, being highly liquid and volatile, often absorb the sharpest drops. Bitcoin and altcoins become exit routes for traders covering yen-denominated positions.
If the BOJ holds off on a hike, markets may stabilize in the near term. However, the bond market crisis in Japan remains an active risk for crypto investors globally.
Man Banned From Planet Fitness Stabs Employee

Cambridge happy to defy ‘brutal’ Boat Race weather and extend men’s winning run

Archbishop of Canterbury uses first Easter sermon to pray for Middle East peace


-

 NewsBeat2 days ago
Steven Gerrard disagrees with Gary Neville over ‘shock’ Chelsea and Arsenal claim | Football
-

 Business2 days ago
No Jackpot Winner and $194 Million Prize Rolls Over
-

 Fashion1 day ago
Weekend Open Thread: Spanx – Corporette.com
-
Entertainment5 days ago
Fans slam 'heartbreaking' Barbie Dream Fest convention debacle with 'cardboard cutout' experience
-

 Crypto World3 days ago
Gold Price Prediction: Worst Month in 17 Years fo Save Haven Rock
-

 Tech6 days ago
The Pixel 10a doesn’t have a camera bump, and it’s great
-
Crypto World4 days ago
Dems press CFTC, ethics board on prediction-market insider trades
-

 Business3 days ago
Login and Checkout Issues Spark Merchant Frustration
-

 Tech6 days ago
Avatar Legends: The Fighting Game comes out in July and it looks pretty slick
-

 Tech5 days ago
Apple will hide your email address from apps and websites, but not cops
-

 Sports4 days ago
Tallest college basketball player ever, standing at 7-foot-9, entering transfer portal
-

 Tech5 days ago
EE TV is using AI to help you find something to watch
-

 Fashion7 days ago
Amazon Sundays: Soft Spring Layers
-

 Politics5 days ago
Should Trump Be Scared Strait?
-

 Sports1 hour ago
India men’s 4x400m and mixed 4x100m relay teams register big progress | Other Sports News
-

 Tech6 days ago
Elon Musk’s last co-founder reportedly leaves xAI
-

 Fashion5 days ago
The Best Spring Trends of 2026
-

 Tech5 days ago
How to back up your iPhone & iPad to your Mac before something goes wrong
-

 Crypto World5 days ago
U.S. rule change may open trillions in 401(k) funds to crypto
-

 Tech5 days ago
Flipsnack and the shift toward motion-first business content with living visuals
You must be logged in to post a comment Login