
Crypto World
Ethereum price slips further as Vitalik Buterin dumps $6.6M ETH


- Ethereum price drops to $2,127 amid market weakness and high volatility.
- Vitalik Buterin sells $6.6M ETH, part of planned funding moves.
- Key support at $2,007, with resistance targets at $2,133 and $2,274.
Ethereum (ETH) is under pressure as the cryptocurrency continues to face a significant pullback.
The price of ETH has dropped to $2,098.91, down 5.6% in the last 24 hours.

This decline is part of a broader downtrend, with Ethereum losing around 28% over the past week and nearly 34% over the past three months.
Trading volume, however, remained elevated at $54.5 billion in the last 24 hours, highlighting strong market activity despite the falling prices.
Vitalik Buterin’s ETH trades
Adding to the market concerns, Ethereum co-founder Vitalik Buterin has sold millions in ETH.
Reports indicate that wallets linked to Buterin moved roughly 2,961.5 ETH, valued at approximately $6.6 million at the time of sale.
vitalik.eth(@VitalikButerin) is dumping $ETH fast!
Over the past 3 days, Vitalik has sold 2,961.5 $ETH($6.6M) at an average price of $2,228 — and the selling is still ongoing.https://t.co/Q9G1lEsdiP pic.twitter.com/C1vBn5UimJ
— Lookonchain (@lookonchain) February 5, 2026
These transactions attracted attention due to the timing of the Ethereum downturn.
Additional reports highlight a separate $29 million ETH transfer, part of a planned reallocation by Buterin.
The movement included converting ETH to wrapped ETH (wETH) and sending smaller amounts to his Kanro charity, which focuses on biotechnology and infectious disease research.
Analysts stress that these transfers are likely strategic funding moves, not panic selling.
Nevertheless, the market has interpreted these large movements as bearish signals.
ETH price analysis
Ethereum has been under pressure due to broader crypto market weakness.
The 24-hour price range for ETH is currently $2,077.42 to $2,258.21, reflecting volatility and uncertainty.
Ethereum’s market capitalisation stands at $257 billion, with a circulating supply of 120.6 million ETH.
The cryptocurrency is still down 57% from its all-time high of $4,946.05 in August 2025.
Despite the decline, Ethereum remains a major player in the crypto ecosystem, with investors closely monitoring large wallet movements.
Ethereum price forecast
Traders are watching key levels for signs of market direction.
The first support level to monitor is $2,007.
If ETH fails to hold this level, it could drop further to the next support at $1,800.
On the upside, $2,133 is the initial resistance level.
A sustained break above this could push Ethereum toward $2,274, with the third resistance at $2,396.
Analysts like CoinLore suggest that maintaining a price above the $2,007 support is critical for any potential recovery.
Conversely, breaking below this level could accelerate selling pressure and test lower price floors.
In conclusion, Ethereum faces a challenging period as both founder wallet activity and broader market trends weigh on the price.
Traders should pay close attention to the support and resistance levels, as these will likely guide short-term movements in ETH.

Crypto World
DAO governance platform Tally shuts down after six years, citing lack of viable market demand: Tally


Tally, which served over one million users and processed $1 billion in payments, is winding down operations as demand for DAO tooling declines.
Tally, a prominent DAO governance platform, has announced it is shutting down after six years of operation. The platform served more than one million users, supported governance across hundreds of organizations, and processed over $1 billion in payments before ceasing operations.
The shutdown marks a significant turning point for the DAO governance sector. Co-founder and CEO Dennison Bertram cited reduced demand for DAO tools, attributing the decline to relaxed regulatory stances and a lack of consumer-facing applications in the broader ecosystem. Tally had previously decided against pursuing an ICO, concluding it no longer made sense as the company prepared to wind down.
Sources: Tally on X
This article was generated automatically by The Defiant’s AI news system from publicly available sources.


Network News
ETHEREUM COMMUNITY DEBATES FOUNDATIONS NEW MANDATE DOCUMENT: The Ethereum Foundation’s new mandate — a sweeping document released to clarify the organization’s role and principles — sparked a torrent of reactions, with supporters praising it as a long-overdue articulation of the blockchain’s ethos and critics saying it reinforces the foundation’s hands-off approach at a time when Ethereum needs stronger leadership to meet the growing needs of institutions. The 38-page document lays out what the foundation described as a constitutional guide to its mission, emphasizing its role as a neutral steward rather than a centralized authority. The mandate frames the foundation’s job as maintaining Ethereum as a decentralized and resilient infrastructure while supporting the protocol layer and public goods across the ecosystem. The document arrived at a pivotal moment for Ethereum. The network has matured into one of the world’s largest crypto ecosystems, and the foundation itself has gone through leadership changes and debates over how actively it should steer development. Reactions on X quickly divided into two camps. Critics were quick to argue the mandate was overly philosophical and failed to address Ethereum’s need to compete for real-world adoption — particularly as institutional interest in blockchain grows. Dankrad Feist, a former Ethereum Foundation researcher and key contributor to Ethereum’s scaling roadmap, said the document does little to address practical business development concerns about how the ecosystem serves real users. Others suggested the mandate risks reinforcing a status quo in which the foundation holds significant soft influence without clearly defined responsibilities. Supporters in the community welcomed the mandate as a reaffirmation of the network’s foundational principles. Chris Perkins, president and managing partner at crypto investment firm CoinFund, said the document helps clarify the foundation’s purpose as a nonprofit steward of the ecosystem. Infrastructure firms in the Ethereum ecosystem also voiced support for the mandate. Nethermind, a company that develops one of blockchain’s core client software implementations, said the document reflects many of the properties institutional buyers already look for when evaluating blockchain infrastructure. — Margaux Nijkerk Read more.
WORLD LAUNCHES AGENTKIT: As AI agents increasingly transact, shop, and act autonomously online — a market that can reach $3 trillion to $5 trillion by 2030 — a key issue comes into focus: how to verify that a real person is behind the activity. Sam Altman–backed identity project World (formerly WorldCoin) says it has the solution. On Tuesday, the company rolled out AgentKit, a developer toolkit that allows AI agents to carry cryptographic proof that they are backed by a unique human, using its World ID system. The product works with x402, a protocol developed by Coinbase and Cloudflare that enables “agentic payments” by embedding stablecoin micropayments into the internet’s communication layer so AI Agents and software can pay each other without human intervention. “Payments are the ‘how’ of agentic commerce, but identity is the ‘who,’” said Erik Reppel, head of engineering at Coinbase Developer Platform and founder of x402. “This is a massive step toward a web where agents aren’t just seen as automated traffic, but as legitimate economic participants.” The move comes as AI agents are rapidly evolving, handling time-consuming and often frustrating tasks from booking reservations to surfing e-commerce marketplaces for the best deals. — Olivier Acuna Read more.
VISA VS. COINBASE ON AI AGENTS: Your AI just made several payments while you read that headline. You approved none of them. Visa processed none of them. And if the crypto industry’s biggest bulls are right, that’s not a bug — it’s the entire future of the internet economy. Coinbase founder Brian Armstrong thinks there will soon be more AI agents than humans making transactions on the internet. Binance founder Changpeng Zhao went further, predicting agents will make one million times more payments than people, all in crypto. The posts landed on the same day last week and lit up crypto X.The core argument is structural. AI agents can’t open bank accounts because banks require identity verification that software cannot provide, whereas a crypto wallet only needs a private key. No KYC, no compliance review, no waiting — and that asymmetry is what Armstrong was pointing at. But the wallet problem is only half the picture. The other half is economics. Agents don’t shop the way humans do. When an AI agent is executing a task — such as researching a topic, coordinating a supply chain, building a report — it might call dozens of specialized APIs in a single session. Each call might be worth fractions of a cent, covering GPU compute time, real-time data feeds, web scraping services, or hiring a sub-agent to handle translation. None of these transactions resembles anything Visa or Mastercard was designed to process. — Shaurya Malwa Read more.
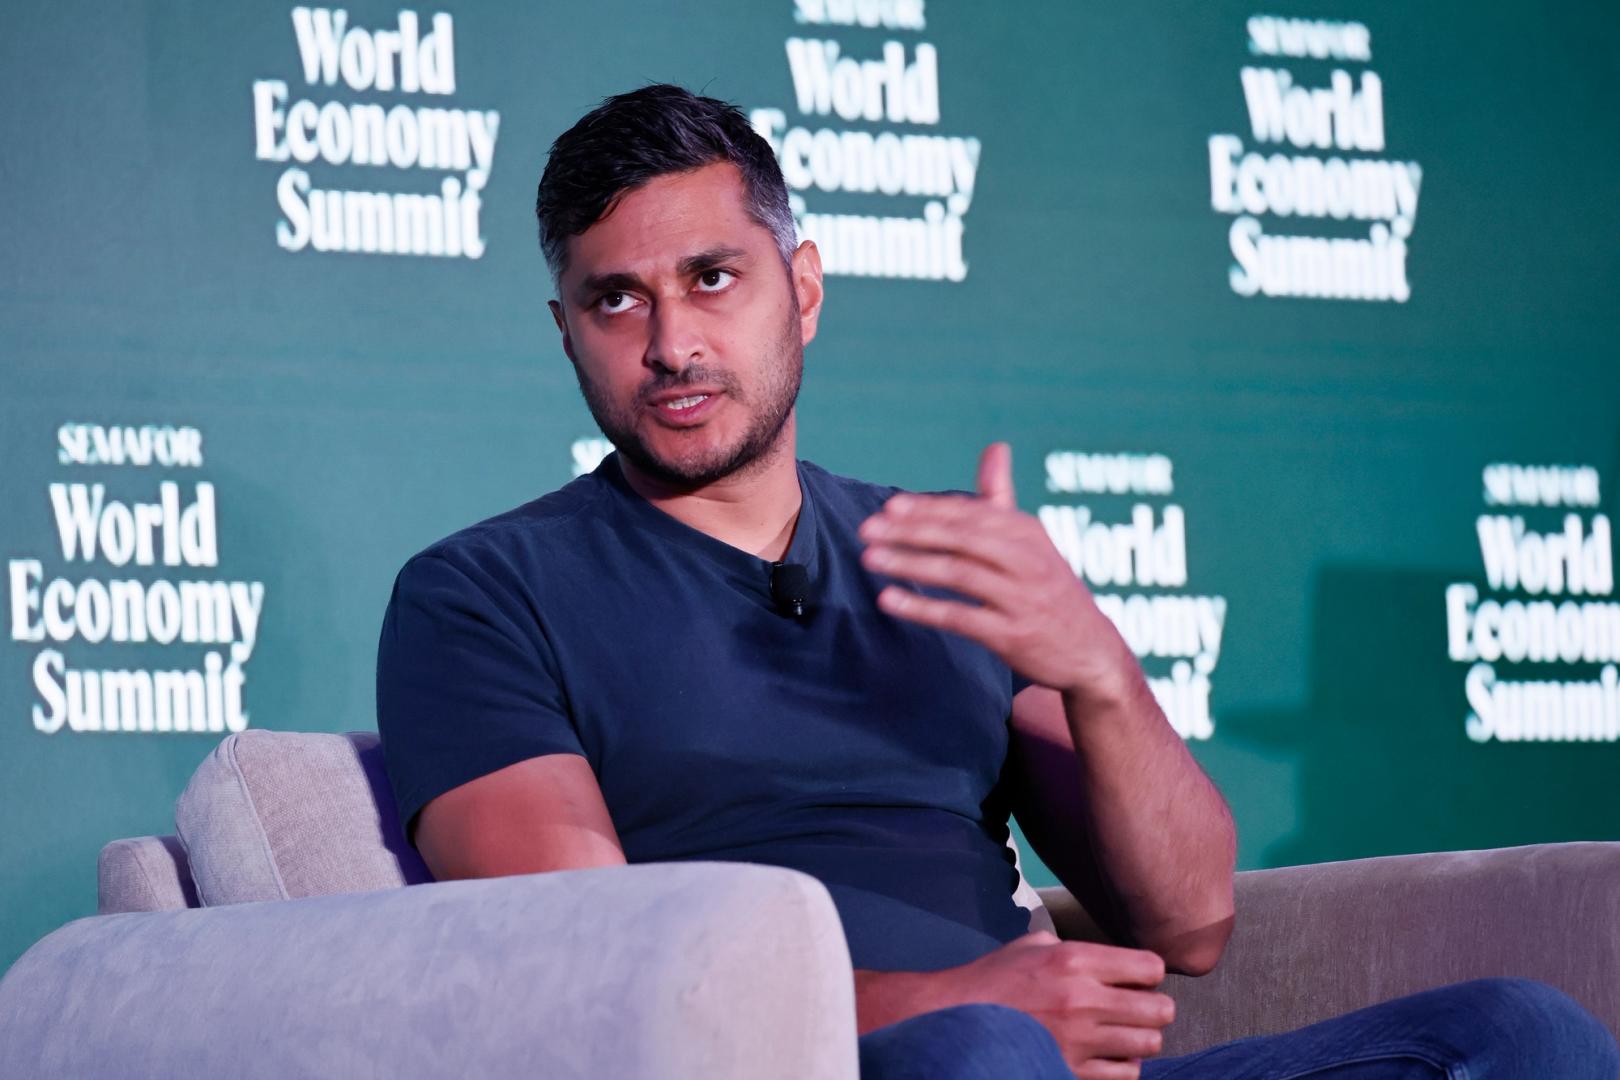
PREDICTION MARKETS AND AI AGENTS: Prediction markets have long promised to aggregate insights about future events. Increasingly, those signals are coming not just from people, but from machines. According to David Minarsch, CEO and co-founder of Valory AG, the team behind the crypto-AI protocol Olas, autonomous AI agents are emerging as powerful tools for trading prediction markets, particularly for retail users trying to compete in an increasingly automated environment. Valory builds products at the intersection of blockchain and multi-agent systems (MAS), and its current focus is Olas, formerly known as Autonolas. The protocol is designed as an infrastructure for autonomous software agents that can run services on blockchains, interact with smart contracts, and cooperate with one another while earning crypto rewards. The broader vision is what Minarsch calls an “agent economy”. A decentralized ecosystem where autonomous AI agents perform useful tasks and generate value for their users. One of the most visible experiments in that vision is Polystrat, an AI agent launched on the prediction-market platform Polymarket in February 2026. The agent trades on behalf of users who self-custody and own it, executing strategies continuously around the clock. “In a nutshell, Polystrat is an autonomous AI agent that trades on Polymarket 24/7 on behalf of its human user,” Minarsch said. The idea is simple: while humans sleep, work or lose focus, the agent keeps trading. — Will Canny Read more.
In Other News
- Mastercard agreed to buy BVNK, a stablecoin infrastructure company, for as much as $1.8 billion as it looks to bolster its use of the digital assets for international payments. By integrating BVNK’s technology, Mastercard aims to connect onchain payments to its global network, enabling use cases such as cross-border transfers, remittances and business-to-business payments, the company said. BVNK provides the technology to bridge traditional fiat systems with blockchain-based transactions, allowing businesses to move money in seconds across more than 130 countries. Its infrastructure, used by firms including Worldpay, Deel and Flywire, processes $30 billion a year, the U.K.-based company said in a blog post. BVNK’s capabilities complement Mastercard’s existing card network, expanding options for moving money across both traditional fiat systems and blockchain-based rails, investment bank William Blair said in a note. — Helene Braun Read more.
- Crypto trading firm GSR said it is acquiring Autonomous and Architech for $57 million, expanding into token advisory and capital markets services. Autonomous will keep its brand and focus on token launch operations, while Architech will anchor a new unit, GSR Digital Asset Advisory. The group will work alongside GSR’s trading, liquidity and asset management businesses. Token launches today often rely on separate firms for structuring, token economics and market making, which can lead to misaligned incentives. The firm said GSR’s model combines those services into one platform, covering governance design, exchange strategy and capital planning. At the same time, many token foundations manage large treasuries without formal financial tools. GSR is expanding into treasury operations, offering support in liquidity planning, risk management and diversification as projects look to move beyond holding their own tokens. — Kristzian Sandor Read more.
Regulatory and Policy
- For the first time, the U.S Securities and Exchange Commission has sought to clearly define different types of crypto assets and how the regulator will approach them, issuing those new standards alongside its sister agency that’s responsible for commodities. The SEC’s interpretive guidance, which doesn’t yet carry the weight of a formal new rule, has been promised by its leader, Chairman Paul Atkins, who was appointed by President Donald Trump to advance a pro-crypto agenda. And it was issued in partnership with the Commodity Futures Trading Commission, just days after the two agencies agreed on a formal relationship in which they plan to regulate crypto and other industries as close partners. “After more than a decade of uncertainty, this interpretation will provide market participants with a clear understanding of how the Commission treats crypto assets under federal securities laws,” Atkins said in a statement. — Jesse Hamilton Read more.
- Phantom, a developer of self-custodial crypto wallets particularly popular in the Solana ecosystem, secured a no-action letter from the U.S. Commodity Futures Trading Commission (CFTC), allowing it to offer users access to certain regulated derivatives markets without registering as a broker. In a statement, the CFTC’s Market Participants Division said it would not recommend enforcement action against Phantom for failing to register as an introducing broker, provided the firm meets a set of conditions. The relief applies to Phantom’s software, acting as a non-custodial interface that connects users directly with CFTC-registered entities, such as futures commission merchants and designated contract markets. Phantom said in a blog post that the letter enables it to integrate access to regulated derivatives and event contracts directly in its app through registered partners, while ensuring users submit orders straight to exchanges. The company emphasized it does not custody customer funds or intermediate trades.— Margaux Nijkerk Read more.
Calendar
- Mar. 24-26, 2026: Digital Asset Summit, New York City
- Mar. 30-Apr. 2, 2026: EthCC, Cannes
- Apr.15-16, 2026: Paris Blockchain Week, Paris
- May 5-7, 2026: Consensus, Miami
- Sept. 29-Oct.1, 2026: Korea Blockchain Week, Seoul
- Oct. 7-8, 2026: Token2049, Singapore
- Nov. 3-6, 2026: Devcon, Mumbai
- Nov. 15-17, 2026: Solana Breakpoint, London


Kraken has frozen its multibillion-dollar initial public offering plan, citing difficult market conditions just months after confidentially filing with the SEC.
Kraken has halted its plans to go public, according to CoinDesk reporting. The move comes despite the company’s parent filing a draft S-1 registration statement with the SEC in November 2025, signaling serious preparation for a U.S. listing at a $20 billion valuation.
Market headwinds have forced crypto companies to reassess public market entry timelines. Kraken had previously been exploring debt financing options and focusing on financial strength and regulatory compliance as preconditions for an IPO, but current conditions have made the path forward uncertain.
Sources: Coindesk
This article was generated automatically by The Defiant’s AI news system from publicly available sources.
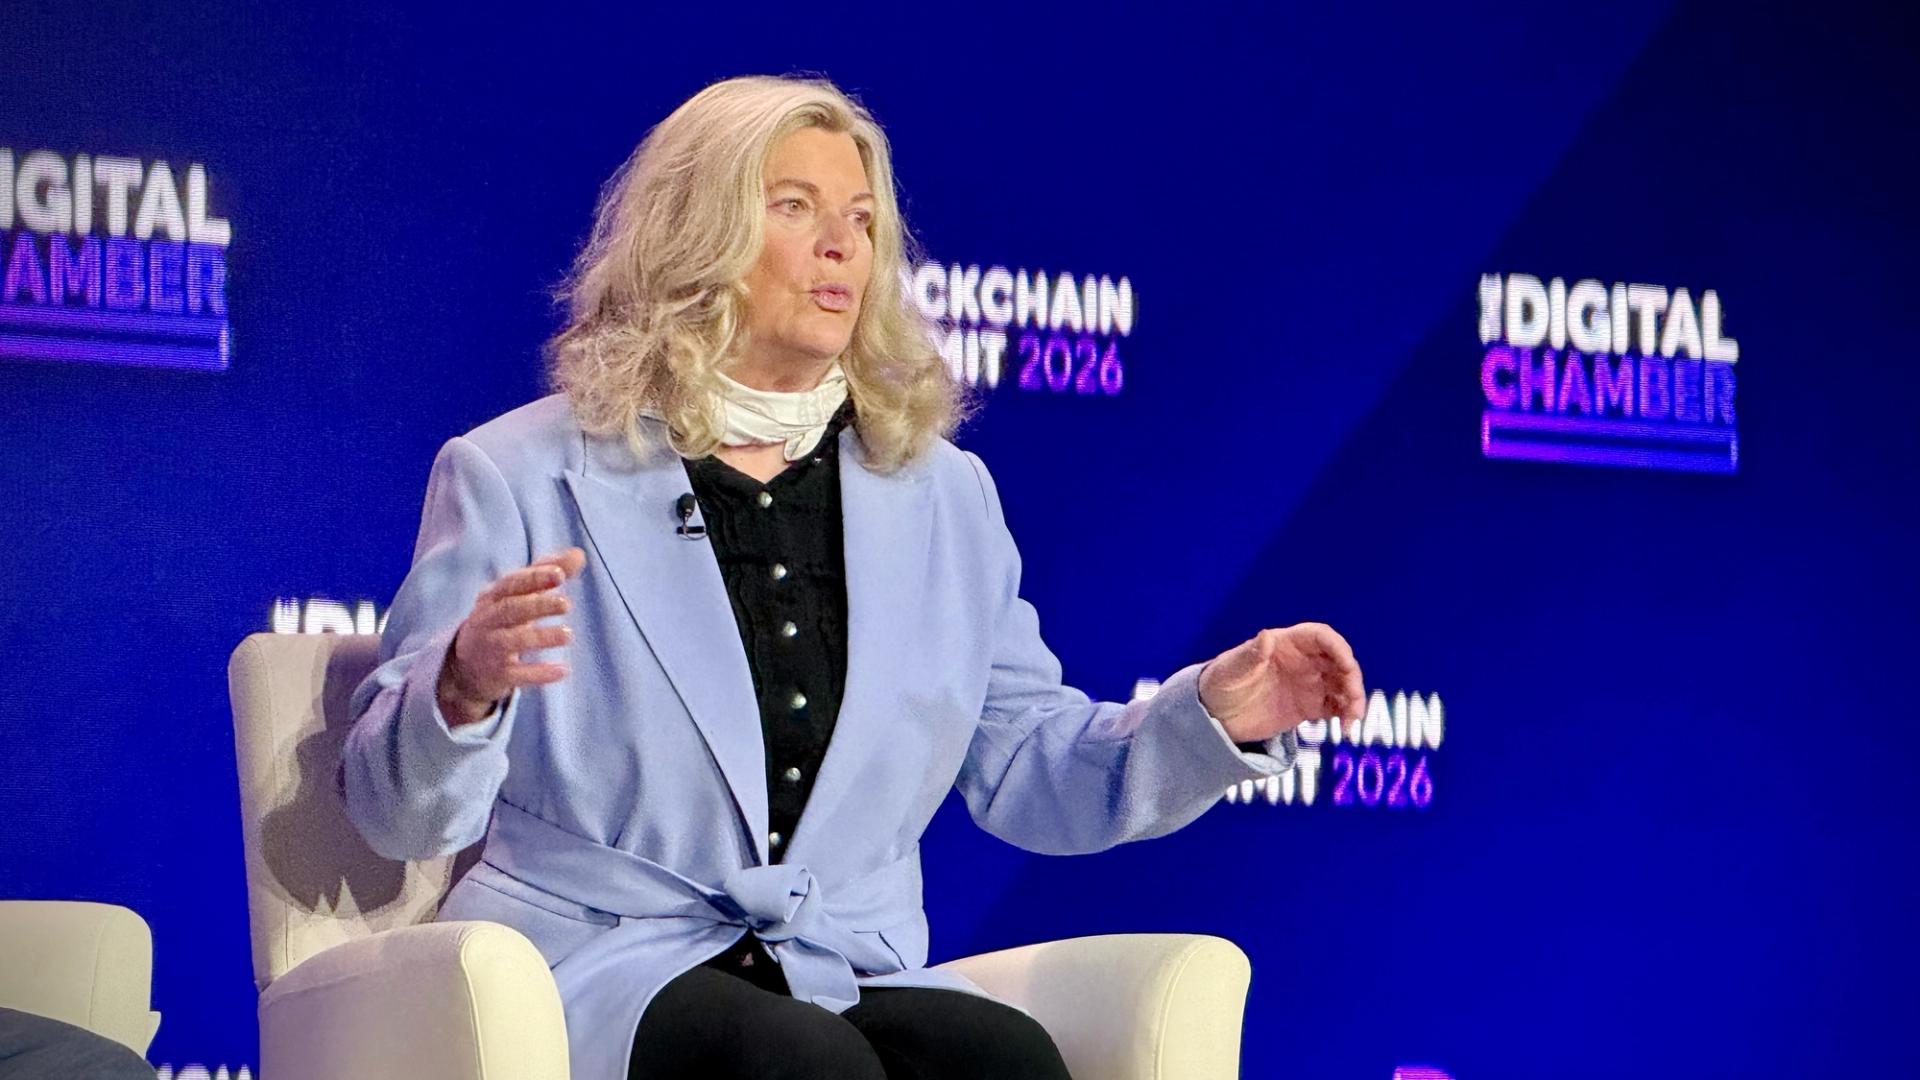

U.S. Senator Cynthia Lummis, a lawmaker at the center of talks on the crypto industry’s top policy goal to pass a market structure bill, said the talks have probably reached the necessary compromises to move the legislation forward.
“We think we’ve got it,” Lummis, the chairwoman of the Senate Banking Committee’s digital assets subcommittee, said at the Digital Chamber’s DC Blockchain Summit on Wednesday. “We really are going to get it out of the banking committee in April.”
Lummis has been deeply involved in months of talks over the Digital Asset Market Clarity Act language. After the process was derailed by bank lobbyists who’d argued that stablecoin yield would threaten their industry’s deposit accounts, much of the debate centered on stablecoin rewards programs that the crypto industry believed were still allowed under last year’s Guiding and Establishing National Innovation for U.S. Stablecoins (GENIUS) Act.
The Wyoming Republican said she believes the final compromise will disallow crypto platforms from offering rewards that use any language that equates them with deposit yield or ties the rewards to the amount of assets a user holds.
“Anything that sounds like banking product terminology will not appear,” she said. She added that she hasn’t seen the most recent language, but she said that Coinbase CEO Brian Armstrong has been “really pretty good about being willing to give on this issue.”
Armstrong and his U.S. exchange, which has leaned heavily into stablecoin rewards programs, had opposed an earlier compromise effort, which had initially helped derail the legislative process on this bill.
Senator Bernie Moreno, another Republican on the committee, said in a video statement at the same event that two of his colleagues on the panel, Democrat Angela Alsobrooks and Republican Thom Tillis are in the final stage of the stablecoin talks, which also involves the White House. Once they all sign off, it’s “go time” for the bill.
Previous disagreements over language governing the security of decentralized finance (DeFi) has also been worked out, Lummis said.
Lummis suggested the legislation will get a hearing after the Senate’s Easter break, pointing to late April. If it does clear such a hearing, known as a markup, that will mark the second necessary committee approval (after the Senate Agriculture Committee had already passed a version earlier this year). Then it gets reworked into a combined version that could eventually face a vote by the overall Senate.
The Senate’s schedule, however, is very much in flux. Both parties are threatening unrelated legislative tussles over other legislation and the war in Iran, which could occupy valuable floor time in the coming weeks. And the Senate’s 2026 session will also be shortened by the midterm congressional elections later in the year.
“We’re going to have this thing done, come hell or high water, before the end of the year,” Lummis said.
UPDATE (March 18, 2026, 15:18 UTC): Adds comments from Senator Bernie Moreno.
Not all voters are sold on crypto, and in Illinois, the crypto industry lobby failed to secure a victory, despite spending millions.
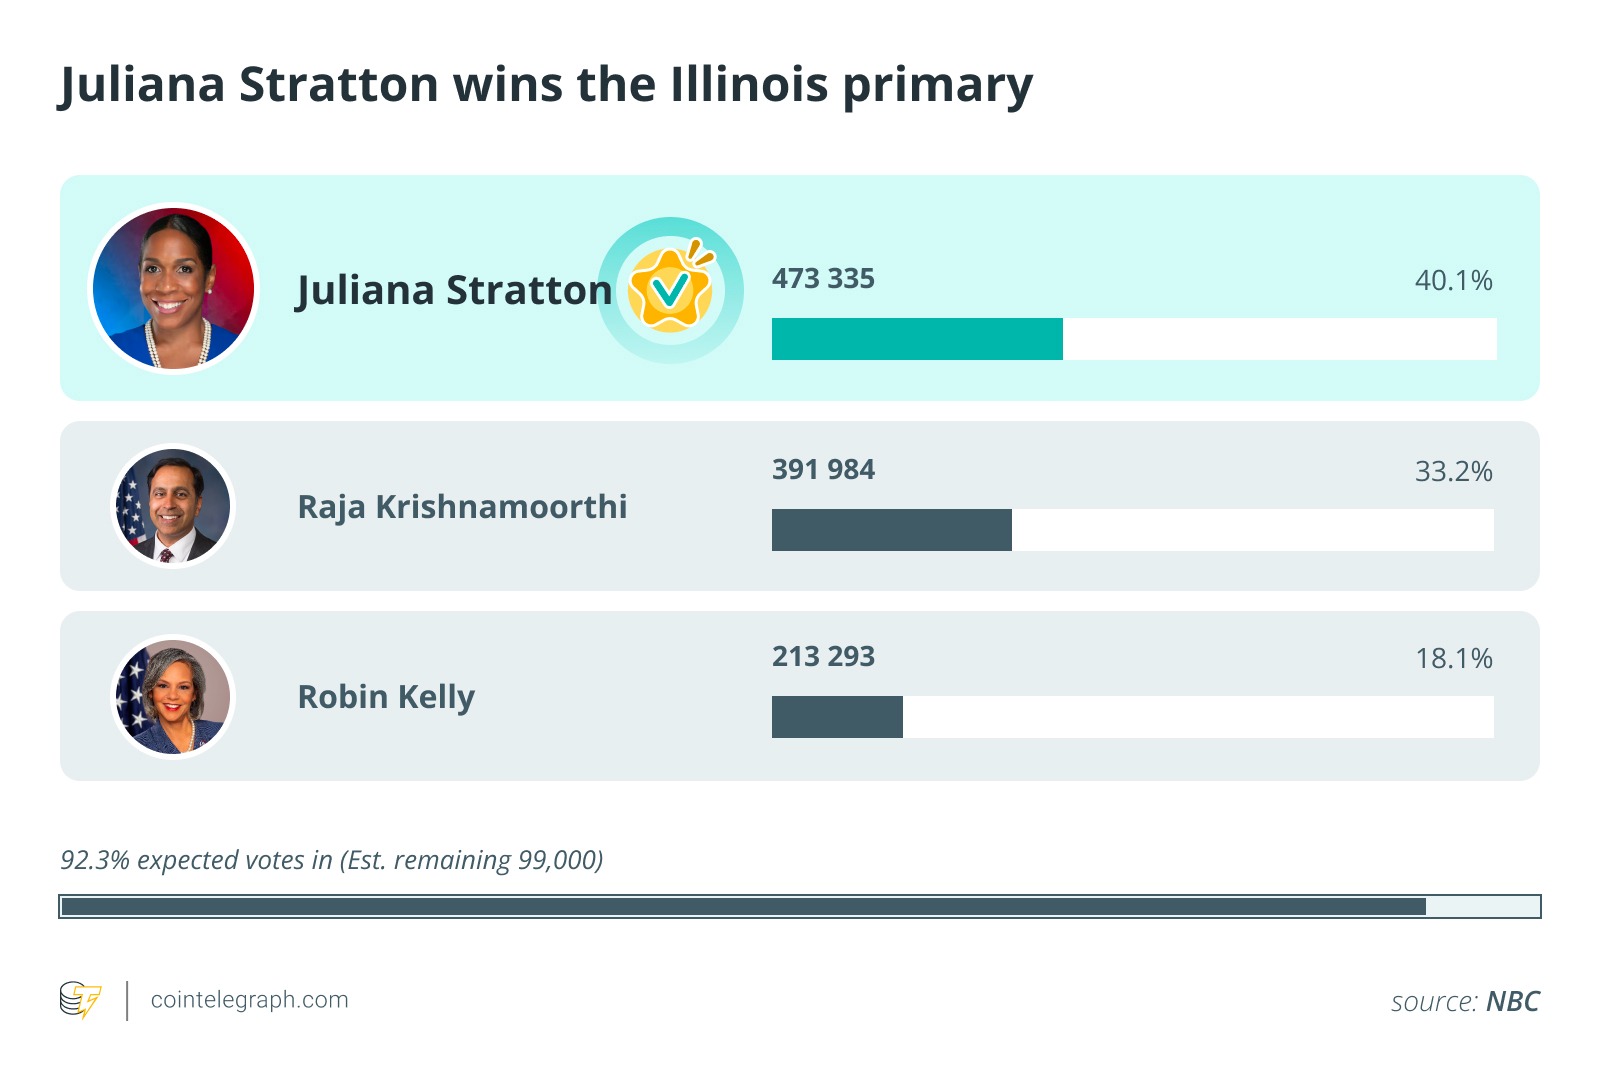
On Tuesday, Illinois Lieutenant Governor Juliana Stratton won a primary election for a rare open US Senate seat in her state. She is expected to win in the general election and take the seat of retiring Democratic Senator Dick Durbin.
In the primary, she won over two other candidates, Representative Raja Krishnamoorthi, who currently represents Illinois’ 8th Congressional district, and Representative Robin Kelly from Illinois’ 2nd.
The crypto lobby spent millions on ads supporting Krishnamoorthi. But ties to the industry may have been more of a liability among progressive voters.

“MAGA-backed crypto bros” finance Krishnamoorthi
In the months leading up to the election, Stratton ran on a progressive platform to oppose US President Donald Trump, and according to the Chicago Sun Times, was the only candidate to openly oppose Immigration and Customs Enforcement (ICE). She also supported a higher minimum wage than Krishnamoorthi or Kelly.
As the primary race got closer, political action committees (PACs), notably Fairshake and Protect Progress, began to pour millions of dollars into the election.
Their motivations were clear. Ensuring that the industry has another crypto-friendly senator could be crucial as the Senate continues to work on the CLARITY Act.
Krishamoorthi was a strong supporter of the GENIUS Act, which provided favorable regulations for stablecoins. He also voted for the CLARITY Act and the Financial Innovation and Technology for the 21st Century Act. This earned him an “A” rating with Stand With Crypto, a cryptocurrency advocacy organization tracking legislative records and attitudes.
Stratton’s campaign drew particular attention to the crypto dollars in the final weeks of the election. The Chicago Sun Times estimated that Fairshake spent over $8 million.
In a March 3 video posted to X, Stratton said that Krishnamoorthi was “relying on his Trump-aligned allies” to tear her down with millions of dollars in attack ads. “His MAGA-backed crypto bros are dumping $7 million into this race to try to stop me. Illinoisans aren’t buying it,” she wrote.
The connection of crypto with Trump and Republicans more broadly is understandable. Marc Andreesen, one of the founders and major donors to Fairshake, has previously expressed his support for Trump, and said he’d be voting for him in 2024. Trump and his family members are themselves part of crypto investment schemes.
And the money doesn’t lie. Fairshake is technically non-partisan, but it has spent more in support of Republican candidates. According to Open Secrets, some 62% of its expenditures support Republicans and oppose Democrats, while 37% of its expenditures support Democrats and oppose Republicans.
This didn’t appear to sit well with voters, nor with other officials representing Illinois. Senator Tammy Duckworth claimed that Krishnamoorthi could be “compromised” by industry interests, an idea the representative denied.
A 2025 poll found that Illinois voters held largely favorable opinions about cryptocurrencies, but many also supported restrictions. Some 47% of Democratic voters would support “policies restricting the growth of cryptocurrency and blockchain technology.”
Overall, 36% of Illinois voters “would be more likely to support elected officials who support restrictions on cryptocurrency and blockchain technology.”
Some election observers pointed out that Stratton had taken significant donations from current Illinois Governor JB Pritzker. But one Chicago voter told The Washington Post, “How many billionaires are supporting Raja?” The governor, by contrast, was “supporting his own lieutenant governor. That’s a nonissue for me. He should be doing it.”
Crypto lobby ramps up as midterms approach
The Illinois primary is just one of many races in which the crypto industry will spend money on ads and other support materials this year.
At the end of 2025, Fairshake alone had $190 million in cash on hand, $131 million of which it raised in the last half of the year.
Lawmakers and activists alike are concerned about the undue influence this could have on the midterm election outcomes. Senator Elizabeth Warren, a noted skeptic of the crypto industry, said that the Illinois primary would be “the test case for whether or not they can buy whatever candidate they want for Senate in Illinois and many of the congressional seats.”
Saurav Ghosh, the director of the Campaign Legal Center, previously told Cointelegraph, “This kind of influence buying ultimately undermines the democratic process by marginalizing everyday Americans, ensuring that their voices and interests take a backseat to the crypto industry’s deregulatory desires.”
Related: Crypto PACs secure massive war chests ahead of US midterms
The increasing association with crypto, MAGA and Trump could also prove problematic for keeping industry interests in Washington. Trump has negative approval ratings in all but 8 of the 50 states. Republicans are also facing predominant disapproval in the polls. If crypto becomes a byword for a Republican economic agenda, it may not work favorably in the midterms.
Political operatives have noted that, for the crypto lobby to retain influence, it needs to remain bipartisan. Democratic Representative Sam Liccardo told Politico last year, “I don’t think anybody in this town would recommend that an industry put their eggs in one party’s basket.”
In Congress, there are still a significant number of Democrats who are pro-crypto, or at the very least, not entirely opposed to the blockchain industry.
Filecoin Foundation chair Marta Belcher said, “Many policymakers on both sides of the aisle support crypto. I don’t think crypto is a partisan issue, just like ‘the internet’ isn’t a partisan issue. I don’t think, in 2025, either party can be ‘anti’ an entire technology if they’re thinking seriously about America’s future.”
Magazine: Big Questions: Can Bitcoin save you from the dreaded Cantillon Effect?


Oil tops $100 as the Hormuz blockade chokes 20% of global supply, forcing a rare Jones Act waiver and stoking inflation that threatens Fed cuts and crypto risk appetite.
Summary
- Brent trades above $104 and WTI near $97, more than 70% above January levels, as the U.S.-Israel war on Iran effectively shuts the Strait of Hormuz.
- The Trump administration’s 60‑day Jones Act waiver lets foreign tankers move fuel between U.S. ports, but estimates suggest only modest relief for gasoline prices.
- Surging energy costs flow into PPI and future CPI, keeping Fed cuts on hold and adding macro pressure to Bitcoin and broader crypto as risk assets reprice.
Oil markets remain in a state of acute stress on Wednesday, with Brent crude trading above $104 per barrel and West Texas Intermediate crossing $97, as the geopolitical fallout from the U.S.-Israel war on Iran continues to reverberate through global energy supply chains. The moves represent a price surge of more than 70% since early January, when Brent was hovering around $60 a barrel — and come as the Trump administration reached for one of its most unconventional policy levers yet: a waiver of the century-old Jones Act.
The White House confirmed Wednesday that it had temporarily authorised foreign-flagged vessels to transport energy commodities — including crude oil, refined oil, natural gas, natural gas liquids, fertilizers, and other derivatives — between U.S. ports for a period of 60 days. The Jones Act, formally the Merchant Marine Act of 1920, ordinarily mandates that goods shipped between American ports be carried exclusively on U.S.-built, U.S.-flagged, and U.S.-crewed vessels. Waivers have historically been reserved for acute national emergencies such as hurricanes or severe supply crises.
The root cause is the effective closure of the Strait of Hormuz, through which approximately 21 million barrels of oil per day — roughly 20% of global supply — normally flow. Since U.S. and Israeli forces struck Iran on February 28, killing Supreme Leader Ali Khamenei and triggering a sweeping Iranian retaliation, Iran’s Islamic Revolutionary Guard Corps has mined the strait, attacked commercial vessels, and vowed to maintain the blockade. The IEA has characterised the disruption as the largest to global oil supply in modern history.
The consequences for physical markets have been severe. Middle Eastern Gulf oil exports have dropped by over 60% in under a week, with producers including the UAE forced to cut output as onshore storage fills and export routes remain blocked. War-risk insurance premiums have surged to levels that make commercial transit economically prohibitive for most vessels, while over 50 million barrels of Gulf crude is now stranded in floating storage. The IEA’s emergency release of 400 million barrels from member-state strategic reserves has done little to reassure markets.
Reuters reported that Brent futures settled up $3.21, or 3.2%, to $103.42 on Monday — before extending gains further through Tuesday and into Wednesday’s session. Analysts at Energy Intelligence have warned of no near-term ceiling if the blockade persists.
The Jones Act waiver is the administration’s domestic response to soaring pump prices, which have risen roughly 60 cents per gallon to $3.60 since the war began. By allowing cheaper foreign tankers to ferry Gulf Coast oil to refineries on the U.S. East Coast and West Coast — routes where the Jones Act constraint is most acute — Washington hopes to ease regional supply bottlenecks. However, the measure’s macroeconomic impact is widely expected to be modest. Bloomberg cited a JP Morgan estimate suggesting the waiver could save East Coast motorists roughly 10 cents per gallon, while OilPrice.com analysts noted it is unlikely to offset the broader global shock driven by the Hormuz blockade itself.
For crypto and financial markets, the oil surge carries compounding implications. Higher energy prices feed directly into the U.S. Producer Price Index — which already printed at double its expected rate on Wednesday — further entrenching the inflation stickiness that is keeping Federal Reserve rate cuts off the table and suppressing risk appetite across asset classes.

Crypto exchange Kraken, which announced four months ago that it planned to go public, has put its plan on hold, according to two people with knowledge of the matter.
The company is still considering an initial public offering, but probably not until market conditions improve, said the people, who spoke on condition of anonymity because the matter is private.
A Kraken spokesperson said, “As we announced in November, we filed confidentially with the SEC, and that is all we can really share.”
The downturn in crypto markets since October, when bitcoin touched a record high, has made companies more cautious about going public or raising fresh capital as declining asset prices and weaker trading volumes weigh on valuations and investor sentiment.
Payward, Kraken’s parent, said it confidentially filed a draft S-1 registration statement with the U.S. Securities and Exchange Commission (SEC) in connection with a proposed initial public offering of common stock on Nov. 19.
That was the day after Kraken said it was valued at $20 billion when it raised $800 million in new funding, including a $200 million investment from Citadel Securities, to support its push to bring traditional financial markets onto blockchain infrastructure.
Last year, a more favorable environment at the SEC helped several major companies, including Circle Internet (CRCL), CoinDesk parent Bullish (BLSH), and Gemini Space Station (GEMI), successfully list their stock. PitchBook data shows that at least 11 crypto IPOs raised a combined $14.6 billion in 2025, a sharp increase from just $310 million in 2024.
In 2026, crypto IPOs are shaping up to be a pivotal test for the sector, with more infrastructure companies planning to go public. So far, however, crypto custodian BitGo is the only digital asset company to have listed, and has seen its stock price slump 44%, partly as a result of a messy market.
Unlike Kraken, Securitize, a tokenization firm that works closely with asset management giant BlackRock (BLK), said it still plans to go public. The firm plans to IPO as soon as it receives the SEC’s green light, likely in the second quarter.
“We already raised $225 million through a PIPE as part of our SPAC merger when market conditions were better and interest in tokenization continues to be strong in spite of market conditions,” Securitize founder and CEO Carlos Domingo told CoinDesk.
If 2025 was defined by listings linked to digital asset treasuries (DATs), 2026 is emerging as a year centered on financial infrastructure, according to White & Case partner Laura Katherine Mann.
In an interview with CoinDesk, she said the next wave of IPO candidates is likely to highlight compliance maturity, recurring revenue and operational resilience, qualities that align more closely with traditional public-market expectations.
Crypto World
The S&P 500 is officially coming to crypto with its first-ever 24/7 perpetual futures product


S&P Dow Jones Indices announced Wednesday that it is bringing the S&P 500 to the blockchain via the Hyperliquid platform, making it easier for investors to trade the most widely tracked equity index 24 hours a day.
The company said it licensed its flagship stock index to Trade[XYZ], which is launching the first officially approved S&P 500 perpetual contract on the Hyperliquid blockchain.
In simple terms, this means eligible non-U.S. investors can trade the S&P 500 onchain, around the clock, without using traditional stock exchanges.
Perpetual futures contracts, or “perps,” are derivative instruments without expiration dates that allow investors to place bets on an asset’s price without owning it, using funding rates, typically every few hours, to keep prices aligned with spot markets. Their infinite duration (perpetual futures contracts never expire, unlike traditional contracts), high-leverage options, and round-the-clock access have made them extremely popular in the crypto space and have generated billions in daily trading volume across exchanges.
For the S&P 500, it is the first time it has been turned into a perpetual product with official backing from S&P. It also uses the firm’s real-time index data, bringing a more traditional finance standard into crypto trading. This guarantees the accuracy of index trading while the traditional market remains closed.
S&P says the goal is to expand where and how its indexes can be used. “This collaboration expands access” to its benchmarks in digital markets, said S&P’s Chief Product Officer Cameron Drinkwater.
24//7 trading
The move opens the door for non-U.S. investors to get leveraged exposure to the S&P 500 through a blockchain-based platform.
For example, if big macro news hits on the weekend, when the market is closed, traders traditionally need to speculate on how the S&P 500 will move on Monday, when the market opens. However, with these new perpetual contracts, traders can place bets immediately and with accuracy as soon as news breaks. Recently, crypto traders were able to trade oil futures on decentralized exchange Hyperliquid on a weekend, when the first missile hit Iran, while traditional oil markets remained closed.
Trade[XYZ] runs on Hyperliquid, a decentralized network built for fast trading. The platform says its markets are always open, unlike stock exchanges that close after hours and on weekends. XYZ markets have exceeded $100 billion since October, with an annualized run rate of more than $600 billion.
The news seems to have helped HYPE, the native token of the Hyperliquid platform. The token is up 2.2% over the past 24 hours, 14.2% over the past 7 days, and 35.5% over the past month. Hyperliquid has recently become a crypto trader’s favorite platform for trading markets outside traditional finance.
Recently, Maelstrom CIO and BitMEX Co-Founder Arthur Hayes said traders are increasingly using Hyperliquid to access markets unavailable on traditional platforms, noting that the HYPE token could reach $150, citing the platform’s strong revenue, real trading activity, and disciplined token supply.
Trade[XYZ] said the S&P 500 is just the starting point as it looks to bring more traditional assets onchain. “The S&P 500 is a natural starting point. It represents the most widely tracked equity index on earth and has been the defining benchmark for global equities for decades,” said Collins Belton, chief operating officer and general counsel of Trade[XYZ]’s parent company.
The announcement builds on S&P DJI’s prior decentralized finance initiatives, including its recent launch of the S&P Digital Markets 50 index, the company said.
Read more: 2026 Marks the Inflection Point for 24/7 Capital Markets


The move follows the EF’s first deployment into the DeFi lending protocol in October, and is part of its updated treasury policy.
The Ethereum Foundation has deposited another 3,400 ETH — worth roughly $7.5 million at today’s prices, near $2,220 — into DeFi lending protocol Morpho, with 1,000 ETH allocated specifically to Morpho Vaults V2, according to a X post from the EF today, March 18.
The move follows an initial deployment in October 2025, when the EF put 2,400 ETH (~$5.3 million) and approximately $6 million in stablecoins into the protocol — bringing the Foundation’s total Morpho commitment to just under $19 million to date.
According to the post, the DeFi deployments are a direct expression of the EF’s refreshed treasury policy, first unveiled in June 2025, which codified a new “Defipunk” framework to guide on-chain capital allocation.
As The Defiant reported at the time, the policy signaled that DeFi was no longer a sideshow for the Foundation — it was putting its ETH where its mouth is, prioritizing permissionless, immutable, audited protocols aligned with cypherpunk values over passive ETH sales to cover operations.
The EF also elaborated on why it chose to deploy in Morpho, and in particular praised Morpho Vaults V2, which launched in September. The Foundation cited the product’s GPL-2.0 open-source license — a deliberate choice, it noted, that makes the codebase permanently able to be audited and forked.
Crucially, Vaults V2’s core contracts are immutable: no admin keys, no upgrade mechanisms, no emergency switches. “The true cypherpunk infrastructure doesn’t ask you to trust its builders, and it removes the need entirely,” the Foundation wrote in its X announcement.
According to DefiLlama, Morpho is currently the second-largest DeFi lending protocol behind Aave, with a total total value locked (TVL) of over $6.9 billion. The protocol has attracted significant institutional interest in recent months, including a deal for Apollo Global Management — which manages nearly $940 billion in assets — to acquire up to 9% of Morpho’s 1 billion total token supply over four years.
The EF framed the Morpho allocation as a question of ecosystem direction:
“What kind of DeFi ecosystem is Ethereum aiming to support, and how should it weigh short-term performance against long-term resilience and openness? Choices like licensing and architecture may seem small, but they shape which of these paths remain viable over time.”
The treasury move comes amid a busy stretch for the Foundation. Just last week, the EF published its 38-page EF Mandate, which sparked debate in the community over whether the Foundation risks taking a backseat at a critical moment for institutional adoption.
In February the EF also pledged to deepen its support for privacy-first, permissionless DeFi, forming a dedicated internal unit to support builders adhering to those principles. The Morpho deposit suggests the commitment is more than rhetorical.
This article was written with the assistance of AI workflows. All our stories are curated, edited and fact-checked by a human.
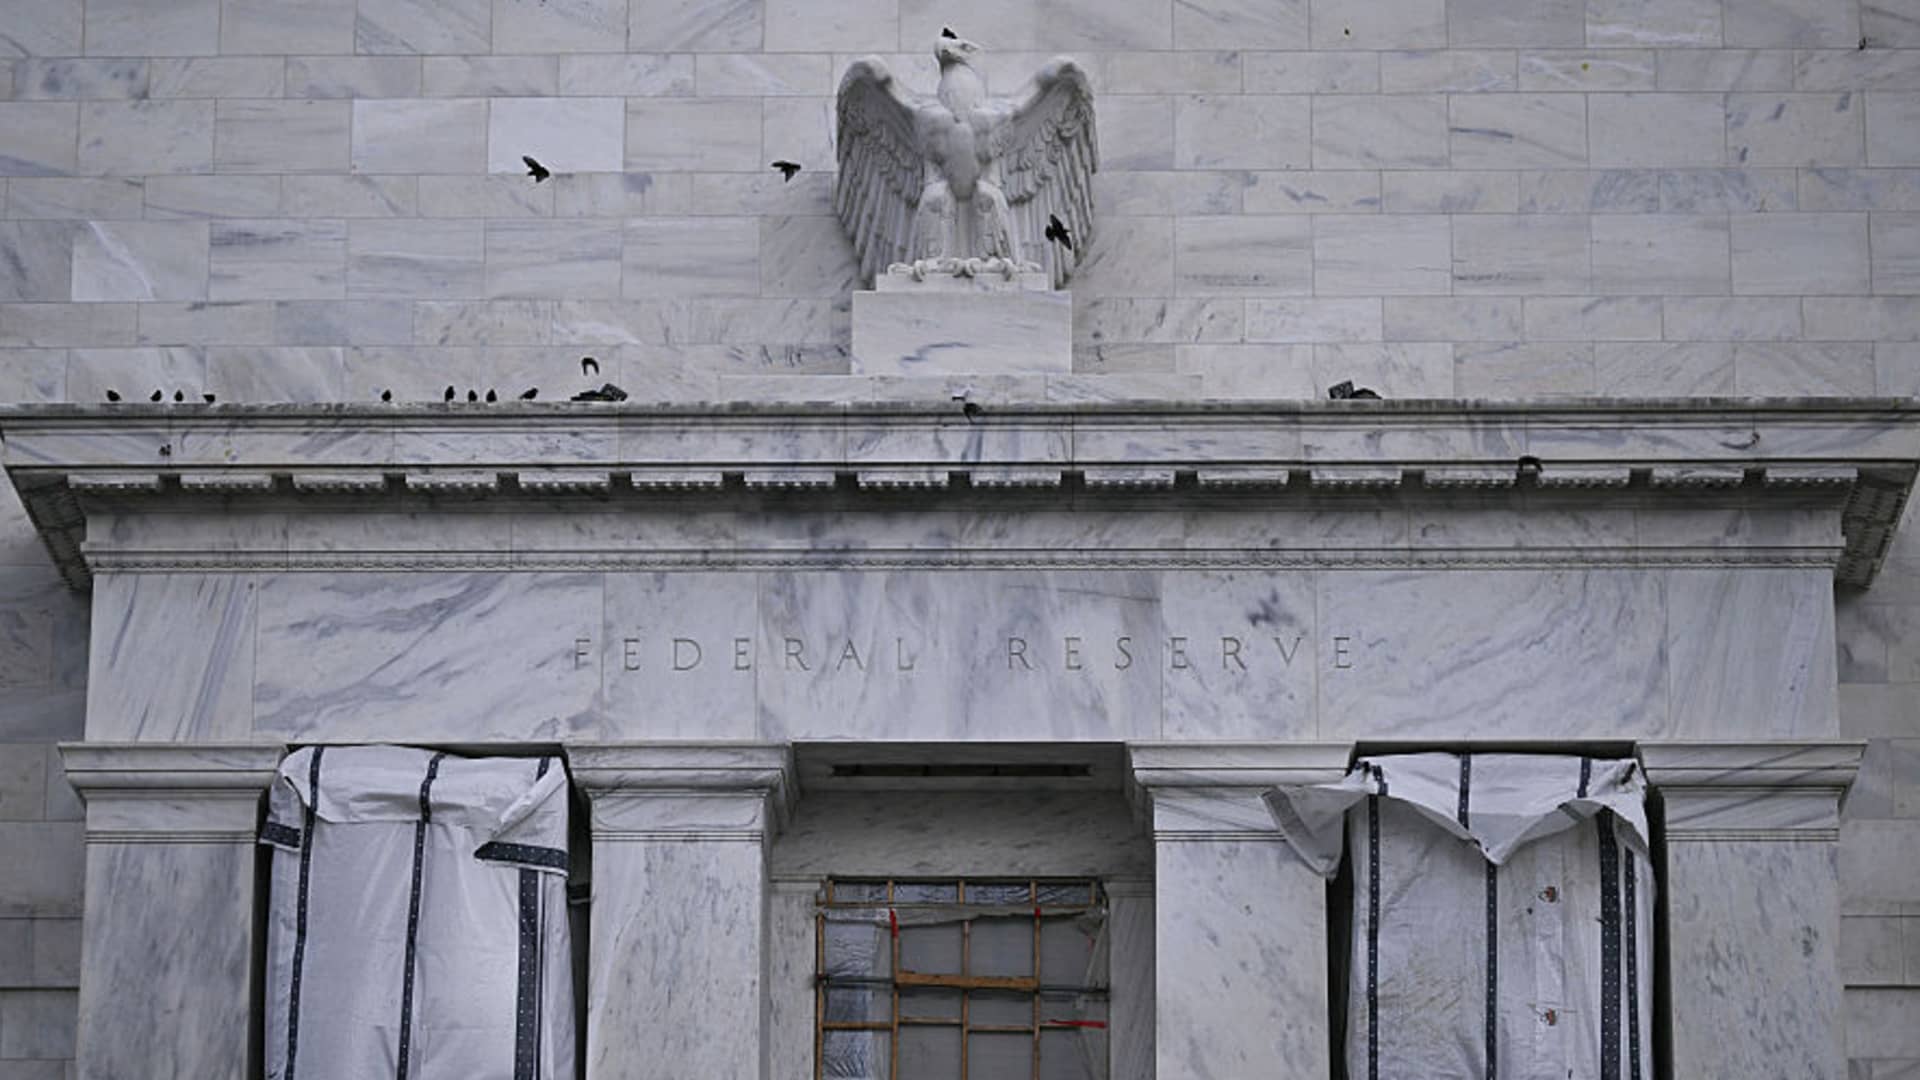
Construction work continues at the Marriner S. Eccles Federal Reserve building in Washington, DC, on Dec. 30, 2025.
Brendan Smialowski | AFP | Getty Images
A hotter-than-expected wholesale inflation reading for February had traders contemplating the possibility that the Federal Reserve won’t be lowering interest rates at all this year.
Following a Bureau of Labor Statistics report that the producer price index posted its biggest gain in a year, futures markets took any realistic chance of a cut off the table until at least December.
Even then, odds of a reduction at the final Fed meeting of the year fell to about 60% as persistently higher inflation — brought on by tariffs, the Iran war and elevated services costs — will keep the central bank on hold. The PPI report came just hours before the Federal Open Market Committee was to release its latest interest rate decision.
The wholesale inflation reading “likely reinforces a hold decision by the Federal Reserve later today but tilts the risk toward a more hawkish tone in today’s FOMC” statement, said Eugenio Aleman, chief economist at Raymond James. “Even if rates are left unchanged and we see multiple dissents, the messaging may lean toward ‘higher for longer,’ especially with energy inflation set to re-enter the picture in coming months.”
Prior to the war that began Feb. 28, traders had been looking for interest rate cuts in both June and September, with an outside possibility of one more in December as the Fed sought to balance its dual mandate of stable prices and low unemployment.
But odds for a June cut have now slumped to just 18.4%, July is down to 31.5% and September to 43.6%, according to the CME’s FedWatch tool, which calculates probabilities using 30-day fed funds futures contracts.
Low conviction
Chances for a December reduction were at 60.5%, indicating that traders are leaning toward a cut, though with a relatively low level of conviction. Historically, the 60% level or above has been associated with Fed moves in either direction.
Futures are implying a 3.43% fed funds rate by the end of 2026, compared to the current level of 3.64%.
To be sure, trading in fed funds futures is volatile, and the Fed could be pushed back into an easing stance if the labor market weakens further. Fed Governors Stephen Miran and Christopher Waller have been advocating for immediate cuts, though the rest of the committee seems more inclined to hold rates where they are until the economic picture clears.
Correction: The Iran war began Feb. 28. A previous version misstated the country’s name.

working in hand in hand with rotten media

He Spent His Life Chasing Money… This Is How It Ended | Deep Life Lesson
Man Utd star Jadon Sancho to be offered shock lifeline after boss changes mind on transfer


-
 Crypto World4 days ago
HYPE Token Enters Net Deflation as HyperCore Buybacks Outpace Staking Rewards
-

 Fashion5 days ago
Weekend Open Thread: Addict Lip Glow
-

 Tech3 days ago
Your Legally Registered ‘Motorcycle’ Might Not Count Under Proposed US Law
-
Sports4 days ago
Why Duke and Michigan Are Dead Even Entering Selection Sunday
-

 Sports7 days ago
PWHL, Senators discussing plan to keep Charge in Ottawa
-

 NewsBeat7 days ago
Residents reaction as Shildon murder probe enters second day
-

 Business3 days ago
Search for Savannah Guthrie’s Mother Enters Seventh Week with No Arrests
-

 Business4 days ago
US Airports Launch Donation Drives for Unpaid TSA Workers as Partial Government Shutdown Enters Fifth Week
-
 Tech23 hours ago
Are Split Spacebars the Next Big Gaming Keyboard Trend?
-
Crypto World4 days ago
Coinbase and Bybit in Investment Talks: Could Bybit Finally Enter the US Crypto Market?
-

 Business4 days ago
Country star Brantley Gilbert enters growing non-alcoholic beer market
-

 Business2 days ago
Australian shares drop as Iran war enters third week
-

 Crypto World2 days ago
Crypto Lender BlockFills Enters Chapter 11 with Up to $500M in Liabilities
-

 Sports5 days ago
College Basketball Best Bets: Conference Tournament Semifinal Picks
-

 Politics6 hours ago
The House | The new register to protect children from their abusers shows Parliament at its best
-

 Crypto World7 days ago
Three Binance Charts May Be Hinting at Bitcoin’s Next Move
-

 Business6 days ago
Trump demands Powell cut rates as Iran conflict raises energy prices
-

 Crypto World6 days ago
Senate Votes to Include CBDC Ban in Bipartisan Housing Bill
-

 Fashion2 days ago
25 Celebrities with Curly Hair That Are Naturally Beautiful
-

 NewsBeat6 days ago
Deane Road crash near Bolton colleges and university


You must be logged in to post a comment Login