
Crypto World
ETHZilla struggles to find footing as Peter Thiel’s Founders Fund exits
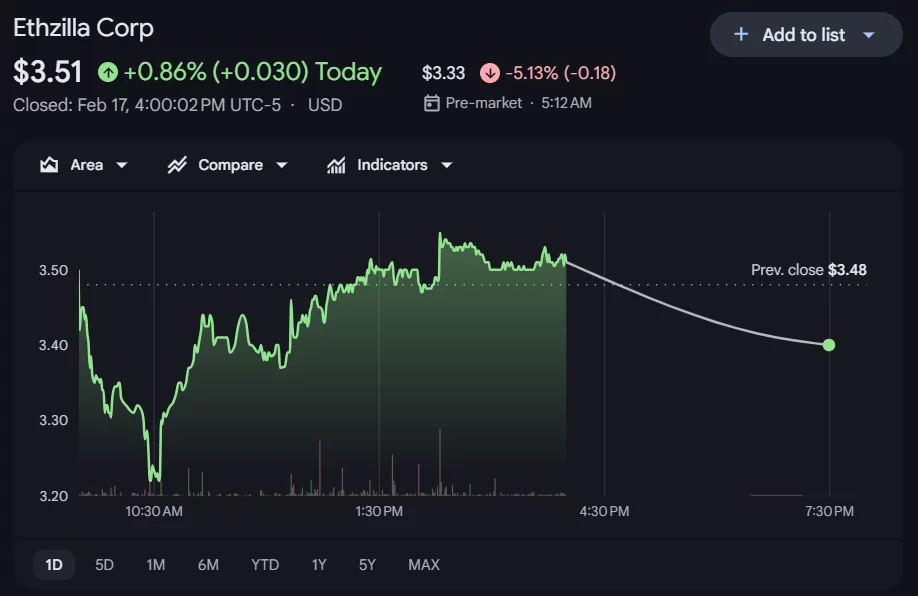
ETHZilla Corp (ETHZ) shares faced intense pressure in pre-market trading this Wednesday following news that billionaire investor Peter Thiel and his venture firm, Founders Fund, have completely liquidated their position.
Summary
- An SEC filing revealed that Peter Thiel and Founders Fund have completely liquidated their 7.5% stake in Ethzilla (ETHZ), triggering a 5.13% pre-market drop to $3.33.
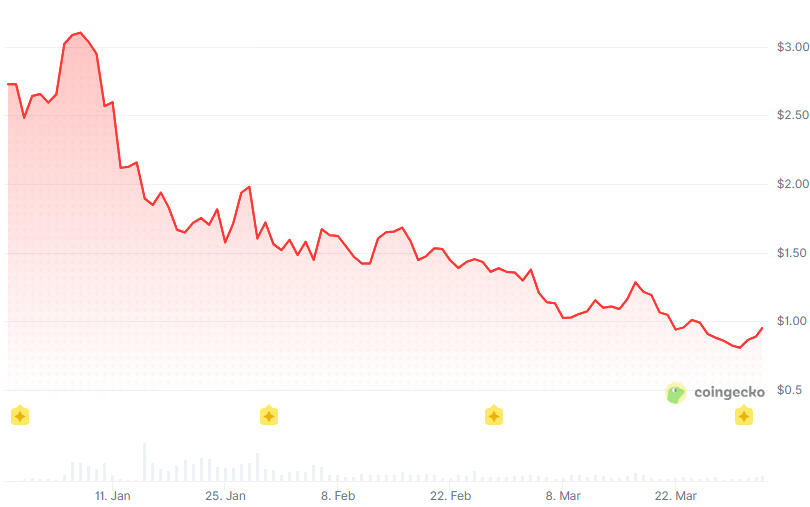
- Originally a biotech firm (180 Life Sciences), Ethzilla’s high-leverage pivot to a “corporate Ethereum treasury” model has faltered, with the stock currently down 97% from its 2025 highs.
- Amidst heavy debt and market volatility, the company is attempting to stabilize by pivoting again, this time toward tokenizing jet engines and home loans, though investor confidence remains shaken.
The Thiel exodus: Founders Fund liquidates stake in ETHZilla
The stock, which has already plummeted over 97% from its 2025 highs, hit a pre-market low of $3.33, representing a 5.13% drop from its previous close.

The sell-off was triggered by a late Tuesday SEC filing revealing that Thiel’s entities now hold zero shares in the company. This marks a dramatic reversal from August 2025, when the fund disclosed a significant 7.5% stake.
At the time, Thiel’s entry was seen as a massive vote of confidence for ETHZilla’s pivot from biotechnology to a corporate Ethereum (ETH) treasury model.
The massive sell-off marks a dramatic fall from grace for the firm, which rebranded from 180 Life Sciences last year to become a high-leverage Ethereum treasury. While the initial pivot drew over $425 million in institutional backing, the recent liquidation of its ETH holdings has left investors questioning the sustainability of its ‘crypto-first’ balance sheet.
Crisis in the ETH treasury model
The full exit by Founders Fund underscores the growing skepticism surrounding companies that use high-leverage strategies to accumulate Ethereum. While similar “Bitcoin treasury” plays have remained popular, Ether-focused firms like ETHZilla have struggled under the weight of market volatility and debt obligations.
ETHZilla has recently attempted to diversify its business to stabilize its balance sheet. Recent moves include:
- Asset Tokenization: Launching “ETHZilla Aerospace” to tokenize leased jet engines.
- Debt Repayment: Liquidating over 24,000 ETH in late 2025 to settle convertible bond obligations.
- Real Estate: Acquiring modular home loan portfolios for on-chain yields.
Despite these efforts to pivot toward Real World Assets (RWA), the market appears focused on the loss of its most prominent institutional backer. For many investors, Thiel’s departure signals that the “Saylor-style” accumulation strategy for Ethereum may be facing a structural breakdown.


Summary
- Fundrise’s Innovation Fund VCX will be tokenized into a new asset called VCXx in partnership with Kraken’s xStocks platform.
- VCXx will provide onchain exposure to late-stage private tech companies such as SpaceX, OpenAI, Anthropic, and Databricks through a single token.
- Eligible investors will be able to buy VCXx using USDG or U.S. dollars, with tokens designed to integrate into broader onchain trading, collateral, and DeFi strategies.
Technology investment platform Fundrise is partnering with crypto exchange Kraken to tokenize shares of its Fundrise Innovation Fund VCX, according to reporting from Crowdfund Insider. The deal will see the publicly listed VCX vehicle, which trades on the NYSE, wrapped into a blockchain-based representation on Kraken’s tokenized equities venue xStocks under the ticker VCXx.
Kraken’s xStocks framework, powered by Payward, already offers more than 100 fully backed tokenized U.S. stocks and ETFs, and the addition of VCXx marks its first move into tokenized access to a diversified private-tech portfolio. Fundrise CEO Ben Miller said, “We built VCX to act as a bridge between the public and private markets,” arguing that tokenizing the fund on xStocks lets “individual investors own a piece of the best private technology companies in the world” via a regulated structure.
The VCXx token will be issued by Backed Assets (JE) Limited and offered via Payward Digital Solutions, with trading set to go live on xStocks “in the coming days.” Fundrise and Kraken say VCXx will be fully backed by underlying VCX shares and designed to move seamlessly between centralized exchanges, self-custodied wallets, and onchain applications.
According to xStocks’ launch materials, VCXx will be purchasable using USDG — Kraken’s on-platform dollar-denominated token — or U.S. dollars, giving eligible investors outside the U.S. a way to gain exposure to VCX’s portfolio. That portfolio includes stakes in late-stage private firms such as SpaceX, OpenAI, Anthropic, and Databricks, bundling them into a single liquid, tokenized asset that can also be used as collateral or integrated into automated strategies.
Fundrise’s Innovation Fund was launched to open up late-stage private tech deals that are typically reserved for institutions and ultra‑high‑net‑worth investors. By bringing VCX onchain, xStocks and Fundrise are extending tokenized equities beyond public stocks into private-market exposure, a segment Kraken has called “one of the most sought‑after and historically inaccessible parts of the market.”
The partners argue that tokenizing VCX shares allows diversified private-tech exposure to be accessed, transferred, and integrated into DeFi with the same flexibility as other digital assets. If VCXx gains liquidity, it could become a template for how other listed vehicles and funds wrap private holdings into programmable, globally tradable tokens without dismantling existing regulatory structures.
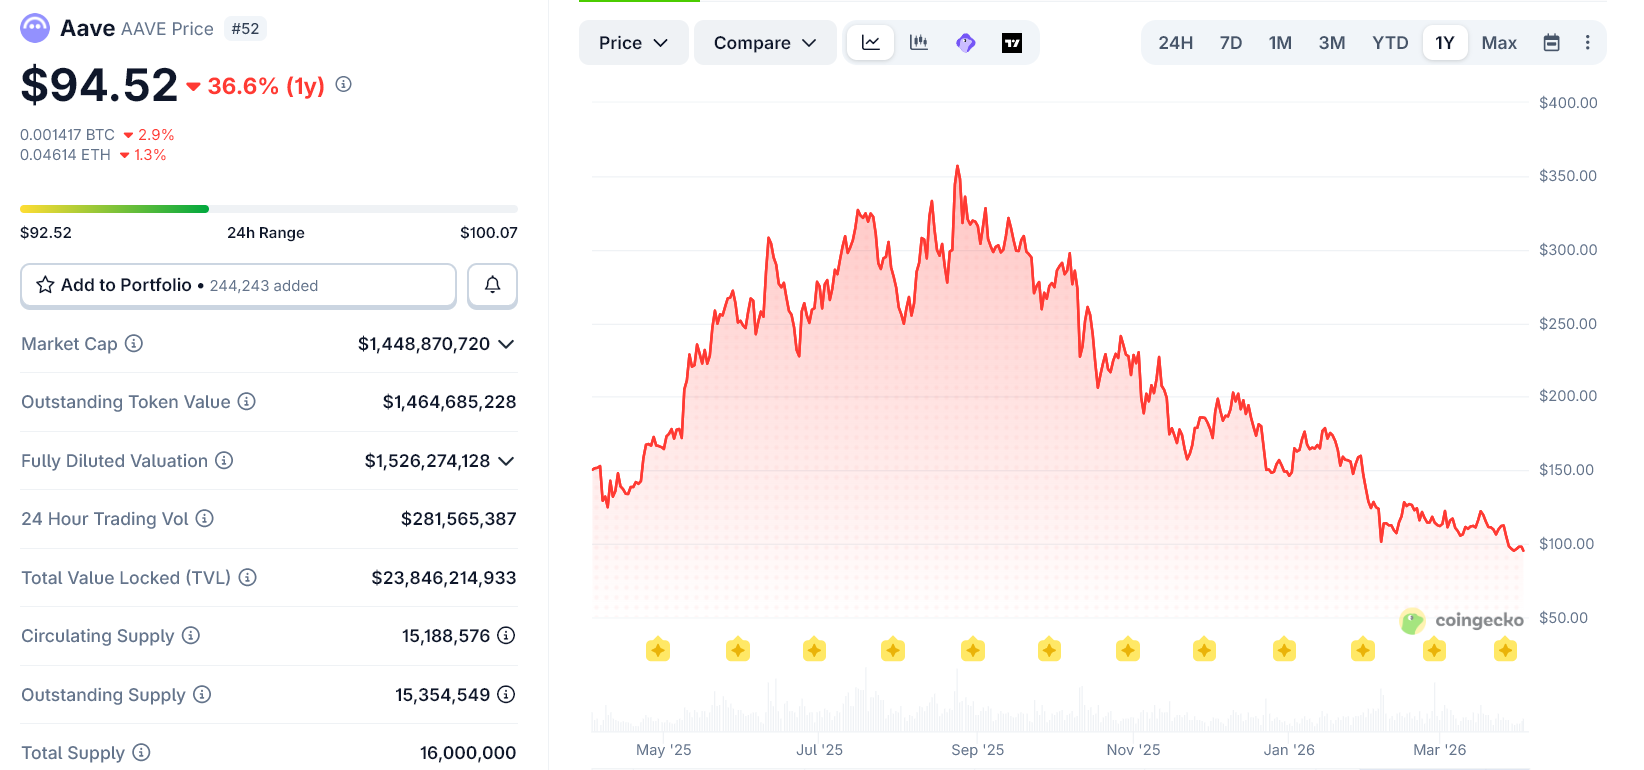
The price of AAVE has dropped to a 52-week low, falling below $95 even as Aave rolled out its long-awaited V4 upgrade this week.
The decline extends a broader downtrend, with the token losing over a third of its value in the past year.
The timing stands out. Aave V4 is one of the protocol’s biggest upgrades to date. In simple terms, it turns Aave from a collection of separate lending pools into one large shared liquidity system.
That means users borrow from a bigger pool, get better rates, and use capital more efficiently. It also introduces smarter pricing, where safer collateral gets cheaper loans and riskier assets cost more to borrow.
The system is also easier to expand, allowing new products and markets to plug in faster.
However, the market has not responded. The drop suggests that fundamentals alone are not driving price action in crypto right now.
Traders are still reacting more to macro conditions, liquidity, and broader sentiment than to protocol upgrades.
In reality, V4’s impact is likely to play out slowly. It improves Aave’s utility, makes the platform more competitive, and strengthens its position as core DeFi infrastructure.
But that does not guarantee immediate demand for the token itself.
The disconnect is clear. Aave’s network is becoming more useful and advanced, while its token continues to trade like a macro-sensitive asset rather than a direct reflection of that progress.
The post AAVE Hits Yearly Low Despite Major V4 Upgrade Rollout appeared first on BeInCrypto.


Elliptic said Thursday the $285 million Drift Protocol exploit, the largest this year, carries “multiple indicators” of North Korea’s state-sponsored DPRK hacker group involvement.
The research firm pointed specifically to onchain behavior, laundering methodologies and network-level signals, all of which align with previous state-linked attacks.
Drift Protocol, whose token has dropped over 40% to roughly $0.06 since the hack, is the largest decentralized perpetual futures exchange on the Solana blockchain.
“If confirmed, this incident would represent the eighteenth DPRK act Elliptic has tracked this year, with over $300 million stolen so far,” the report said.
“It is a continuation of the DPRK’s sustained campaign of large-scale cryptoasset theft, which the U.S. government has linked to the funding of its weapons programs. DPRK-linked actors are believed to be responsible for billions of dollars in cryptoasset theft in recent years,” Elliptic added.
Hours earlier, Arkham data showed that over $250 million had been moved from Drift to an interim wallet, then to various other addresses.
In December, a Chainalysis report revealed DPRK hackers stole a record $2 billion of crypto in 2025, including the $1.4 billion Bybit breach, representing a 51% increase from the previous year. The U.S. Treasury Department last month said North Korea uses the stolen assets to fund the country’s weapons of mass destruction program.
Rather than focusing on the exploit itself, Elliptic’s analysis highlights a familiar operational pattern. The activity appears “premeditated and carefully staged,” with early test transactions and pre-positioned wallets preceding the main event.
The report explains that once executed, funds were rapidly consolidated and swapped, bridged across chains, and converted into more liquid assets, reflecting a structured, repeatable laundering flow designed to obscure origin while maintaining control.
A central challenge, Elliptic notes, is Solana’s account model. Because each asset is held in a separate token account, activity tied to a single actor can appear fragmented across multiple addresses. Without linking these, investigators risk seeing “fragments of the attacker’s activity, not the complete picture.”
This is where Elliptic’s report highlights the clustering approach, which connects token accounts back to a single entity, allowing exposure to be identified regardless of which address is screened. In an incident involving more than a dozen asset types, that entity-level view becomes critical.
The case also emphasizes, Elliptic adds in its report, how laundering has become inherently cross-chain. Funds moved from Solana to Ethereum and beyond, demonstrating the need for what Elliptic described as “holistic cross-chain tracing capabilities.”

TLDR
- Ethereum derivatives recorded more than $1 billion in sell volume within one hour after Trump’s speech on Iran.
- Ethereum’s price fell over 4% as traders increased short positions in the derivatives market.
- Binance accounted for nearly $968 million of the total Ethereum derivatives sell activity.
- The S&P 500 lost about $500 billion in market value shortly after the remarks.
- Spot Ethereum ETFs reported more than $7 million in net outflows on April 1.
Global financial markets reacted sharply after President Donald Trump outlined potential military action against Iran within weeks. Ethereum followed the broader risk-off move as traders rushed to exit positions. Data from CryptoQuant showed heavy selling in derivatives within a single hour.
Ethereum Derivatives Record $1B in Rapid Sell Orders
Crypto markets shifted quickly after Trump addressed the nation and detailed plans for continued strikes on Iran. He said Operation Epic Fury had weakened Iran’s military and reduced missile capabilities. He also warned that stronger attacks would continue over the next two to three weeks.
As a result, traders moved rapidly across risk assets and pushed US Treasury prices higher. At the same time, the S&P 500 erased about $500 billion in market value within minutes. Ethereum derivatives then recorded more than $1 billion in sell volume within one hour, according to CryptoQuant.
CryptoQuant reported that about $968 million of that sell volume occurred on Binance. Binance currently handles the largest share of global crypto trading activity. The surge in orders increased short-term bearish pressure across futures markets.
Consequently, Ethereum’s price fell more than 4% during the same period. The sharp movement reflected aggressive positioning in leveraged products. CryptoQuant stated that markets now face “a period of extreme uncertainty and volatility.”
The firm added that price action has become “increasingly erratic and unstable.” Traders reacted directly to geopolitical developments and shifting liquidity conditions. The derivatives spike marked one of the largest hourly sell waves this month.
ETF Outflows Add Pressure on Ethereum
Institutional flows also reflected weaker sentiment toward Ethereum products. Spot Ethereum ETFs posted eight consecutive days of net outflows before briefly reversing direction. During the following two sessions, these funds recorded short-lived inflows.
However, the rebound did not hold as outflows returned. On April 1, spot Ethereum ETFs registered more than $7 million in net withdrawals. The renewed selling aligned with rising geopolitical tension and reduced risk appetite.
Bitunix analysts described the current environment as a shift in market structure. They stated, “The market has entered a new phase dominated by ‘supply chain destruction.’” They added that energy, metals, and geopolitics now push inflation expectations higher without supporting growth.
The analysts said this dynamic creates a mismatch between risk pricing and economic support. They explained that asset prices now respond mainly to liquidity conditions. They also stated that markets lack a clear policy anchor or exit path from conflict.
Ethereum’s derivatives data and ETF flows both reflected mounting strain across trading venues. Traders reduced exposure as headlines intensified across global markets. The latest ETF outflow data on April 1 marked the most recent confirmed movement in institutional positioning.

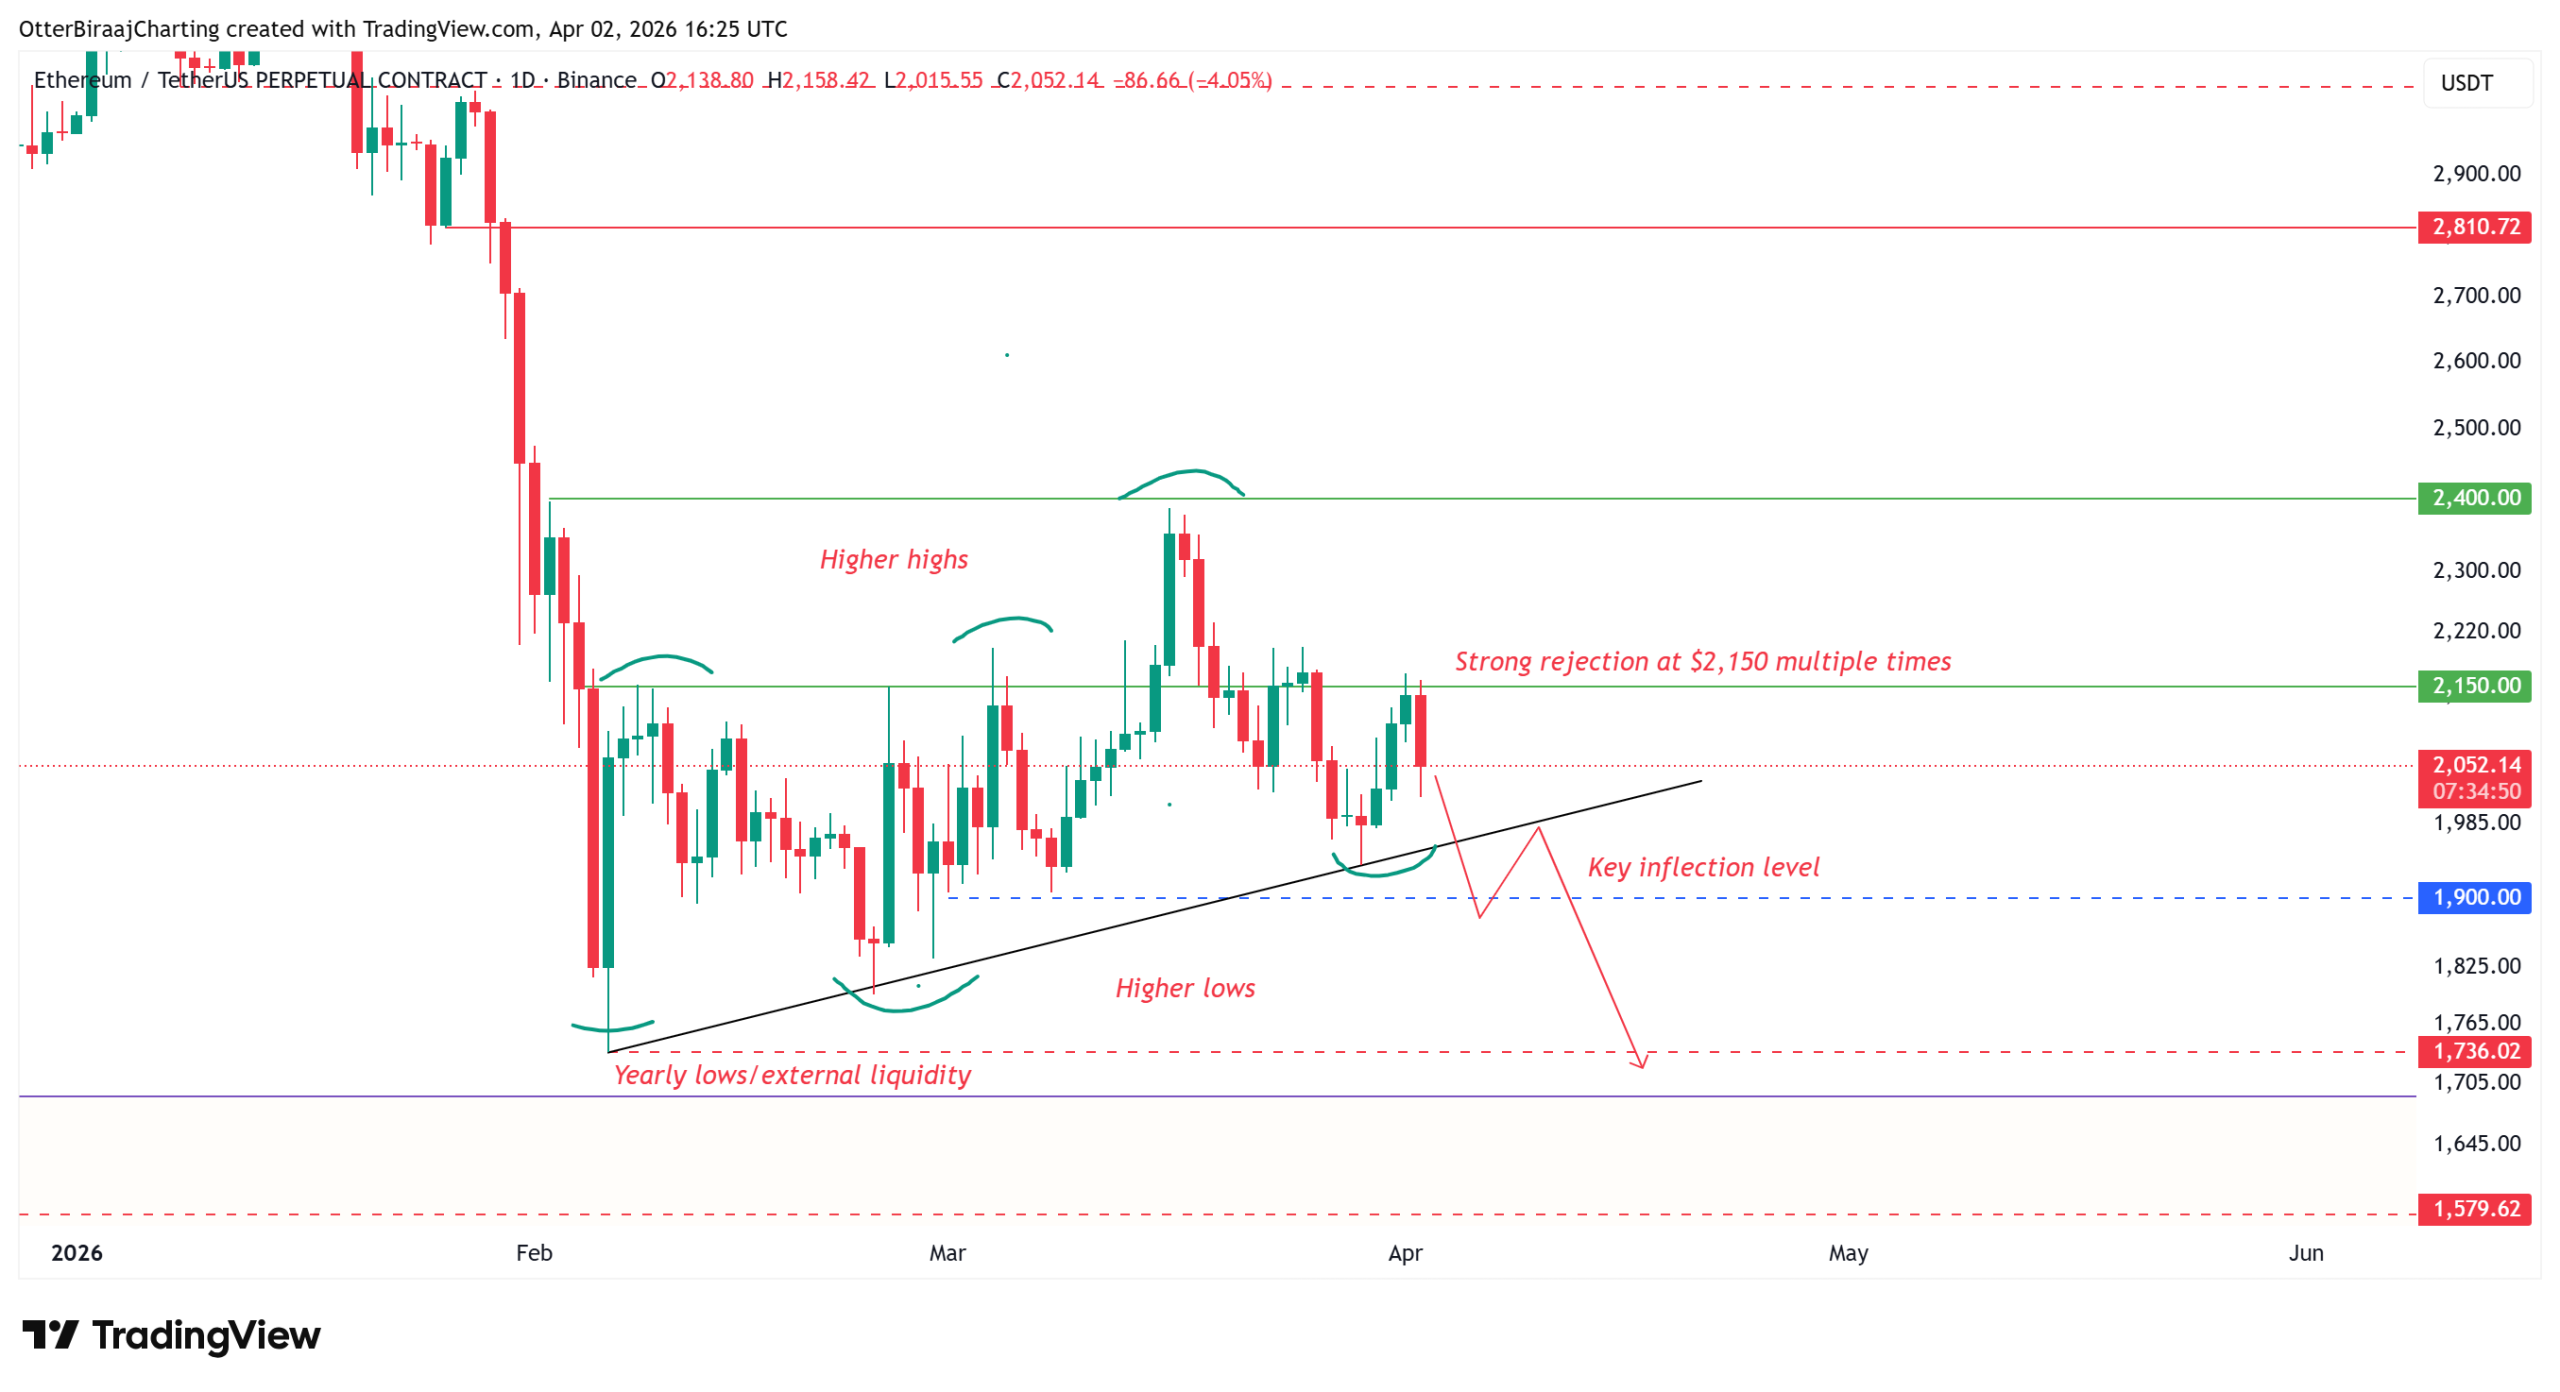
Ether (ETH) price may be at risk of a correction to new year-to-date lows, especially if the bulls fail to secure daily candle closes above the $2,150 to $2,400 range.
Ether’s price action continues to be driven by US and global macroeconomic events, along with investors’ appetite for risk assets during the US and Israel-Iran war. As data shows more than $1 billion in futures-driven sell pressure, the chance of Ether falling below $1,800 rises.
Ether’s main challenge sits at $2,400
Repeat rejections near $2,150 continue to cap Ether rallies, and the level has acted as a strong resistance seven times over the past two months. The trend and its resistance dominate the price action, despite the pattern of higher-high and higher-low candles, which can be seen on the daily chart.

A break below the ascending trendline may shift traders’ focus to $1,900, where liquidity sits near the equal lows formed during the first week of March. Losing that level introduces a bearish break of structure, exposing the external liquidity pockets to Ether’s yearly low at $1,736.
The short positioning has not increased significantly despite the recent decline. The liquidation heatmap shows an imbalance within a 10% range ($1,845–$2,255) from the current price, with approximately $2.4 billion in long liquidations clustered near the lower bound ($1,845) and $1.7 billion in short liquidations near the upper bound ($2,255).

This skew indicates that downside liquidity is larger, but the short positioning still isn’t overcrowded, even as the price continues to weaken.
The absence of large short buildup points to a passive positioning stance rather than conviction-driven selling. The price continues to compress under resistance, with buyers unable to reclaim control above the key threshold of $2,150.
Related: Ethereum bulls must hold $2K: Volatility metric hints at ‘strong’ move next
ETH derivatives spike after continued macro volatility
A surge in ETH futures selling followed comments by US President Donald Trump, which escalated tensions with Iran rather than calming markets. Trump signaled that military action will continue until late April and warned of potential strikes on Iran’s power plants.
Following the development, crypto analyst Darkfost noted that Ether futures sell volume on Binance increased by $1 billion within an hour.

Despite the surge in selling, ETH continues to trade just below the $2,150 resistance level. A sustained move above $2,150 would open the way toward $2,400, where resistance is relatively thin.
If the price clears $2,400, the next expansion zone sits near $2,800, where little trading activity has occurred over the past six months.

For now, ETH remains range-bound, capped by repeated resistance near $2,150, with $1,900 acting as the nearest liquidity pivot, which may extend the bearish breakdown.
Related: Ethereum’s EEZ and the attempt to rebuild one Ethereum
This article is produced in accordance with Cointelegraph’s Editorial Policy and is intended for informational purposes only. It does not constitute investment advice or recommendations. All investments and trades carry risk; readers are encouraged to conduct independent research before making any decisions. Cointelegraph makes no guarantees regarding the accuracy or completeness of the information presented, including forward-looking statements, and will not be liable for any loss or damage arising from reliance on this content.
President Donald Trump’s renewed aggressive posturing toward Iran has pushed bitcoin lower by roughly 2% over the past 24 hours to $67,000. While this price action is consistent with routine volatility, beneath the surface, market structure looks fragile.
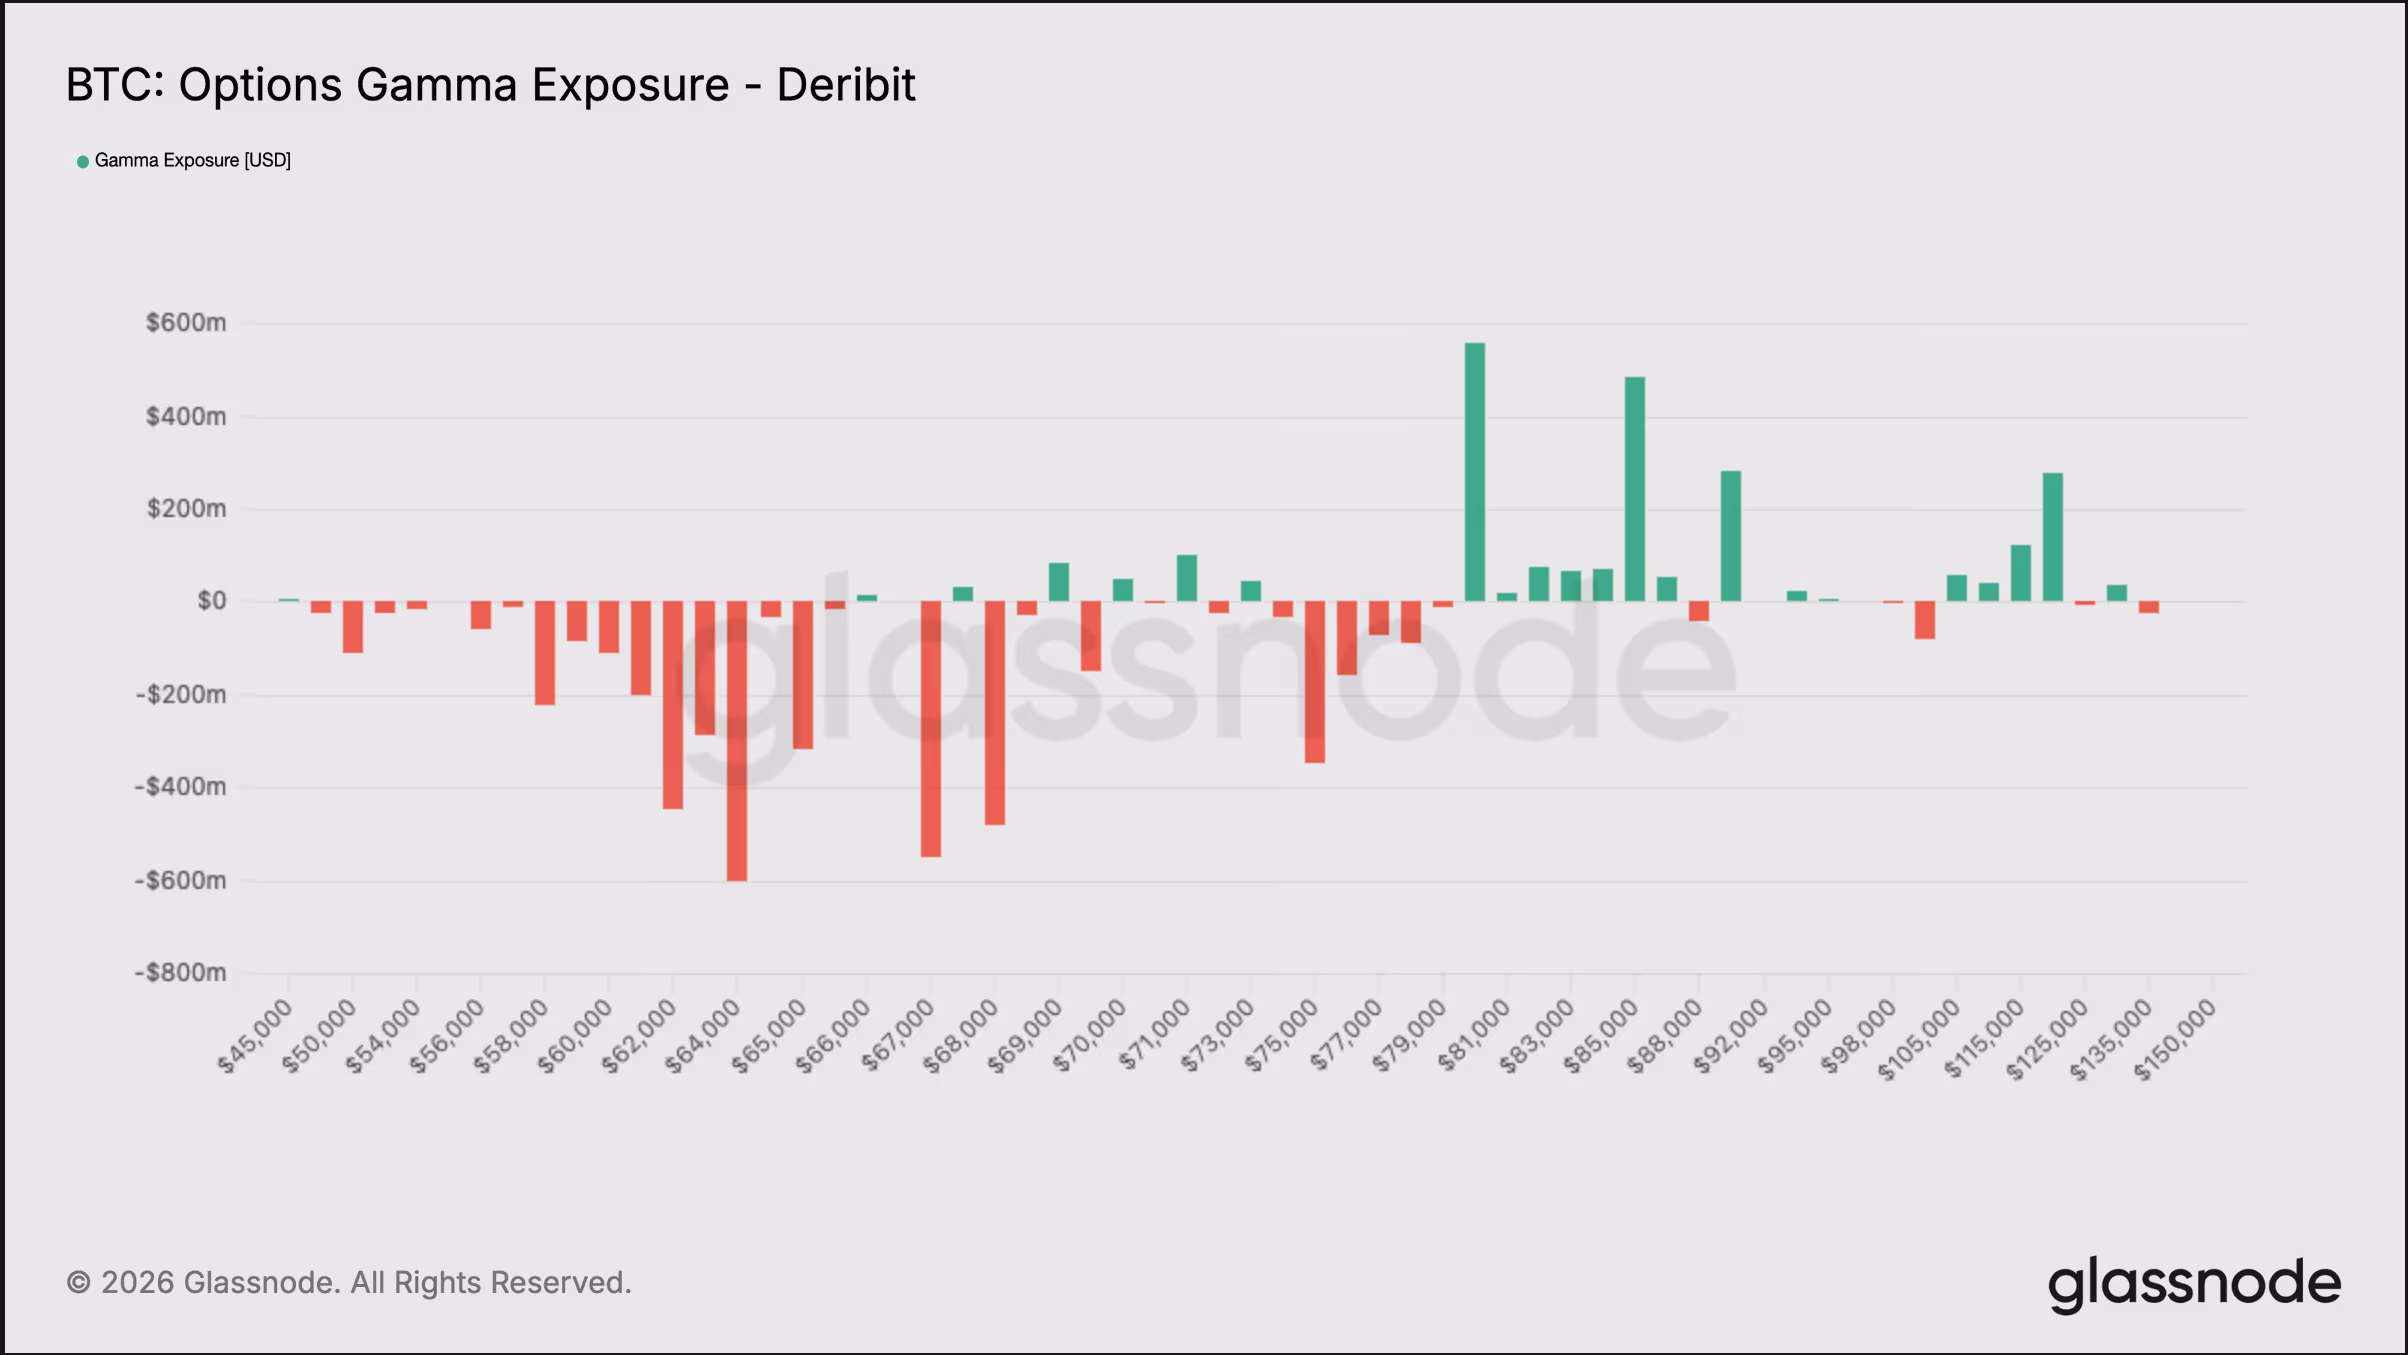
This is mainly due to flows in the Deribit-listed options market, specifically, a build-up of defensive positioning just below current prices that could result in a slide all the way down to $50,000.
A fragile setup below $68,000
In recent weeks, traders have been loading up on put options offering downside protection. These defensive flows have been concentrated in put options at strike levels $68,000 and lower, all the way down to mid-$55,000s. This is understandable, given the macroeconomic risks from the Iran war, quantum threats and the brutal bear market that began late last year.
However, when this kind of positioning builds, it creates what savvy traders call a “negative gamma” zone – a setup where market makers or dealers who add liquidity to an exchange’s order book are forced to react to price moves in ways that end up accelerating the prevailing trend, which is bearish in this case.
These kinds of dynamics have amplified both bullish and bearish trends in the past.

The Glassnode chart shows that dealer gamma exposure is mostly negative from $68,000 to $50,000. This is the result of being on the opposite end of traders’ long put positions.
In other words, dealers are holding short put positions. So, as the market drops below $68,000, they face losses and are likely to short BTC to hedge their exposure.
This hedging can push prices even lower, creating a feedback loop, which can accelerate quickly.
That’s why the latest drop below the $68,000 level becomes critical. The break below that threshold doesn’t just signal technical weakness — it opens the door to a zone where forced selling could intensify.
“Negative gamma is now building just below current price levels, from $68K all the way down to the high 50s,” Glassnode said in its weekly report.
“A move into this zone could trigger accelerated selling as hedging flows reinforce downside momentum, turning what would otherwise be a gradual move into a sharper repricing, with a potential revisit of the $60k level, the bottom of the February 5 selloff,” the firm added.
With liquidity still relatively thin following the March 27 options expiry, and likely to remain thin over the Easter holidays, there may not be enough buyers to absorb that pressure.
So, if the feedback loop fully kicks in, the decline could extend well below $60,000.
This setup shows that while bitcoin is currently reacting to war headlines, the market’s inner workings can also shape its trajectory.
If prices hold above $68,000, the current setup may unwind without much damage. But a sustained break below that level could flip the market into a regime where selling feeds on itself, turning a routine dip into a much deeper move.


Summary
- Whale positions on Hyperliquid total $3.4 billion, with $1.737 billion in longs (51.08%) and $1.663 billion in shorts (48.92%), putting the long–short ratio at 1.04.
- Aggregate P&L shows longs down $153 million while shorts are up $161 million, indicating whales are currently being paid for being net short into recent moves.
- A key whale address, 0xa5b0..41, is running a 15x leveraged long on ETH at $2,148.7, sitting on about $8.60 million in unrealized losses.
According to real-time data from analytics platform Coinglass, large traders on perpetual DEX Hyperliquid currently hold a combined $3.4 billion in notional positions across the venue. Of that, $1.737 billion is in long positions, accounting for 51.08% of whale exposure, while $1.663 billion is in shorts, or 48.92%, leaving the long–short ratio effectively balanced at 1.04.
Despite the slight tilt toward longs, whales are in the red on bullish bets and green on bearish ones. Coinglass snapshots cited by market outlets show unrealized P&L on long positions at roughly -$153 million, while shorts are ahead by about $161 million, suggesting recent price action has punished leveraged dip‑buyers more than it has squeezed short sellers.
Within the aggregate figures, one address — 0xa5b0..41 — stands out for its aggressive positioning on Ether. Data from Hyperliquid whale trackers show the address holding a 15x leveraged long on ETH opened around $2,148.7, effectively a full‑size bet at that entry level.
As of the latest reading, that ETH position is running an unrealized loss of roughly $8.5965 million, reflecting how even a modest spot move against a 15x leveraged trade can translate into multi‑million‑dollar drawdowns for whales. Prior Coinglass‑based reports have flagged the same address multiple times as it shifted from being in profit to deeply negative as ETH whipsawed around the low‑$2,000s.
The current $3.4 billion whale footprint comes after weeks of scrutiny on perpetual DEX data quality, with Coinglass previously comparing volume, open interest and liquidations across Hyperliquid, Aster and Lighter. In that analysis, Hyperliquid showed higher liquidations relative to volume, indicating more genuine leverage and risk transfer versus pure incentive‑driven wash activity, though critics argued one‑day snapshots can be misleading.
For now, the slightly long‑biased but loss‑making whale book on Hyperliquid suggests big accounts are still willing to lean long across assets, but have mistimed entries into recent volatility. With shorts currently in aggregate profit, funding, liquidation maps and open interest shifts in coming sessions will show whether these whales add to risk, cut exposure, or flip more decisively to the short side.
The partnership brings leveraged derivatives to one of crypto’s largest consumer distribution channels, targeting emerging-market users priced out of traditional brokerages.
Wallet in Telegram has launched perpetual futures trading through a new integration with Lighter, the Ethereum-based decentralized exchange (DEX), the teams announced Thursday.
The feature enables users to open long and short positions on more than 50 assets — spanning crypto, metals, equities, oil, and ETFs — with up to 50x leverage and a minimum position size of $1, all without leaving the Telegram app.
The Open Platform (TOP), the entity that develops Wallet in Telegram, told Forbes that it evaluated multiple decentralized perpetual exchanges before selecting Lighter, with the decision driven by cost structure, incentive design, and alignment with a retail-heavy audience. Lighter’s zero-fee model for standard accounts was a key factor.
Rather than competing for power users on standalone exchanges, Wallet is targeting a broader audience that may not have previously used derivatives platforms. The wallet has more than 150 million registered users, many of whom were onboarded through earlier gamified mini-app features on Telegram.
Users in the United States and the United Kingdom are excluded from the rollout. The initial focus is on emerging markets where traditional brokerage infrastructure is more limited.
Lighter Struggles Post-TGE
The deal represents a significant distribution channel for Lighter, which has become one of the top perp DEXs by volume since launching its public mainnet in late 2025.
Lighter processed $59 billion in perpetual volume in March 2026, ranking fourth among perp DEXs, according to DefiLlama. That’s down nearly 80% from its peak of $292 billion in November.
The platform runs on a custom zero-knowledge rollup on Ethereum, where every order match and liquidation is cryptographically verified onchain. It raised $68 million in November 2025 from Founders Fund, Ribbit Capital, Haun Ventures, and Robinhood. Since then, Lighter has expanded into spot trading, launched its LIT token, and introduced equity perpetuals.
Still, the exchange trails category leader Hyperliquid, which processed nearly $210 billion in March, by a wide margin.
The platform’s LIT token rallied 5% on the news, but has struggled since its December launch, losing more than two-thirds of its value since January 1.

Lighter also announced that its Partner Attribution program is now open, allowing developers to integrate the exchange’s perpetuals and spot infrastructure into their own applications.
TLDR
- Arthur Hayes questioned whether native multisig wallets on Solana could have prevented the Drift Protocol hack.
- Early investigations showed that attackers compromised administrative access rather than exploiting smart contract code.
- Solana leaders stated that human weaknesses and operational security gaps enabled the breach.
- Drift Protocol froze all functions and removed the compromised wallet from its multisig setup.
- The DRIFT token fell to $0.038 before recovering to around $0.052 within 24 hours.
A $280 million exploit at Drift Protocol triggered debate across the crypto sector and pressured token prices. Arthur Hayes questioned wallet infrastructure, while Solana leaders blamed operational failures. Early findings indicate attackers compromised administrative access rather than smart contracts.
Arthur Hayes Raises Wallet Security Concerns After DRIFT Exploit
Arthur Hayes challenged crypto wallet design after hackers drained about $280 million from Drift Protocol. He asked on X, “If Solana had native multi sig addresses, would the Drift hack even have been possible?” His remarks focused attention on wallet controls and multisignature structures.
Meanwhile, executives across the Solana ecosystem addressed the breach and clarified its scope. They said the attack did not stem from faulty smart contracts. Instead, they pointed to compromised administrative permissions and weak operational security.
Jacob Creech, Solana’s vice president of technology, urged protocols to review their configurations. He wrote, “Every protocol should evaluate their setup and understand if it fits your security requirements.”
He added that stronger multisig thresholds and timelocks can restrict unauthorized actions.
Drift Protocol responded by freezing all protocol functions after detecting the exploit. The team removed the compromised wallet from its multisig setup. It also said it is working with exchanges, bridges, and law enforcement to trace funds.
The DRIFT token fell sharply after news of the breach spread. It dropped to a record low of $0.038 before recovering part of the losses. At the time of reporting, DRIFT traded near $0.052, down 27% in 24 hours.
Retail sentiment on Stocktwits shifted during the volatility. Sentiment moved to “bullish” from “neutral” within a day. Chatter levels increased to “extremely high” from “high,” reflecting intense discussion.
Solana Leaders Say Human Weaknesses, Not Code, Enabled Attack
Solana leaders stated that the breach exposed weaknesses in permission management practices. Lily Liu, president of the Solana Foundation, said the incident “hits hard” for the ecosystem. She added that the smart contracts themselves remained intact.
Liu wrote on X, “The real targets now are humans: social engineering and opsec weaknesses more than code exploits.”
She emphasized the need to improve operational safeguards. She said the ecosystem must strengthen processes around access controls.
Creech echoed that view and encouraged internal reviews across protocols. He highlighted the importance of aligning security setups with risk exposure. He said better controls can limit damage when credentials become compromised.
TLDR
- The IMF states that tokenization replaces core financial architecture rather than improving existing systems.
- The report identifies stablecoins as the weakest link within the tokenized financial structure.
- Stablecoin transaction volume reached $1.8 trillion per month by early 2026.
- The IMF says 97% of stablecoins are denominated in U.S. dollars.
- The report warns that stablecoins can lose their peg during periods of market stress.
The International Monetary Fund (IMF) released a policy paper in April 2026 on tokenized finance. Tobias Adrian authored the report in his role as Financial Counsellor. The document argues that tokenization replaces core financial architecture rather than improving existing systems.
IMF Flags Stablecoins and Tokenization Settlement Risks
The IMF states that tokenization shifts trust, settlement, and risk management into shared digital infrastructure. It explains that programmable tokens embed ownership and compliance directly on ledgers. As a result, risk moves from institutions to code and system design.
The report separates tokenized money into deposits, regulated stablecoins, and wholesale CBDCs. It states that each form allocates risk differently within the system. However, it identifies stablecoins as the weakest structural point in tokenization.
The Fund reports that stablecoin transaction volume reached $1.8 trillion per month by early 2026. It notes that volumes were minimal in 2018 and rose sharply through 2024 and 2025. The paper describes this growth as rapid settlement expansion within crypto markets.
The report states that 97% of stablecoins are denominated in U.S. dollars. It adds that these tokens now influence money markets and payment systems. As a result, dollar-based stablecoins extend dollar usage into tokenized markets.
Adrian writes that stablecoins resemble money market funds more than central bank money. He states that a fully backed stablecoin can still lose its peg. He links that risk to liquidity stress during redemption surges.
Rapid Settlement and Sovereignty Risks Highlighted
The IMF explains that traditional finance uses settlement lags to manage stress. It states that two-day settlement windows allow regulators to intervene. However, tokenization enables atomic settlement that removes that delay.
The report warns that automated liquidations can trigger rapid asset sales. It states that coding errors or faulty price feeds can spread losses quickly. As a result, stress events unfold faster than in traditional markets.
The paper adds that central bank backstops operate on business-day cycles. It explains that tokenized systems function continuously, including weekends and holidays. Therefore, stablecoins operating as settlement layers face immediate testing during stress.
The IMF states that stablecoins connect every component of tokenized markets. It explains that smart contracts, collateral positions, and liquidity pools settle in them. Consequently, a broken peg would affect all linked transactions simultaneously.
The report also highlights cross-border risks for emerging economies. It states that dollar stablecoins can move capital outside banking channels. As a result, central banks may lose response time during currency pressure.
The IMF notes fragmentation across multiple token platforms. It states that liquidity splits across separate ledgers and bridges. The report concludes that fragmentation can increase systemic strain within tokenized finance.

State Pension Age change hits this month delaying payment until 67

(VIDEO) LEGO Preorders Open for Messi, Ronaldo Sets Ahead of 2026 World Cup

Fundrise’s VCX fund to tokenize shares on Kraken’s xStocks


-

 Business7 days ago
Instagram, YouTube Found Responsible for Teen’s Mental Health Struggle in Historic Ruling
-

 NewsBeat6 days ago
The Story hosts event on Durham’s historic registers
-

 Sports6 days ago
Sweet Sixteen Game Thread: Tide vs Michigan
-
Entertainment3 days ago
Fans slam 'heartbreaking' Barbie Dream Fest convention debacle with 'cardboard cutout' experience
-
 Entertainment5 days ago
Lana Del Rey Celebrates Her Husband’s 51st Birthday In New Post
-
Crypto World2 days ago
Dems press CFTC, ethics board on prediction-market insider trades
-

 Crypto World23 hours ago
Gold Price Prediction: Worst Month in 17 Years fo Save Haven Rock
-

 Tech4 days ago
The Pixel 10a doesn’t have a camera bump, and it’s great
-

 Sports2 days ago
Tallest college basketball player ever, standing at 7-foot-9, entering transfer portal
-

 Tech2 days ago
EE TV is using AI to help you find something to watch
-

 Fashion5 days ago
Amazon Sundays: Soft Spring Layers
-

 Tech3 days ago
Apple will hide your email address from apps and websites, but not cops
-

 Tech2 days ago
How to back up your iPhone & iPad to your Mac before something goes wrong
-

 Politics3 days ago
Should Trump Be Scared Strait?
-

 Crypto World3 days ago
U.S. rule change may open trillions in 401(k) funds to crypto
-

 Tech3 days ago
Flipsnack and the shift toward motion-first business content with living visuals
-

 Business7 days ago
Chinese universities with military links bought Super Micro servers with restricted AI chips
-

 Fashion6 days ago
Weekly News Update, 3.27.26 – Corporette.com
-

 Tech4 days ago
Elon Musk’s last co-founder reportedly leaves xAI
-
Crypto World4 days ago
Bitcoin’s Six-Month Losing Streak: What On-Chain Data Says About the Market’s Next Move
You must be logged in to post a comment Login