
Crypto World
Factors affecting the cost of Web3 game development in 2026

The overall cost of Web3 game development is rarely about the game itself. It is about the ecosystem behind it. The cost can typically range between $40,000 and $500,000+, depending on complexity, blockchain integration, NFT systems, multiplayer architecture, smart contracts, security requirements, and production quality. A practical Web3 game development cost breakdown is as follows:
- A simple Web3-enabled game can start around $40,000
- A competitive mid-scale Web3 game often lands between $150,000 and $300,000
- Large-scale, multiplayer, token-driven ecosystems frequently exceed $400,000 to $700,000+
However, these numbers are meaningless without understanding what is being built. The cost of Web3 games is usually determined by five structural layers:
- Game architecture
- Blockchain architecture
- Economic design
- Infrastructure scalability
- Security and compliance depth
Let us now dive deeper into understanding each layer and typically what percentage of cost it involves.
Detailed Web3 Game Development Cost Breakdown
Let’s break down cost drivers more specifically.
Layer 1: Gameplay & Core Game Architecture (20–30%)
Before blockchain enters the conversation, it is to be kept in mind that you are still building a game. Game development cost varies based on:
- Engine selection (Unity vs Unreal)
- Visual fidelity (2D vs stylized 3D vs high-end 3D)
- Gameplay complexity (casual loop vs real-time multiplayer combat)
- AI logic systems
- Cross-platform compatibility
A simple 2D Web3 game may require a small team of:
- 1–2 game developers
- 1 designer
- 1 UI/UX resource
A 3D multiplayer Web3 game may require:
- Gameplay engineers
- Network engineers
- Technical artists
- Environment artists
- QA specialists
This is exactly where the cost of Web3 game development tends to jump significantly.
Layer 2: Blockchain Integration Complexity & Smart Contract Development (20–35%)
Web3 is not a plug-in. It changes how data flows. Traditional games store the following on centralized servers:
- Inventory
- Rewards
- Points
- Assets
On the other hand, Web3 games must decide:
- What goes on-chain?
- What stays off-chain?
- How frequently transactions occur?
- Who pays gas fees?
- How are assets validated?
Every blockchain decision affects:
- Development time
- Infrastructure cost
- Transaction efficiency
- User experience
Smart contract development alone can range from $20,000 to $80,000, depending on:
- Token complexity
- NFT minting rules
- Staking mechanisms
- Vesting logic
- Governance integration
Security audits can add another $15,000 to $60,000, depending on the overall scope of the project. However, many tend to underestimate this layer entirely.
Layer 3: Tokenomics & Economic Engineering (10–20%)
This is where Web3 projects either survive or collapse. Tokenomics design includes:
- Emission rates
- Reward balancing
- Inflation control
- Sink mechanisms
- Marketplace fee structure
- Liquidity strategy
Designing a sustainable economy is not “whitepaper work.” It directly affects:
- Backend logic
- Reward distribution
- Smart contract rules
- Player retention
- Long-term viability
Improperly designed token systems destroy ecosystems quickly. Professional economic modeling often adds $10,000 to $40,000 to total project cost. However, skipping it can cost millions later.
Layer 4: Infrastructure & Scalability (15–25%)
Web3 games often operate with a hybrid architecture:
- On-chain asset ownership
- Off-chain game logic
- Cloud-based state management
- API layers connecting wallet systems
Infrastructure must handle:
- Concurrent users
- Real-time gameplay (if multiplayer)
- Transaction logging
- Fraud detection
- Analytics pipelines
Initial backend setup may cost $25,000 to $100,000, depending on the complexity involved. In addition to this, ongoing cloud costs can range from:
- $3,000/month for moderate usage
• $15,000+/month for large-scale operations
This is exactly where enterprise-grade projects differ from hobby builds.
Layer 5: Security & Fraud Prevention (10–20%)
Web3 games attract exploit attempts. Attack vectors include:
- Smart contract vulnerabilities
- Reward manipulation
- Wallet exploitation
- Bot farming
- Marketplace abuse
Security engineering includes:
- Smart contract testing
- Load testing
- Anti-bot systems
- Activity anomaly detection
- Secure wallet session management
Skipping serious security is one of the fastest ways to destroy trust and lose credibility.
Want the Best Quote for Your Next Web3 Game Development Project?
Web3 Game Development Cost by Project Scale
Tier 1: Web3 MVP (Startup-Level Build)
Estimated Cost: $40,000 – $80,000
This tier includes:
- Basic gameplay loop
- Simple NFT asset structure
- Wallet integration (MetaMask or similar)
- Basic smart contract for rewards
- Limited backend infrastructure
- Minimal multiplayer support
This build is ideal for:
- Concept validation
• Token pre-launch engagement
• Community building
• Early-stage Web3 startups
What it does not include:
- Advanced tokenomics modeling
- Complex PvP systems
- Real-time multiplayer scaling
- In-game marketplace with high liquidity
- Multi-chain integration
Most early-stage founders fall into this category.
Tier 2: Mid-Scale Web3 Game (Growth Stage)
Estimated Cost: $100,000 – $250,000
At this level, you’re building a scalable product. This includes:
- Advanced gameplay mechanics
- NFT minting and trading
- In-game marketplace
- Token reward logic
- Multiplayer features
- Backend cloud infrastructure
- Security testing
- Analytics dashboard
- Admin control panels
This is suitable for:
- Venture-backed startups
• Web3-native gaming studios
• Token-launch ecosystems
• Projects targeting 50K+ users
At this stage, blockchain development and backend engineering significantly impact the budget.
Tier 3: Enterprise / AAA Web3 Game
Estimated Cost: $300,000 – $500,000+
This includes:
- AAA-level graphics
- Unreal/Unity advanced rendering
- Complex multiplayer networking
- Cross-chain asset compatibility
- Advanced tokenomics & staking
- DAO governance integration
- Fraud prevention systems
- High-scale backend architecture
- Full smart contract auditing
- LiveOps infrastructure
This is not just a game; it’s a Web3 platform. This tier is typical for enterprises or well-funded Web3 projects.
Timeline Correlation with Cost
Web3 game development timelines typically look like:
- 3–4 months: Basic Web3 MVP
- 6–9 months: Scalable mid-tier game
- 9–15 months: Enterprise-grade ecosystem
Shorter timelines require larger teams. Larger teams increase short-term budget burn. Time compression always increases cost.
Ongoing Operational Costs
It is to be always kept in mind that only development is not the final expense. You can expect:
- Smart contract audit: $10,000 – $50,000
• Cloud hosting: $2,000 – $15,000 monthly
• Security monitoring
• LiveOps management
• Token economy balancing
Web3 games require continuous maintenance for flawless performance.
Should You Hire Web3 Game Developers In-House or Outsource?
If you try to hire Web3 game developers in-house, it involves:
- Higher fixed cost
- Long hiring cycles
- Web3 talent scarcity
On the other hand, outsourcing the task to a trusted Web3 game development company often provides:
- Faster deployment
- Cross-domain expertise
- Scalable team allocation
- Lower operational overhead
- Reduced recruitment risk
It is exactly the reason as to why many startups as well as enterprises prefer outsourcing.
The Real Risk Behind “Cheap Web3 Game Development”
Cheap Web3 builds usually mean:
- No smart contract audit
- Weak backend
- Poor token balancing
- Inadequate security
- Limited scalability
Initial savings often lead to:
- Token collapse
- Security breach
- User churn
- Rebuild costs
This, in turn, can ultimately lead to doubling total expenditure and hence not recommended.
So How Much Should You Budget?
If you are a:
- Startup founder
Minimum realistic serious Web3 game development budget can range between: $75,000 and $150,000. - Mid-scale company
The budget can lie anywhere between $150,000 and $300,000. - Enterprise-scale vision
For enterprise-level game development, where the vision is crafting a sustainable Web3 economy, the budget can range from $300,000 to $700,000+.
Why Choosing the Right Web3 Game Development Company Matters
Choosing solely based on lowest bid can result in increasing the long-term cost. Antier, a capable Web3 game development company ensures:
- Secure smart contracts
- Sustainable tokenomics
- Scalable infrastructure
- Audit readiness
- Optimized gas usage
- Long-term viability
Ultimately, it is the overall development quality that determines ecosystem survival.
Final Thoughts
If you want to understand how much does it cost to develop a Web3 game, the answer varies dramatically based on ambition and scale. A realistic starting budget can be something around $40,000 for MVP-level builds and can exceed half a million dollars for enterprise-grade ecosystems. The difference lies in:
- Blockchain architecture
• Multiplayer complexity
• NFT systems
• Security measures
• Infrastructure scalability
If your goal is long-term sustainability and ecosystem growth, structured engineering investment is non-negotiable. You need to understand that Web3 game development is not simply about adding NFTs or tokens to a game. It is about building:
- A functioning digital economy
- A secure blockchain architecture
- A scalable multiplayer environment
- A sustainable reward system
The cost reflects the complexity of these systems working together. Working with a reliable Web3 game development company helps you clearly understand where the money goes allows you to invest intelligently instead of underfunding critical layers.
Frequently Asked Questions
01. What is the typical cost range for Web3 game development?
The cost of Web3 game development typically ranges from $40,000 to over $500,000, depending on factors like complexity, blockchain integration, and production quality.
02. What are the main cost drivers in Web3 game development?
The main cost drivers include game architecture, blockchain integration complexity, economic design, infrastructure scalability, and security and compliance depth.
03. How does the complexity of a Web3 game affect its development cost?
The complexity of a Web3 game affects its development cost significantly, with simple games starting around $40,000, mid-scale games ranging from $150,000 to $300,000, and large-scale games often exceeding $400,000 to $700,000+.

Chaos Labs has parted ways with Aave after three years of serving as the crypto lending protocol’s primary risk service provider, citing a budget dispute and fundamental disagreements over how risk should be managed. The rupture signals a notable inflection point in DeFi risk governance as Aave advances its V4 migration and navigates ongoing governance tensions within its ecosystem.
Chaos founder Omer Goldberg announced the decision on X, stressing that the move was deliberate and not made in haste. He said Aave Labs was willing to raise its budget to $5 million, but that the engagement “no longer reflected how we believe risk should be managed.” Aave Labs CEO Stani Kulechov offered a different framing, describing Chaos’s departure as the result of a push by Chaos to become the sole risk provider and to replace other partner models. Aave’s stance, the two sides said, remains professional; Chaos did not depart on acrimony, but the parties simply could not reconcile their risk-management philosophies.
Key takeaways
- Chaos Labs exits after a three-year engagement as Aave’s main risk service provider, citing a budget dispute and diverging views on risk management.
- The split underscores tensions between a single-provider model and a two-layer risk framework that Aave maintains, with Chaos allegedly seeking to replace Chainlink’s oracles and other partners.
- Aave assures that the departure has not disrupted its protocol, smart contracts, or listings, while signaling it will continue working with LlamaRisk during the transition.
- The move comes amid broader governance frictions within Aave Labs over funding and revenue control, and just weeks after a notable risk incident fueled calls for stronger safeguards.
What triggered Chaos Labs’ departure from Aave
Chaos Labs has been a cornerstone of Aave’s risk infrastructure since November 2022, handling pricing, risk assessment, and related guardrails across Aave’s V2 and V3 markets. In that period, Aave’s total value locked expanded markedly, underscoring the centrality of robust risk tooling to the protocol’s growth. By late February, Aave had crossed a historic milestone in lending activity, with cumulative lending volume advancing past the trillion-dollar mark, a milestone the project highlighted as a first for the DeFi sector.
Goldberg framed the decision as one driven by a misalignment over risk management and the scope of Chaos’s duties. “This decision was not made in haste,” he stated in a post to X. “We worked in good faith with DAO contributors. Aave Labs was professional and supported increasing our budget to $5m to retain us. However, we are leaving because the engagement no longer reflects how we believe risk should be managed.”
Aave’s account of the dispute diverges on what Chaos was seeking. Stani Kulechov contended that Chaos sought to become the sole risk manager and to substitute Chaos’s price oracles for Chainlink—an approach that would have effectively sidelined other risk partners and compromised Aave’s established two-layer risk model. Chaos’s proposal, Kulechov suggested, would have forced Aave to abandon its multi-provider framework, a move the protocol did not accept. Chaos later indicated it was examining winding down its risk consultancy, even as Aave reportedly offered to double the compensation to keep Chaos onboard.
Beyond the personnel dynamics, the departure arrives at a moment of heightened sensitivity around risk in Aave’s community. The ecosystem has recently grappled with high-profile events that tested the resilience of its risk tools, including a $50 million loss traced to a user interacting with Aave’s interface on March 12. In response, Aave rolled out a shielded risk feature designed to deter high-risk trading behavior, signaling a public push to bolster user safeguards even as internal governance wrestles with funding and control questions.
Risk architecture at stake: Chaos’s demands vs. Aave’s model
At the heart of the disagreement is Aave’s two-layer economic risk model, which blends on-chain risk pricing with external risk data. Chaos has been integrated into the back end of that risk framework, providing pricing and risk management services that supported V2 and V3 liquidity and lending operations. The move toward a broader, multi-provider risk architecture—anchored by partners like Chainlink—was a core feature of Aave’s design philosophy as it expanded and upgraded to V4.
Goldberg argued that Chaos’s push to become the sole risk provider, coupled with a desire to substitute its price oracles for Chainlink’s, would have undermined the protocol’s diversification of risk inputs. Kulechov, conversely, stressed that Chaos’s demand would displace established partners and thrust Chaos into a governance role that Aave does not appear prepared to concede. The exchange underscores a broader tension in DeFi: how to balance centralized expertise with multi-source resilience in a rapidly evolving risk landscape.
In practical terms, the split leaves Aave poised to continue with LlamaRisk and other risk partners as it advances V4 and maintains its two-layer model. Chaos had suggested it could take on a more centralized risk-management posture, but Aave’s leadership signaled a preference for a governance-driven, multi-vendor approach, particularly as the platform expands its risk surface with new features and markets. The dispute also highlights a broader industry question: what responsibilities do risk managers owe when a protocol experiences a failure, and who bears the blame when risk controls falter?
Operational realities of the migration and broader implications
The timing of Chaos’s exit aligns with Aave’s ongoing transition from V3 toward V4, a process that executives warned could stretch over months or even years as liquidity and markets migrate and the new feature set is absorbed into existing ecosystems. Goldberg noted that ongoing operations would require maintaining both V3 and V4 during the migration window, a workload that can be substantial for any risk provider. He warned that without clear safety harbors or settled legal precedents, risk governance remains an area of ambiguity with real consequences when things go wrong.
Kulechov framed the disruption as manageable and non-disruptive to Aave’s immediate operations. He emphasized that Chaos’s departure did not affect Aave’s smart contracts, token listings, or network integrations, and that the protocol would continue collaboration with LlamaRisk to ensure a smooth transition. The episode sits against a backdrop of ongoing governance debates about funding and revenue allocation within Aave Labs, a debate that has punctuated discussions about how the DAO should remunerate development and risk oversight in a high-growth, capital-intensive ecosystem.
For users and investors watching the DeFi risk space, the episode underscores two distinct strands: the push for diversified risk inputs that mitigate single points of failure, and the practical realities of a multi-year migration that tests the stamina of risk tooling and governance structures. The fact that Aave achieved a meaningful lending-volume milestone while navigating this internal shift demonstrates the resilience of its ecosystem, but it also raises questions about the pace of migration and the potential for further shuffles among risk partners as V4 scales.
Cointelegraph’s coverage of related risk and governance developments provides broader context for these tensions. For instance, Aave’s response to the March incident and the subsequent shield feature was part of a wider market emphasis on user protection and risk-aware design. The departure also sits within the wider narrative of DeFi risk management evolving from boutique, single-provider arrangements toward resilient, multi-provider ecosystems that can weather shocks and governance disputes alike.
As Aave moves forward, the roadmap will hinge on how smoothly LlamaRisk can integrate and how quickly the V4 platform absorbs legacy markets and liquidity from V3. Chaos’s exit, while financially notable—the firm had been engaged at a $5 million level—illustrates the bargaining power that risk providers can wield in a high-stakes DeFi environment and the lengthier arc of governance negotiations that can accompany critical infrastructure changes.
For readers tracking the real-world implications, the key questions are clear: will Aave maintain a diversified, resilient risk framework as V4 expands? How quickly will the migration reduce the operational overlap between V3 and V4? And what lessons will the DeFi community draw about risk governance, budgeting, and partnerships from this high-profile split?
Investors and developers should watch for updates on Aave’s transition timeline, any new risk-partner arrangements, and how the community approaches risk coverage as V4 matures. The coming months will reveal whether the industry’s move toward multi-provider risk management proves more robust in practice, or if further shifts among top risk suppliers test the protocol’s continuity and user protection standards.
In the meantime, Aave’s leadership reiterated its commitment to maintaining its two-layer risk model and to working with partners—including LlamaRisk—to ensure a seamless transition. The episode also reinforces the broader industry takeaway that risk management in DeFi remains a live, evolving discipline—one where governance choices, partner ecosystems, and architectural design all shape the safety and reliability that users rely on every day.
Readers can follow ongoing developments as Aave navigates V4 integration and the evolving risk landscape, including how new safeguards and partner arrangements influence user experience, security, and the protocol’s long-term resilience.
Related coverage: Aave’s shield initiative after a high-profile loss, and discussions around risk provision and governance within DeFi ecosystems, offer useful context for evaluating how this split may influence future risk partnerships and platform upgrades. Aave Shield rollout and ongoing governance debates illuminate the environment in which Chaos and Aave operated.


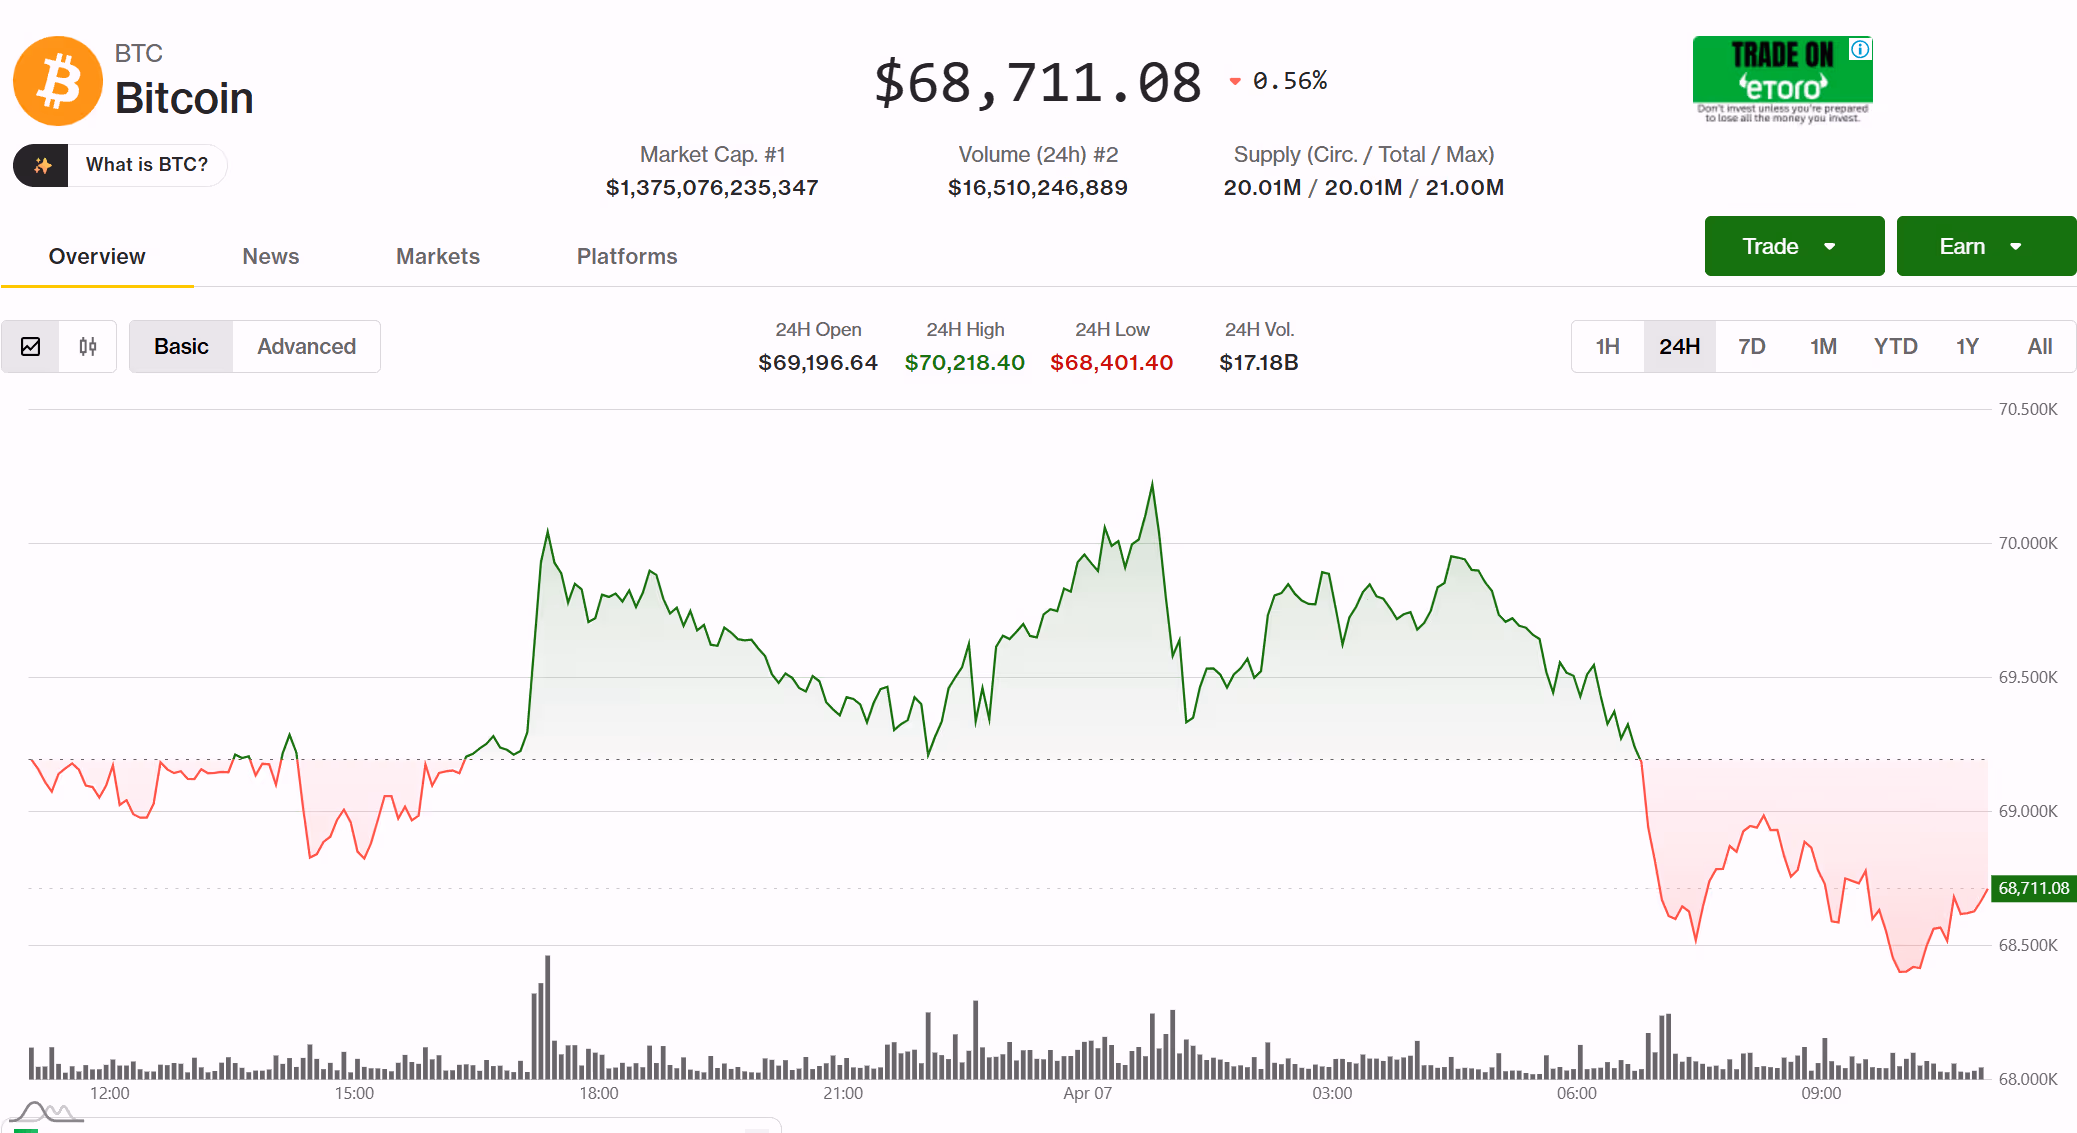
Bitcoin pulled back to $68,589 in Asian hours Tuesday after Monday’s ceasefire-driven rally faded, as U.S. president Donald Trump set a Tuesday night deadline for Iran to agree to a deal and threatened to destroy “every bridge in Iran by 12 o’clock tomorrow night” if it does not.
The largest cryptocurrency is down 0.6% over 24 hours after touching $69,350 on Monday, when an Axios report about a potential 45-day ceasefire briefly pushed prices above $69,000. That optimism lasted about 12 hours. Ether fell 1% to $2,104, solana’s SOL dropped 2.7% to $79.75, XRP lost 1.6% to $1.32, and dogecoin slid 2.2% to $0.09. BNB held relatively flat at $598.
The pattern of the past six weeks continued in textbook fashion, where positive headlines breifly boost prices before negative comments cull any chances of extended recovery.
“This move looks less like a shift in fundamentals and more like positioning getting caught offsides,” said Diana Pires, chief business officer at sFOX. “Heading into the weekend, sentiment was heavily skewed bearish and short interest had built up across the market. Once ceasefire headlines hit, that positioning had to unwind.”
Monday’s bounce produced $196.7 million in short liquidations as bearish traders got caught by the ceasefire report. Tuesday’s pullback arrived when Iran reportedly passed to mediator Pakistan a rejection of the ceasefire proposal, demanding a permanent end to the war, lifting of sanctions, and reconstruction efforts in addition to safe passage through Hormuz.
U.S. crude climbed above $112 as Trump warned the military could put every power plant in Iran “out of business” if no deal is reached, even as he said talks were “going well.” Brent traded near $115.66, up 2.9% on the session. Elsehwhere, the S&P 500 posted its longest advance since January despite the whipsaw, with equities managing to hold small gains through the volatility.
The macro backdrop remains uncertain. U.S. services data showed the economy expanded at a slower pace in March, employment contracted at the sharpest rate since 2023, and input prices accelerated, a mix that gives the Fed no clear reason to cut or hold. Key inflation readings this week will add to the picture.
Bitcoin remains inside the $65,000 to $73,000 range it has traded in for the entirety of the conflict. Every rally has failed at the upper bound, every selloff has held the lower. What happens by midnight Tuesday, when Trump’s deadline arrives, will determine which end of that range gets tested next.

Buy, hold, wait – that’s what most Bitcoin holders do, really.
After all, this is what makes the most sense when the goal is to gain exposure to an asset that investors believe will appreciate over time.
But as Bitcoin matures, that logic starts to feel somewhat incomplete. Holding may preserve upside, yet it does little to address the practical need for liquidity when real-life expenses arise. Selling Bitcoin can unlock cash, but it also means cutting into a position that may have taken years to build.
An alternative that is gaining attention is using Bitcoin not only as something to store, but as an asset that can support borrowing, spending, and measured income generation without fully exiting the trade.
That is the space Xapo Bank is trying to occupy. The bank advertises itself as a premium Bitcoin-and-USD platform built for members who want more than a wallet or exchange account, pairing services such as Bitcoin-backed loans, global spending tools, and yield-oriented products under one membership model.
Let’s explore how it works in more detail.
Using BTC as Collateral Instead of Selling It
For a long-term Bitcoin holder, selling is rarely the ideal solution. It may solve a short-term cash need, but it also reduces exposure to an asset many investors still see as a core long-term position.
That is why Bitcoin-backed borrowing has become a more compelling option for a certain class of holder – it allows them to unlock liquidity without fully exiting the market. Instead of selling BTC outright, they can use it as collateral and access cash while keeping the underlying position intact.
This is one of the central ideas behind Xapo Bank’s lending offering. The bank allows eligible members to borrow against their Bitcoin, with loans of up to $1 million and cash delivered in minutes through the app, depending on the amount of collateral posted.
Xapo says members can borrow up to 40% of their BTC value, choose flexible repayment periods, and repay early without penalty. Just as importantly, the bank frames this as a more conservative lending model than many crypto users grew used to in previous cycles.
According to Xapo, collateral remains segregated and is not rehypothecated, a distinction that carries more weight after the collapses of lending platforms that treated customer assets as fuel for broader risk-taking.
The loan becomes about access – covering a major purchase, bridging a cash-flow gap, or funding a large expense without having to dismantle a long-term Bitcoin position.
The Spending Layer
Liquidity needs to move with you. Borrowing against Bitcoin might help a holder avoid selling, but for the model to feel practical, those funds need to be usable in everyday life.
Xapo places its card right next to its loan product, allowing members to spend from BTC or USD balances globally, with zero foreign exchange fees on card spending, an ultra-low 0.1% spread when spending from Bitcoin, and cashback paid in BTC on qualifying purchases. The reward rate can reach up to 1%, although in the EEA, Switzerland, and the UK, where interchange fees are capped, cashback is lower at 0.2%.
The loan provides access to liquidity without forcing a sale, while the card helps that liquidity function in the real world.
And yes, the company offers a metal card, if you want it.
How Xapo Frames Earning on BTC
For many Bitcoin holders, there’s an opportunity cost to letting an asset sit completely still.
As the Bitcoin investor base matures and starts thinking less about short-term price action and more about long-term portfolio function, ‘earning on your Bitcoin’ is suddenly trending. The appeal, however, isn’t in taking on opaque counterparty risk. Instead, it lies in simpler, more hands-off and conservative ways to grow a BTC position over time.
Xapo’s pitch leans in directly. Instead of presenting yield as something aggressive or experimental, it frames earning as part of a broader wealth-management model for Bitcoin holders who want their assets to do more than just appreciate in price.
That model rests on a few straightforward building blocks:
- Up to 4% APY, paid in BTC, on Bitcoin-denominated investments;
- 3.35% APY, paid in BTC, on USD deposits;
- Up to 1% cashback in Bitcoin on eligible card purchases.
The goal is to create several steady paths for accumulating more sats over time – something attractive for users who have little interest in micromanaging positions or moving funds through a maze of DeFi protocols.
A Welcome Development After Crypto’s Yield Blowups
Crypto users have already seen what happens when earning turns into a euphemism for hidden risk.
Over the past few years, a wide range of lending and yield platforms promised easy returns on digital assets, only for many of those models to unravel under stress. The broader lesson was not that all yield is inherently dangerous, but that the source of the yield, the custody model, and the treatment of client assets matter far more than the headline number.
Even mainstream policy and stability analysis now separates centralised crypto lenders from other parts of the digital-asset ecosystem because of the specific liquidity, maturity, and asset-use risks they introduced. That is exactly the backdrop against which platforms like Xapo are trying to refine a more disciplined crypto wealth model.
Xapo’s positioning is deliberately aimed at that post-blowup audience. Instead of leaning on aggressive returns, it emphasises segregated collateral, a non-rehypothecation model for Bitcoin-backed loans, and a set of simpler earning tools that are easier to understand in plain financial terms.
Xapo is effectively arguing that the grown-up version of crypto earning is not the one with the biggest APY. Instead, it’s the one that makes the mechanics, custody, and trade-offs feel sustainable.
The Private Bank for Bitcoin Maximalists
We’re not looking at a mass-market crypto app trying to win users with zero-cost access and a long menu of speculative features. Xapo markets itself as a members-only private bank for Bitcoin holders, and the $1,000 annual fee is part of that identity.
On its own site, the company presents the membership as a package built around secure custody, daily Bitcoin earnings, liquidity tools, and global access, all aimed at people who see BTC as a serious component of personal wealth.
Ultimately, the industry needs a solution that will give long-term holders of Bitcoin a more complete financial structure around the asset they already believe in. If the old model was simply to buy Bitcoin and wait, Xapo is making the case for something more mature.
Disclaimer: This communication is not intended for, and must not be acted upon by persons resident in the United Kingdom.
The post How BTC Holders Can Borrow, Spend, and Earn Without Exiting Bitcoin appeared first on BeInCrypto.
Bitcoin slid toward $68,000 on Tuesday, with traditional markets closed in Hong Kong for a long weekend, as repeated failures near $70,000 left the bitcoin market vulnerable to a break lower.
The drop came after another failed push above $70,000, with prices slipping quickly once they approached the lower end of the $65,000 to $73,000 range that has defined trading since late March. Intraday losses accelerated near that boundary, highlighting how little support exists when momentum turns.

That calm is not being driven by strong demand. Recent Glassnode data shows softer trading volumes and subdued onchain activity even as prices recover, indicating limited participation behind the move.
Meanwhile, in a note to CoinDesk, crypto-native trading and liquidity firm Caladan pointed to negative demand trends and ongoing distribution by large holders, leaving bitcoin reliant on macro-driven flows and derivatives positioning rather than broad-based accumulation.
The result is a market that looks stable on the surface but is structurally fragile if that balance shifts.
That vulnerability is becoming more visible in derivatives markets. Options data shows traders are increasingly paying up for downside protection, with implied volatility holding above realized levels, a sign that investors are bracing for a larger move even as spot prices remain rangebound.
Analysts who spoke to CoinDesk earlier point to a negative gamma setup below roughly $68,000, where market makers may be forced to sell bitcoin as prices fall in order to hedge their exposure.
The danger: this dynamic can accelerate declines, transforming a gradual move into a sharper, self-reinforcing rout that could drag prices toward the $60,000 level if support breaks.
Prediction markets reflect a similar shift in sentiment. On Polymarket, traders are assigning a 68% probability that bitcoin will trade at or below $65,000 in April, while higher targets such as $80,000 have seen sharply declining odds.
Taken together, the signals point to a market where the calm may hold, but only until key levels give way.


NASHVILLE, Tenn. — The Securities and Exchange Commission is close to proposing a “regulation crypto” fleshing out its approach to overseeing the crypto industry and drawing lines between transactions that might be securities and where they aren’t, the agency’s head said Monday.
SEC Chair Paul Atkins said the commission’s new reg crypto is in front of the White House Office of Information and Regulatory Affairs, meaning it’s one step away from being published. This rulemaking is focused on the Securities Act of 1933 and will address fundraising and startup exemptions, among other issues, he said Monday at an event hosted by Vanderbilt University and the Blockchain Association.
He told CoinDesk after his question-and-answer session that the SEC also intends to put out its long-awaited innovation exemption soon.
“We’d love to have reactions and everything else,” he said. “It’s not a rule as such but obviously we need to know how it’s functioning and if people have problems with it or not.”
One aspect to this exemption, he said, is that it wouldn’t disadvantage incumbents and focus solely on startups.
“We want people really to experiment within [that] framework,” he said.
Midterm watch
At multiple points during his talk, Atkins pointed to Congress’s role, saying that his agency’s rulemaking process was well underway despite whatever Congress may do.
“I think we have enough of a runway now, even notwithstanding what may happen in the midterms — although I really still want a friendly Congress obviously — they can throw tacks on the road in front of our tires but they’re not going to really slow us down.”
Atkins also said the audience needed “to be engaged in this upcoming election,” pointing to Senator Bernie Moreno as an example.
“To have Congress really veer off track is not going to any of us any good, and it’s going to put a lot more questions into the future because people then just have ‘oh gosh, maybe this is again a passing phase,’” he said. “We’ve got to make sure that your friends are in Congress. I think you saw how that really paid benefits in the last election.”
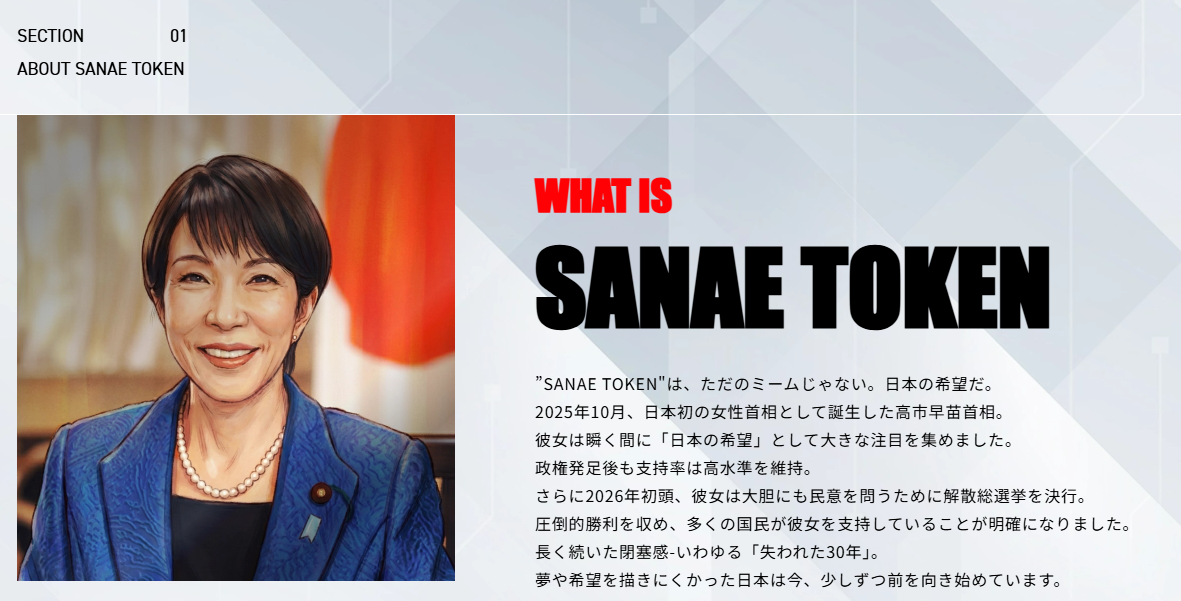
Japan’s SANAE TOKEN saga has entered a new phase, with fresh media reports alleging the prime minister’s office knew more than it admitted. But for crypto markets, the bigger story is what happens next in Tokyo’s legislature.
The political noise and the regulatory signal are arriving at exactly the same time.
How the Token Unraveled
SANAE TOKEN launched on Solana on Feb. 25, as BeInCrypto reported. NoBorder DAO — a community led by serial entrepreneur Yuji Mizoguchi — issued it as part of a “Japan is Back” initiative, with Takaichi’s name and likeness on the project website. The token surged over 40x on launch day before Takaichi’s March 2 denial triggered a 58% crash.
The FSA opened a probe into NoBorder DAO for operating without a crypto exchange license. The token’s operators halted issuance shortly after.
Japanese Tabloid Reports Secretary’s Approval
Weekly Bunshun, a Japanese tabloid known for breaking political and celebrity scandals, says developer Ken Matsui told the magazine his team informed Takaichi’s office that the project was a crypto asset. That directly contradicts her March 2 denial. Takaichi said neither she nor her office had been told anything about the token.
The publication says it obtained audio recordings of Takaichi’s chief secretary over a period of more than 20 years, reportedly describing the project favorably. Another Japanese online media reported that Takaichi’s office had not responded to media inquiries on the matter as of Tuesday. Takaichi has held no press conference since February 18, when her second cabinet was inaugurated.
The political dimension remains unresolved. What matters for crypto is whether the scandal accelerates — or complicates — Japan’s regulatory overhaul.
FSA Bill Changes the Rules
Japan’s Financial Services Agency submitted its landmark crypto reform bill to parliament this week, Asahi Shimbun reported. The legislation moves crypto from the Payment Services Act into the Financial Instruments and Exchange Act, reclassifying digital assets as financial instruments for the first time.
As BeInCrypto previously reported, the maximum prison term for unlicensed crypto sales would triple to 10 years, with fines rising from ¥3 million to ¥10 million. The SESC gains criminal investigation powers it has never held over crypto operators. The SANAE TOKEN case was explicitly cited in Nikkei’s reporting on the legislative push.
The bill would also void transactions with unregistered operators by default, making it easier for investors to seek refunds — a provision directly relevant to the SANAE TOKEN case.
The post Did Japan’s PM Actually Back the Memecoin Bearing Her Name? appeared first on BeInCrypto.

South Korea’s financial regulator has ordered all crypto exchanges to verify user asset balances every five minutes, following a massive overpayment incident that shook market confidence earlier this year.
One botched reward payout exposed systemic cracks across the entire industry.
What Triggered the Rules
In February, Bithumb accidentally sent 2,000 BTC per person instead of 2,000 Korean won ($1.40) during a promotional event. The error amounted to roughly $42 billion in misallocated crypto. The Financial Services Commission (FSC) launched emergency inspections across all five major Korean exchanges immediately after. What they found went far beyond a single human mistake.
Most exchanges were only reconciling their books once every 24 hours. Three had no automatic kill switch to halt trading when discrepancies appeared. Four lacked multi-step approval systems for high-risk manual transactions. Two exchanges hadn’t even separated their general accounts from high-risk transaction accounts — a basic safeguard.
What Exchanges Must Now Do
The FSC announced a three-pillar reform package on April 6. Exchanges must run automated balance checks every five minutes, with alerts and automatic trading halts triggered by major mismatches. Monthly external audits replace the previous quarterly schedule, and public disclosures must now include asset-by-asset blockchain holdings rather than a simple coverage ratio.
For manual, high-risk transactions such as event payouts, exchanges must use separate accounts, deploy validity-check systems that automatically reject mismatched inputs, and require cross-verification by a third party before execution.
The FSC will also require exchanges to appoint dedicated risk management officers and establish risk management committees — standards already expected of traditional financial firms. Compliance checks move from annual to twice-yearly, with results reported to regulators.
DAXA, the industry body, will complete self-regulatory amendments this month, with systems built out by May. Key provisions will feed into Korea’s forthcoming second-phase Digital Asset Act.
The post Every 5 Minutes: Korea’s New Rule for Crypto Exchanges appeared first on BeInCrypto.
Chaos Labs has parted ways with the Aave ecosystem after serving as the crypto lending protocol’s main risk service provider for three years, citing a budget dispute and disagreements over how Aave should manage risk.
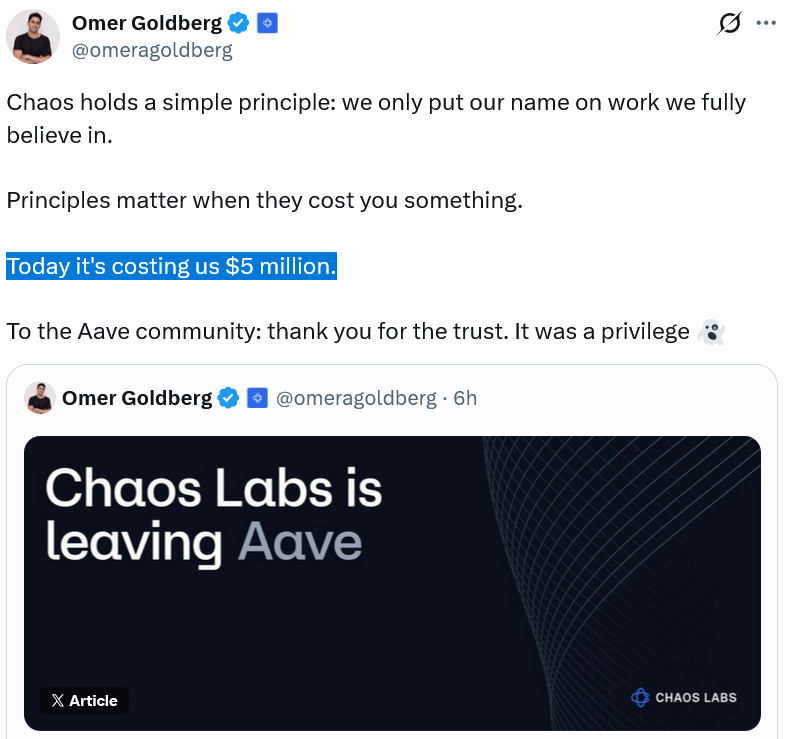
“This decision was not made in haste,” Chaos Labs founder Omer Goldberg said in a post to X on Monday. “We worked in good faith with DAO contributors. Aave Labs was professional and supported increasing our budget to $5m to retain us. However, we are leaving because the engagement no longer reflects how we believe risk should be managed.”

Aave Labs CEO Stani Kulechov said that Chaos didn’t depart on bad terms, but claimed that Chaos pitched a proposal seeking to become the sole risk provider and thus force out other partners — a compromise Aave wasn’t willing to accept.
Chaos played a key role in Aave’s back-end infrastructure, from pricing loans and managing risk in the Aave V2 and V3 markets since November 2022, during which Aave’s total value locked rose fivefold to $26 billion.
Risk has been a major talking point in the Aave community after a user lost $50 million in a trade while interacting with Aave’s interface on March 12. The following week, Aave said it would introduce an “Aave Shield” protection feature to deter users from high-risk trades.
As for Chaos’ departure, Goldberg said there became an increasing misalignment over how the parties thought risk should be managed. He noted that some Aave contributors had left, raising its workload, while also arguing that Aave V4’s expanded functionality introduced additional operational and legal risks that fell on Chaos’ shoulders.
“While Aave Labs is optimistic about a swift migration to V4, history suggests these transitions take months and even years,” Goldberg said. “Until V4 fully absorbs V3’s markets and liquidity, both systems need to be operated and managed simultaneously. The workload during the transition doesn’t halve. It doubles.”
Weighing the risk of a protocol failure, Goldberg said, “There is no regulatory framework, no safe harbor, and no settled law that answers the question of what a risk manager or curator owes when a protocol fails. If things work, the work is invisible. If things break, the blame is not.”
As such, “We are walking away from a $5 million engagement,” Goldberg said.
Chaos wanted Aave to boot LlamaRisk, Chainlink: Kulechov
Aave Labs CEO Stani Kulechov told a slightly different story, stating that Chaos wanted to be the sole risk manager and use its price oracles instead of Chainlink’s.
Following that request would have forced Aave to push out its other risk protocol partner, LlamaRisk, and thus abandon its two-layer economic risk model.
Related: DeFi lender Aave launches on OKX’s Ethereum L2, X Layer
Kulechov added Aave was unwilling to integrate Chaos-built price oracles, citing Aave’s “track record” with Chainlink’s services, which its “users are currently more comfortable with at scale.”
He also said Chaos was already “exploring winding down its risk consultancy services,” and that Aave had offered to double its payment to $5 million to retain them.
Cointelegraph reached out to Chaos Labs for comment.
Kulechov noted that Chaos’ departure hasn’t disrupted the Aave protocol, its smart contracts, token listings or network integrations.
Moving forward, Aave said it “will work closely with LlamaRisk to ensure a smooth transition” and maintain its two-layer economic risk model.

Chaos’ departure comes amid a protocol-wide feud over how much funding and revenue control Aave Labs should receive versus Aave’s decentralized autonomous organization.
Despite the internal issues, Aave crossed the $1 trillion mark in cumulative lending volume in late February, marking a first in the DeFi industry.
Magazine: Animoca teams up with Ava Labs, Shrapnel on Steam: Web3 Gamer
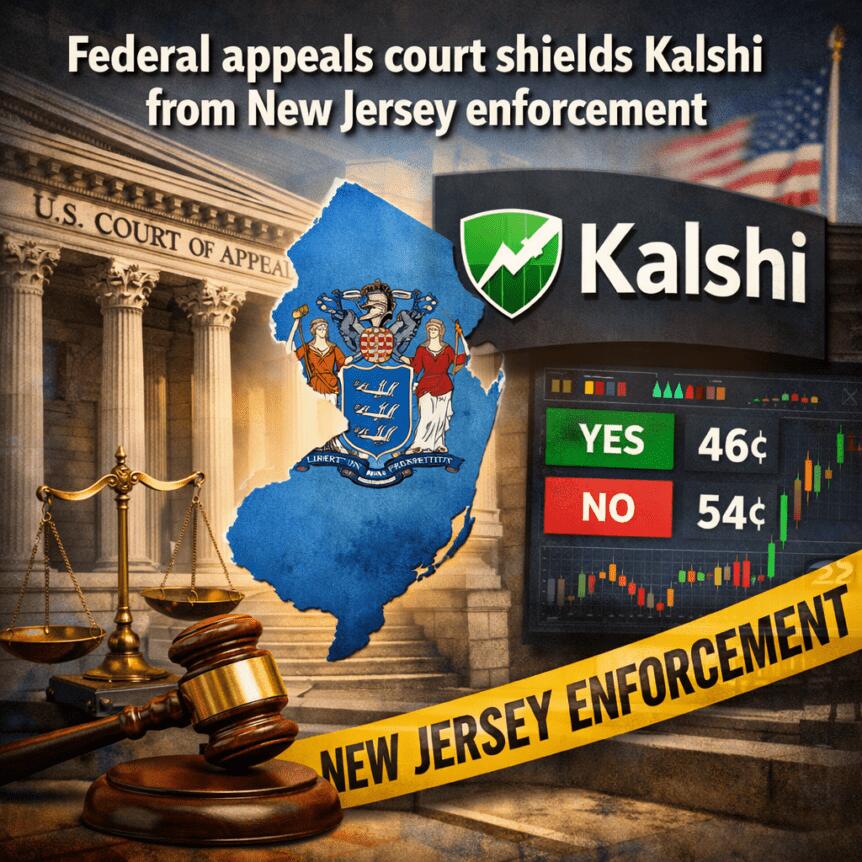
A U.S. Court of Appeals for the Third Circuit handed Kalshi, a prediction‑market platform, a notable victory by ruling 2-1 against New Jersey’s enforcement action over the company’s sports‑event contracts. The decision reinforces Kalshi’s argument that federal commodities law preempts state gambling statutes, potentially setting up a clash that could reach the Supreme Court and redefine how prediction markets are regulated in the United States.
The appellate panel affirmed a lower court finding that Kalshi operates as a designated contract market under the exclusive jurisdiction of the Commodity Futures Trading Commission (CFTC). In practical terms, the court suggested that allowing state authorities to police Kalshi’s products would interfere with federal oversight and create a patchwork regulatory regime that Congress aimed to replace with centralized federal authority.
“Allowing New Jersey to enforce its gambling laws and state constitution would create an obstacle to executing the Act because such state enforcement would prohibit Kalshi, which operates a licensed designated contract market under the exclusive jurisdiction of the CFTC, from offering its sports-related event contracts in New Jersey,” wrote Circuit Judge David J. Porter. “This state regulation is exactly the patchwork that Congress replaced wholecloth by creating the CFTC.”
The ruling arrived amid ongoing friction at the state level around prediction markets and sports betting. Just days earlier, a Nevada judge extended Kalshi’s ban on offering event‑based contracts, underscoring how state actions can diverge from federal strategy. The divergent state rulings have spurred debate about whether the Supreme Court should step in to clarify the authority boundaries between state gaming regulators and federal market overseers, particularly after the high court’s 2018 decision that opened the door for states to legalize and regulate sports betting.
In a dissent attached to the Third Circuit opinion, Circuit Judge Jane Roth warned that the majority’s framework could obscure the central question: whether sports‑event contracts are swaps and thus fall under federal regulation. Roth described Kalshi’s actions as a “performative sleight” aimed at masking the fact that Kalshi’s products function similarly to traditional sports gambling, suggesting the decision could have sweeping implications that deserve closer scrutiny.
Key takeaways
- The Third Circuit ruling in Kalshi’s favor reinforces federal preemption of state gambling laws where prediction-market contracts are concerned, upholding CFTC’s exclusive jurisdiction over such products.
- A timely dissent warns that the decision might oversimplify a complex overlap between swap regulation and sports betting, signaling potential future court battles.
- The decision lands against a backdrop of ongoing state actions, including a Nevada extension of Kalshi’s ban on event‑based contracts, illustrating a fragmented regulatory landscape.
- Following the ruling, the CFTC has continued to push its interpretation of authority, signaling a broader regulatory push that could influence the trajectory of prediction markets nationwide.
- The evolving legal framework may eventually force a clarifying ruling from the Supreme Court, with broad implications for platforms, users, and developers in the prediction‑market ecosystem.
Regulatory momentum and what it means for markets
At the center of the dispute is the CFTC’s stance that its jurisdiction over “swaps” and related contracts extends to sports and other event-based products offered on platforms like Kalshi. CFTC Chair Michael Selig has positioned prediction markets as a core priority since assuming the role, arguing that the agency’s jurisdiction is broad enough to cover event contracts tied to sports, politics, agriculture, and beyond. In recent months, Selig has opened a proposed rulemaking process to public comment and filed an amicus brief in a Ninth Circuit case connected to state gaming authorities, underscoring the agency’s willingness to push a federal approach to regulation.
Public remarks from Selig emphasize a view of regulation that focuses on the nature of contracts rather than the specific topic. “Our definition of commodity and statute is very broad,” he said at a policy summit, noting that the framework encompasses a wide array of event contracts—from sports to elections and commodities like grains. He also highlighted that regulators seek to carve out exceptions for contracts that are readily susceptible to manipulation, signaling a nuanced approach to what qualifies as a permissible prediction market product.
The CFTC’s posture has included legal action aimed at curbing what it sees as unlawful attempts by states to regulate prediction markets. The agency has pursued litigation against several states and authorities that it argues are overstepping or attempting to regulate these markets outside federal boundaries. The combined legal pressure from the CFTC—alongside the Third Circuit ruling in Kalshi’s favor—illustrates a broader strategic push to define a single federal framework for prediction markets in the U.S. economy.
What’s next for Kalshi and the broader ecosystem
Kalshi’s victory in the Third Circuit strengthens the platform as it navigates a challenging regulatory environment. Yet the path forward remains unsettled. State authorities remain active on this issue, and others could join the fray as more cases unfold and regulators refine their positions. The Nevada extension of Kalshi’s ban, in particular, serves as a reminder that state-level actions can persist alongside federal efforts, potentially creating a multi-front regulatory dynamic that platforms must navigate.
For investors, traders, and developers following Kalshi and prediction markets, the key questions revolve around regulatory clarity and market access. If the Supreme Court ultimately weighs in, the decision could set a nationwide precedent on whether federal law preempts state gambling regulations for prediction markets and how such markets should be supervised. In the meantime, market participants should monitor both federal regulatory developments—especially any new rulemakings from the CFTC—and state court outcomes, as these will shape product design, licensing strategies, and user protections across platforms.
Kalshi’s leadership has framed the Third Circuit decision as a major win for the industry and its millions of users. As the legal battle unfolds, the industry will be watching how a potential Supreme Court review could recalibrate the balance between state innovation and federal oversight in the fast-evolving world of prediction markets.
Readers should keep an eye on forthcoming court dockets and regulatory updates, as the next few months could yield important milestones that either reinforce the federal framework or push the conversation toward a broader reexamination of how prediction markets are regulated in the United States.
The crypto news today is turning bullish fast. Polygon now processes $730 billion in yearly stablecoin volume and just locked in Mastercard for on-chain payments, but even that kind of adoption only delivers small gains from a token sitting near its all-time low. TAO gained over 100% in March as money rotated into AI plays.
The name showing up everywhere right now is Pepeto, where a full exchange runs live with a Binance listing on the way, and $8.8 million in presale capital keeps growing. Forecasters point to 100x once trading opens, and the tools are already working for everyone who got in early.
Jack Dorsey’s Block launched BTCday on April 6, a Bitcoin faucet that gives away free BTC to new users as a way to push adoption across its Bitkey and Cash App products according to CoinDesk. Block already holds 8,883 BTC worth $594 million on its balance sheet.
When a company sitting on $594 million in Bitcoin starts giving it away to onboard new users, the bullish signal is impossible to miss. Money is flowing toward crypto projects that actually work, and the ones still at presale pricing are where the biggest gains in every cycle get made.
Top Crypto News Today Tokens: Pepeto, Polygon, and TAO Compared
Pepeto: The Live Exchange Driving 100x in the Crypto News Today Spotlight
Block is giving away free Bitcoin because adoption is the game now, and the projects that already have working tools are the ones that catch the wave. Pepeto runs a full exchange where traders swap, bridge, and screen tokens at zero cost, and that kind of daily utility is why forecasters tag it as a 100x entry and the hottest presale of the cycle.
Every trade on PepetoSwap costs zero, every cross-chain transfer through the bridge arrives at full value across Ethereum, BNB Chain, and Solana, and the contract screener grades every token before your wallet touches it, catching the traps that drain portfolios during volatile stretches.
The Pepe cofounder who built an $11 billion token with zero products behind it designed this exchange with a Binance veteran, and SolidProof audited every contract before the presale opened. Staking at 187% APY compounds holdings daily as listing day approaches.
At $0.0000001862 with $8.8 million raised during extreme fear, forecasters target 100x because a functioning exchange from the Pepe founder with a confirmed Binance listing is a setup this cycle has only produced once. Every wallet inside before listing day banks what latecomers spend a multiple to get after trading opens.
Polygon (POL): Polygon Handles $730B in Stablecoin Volume but Returns Stay Modest
POL trades at $0.092 per CoinMarketCap, sitting near its all-time low as Mastercard integrates Polygon for on-chain payments and the Gigagas roadmap targets 100,000 transactions per second.
At a sub-billion market cap, a recovery toward $0.20 gives roughly 2x over months. Solid infrastructure with big-name partnerships, but presale exchanges with confirmed listings are where 100x math actually works.
Bittensor (TAO): TAO Rallied 100% in March but the Big Multiples Are Behind It
TAO trades near $320 per CoinMarketCap, up over 100% in March as AI capital poured in. Grayscale filed for a Bittensor Trust, and targets reach $700, a solid 2x from here.
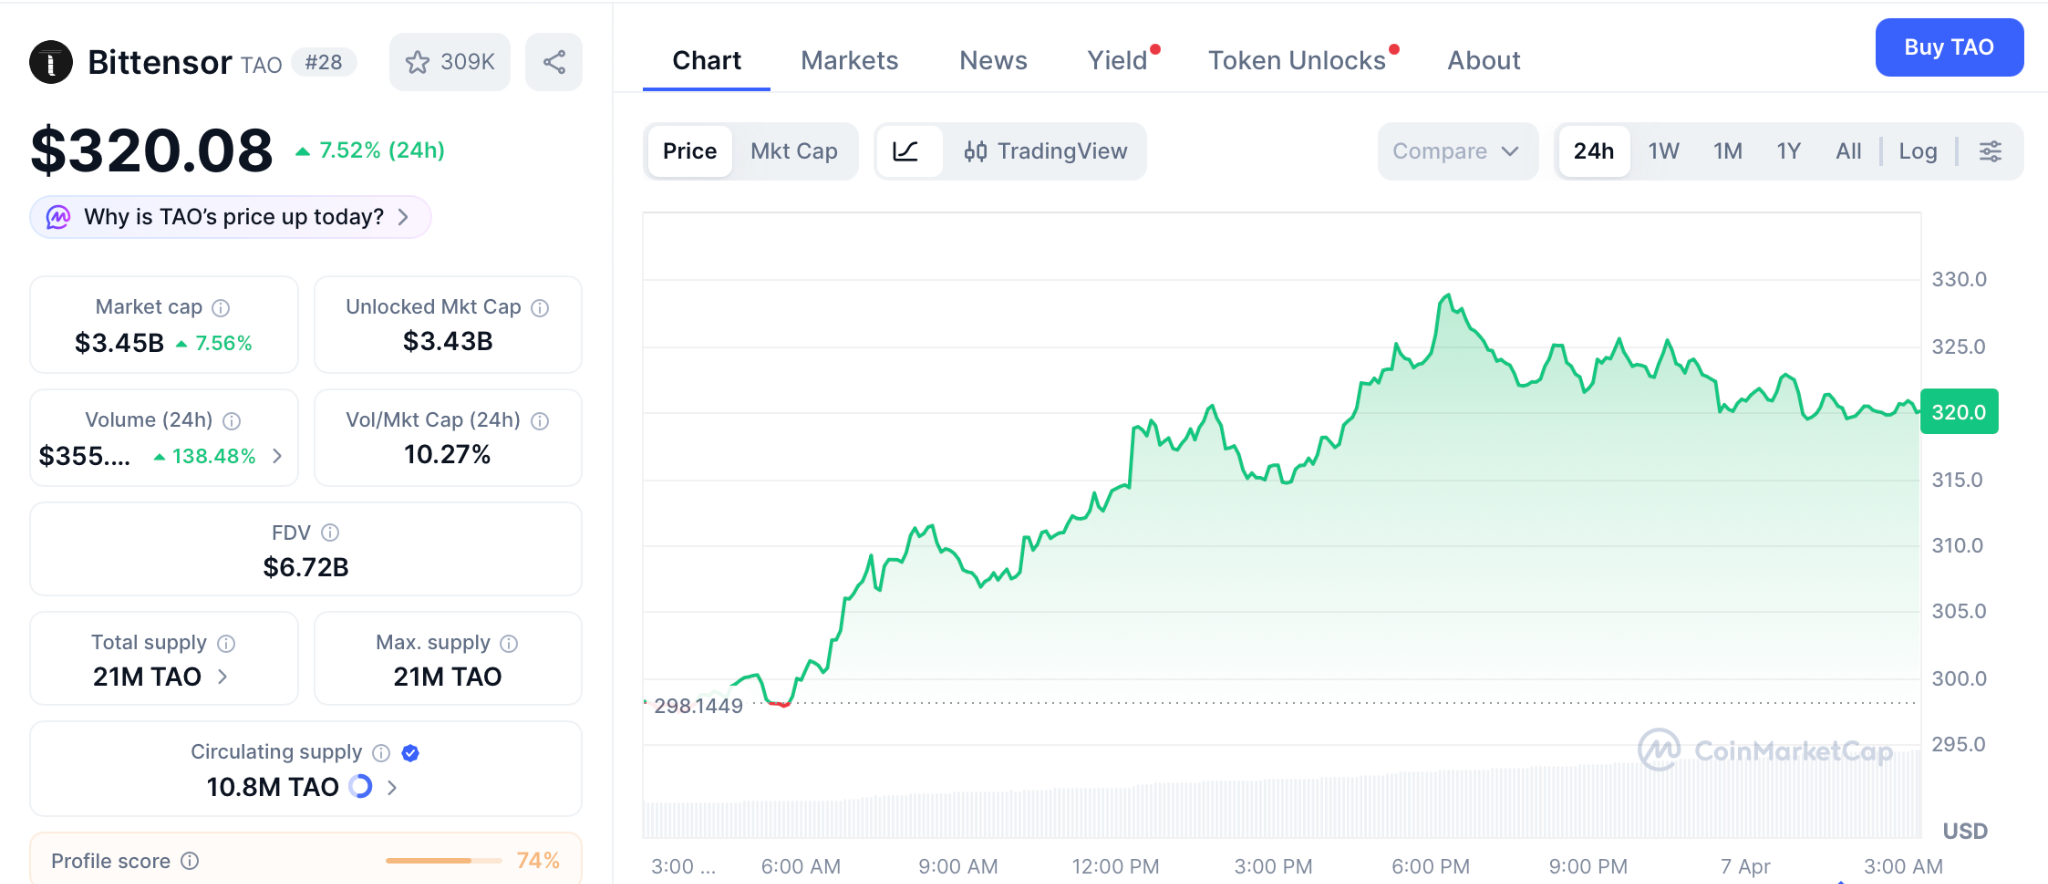
Strong AI growth, but the presale gap is where cycle-defining multiples get made. Pepeto offers the math that TAO at a $3 billion cap will not produce from this level.
Conclusion
Block just started giving away Bitcoin to push adoption, Polygon just locked in Mastercard, and TAO just landed a Grayscale filing. The crypto news today is bullish across the board, but the investors who turned $1,000 into six figures on early AAVE or early Pepe all did the same thing: they found a working project at presale pricing and moved before the listing changed the math.
The Pepeto official website is where the presale is still open. Get in before the Binance listing reprices everything, because projects that combine meme momentum, live tools, and a confirmed listing never stay at ground floor pricing once trading begins.
Click To Visit Pepeto Website To Enter The Presale

FAQs
What is the strongest pick in the crypto news today for 100x returns in 2026?
Pepeto is the strongest 100x pick in the crypto news today because it runs a live zero-fee exchange with a contract screener, a cross-chain bridge, and a confirmed Binance listing, all audited by SolidProof. The presale sits at $0.0000001862 with $8.8 million raised while Polygon and TAO offer under 2x from their current caps.
Why does the crypto news today point to Pepeto over Polygon and TAO for growth?
Pepeto delivers presale-to-listing distance that Polygon at $0.092 and TAO at $320 cannot produce from their existing valuations. The Pepe founder’s $11 billion track record, 187% APY staking, and a Binance listing on a confirmed timeline make it the highest-upside entry covered in the crypto news today.
Disclaimer: This is a Press Release provided by a third party who is responsible for the content. Please conduct your own research before taking any action based on the content.

“Now it’s time”: Deontay Wilder sets sights on one man after Chisora win

Mrs Gullon retires from Yarm’s Levendale Primary School after 30 years

Travelers Face Delays as Staffing Crisis Hits Peak Season


-

 NewsBeat4 days ago
Steven Gerrard disagrees with Gary Neville over ‘shock’ Chelsea and Arsenal claim | Football
-

 Business4 days ago
No Jackpot Winner and $194 Million Prize Rolls Over
-

 Fashion3 days ago
Weekend Open Thread: Spanx – Corporette.com
-

 Crypto World5 days ago
Gold Price Prediction: Worst Month in 17 Years fo Save Haven Rock
-

 Business1 day ago
Three Gulf funds agree to back Paramount’s $81 billion takeover of Warner, WSJ reports
-
Crypto World7 days ago
Dems press CFTC, ethics board on prediction-market insider trades
-

 Sports2 days ago
India men’s 4x400m and mixed 4x100m relay teams register big progress | Other Sports News
-

 Business3 days ago
Expert Picks for Every Need
-

 Business5 days ago
Login and Checkout Issues Spark Merchant Frustration
-

 Tech7 days ago
EE TV is using AI to help you find something to watch
-

 Sports7 days ago
Tallest college basketball player ever, standing at 7-foot-9, entering transfer portal
-
Tech7 days ago
Daily Deal: StackSkills Premium Annual Pass
-

 Tech7 days ago
How to back up your iPhone & iPad to your Mac before something goes wrong
-

 Tech7 days ago
What Are The Biggest Limitations Of Supercomputers?
-

 Crypto World6 days ago
Bitcoin enters the public bond market as Moody’s gives a first-of-its-kind crypto deal a rating
-
Crypto World6 days ago
Bitcoin stalls below key resistance as technical signals skew bearish
-

 Politics7 days ago
Transform Your Space with Stunning Small Works
-

 Politics6 days ago
Starmer’s centre has collapsed, and the left was right all along
-
Business2 days ago
No Jackpot Winner, Prize to Climb to $231 Million
-

 Fashion7 days ago
Zara Turns Up the Heat With New Swimwear
You must be logged in to post a comment Login