
CryptoCurrency
GBP/USD and EUR/GBP Struggle Near Resistance, Caution Builds

GBP/USD failed to climb above 1.3500 and corrected some gains. EUR/GBP is declining and trading below the 0.8725 support zone.
Important Takeaways for GBP/USD and EUR/GBP Analysis Today
· The British Pound is showing bearish signs below 1.3500.
· There is a key bearish trend line forming with resistance near 1.3470 on the hourly chart of GBP/USD at FXOpen.
· EUR/GBP is declining and showing bearish signs below 0.8725.
· There is a connecting bearish trend line forming with resistance at 0.8705 on the hourly chart at FXOpen.
GBP/USD Technical Analysis

On the hourly chart of GBP/USD at FXOpen, the pair started a fresh decline after it failed to stay above 1.3500. The British Pound traded below 1.3460 to enter a short-term bearish zone against the US Dollar.
There was a clear move below 1.3435. The pair even settled below 1.3430 and the 50-hour simple moving average. A low was formed at 1.3414, and the pair is now consolidating losses. On the upside, the GBP/USD chart indicates that the pair is facing resistance near the 23.6% Fib retracement level of the downward move from the 1.3502 swing high to the 1.3414 low at 1.3435.
The next key sell zone could be 1.3460 and the 50% Fib retracement. The main hurdle for the bulls might be near a bearish trend line at 1.3470. A close above 1.3470 could open the doors for a move toward 1.3500.
If the pair fails to recover, it could start another decline. On the downside, there is a key support forming near 1.3400. If there is a downside break below 1.3400, the pair could accelerate lower.
The next major area of interest might be 1.3360, below which the pair could test 1.3320. Any more losses could lead the pair to 1.3250.
EUR/GBP Technical Analysis
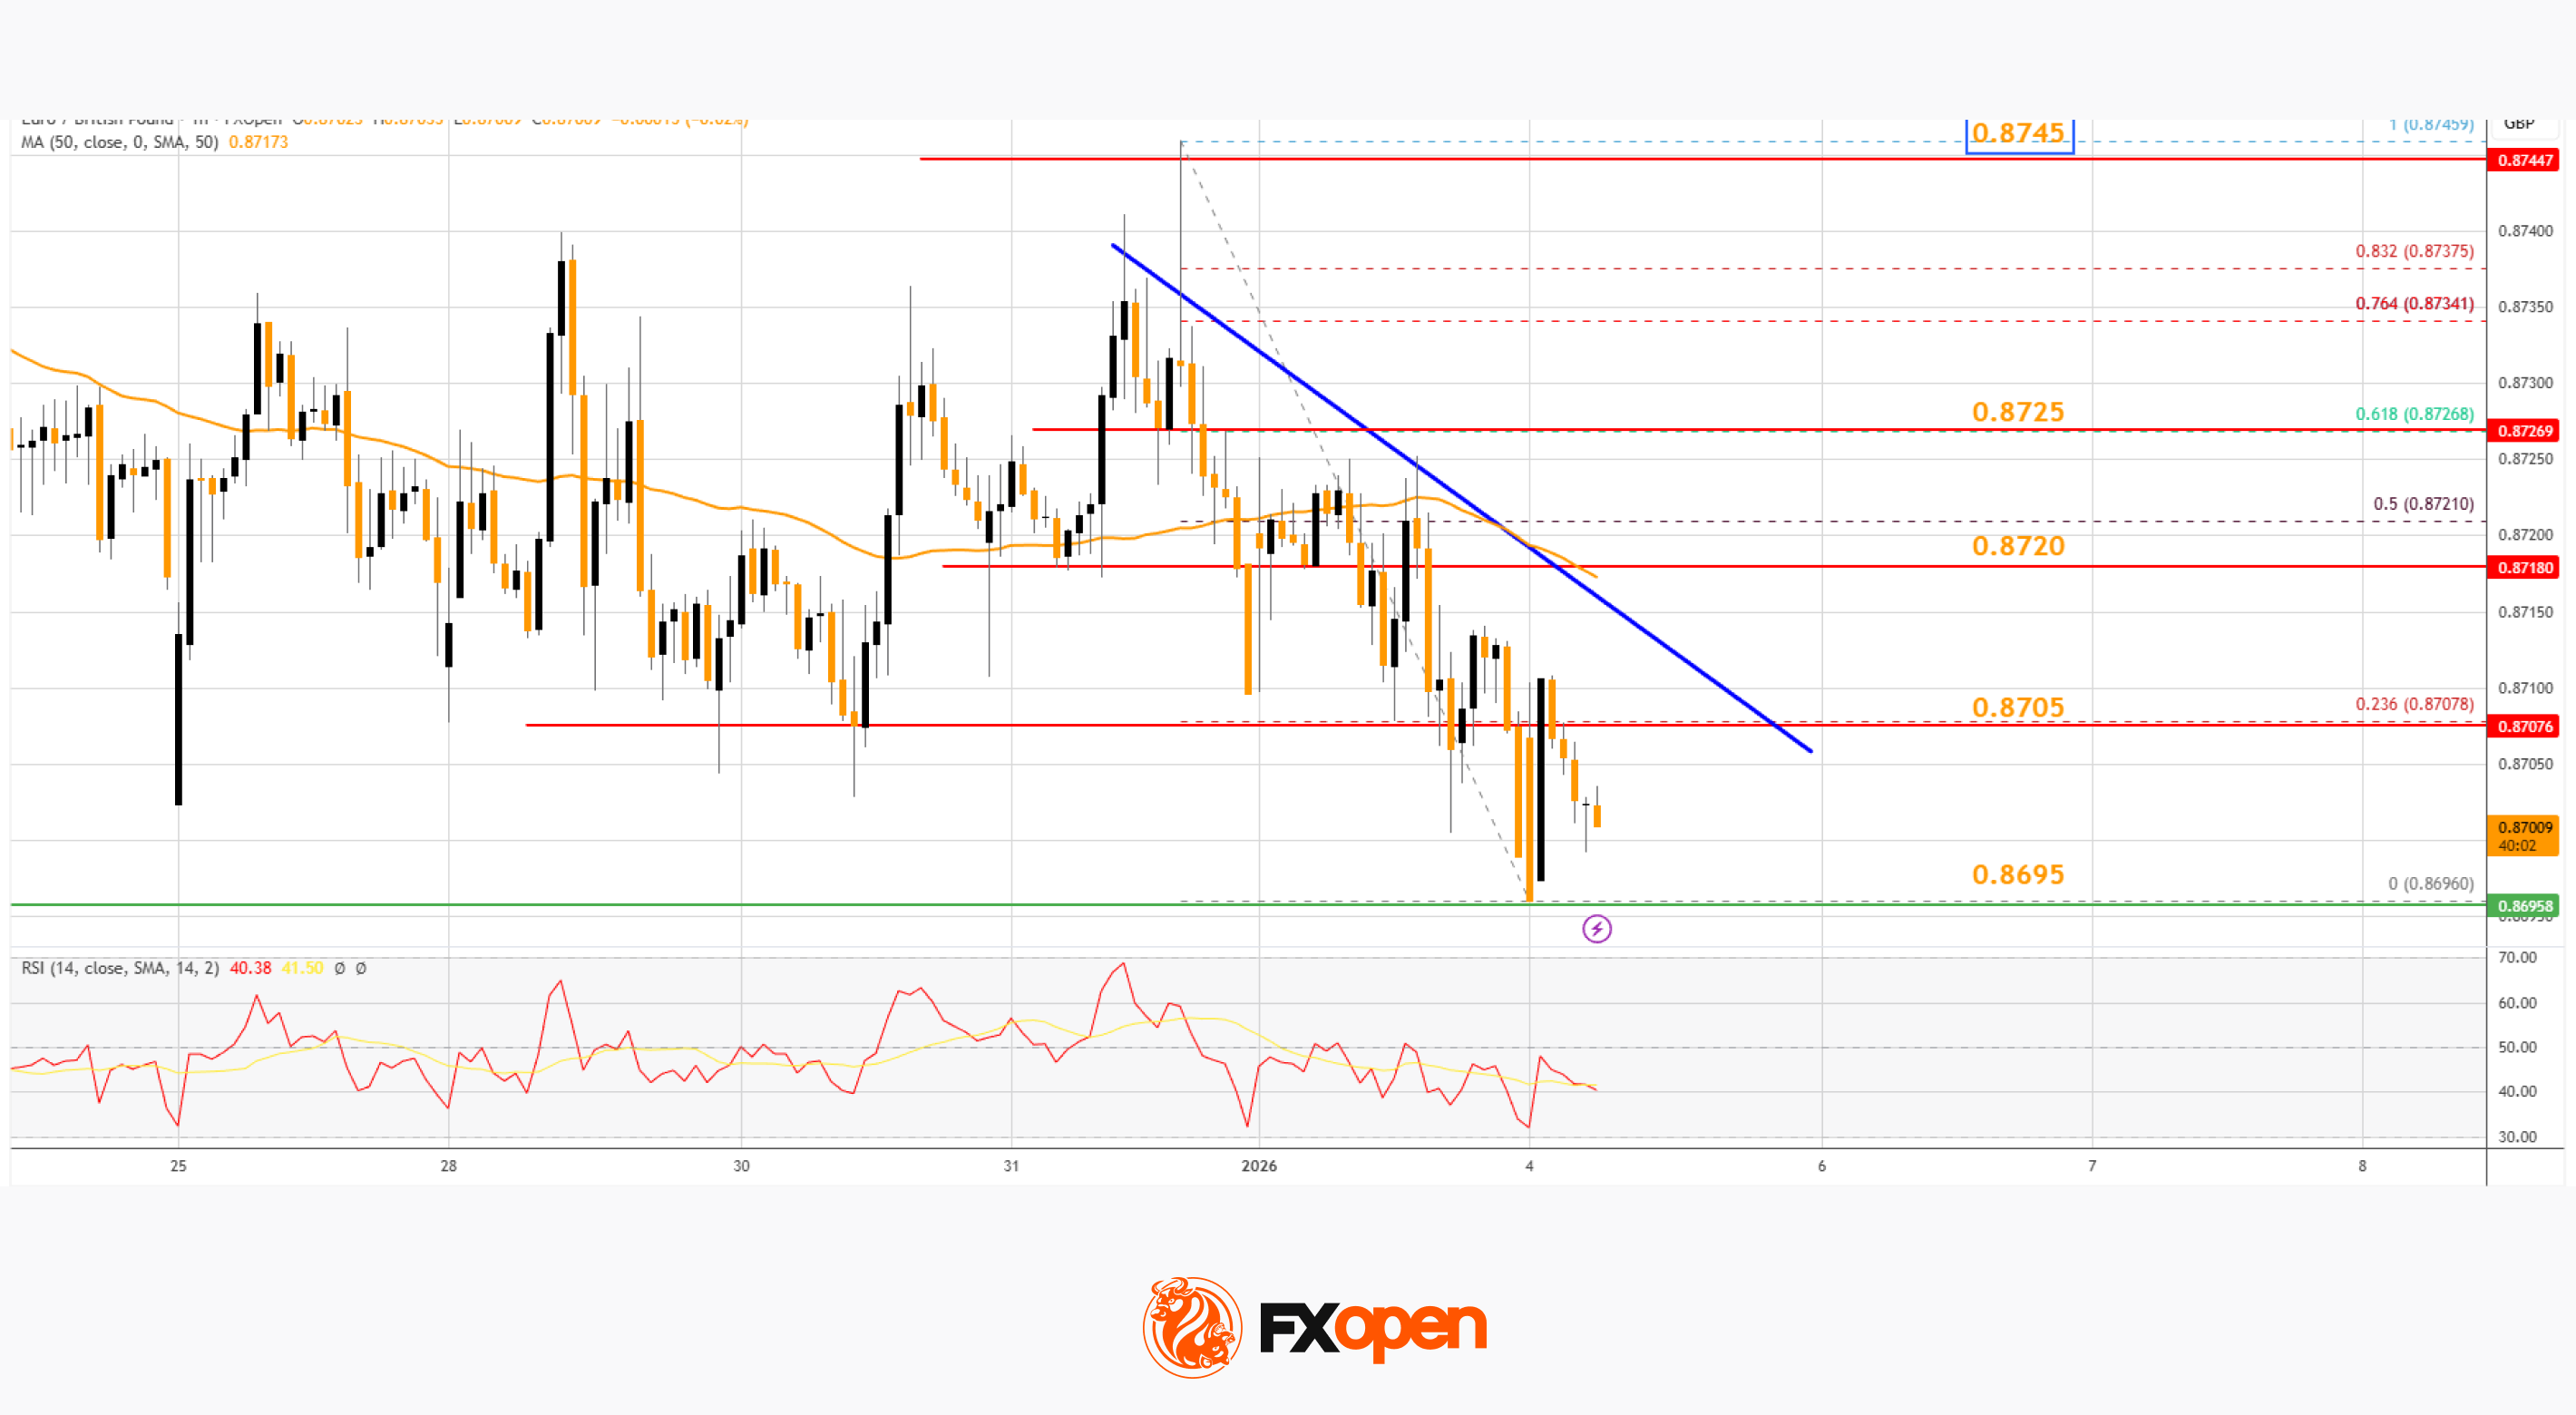
On the hourly chart of EUR/GBP at FXOpen, the pair struggled to gain pace for a move above 0.8750. The Euro settled below 0.8725 and started a fresh decline against the British Pound.
There was a clear move below the 0.8720 pivot level. The EUR/GBP chart suggests that the pair settled below the 50-hour simple moving average and 0.8720. A low is formed near 0.8696, and the pair is now consolidating losses.
Immediate resistance is near the 23.6% Fib retracement level of the downward move from the 0.8745 swing high to the 0.8696 low at 0.8705. There is also a connecting bearish trend line forming at 0.8705.
The next key breakout zone might be 0.8725 and the 61.8% Fib retracement. A close above 0.8725 might accelerate gains. In the stated case, the bulls may perhaps aim for a test of 0.8750. Any more gains might send the pair to 0.8780.
Immediate support sits near 0.8695. The next key area for the bulls sits at 0.8680. A downside break below 0.8680 might call for more losses. In the stated case, the pair could drop to 0.8650.
Trade over 50 forex markets 24 hours a day with FXOpen. Take advantage of low commissions, deep liquidity, and spreads from 0.0 pips. Open your FXOpen account now or learn more about trading forex with FXOpen.
This article represents the opinion of the Companies operating under the FXOpen brand only. It is not to be construed as an offer, solicitation, or recommendation with respect to products and services provided by the Companies operating under the FXOpen brand, nor is it to be considered financial advice.


