
CryptoCurrency
Gold Keeps Its Shine While WTI Crude Oil Slips Back Lower

Gold price remained supported and extended gains to $4,500. Crude oil is showing bearish signs and might decline below $55.00.
Important Takeaways for Gold and WTI Crude Oil Prices Analysis Today
· Gold price started a consolidation phase after a decent increase to $4,500 against the US Dollar.
· A key bullish trend line is forming with support at $4,460 on the hourly chart of gold at FXOpen.
· Crude oil prices failed to clear the $58.60 region and started a fresh decline.
· There is a connecting trend line forming with support at $55.70 on the hourly chart of XTI/USD at FXOpen.
Gold Price Technical Analysis
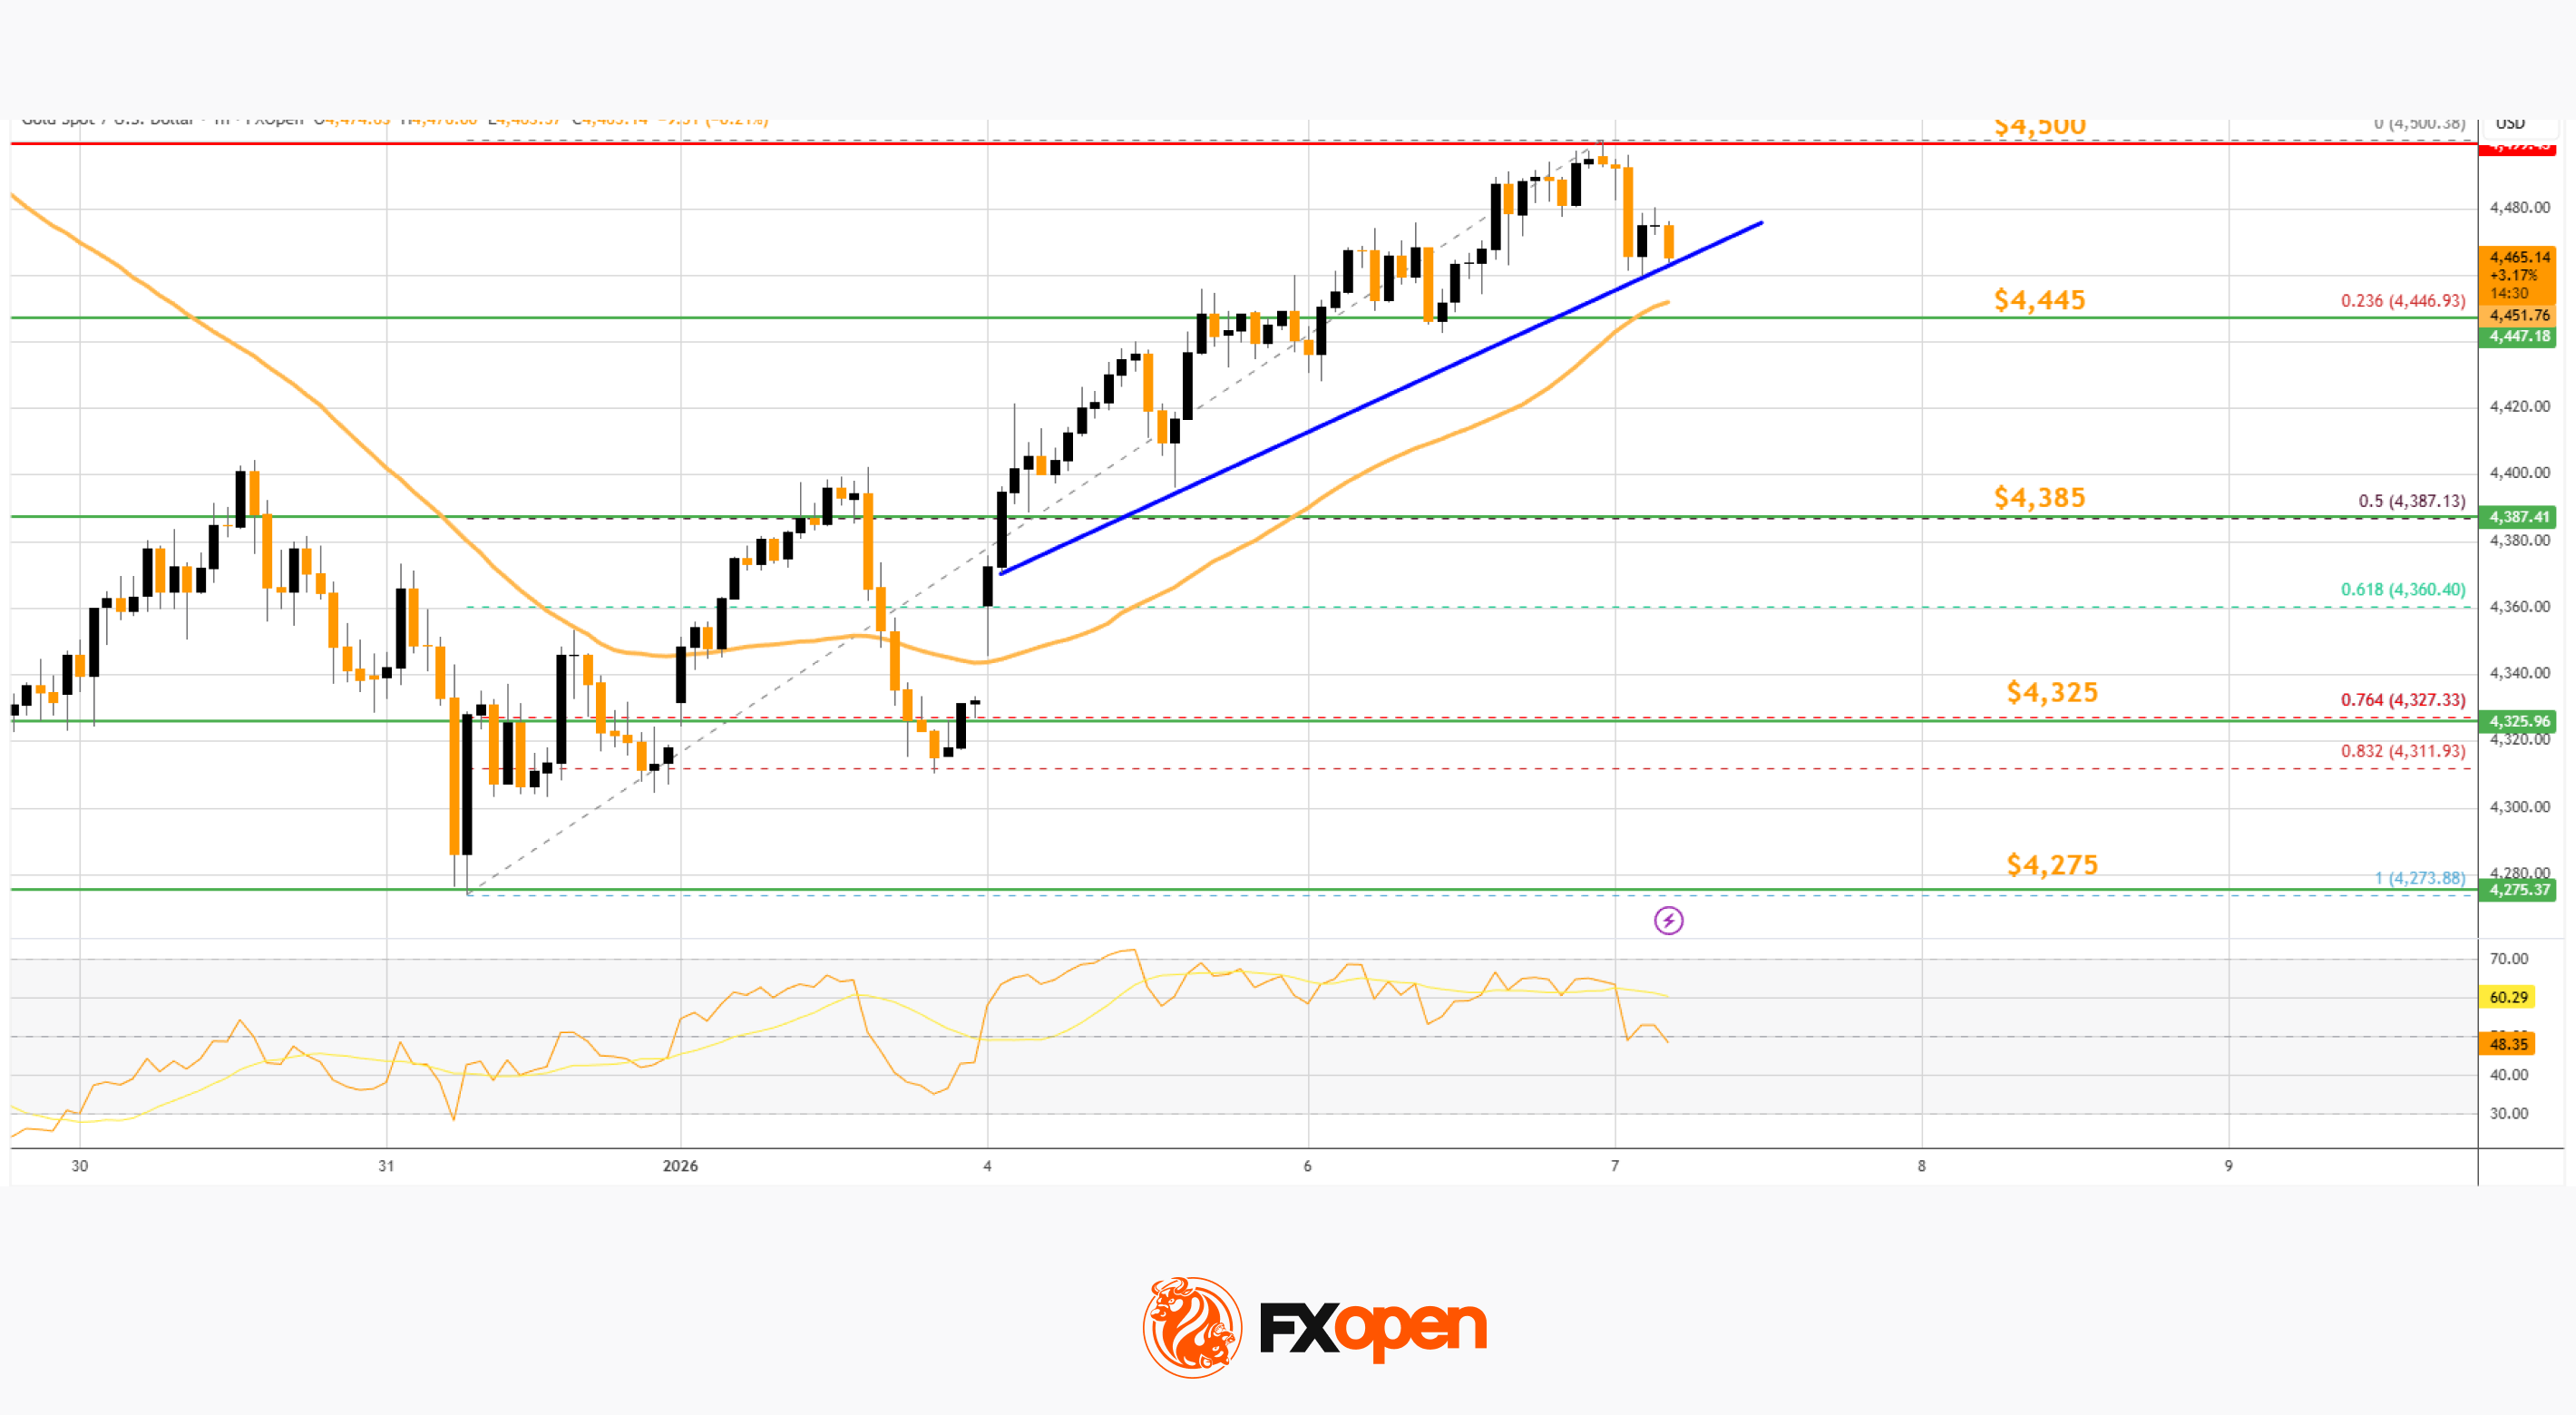
On the hourly chart of Gold at FXOpen, the price formed a base above $4,275. The price remained in a bullish zone and started an upward move within a range above $4,350.
There was a decent move above the 50-hour simple moving average and $4,400. The bulls pushed the price above the $4,420 and $4,450 resistance levels. A high was formed at $4,500 before the price saw a minor pullback.
Initial support on the downside is $4,460 and a bullish trend line. The first key breakdown zone could be $4,445, the 50-hour simple moving average, and the 23.6% Fib retracement level of the upward move from the $4,273 swing low to the $4,500 high.
A close below the trend line and the $4,445 could spark a major downside correction. In the stated case, the price could test the 50% Fib retracement at $4,385. Any more losses might push the price toward $4,325.
Immediate resistance is near $4,500. The next major hurdle for the bulls is $4,520. An upside break above $4,520 could send Gold price toward $4,550. Any more gains may perhaps set the pace for an increase toward $4,600 and a new all-time high.
WTI Crude Oil Price Technical Analysis
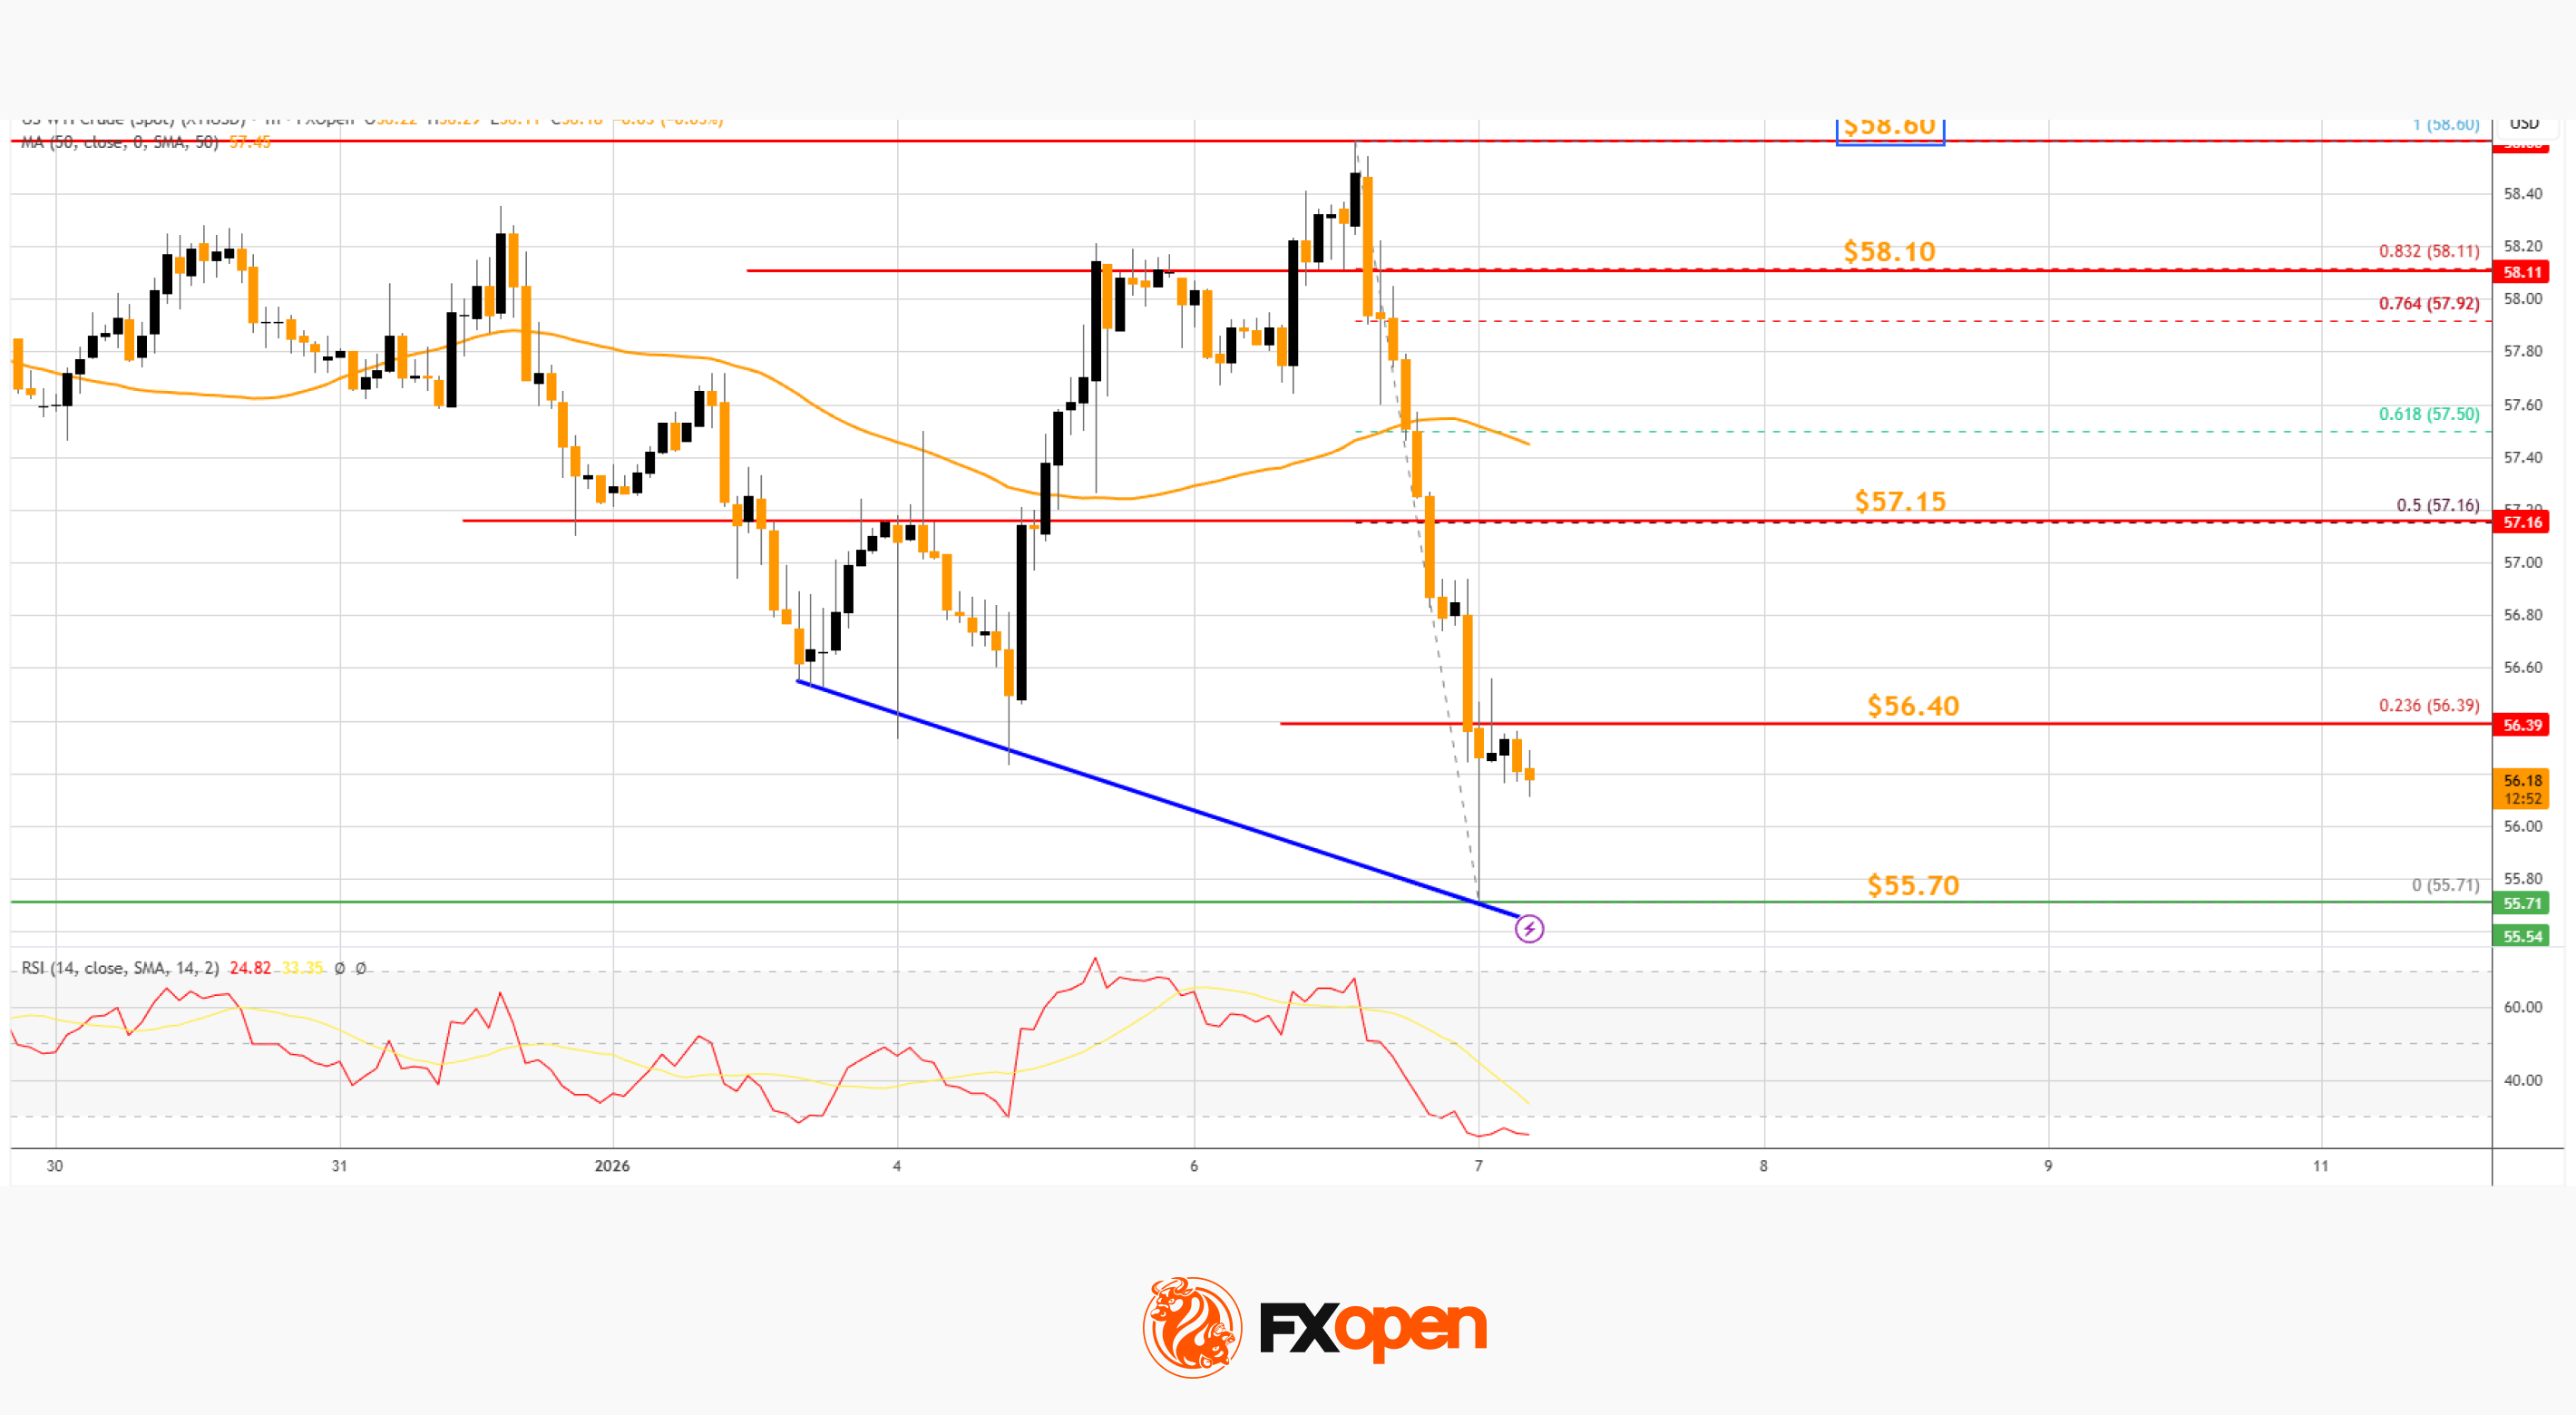
On the hourly chart of WTI Crude Oil at FXOpen, the price struggled to clear $58.60 against the US Dollar. The price started a fresh decline below $58.00.
The bears gained strength and pushed the price below $57.20 and the 50-hour simple moving average. Finally, the price tested $55.70 and recently started a consolidation phase. There was a move above $56.00 and toward the 23.6% Fib retracement level of the downward move from the $58.60 swing high to the $55.71 low.
The bears are now active below $56.50. If there is a fresh increase, the price could face a barrier near $56.40. The first major hurdle is near the 50% Fib retracement at $57.15.
The next stop for the bulls could be near $58.10. Any more gains might send the price toward $58.60. Conversely, the price might start another decline and test $55.70. There is also a connecting trend line forming with support at $55.70.
The next major area of interest for the bulls on the WTI crude oil chart is $55.00. If there is a downside break, the price might decline toward $53.50. Any more losses may perhaps open the doors for a move toward $52.00.
Start trading commodity CFDs with tight spreads (additional fees may apply). Open your trading account now or learn more about trading commodity CFDs with FXOpen.
This article represents the opinion of the Companies operating under the FXOpen brand only. It is not to be construed as an offer, solicitation, or recommendation with respect to products and services provided by the Companies operating under the FXOpen brand, nor is it to be considered financial advice.


