
Crypto World
Gold Rises Back Above $5,100 as Sharp Retreat Attracts Buyers

Gold prices extended gains for a second day, climbing back above $5,100 as a historical pullback from record highs offered a buying opportunity for investors.
In early trading, New York futures rose 3.4% to $5,102.90 a troy ounce following a 6% jump in the previous session.
The recent correction doesn’t signal a change in gold’s underlying drivers, with the medium-term outlook supported by continued central-bank buying, firm ETF demand, and persistent geopolitical and economic uncertainty.

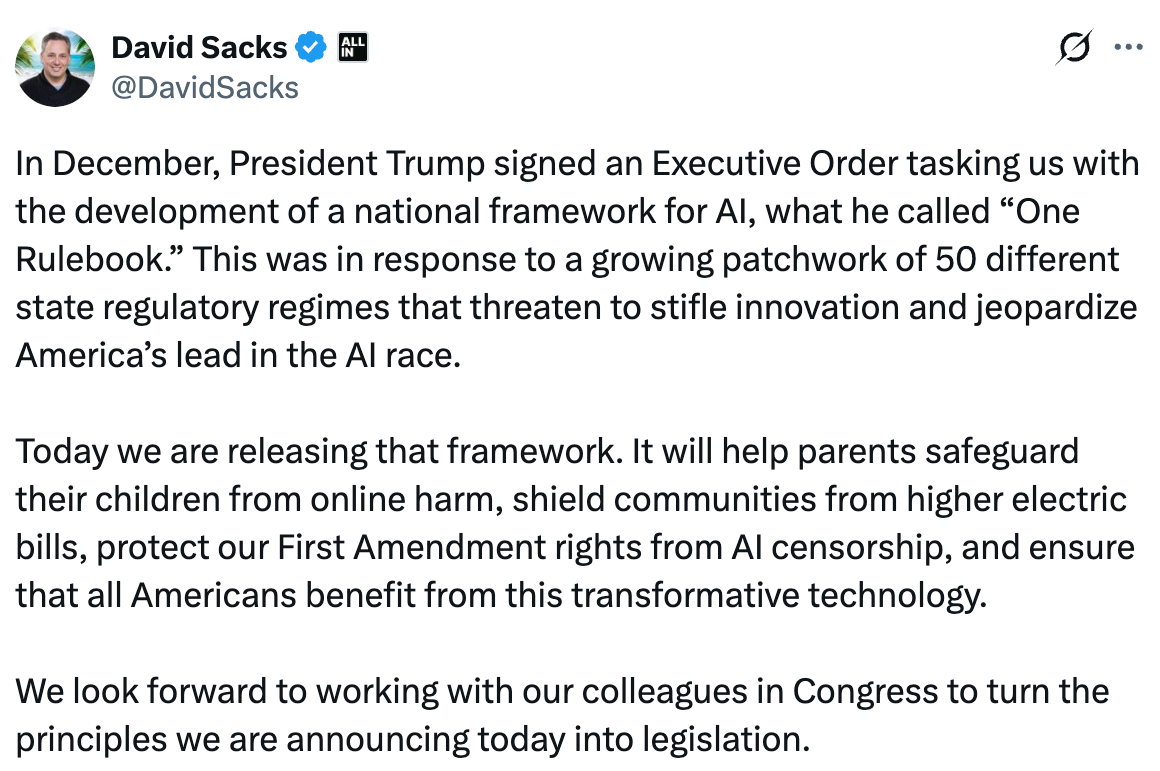
The Trump administration has released a national AI legislative framework for the United States, calling on Congress to establish a unified federal framework and warning that a patchwork of state laws could hinder innovation and competitiveness.
The framework is structured around six core policy areas: protecting children and empowering parents, strengthening communities, intellectual property and creator rights, free speech protections, accelerating AI innovation and workforce development.
At the center of the proposal is a push for a unified federal approach, with the administration urging Congress to preempt state-level AI laws it says could burden developers.

“Congress should preempt state AI laws that impose undue burdens,” the framework states, warning that “a patchwork of conflicting state laws would undermine American innovation and our ability to lead in the global AI race.”
The framework also calls for fewer barriers to AI deployment, regulatory sandboxes and expanded access to federal datasets, while opposing the creation of a new dedicated AI regulator.
On intellectual property, the proposal states:
Although the Administration believes that training of AI models on copyrighted material does not violate copyright laws, it acknowledges arguments to the contrary exist and therefore supports allowing the Courts to resolve this issue.
It also ties AI expansion to energy policy, urging faster permitting for data centers and support for on-site power generation, while saying residential ratepayers should not bear the cost of new infrastructure.
Additional measures include tools to protect minors online, efforts to combat AI-enabled fraud and workforce training initiatives aimed at preparing workers for AI-driven shifts.
The framework is nonbinding and will require Congressional action to be enacted.
Related: Super Micro co-founder arrested over alleged $2.5B AI chip smuggling scheme
Layoffs begin to mount as AI adoption accelerates across crypto
While the White House framework emphasizes workforce development and job creation in an AI-driven economy, it does not address the risk of job displacement as adoption accelerates across industries.
That shift has already become visible in the crypto sector, where companies are rapidly integrating AI across operations. Over the past two months, a growing number of fintech and crypto companies have reported layoffs.
In February, Jack Dorsey’s payments company Block said it would cut roughly 40% of its workforce, with the co-founder pointing to the rapid use of AI tools as a key driver behind the restructuring.
More recently, blockchain data provider Messari announced layoffs alongside a leadership change, as the company pivots toward an AI-first strategy following an earlier round of cuts in 2025.
The trend continued this week, with Crypto.com saying it plans to cut up to 12% of its workforce as it integrates AI across its operations. On Thursday, CEO Kris Marszalek warned on X that “companies that do not make this pivot immediately will fail.”
Volatility in the crypto market has also led to staff reductions. On Wednesday, the Algorand Foundation said it would cut about 25% of its workforce, citing broader market downturns and macroeconomic uncertainty.

Magazine: Are DeFi devs liable for the illegal activity of others on their platforms?


The FBI just issued a warning about a new crypto scam hitting Tron wallets.
Fake tokens impersonating the bureau are being airdropped directly into user wallets. The tokens mimic official seizure notices, telling holders their assets are frozen over money laundering violations. The goal is simple: panic the user into interacting with the token and hand over their credentials.
This is not a generic phishing attempt. It is a targeted social engineering campaign aimed at high-net-worth wallets, some holding 7-figure USDT balances. The FBI’s New York office issued the warning explicitly, telling users to ignore any token claiming to be from the agency.
The scam tokens were created 8 days before the warning dropped. By the time the alert went out, at least 728 wallets were already holding them.
- Impersonation Tactic: Scammers are deploying TRC-20 tokens branded as “FBI” assets to intimidate users into disclosing private keys under threat of AML investigation.
- Wallet Exposure: The campaign specifically targets active Tron wallets, with initial data showing multiple targeted addresses holding over $1 million in USDT.
- Market Impact: This tactic contributes to a 45% year-over-year increase in crypto fraud losses, signaling a shift from simple smart contract exploits to psychological coercion.
The Anatomy of the ‘FBI Token’ Scam
The attack is low cost and high volume. Tron’s cheap fee structure makes it easy to carpet-bomb wallets with fake TRC-20 tokens. One identified address executed roughly 920 transactions for just $40 in TRX fees.
The mechanic runs on fear. Tokens land in wallets with memos claiming assets are frozen over regulatory violations. From there, users are pushed toward phishing sites demanding personal details.
Others fall for address poisoning, where attackers generate addresses matching the first and last characters of legitimate contacts, banking on panic-induced copy-paste errors.
The numbers behind this kind of fraud are not small. The FBI confirmed crypto fraud losses reached billions in 2024, up 45% compared to 2022. The shift is clear. Hackers are targeting the user, not the code.
For exchanges handling TRX transactions, this federal advisory creates a direct compliance problem. A documented warning linking the network to law enforcement impersonation is not something compliance officers can ignore.
With the stablecoin bill in its final stages and pressure mounting on platforms to prove anti-fraud controls, Tron’s dominance in USDT transfers cuts both ways. It is critical infrastructure and the preferred rail for this exact type of scam.
That said, If an unverified token appears in your wallet, do not touch it.
Discover: The best new crypto in the world
The post FBI Warns of Fake Crypto Tokens Impersonating the Agency on Tron Network appeared first on Cryptonews.
Solana’s on-chain numbers just flashed a major warning sign.
DApp revenue collapsed to $22 million last month. That is the lowest it has been in 18 months. And for a network that was supposed to be thriving, that is a rough number to ignore.
The bulls still holding their SOL bags might want to pay attention. Because when revenue dries up like this, lower support levels tend to follow.
- Revenue Collapse: Ecosystem revenue dropped to $22 million, plunging from $36 million just two months prior.
- Derivatives Bearish: Funding rates have flatlined at 0% while put options trade at a significant 12% premium.
- Price Risk: Weak hands and whale hedging are pressing price against the $87 support, with $80 as the immediate downside target.
Solana DApp Revenue at 18-Month Low: What the Data Shows
Solana DApps just had their worst revenue month in over a year. We are talking $22 million, down from $36 million two months ago. That is a big drop.
To be fair, the whole market is hurting. BNB Chain revenue fell 52% in the same stretch. But Solana has a specific problem.
It is losing the perps war.

Spot DEX volume? Still solid. Raydium and Orca hold that down. But perpetual contracts are where the real money flows, and platforms like Hyperliquid, Edgex, and Zklighter now control over 80% of that market.
Hyperliquid even added licensed S&P 500 perps. Traders want broader exposure, and they are going wherever they can get it. That is not Solana right now.
The liquidity is still there. The revenue capture just is not.
Can Solana Price Hold Support or Is an $80 Retest Coming?
SOL is sitting at $87 right now. And the market is not feeling confident about it holding.
Price is down 70% from its all-time high. Derivatives data is not helping the case either.

Funding rates on SOL perps are sitting near 0%. Normal markets run around 9%. That gap tells you nobody wants to be long right now.
Options markets say the same thing. Delta skew has hit 12%, meaning puts are trading at a premium over calls. The big money is paying extra to hedge against a crash.
Lose $87 on a daily close and the next real support is $80. That retest is very much on the table.
For bulls to flip the script, SOL needs to reclaim $100 and hold it. Until that happens, the trend is down and the bears are in control.
Discover: The best new crypto in the world
The post Solana DApp Revenue Falls to 18-Month Low as SOL Price Risks $80 Retest appeared first on Cryptonews.
Crypto World
XRP Price Prediction: DeepSnitch AI Races XRP Towards $4 As Its March Launch Date Draws Near, while Solana Signals Comeback

Evernorth, an XRP treasury firm, has submitted an S-4 registration form to the United States Securities and Exchange Commission (SEC) to secure approval for a public merger with special purpose acquisition company Armada Acquisition Corp. II.
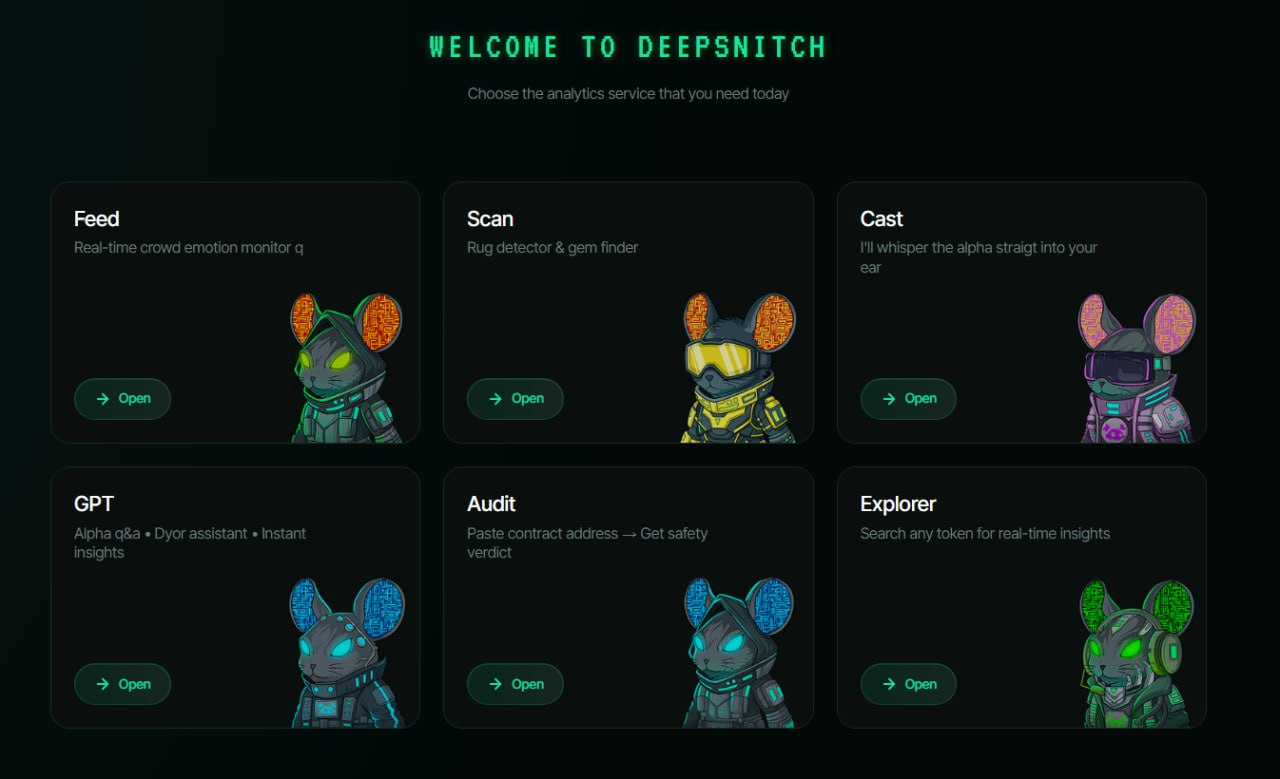
Amid this development, DeepSnitch AI, an emerging cryptocurrency project, is making rounds for deploying AI agents that can track money flows across chains. With these tools, traders and analysts can determine what institutions are buying at any given time.
Since its presale began, DeepSnitch AI has raised over $2.25 million and is currently in stage seven, with its token, DSNT, trading at $0.04577. While recent XRP price predictions hint at a rally to $4, 100x projections around DeepSnitch AI turn this target into a race between both projects.

Evernorth submits S-4 filing to close a $1 billion SPAC deal
The S-4 filing Evernorth submitted to the SEC on March 18 stipulated that the merged entities will operate as Evernorth Holdings Inc subsequent to the merger. It will appear on Nasdaq under the ticker XRPN for its Class A common stock and XRPNW for warrants.
According to the filing details, Evernorth Holdings Inc will receive roughly 473 million XRP, derived from Ripple’s contribution and proceeds from open-market transactions.
Initial reports noted that the yield from the merger transaction will exceed $1 billion, consisting of investments from Pantera Capital, SBI, GSR, Ripple, and Kraken. The XRP price prediction has since turned bullish following this move.
Latest Ripple price prediction for 2026 as presale crypto takes centre stage
1. DeepSnitch AI stuns non-believers with 203% uptick ahead of March exchange debut
Most investors learn about a token only after it’s printed 10x, 100x, or 1000x in gains. DeepSnitch AI is a new crypto-AI project focused on helping investors spot projects like this in their early stages, before they become public knowledge.
The platform is basically an intelligence hub of on-chain data. Therefore, you can track on-chain events and stay ahead of the curve information-wise. In terms of making better trading decisions, this will be a game-changer.
At the core of DeepSnitch AI are five AI agents that bring its functionalities to life. Not only do they gather actionable intelligence across chains, but they also perform security audits to ensure that you do not fall victim to scams.
As of now, DeepSnitch AI is gearing up for its exchange listing on March 31st after raising $2.25 million, during which it will make its official entry on Uniswap. Some believe it could beat XRP to $4, representing a 100x increase from its current price of $0.04577.
2. XRP price prediction: Can XRP touch $4 after pundits highlight a crucial breakout level?
Mounting selling pressure across the crypto market sparked a surge in volatility in XRP on March 18, sending the asset into a sideways trade.
In the last seven days, however, XRP registered a notable price surge, rising 5.8% to $1.45, outshining most large-cap cryptocurrencies over the same period.
Market analyst Ali Martinez called attention to the price of XRP arriving at a critical breakout zone that has been forming for years on the higher timeframe.
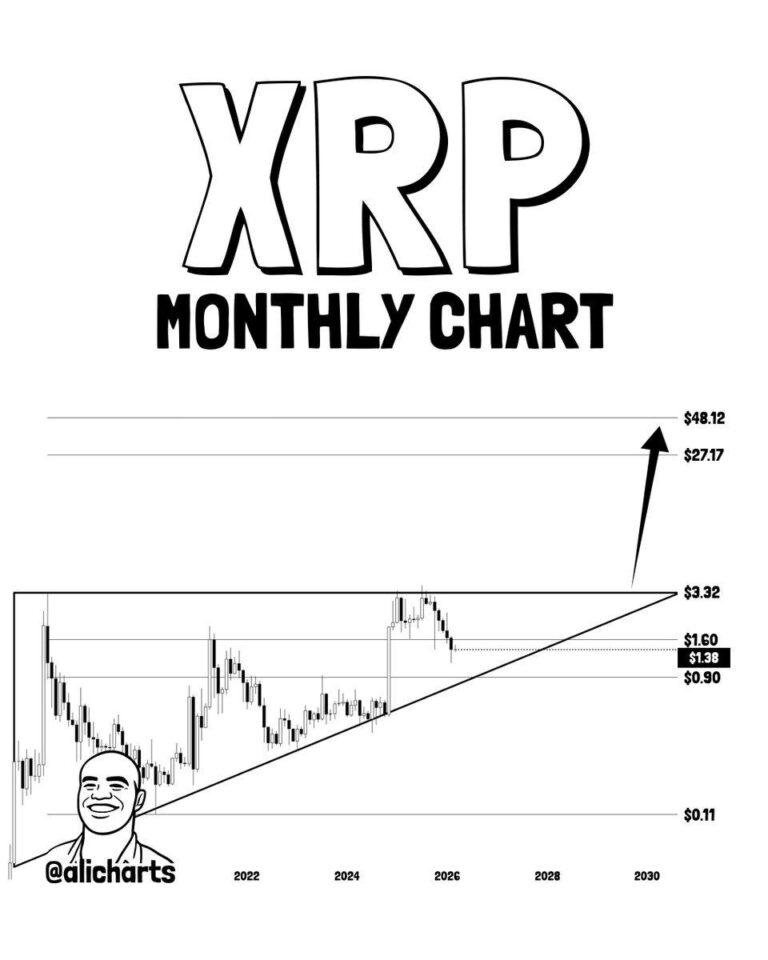
According to him, breaking out of this level could usher XRP to $4. This XRP forecast for 2026 mirrors DeepSnitch AI’s post-launch target.
3. Solana price prediction: SOL sets for recovery from $90 support
Following the unexpected US PPI data release, the broader crypto market entered a downward trend, including Solana, which fell 4% over the past seven days to the $90 support level.
Based on the report published by the US Bureau of Labour Statistics, PPI jumped 0.6% in February, while core PPI rose 0.3%, both figures surpassing economists’ forecasts and signalling persistent inflationary pressures.
Notwithstanding, the chart shows SOL on an ascending trendline that has provided support to the price. If this support holds, the price could head towards $100 in the days ahead.
Conclusion
The race between XRP and DeepSnitch AI is driven by investor sentiment and the adoption of narratives. AI-driven innovations are taking over the crypto space, and DeepSnitch AI offers game-changing solutions built on this technology.
While the current XRP market outlook and Ripple price prediction for 2026 are bullish, DeepSnitch AI has taken centre stage. It has secured over $2.25 million in investments from investors and is set to soar 100x post-launch.
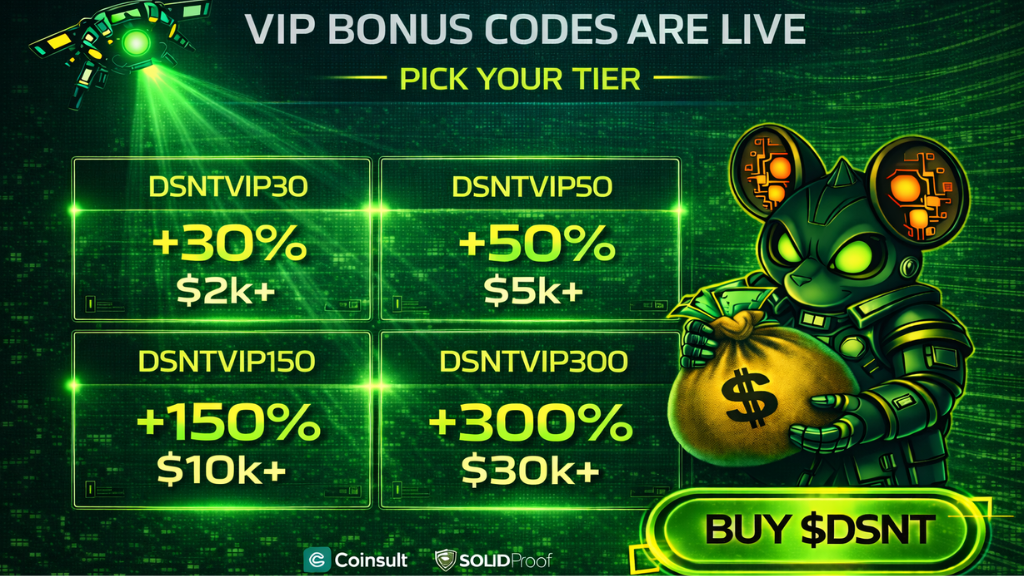
Before its launch on March 31, investors can get a 300% bonus on purchases of $30,000 or more. After launch, this investment can reach $1 million as DSNT’s price grows. However, how high DeepSnitch AI will trade post-launch remains to be seen.
Visit the official website for more information, and join X and Telegram for community updates.
FAQs
1. What is the XRP price prediction for 2026?
Crypto analyst Ali Martinez forecasts XRP’s potential ascent to $4. More optimistic projections suggest XRP could trade at $6 by the end of the year. DeepSnitch AI could also reach this level if it achieves the 100x growth it’s predicted to achieve.
2. Can XRP reach $10?
Even though this price point is reachable, it is quite ambitious for the current XRP market outlook. Experts opine that this would be a realistic target for 2029-2030. DeepSnitch AI, on the other hand, riding on fresh project momentum, could hit this target within the year.
3. What is the long-term Ripple price prediction for 2030?
While long-term projections vary, experts have shared several targets for XRP in 2030. Estimates put XRP between $10 and $15, with more bullish targets set between $20 and $25, provided XRP dominates the payment market. DeepSnitch AI’s 2030 projection suggests asset trading above $500, making now the best time to buy.
Disclaimer: This is a Press Release provided by a third party who is responsible for the content. Please conduct your own research before taking any action based on the content.

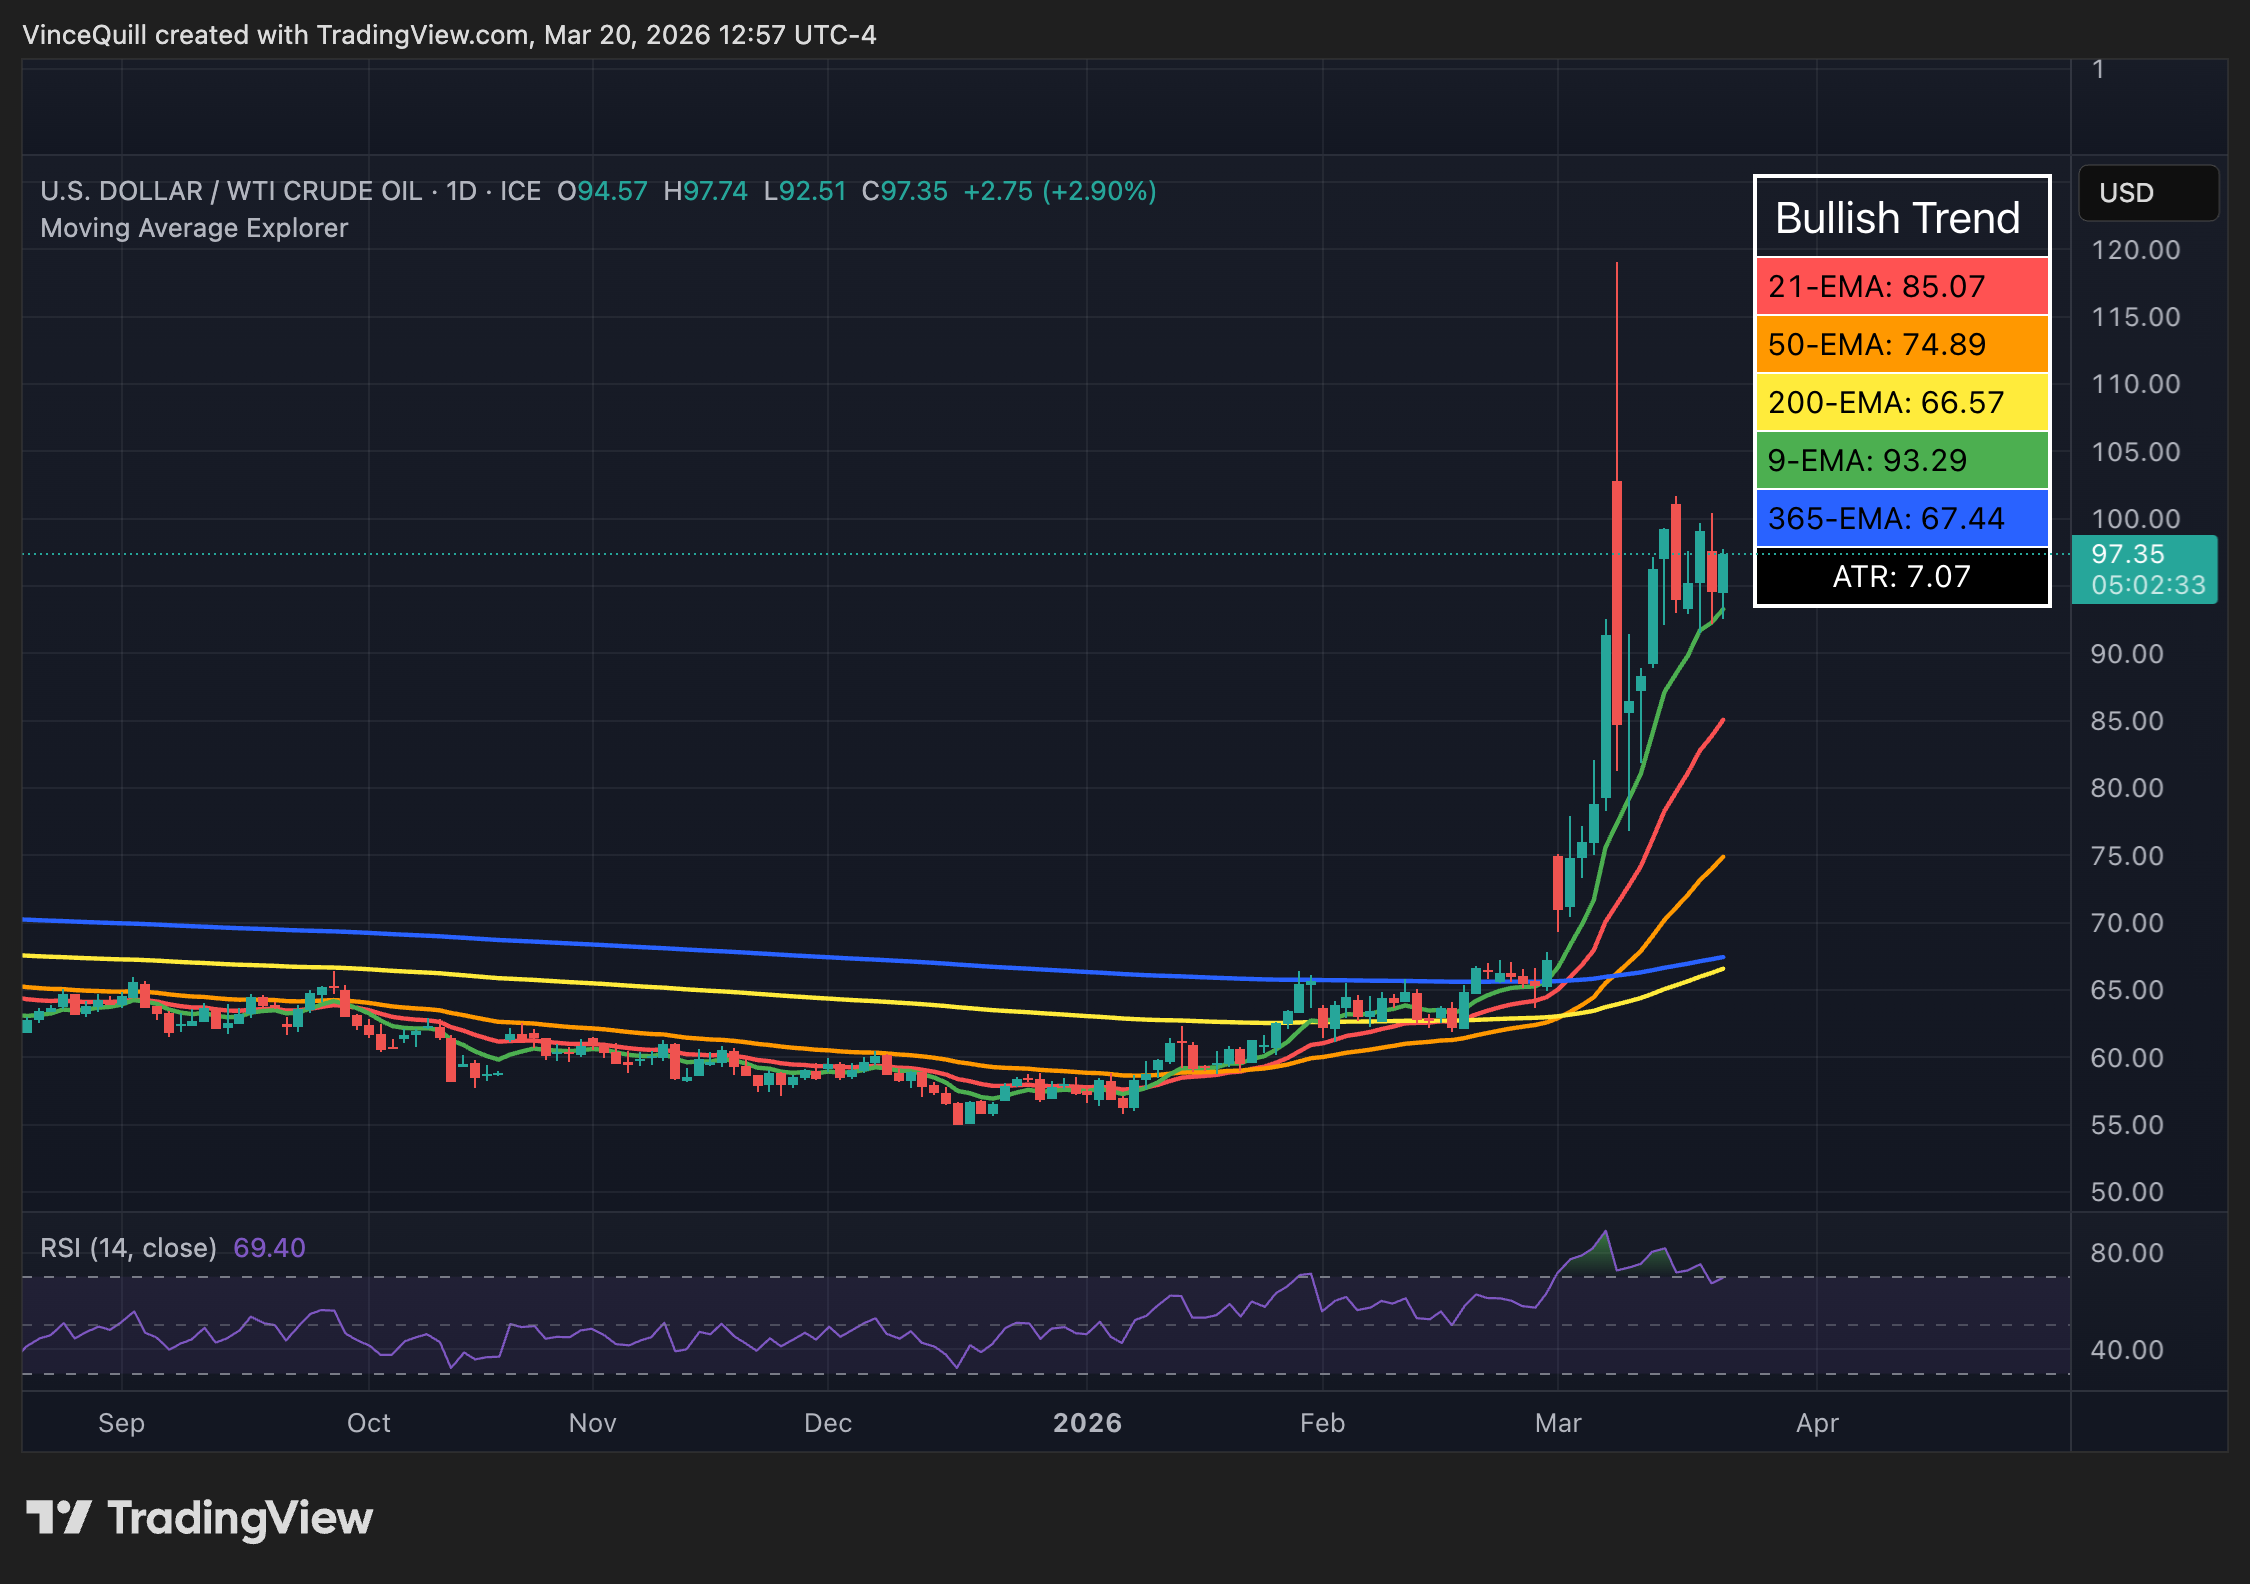
Traders are miscalculating the severity and the duration of economic fallout from the Middle East conflict and are pricing in a “TACO” trade, which stands for “Trump always chickens out,” according to market analyst and founder of the Coin Bureau, Nic Puckrin.
The term was coined by Wall Street and refers to US President Donald Trump backing down in geopolitical conflicts. However, Puckrin warned that “Trump is not in sole control of the situation,” and there are no easy or quick exits from the war.
If oil continues to trade above $100 per barrel, economic growth will slow, and Personal Consumption Expenditures (PCE) inflation will rise by up to 1 percentage point, Puckrin said.

This environment could lead to stagflation, an economic scenario where inflation rises, while economic growth and employment fall, a “dreaded” situation, Puckrin said. He added:
“If oil stays above $100 throughout Q2 and into Q3, stagflation becomes a real problem for the Fed. In the 1970s, the S&P 500 went essentially nowhere in real terms for an entire decade once stagflation took hold.”
Markets might have a “rude awakening” to the war in the Middle East, Puckrin said, stressing that the longer the Strait of Hormuz, a waterway that 20% of the global oil supply passes through, remains closed, the economic effects will worsen.
“Even if the Strait of Hormuz were to open today, the disruption to the Gulf’s oil-producing infrastructure will take months to rebuild,” he said.

Energy is a critical input to all economic activity, and a rise in energy prices typically raises the price of all other goods and services.
Elevated inflation means interest rate cuts, which are stimulative to risk assets like crypto, will not materialize, and the Federal Reserve may raise rates to combat inflation, quashing any hopes of easing liquidity conditions to spur a crypto market rally.
Related: Bitcoin whales shift $100M+ as oil spike rattles markets
Federal Reserve chairman says Middle East war clouds the central bank’s forecasts
The Federal Open Market Committee (FOMC), the group that determines interest rate policy in the United States, held interest rates steady in March, leaving the Federal Funds rate between 3.5% and 3.75%.
Rate cut odds have all but vanished for the upcoming April FOMC meeting. Meanwhile, there’s a small but growing probability — aorund 12% — that the FOMC will raise rates next month, according to the Chicago Mercantile Exchange’s (CME) FedWatch tool.

“The implications of events in the Middle East for the US economy are uncertain in the near term. Higher energy prices will push up overall inflation,” Federal Reserve Chairman Jerome Powell said at a press conference on Wednesday.
However, Powell clarified that it is still “too soon” to accurately gauge the scope and severity of the potential economic effects from the war and the disruption to the global energy infrastructure.
Magazine: Bitcoin is ‘funny internet money’ during a crisis: Tezos co-founder
Crypto World
Solana Price Prediction for 2026 as SEC Clarifies Crypto Assets and Pepeto’s Working Exchange Sets Up for 100x Before the Binance Listing
The SEC just clarified that it considers most crypto assets not securities under federal law, and the ruling changes the regulatory deck for every digital asset from Solana to the smallest presale. Japan rolled out retail USDC yield through SBI, and Circle is pushing the UK to shape global stablecoin rules. Three major economies are simultaneously building regulated stablecoin infrastructure.
While the solana price prediction hinges on macro cooperation, Pepeto’s working exchange ecosystem is already measurable, and the presale at $0.000000186 gives you the chance to see exactly what you are buying at pre listing pricing before the Binance listing changes everything.
The SEC issued its most definitive statement on crypto classification, with Chair Paul Atkins calling it clear lines in clear terms according to CoinDesk. Japan’s SBI VC Trade launched a retail USDC lending service for consumer yield on regulated stablecoins.
SOL trades at $88 after hotter than expected PPI data reinforced fears of delayed rate cuts according to CoinMarketCap. The solana price prediction depends heavily on the Fed’s tone, which remains uncertain.
Solana Price Prediction and the Presale Where the Tools Are Already Working and the 100x Math Is Conservative
Pepeto’s Exchange Went Live During Presale and the Entry at $0.000000186 Is the Chance to Position Before the Listing Changes the Price
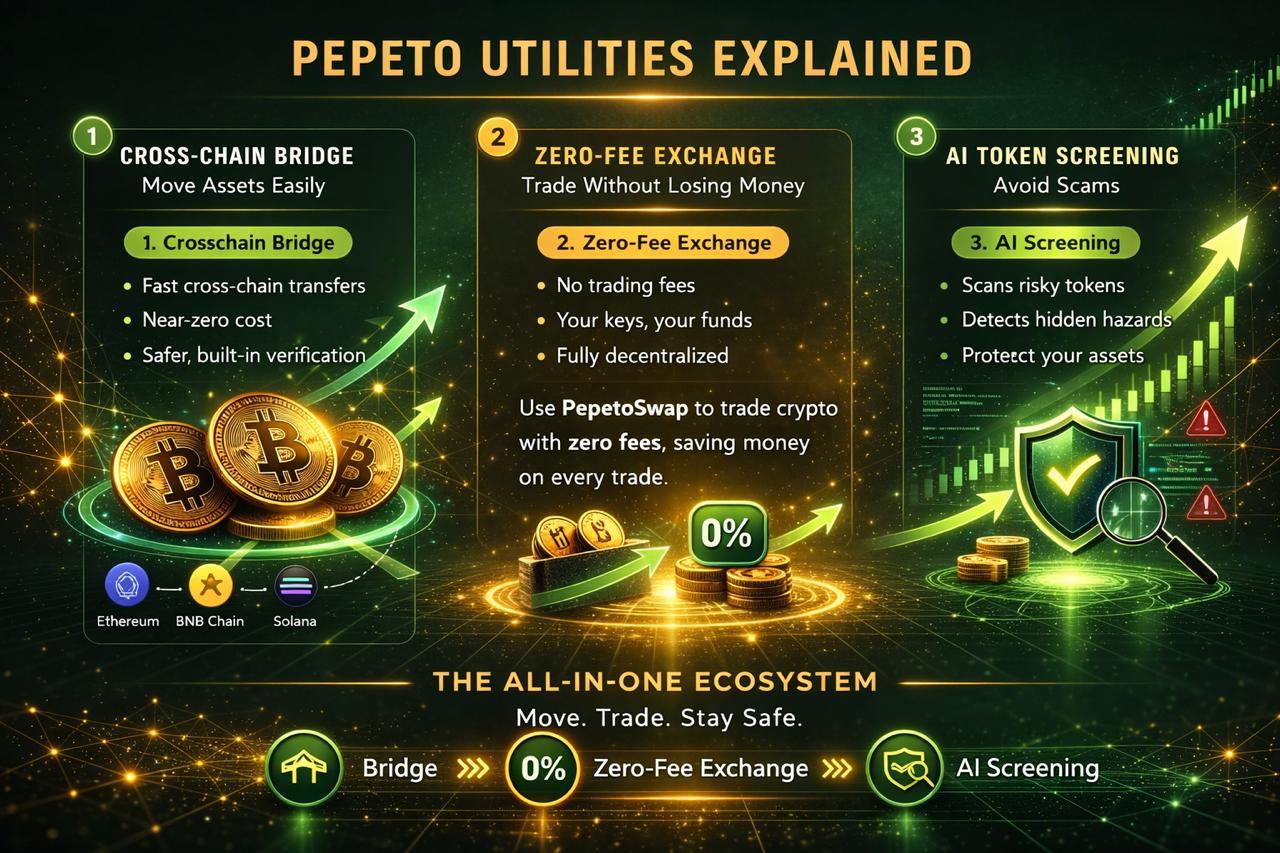
Pepeto’s exchange tools went live during presale, and the daily workflow they enable is simple compared to the hours of manual research traders do right now. PepetoSwap handles every trade at zero cost. The bridge moves capital across Ethereum, BNB Chain, and Solana without fees. The risk scorer gives you a breakdown of any contract’s danger signals before your wallet approves.
Five minutes of due diligence done with tools that are sharper than anything else out there, and all of that would normally take hours and be less reliable. The ecosystem is built to change the way retail traders protect their capital, and the reason this token has 100x to 150x potential is not just the utility. It is the timing.

Created by the mind who took the original Pepe to $7 billion, Pepeto is approaching the Binance listing at exactly the moment when the market is crying out for trust and transparency. Nothing like this set of tools has existed before at presale pricing, and the need is real across every trading demographic. When something this useful becomes a daily habit for traders worldwide, and each new user adds buying pressure on PEPETO, the token does not need manufactured hype because the product is the catalyst.
The presale is in its final stretch now, with the listing approaching fast. Since the tools are already live, you can see exactly what you are buying and still pay presale pricing. Anyone who recognizes what a 100x entry looks like before launch will spot that potential in Pepeto, but buying in now is crucial to personally benefit from the explosive move that follows the listing.
Solana Price Prediction for 2026 at $88
SOL trades at $88 after PPI data reinforced delayed rate cut fears according to CoinMarketCap. Derivatives funding rates went negative and the price was rejected near $97. The $88 level is critical, and holding it keeps a rebound toward $94 within view.
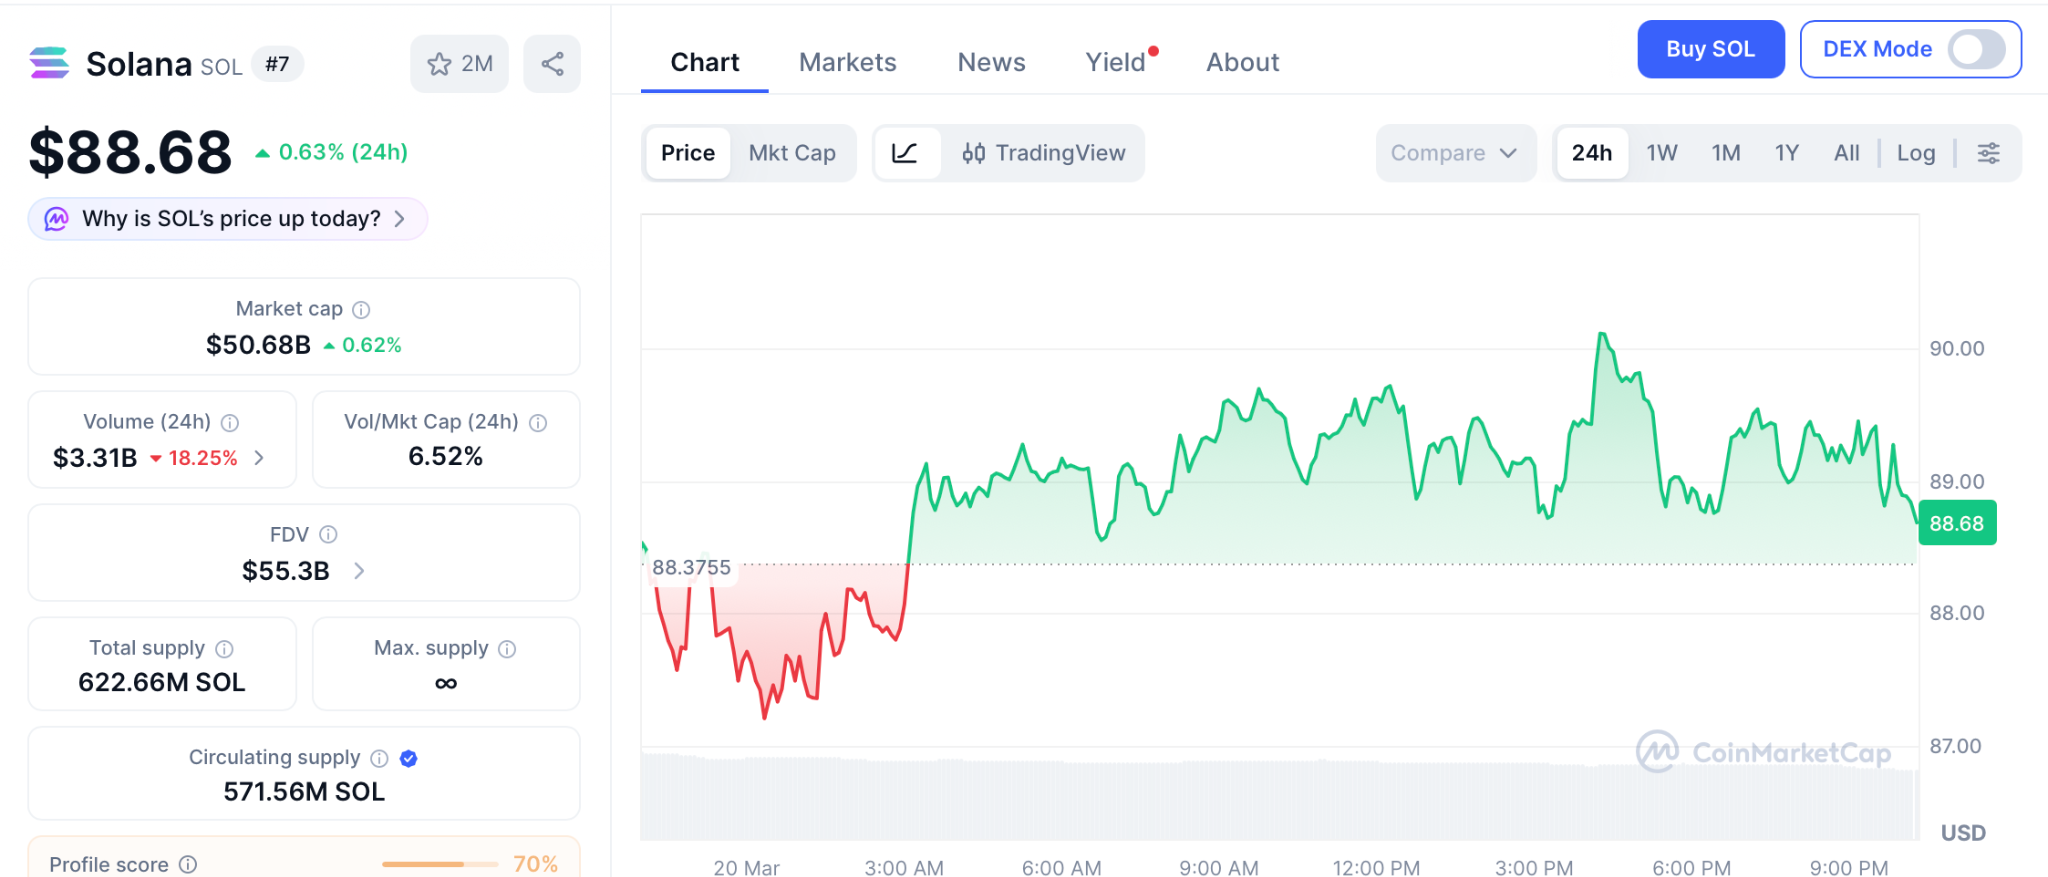
Still, the solana price prediction for 2026 depends on the Fed’s tone. From $88, even a move to $137 is roughly 55%, and that takes the rest of the year.
Chainlink Trades Sideways at $9
LINK trades at $9 after a 6.5% weekly drop according to CoinGecko. Despite positive regulatory news classifying LINK as a digital commodity, the macro selloff overpowered it. If LINK defends $9.00, a sideways range between $9.00 and $9.50 is most likely.
Chainlink’s oracle infrastructure underpins DeFi, but like the solana price prediction, the near term path needs macro relief that has not arrived.
The Solana Price Prediction Needs Macro Cooperation but Pepeto Needs Only the Listing
The solana price prediction’s technical setup stays positive if SOL holds $88, and Chainlink’s oracle role keeps it structurally important. But both are waiting on external triggers: Fed rhetoric, market structure legislation, and institutional rotation. Pepeto is not constrained by any of those factors.
It has a working exchange, staking that compounds at 196% daily, and holders who already see exactly what the tools do. At $0.000000186, the token is still at presale pricing, but that changes the moment the Binance listing arrives. The Pepeto official website is where the traders who understand the difference between waiting on macro and entering a presale with live products are positioning right now.
Click To Visit Pepeto Website To Enter The Presale

FAQs
What is the solana price prediction after the recent dip?
SOL trades at $88 with a rebound toward $94 to $97 possible if support holds. The solana price prediction depends on the Fed’s tone and macro conditions improving.
How does Chainlink fit into the solana price prediction outlook?
LINK’s oracle infrastructure is foundational to DeFi but like the solana price prediction, its near term path depends on macro relief that has not arrived yet.
Why is Pepeto a stronger entry than SOL right now?
Pepeto at $0.000000186 with three live tools and a Binance listing does not depend on external catalysts. Visit the Pepeto official website before the listing closes the presale.
Disclaimer: This is a Press Release provided by a third party who is responsible for the content. Please conduct your own research before taking any action based on the content.

New entries consist of large companies and ETFs
The securities added span fields such as technology, energy and aerospace. In addition, IonQ, Eaton, Rocket Lab, GE Vernova, and VinFast Auto have become tokenized companies. Also, exchange-traded funds such as iShares MSCI India ETF and Vanguard Real Estate ETF have entered the platform.
Ondo Global Markets is currently working with over 250 tokenized instruments on various blockchain networks. They are accessible on Ethereum, Solana, and BNB Chain, enabling access to more global markets. In addition to this, any new securities are listed immediately on the platform and can be traded.
The growth comes with increasing regulatory transparency regarding tokenized securities in the U.S. Notably, Nasdaq’s proposal to trade tokenized securities was endorsed recently by the U.S. Securities and Exchange Commission. This trend has fostered the scaled offering of platforms based on real-world assets. Institutional investors are still increasing their demand for tokenized real-world assets. In addition, tokenization provides quicker settlement and underlies fractional ownership, which enhances accessibility. These aspects have helped blockchain-based financial products grow steadily.
RWA value is close to 2.6 billion
Statistics indicate that the aggregate real-world asset value in Ondo Finance is approaching 2.6 billion. The portfolio consists of tokenized US Treasuries, equities, and commodities. This increase also shows rising use of blockchain infrastructure in conventional finance. Although the ONDO token has seen a minor negative growth in recent trading sessions. The token is experiencing a 1% decline on the day and over 3% in the last week. Nevertheless, the wider crypto market has not been favorable and has impacted price action.


The deal doubles the valuation from Kalshi’s previous round in November.
CFTC-regulated prediction market platform Kalshi is raising around $1 billion at a $22 billion valuation in a new funding round, according to multiple reports. The new round is led by Coatue Management, per The Wall Street Journal, which was first to report the news on Thursday. March 19.
The deal doubles the valuation from Kalshi’s previous round in November, which also raised $1 billion, but at an $11 billion valuation, as The Defiant reported.
A person familiar with the matter told Bloomberg yesterday that Kalshi’s annualized revenue stands at $1.5 billion.
The latest raise marks an 11x valuation from less than a year ago. Last June, Kalshi raised $185 million at a $2 billion valuation, led by Paradigm, followed by a $300 million raise in October at $5 billion.
Regulatory Questions
The raise comes despite regulatory hurdles in the U.S., as Kalshi remains embroiled in several lawsuits with U.S. state gambling regulators. The ongoing battle between prediction market platforms like Kalshi and state regulators centers on the question of whether state or federal regulators are responsible for the oversight of these platforms.
Kalshi is licensed by the Commodity Futures Trading Commission’s (CFTC), and thus argues it should be subject to federal oversight, without requiring licensing on a state by state basis.
The Trump administration’s CFTC has vocally backed the company’s position that its contracts fall under federal jurisdiction. Last week, the agency launched a sweeping review of prediction markets and issued an advance rulemaking notice and a staff advisory.
Just yesterday, the same day the fundraising news came out, a U.S. federal appeals court denied Kalshi’s emergency motion to block a potential temporary restraining order from the state of Nevada. The court decision clears the way for Nevada state regulators to seek a temporary ban on Kalshi’s operations there.
Earlier this week, Arizona hit the company with 20 criminal counts accusing it of operating an illegal gambling business and offering election wagering. At least nine other states have taken some form of legal action against Kalshi, with outcomes so far split across jurisdictions, ESPN reported.
Prediction Market Sector
Kalshi sees an average of more than $30.5 million in trading volume daily, per data from KalshiData. Meanwhile, on-chain prediction market Polymarket continues to lead the sector by volumes, consistently seeing over $150 million in daily trading volume in the past month, per data from TokenTerminal.
Last year, monthly prediction market volumes grew 130-fold from early 2024, making the sector one of the fastest-growing in finance, as The Defiant reported previously.
Polymarket received CFTC approval to operate in the U.S. in November 2025, backed by a $2 billion strategic investment from Intercontinental Exchange. Polymarket has also reportedly been exploring a raise at roughly a $20 billion valuation, meaning Kalshi’s new mark would put it modestly ahead of its rival on paper.
This article was written with the assistance of AI workflows. All our stories are curated, edited and fact-checked by a human.


DeFiance Capital CEO Arthur warns that Middle East tensions and possible action around Iran’s Kharg Island and the Strait of Hormuz could deepen supply shocks and rattle risk assets, including crypto.
Summary
- Arthur says a quick “TACO” reversal in Trump’s Middle East policy is unlikely, with the U.S. and Israel instead set to keep tightening pressure on Iran.
- He highlights risks around a potential U.S. move to occupy or blockade Kharg Island to force the reopening of the Strait of Hormuz, through which about 20% of global oil flows.
- Arthur warns that further supply-chain damage and oil shocks could sap risk appetite, hitting equities and leaving Bitcoin and crypto exposed if safe-haven flows dominate.
Arthur, CEO of crypto-focused venture firm DeFiance Capital, issued a stark warning on March 20 regarding the trajectory of geopolitical tensions in the Middle East, cautioning that a near-term de-escalation is unlikely and that the consequences for global supply chains — and by extension, financial markets — could intensify in the weeks ahead.
Writing on X, Arthur dismissed the possibility of a so-called “TACO” moment — a term that has gained traction in market circles to describe a Trump last-minute retreat from confrontational policy positions. In his assessment, neither the United States nor Israel shows any sign of pulling back from their current posture toward Iran, and the pressure on Tehran is likely to continue building rather than easing.
The remarks came in the context of a broader geopolitical flashpoint centered on Iran’s Kharg Island and the Strait of Hormuz. According to a prior report by Axios, the Trump administration has been actively considering occupying or blockading Kharg Island — Iran’s primary oil export terminal — as leverage to force the reopening of the Strait of Hormuz, one of the world’s most critical chokepoints for energy shipping. Approximately 20% of global oil supply passes through the strait, and any sustained disruption to traffic through the waterway would send shockwaves through commodity markets and the broader global economy.
For crypto markets, the implications are indirect but real. Geopolitical risk of this magnitude tends to drive capital toward perceived safe havens and away from risk assets — a category that Bitcoin and other cryptocurrencies have historically occupied during periods of acute uncertainty. A spike in oil prices driven by Hormuz disruptions would also feed inflationary pressure globally, complicating central bank policy and further weighing on risk appetite.
Arthur’s warning lands at an already delicate moment for digital asset markets. Bitcoin has been struggling to establish directional momentum, with open interest data suggesting the recent rebound lacks genuine bullish conviction. Ethereum is hovering near key liquidation thresholds. Equity markets are showing signs of strain, with the Nasdaq, Dow, and S&P 500 all logging pre-market losses, and the VIX fear index climbing to 25.44 — a level that signals elevated investor anxiety.
The DeFiance CEO did not offer specific price targets or trading recommendations, but the broader message was clear: macro conditions are deteriorating, and crypto traders who are not accounting for geopolitical tail risk in their positioning may be caught off guard. In an environment where global supply chains are already fragile and institutional confidence is cautious, a further escalation in the Middle East could prove to be the catalyst that tips risk markets into a more pronounced correction.


Lawyers say the joint SEC-CFTC framework is the most significant crypto regulatory development in years. But who decides when a token sheds its investment contract status, and what happens to DeFi, are still unanswered.
The SEC and CFTC’s landmark crypto taxonomy has been widely hailed as a decisive break from years of regulatory limbo but legal experts say one of its most consequential provisions raises more questions than it answers, with no formal process for issuers to find out if they’ve gotten it right.
At issue is the guidance’s framework for when a token initially sold as part of an investment contract can “separate” from that contract and trade freely.
Under the release, a non-security token becomes subject to an investment contract when an issuer sells it with promises to undertake “essential managerial efforts.” That investment contract ends when the issuer either fulfills those promises or publicly abandons the project.
But the document provides no mechanism for an issuer to obtain a definitive determination, leaving founders to make the call themselves, with enforcement as the backstop.
“This is the biggest open question in the entire 68 pages,” said Mike Katz, partner at law firm Manatt, Phelps & Phillip. “You are left to make that judgment yourself, and if the SEC disagrees, you find out in an enforcement action.”
Consider a team that launches a token promising a decentralized exchange, a governance module, and a cross-chain bridge. Two years later, the DEX and the governance module are live, but the bridge is still in development. Are the promises fulfilled? Partially? Does partial delivery count?
“The guidance does not say,” Katz said, “and there is no application process, no safe harbor letter, no bright-line test.”
Promising Less
Steve Yelderman, General Counsel of Etherealize, argues the provision inverts the incentive structure of the prior regime, where detailed roadmaps could be weaponized against founders in enforcement actions, and tokens could be stuck in regulatory limbo with no path out.
“Promising less can be a good thing,” he said. “A big point of the securities laws is to discourage managers from making false promises to investors,” Yelderman said. “If the law is making people think twice before making difficult promises, that’s not perverse, that’s the law working as intended.”
Yelderman also flagged a widely misread nuance in the provision.
“It’s not that the token sheds its security status,” he clarified. “We’re talking about when and how non-security tokens might be sold subject to an investment contract. The token itself was always a non-security — what changes is whether the surrounding transaction is a securities transaction.”
DeFi’s Hard Question
The guidance’s most notable silence is on fully permissionless DeFi protocols, platforms with no identifiable issuer, no pre-sale, and governance controlled entirely by on-chain token holders.
The SEC’s entire investment contract framework is built around an identifiable issuer making identifiable promises through official channels. That framework does not map when there is no one to hold responsible for “essential managerial efforts.”
Katz was direct.
“The SEC built a framework for the cases it knows how to analyze, centralized launches with identifiable actors. and deferred the cases it does not.” he said. “Silence from a regulator is not the same as approval.”
He expects a forthcoming rulemaking to include an “innovation exemption” that Chair Paul Atkins has referenced publicly, but said DeFi’s hard questions may not be resolved until that rulemaking arrives.
Yelderman said the document provides extensive characteristics for what constitutes a digital commodity, the category most mature DeFi governance tokens aspire to, and the 16 named examples give projects a concrete benchmark.
“Early on, a new DeFi protocol might need to navigate the investment contract guidance, depending on how it was initially funded and launched,” he said. “But the end game would be for the governance tokens to be recognized as a digital commodity. And there is a lot of guidance on the characteristics of digital commodities, which a project could use to get there with reasonable precision.”
Fractionalized NFTs
The guidance formally classifies NFTs and digital collectibles as non-securities, while flagging fractionalization as a potential securities offering.
Dividing a single NFT into fungible fractional shares, the document said, can constitute a securities offering because it introduces elements of shared investment and reliance on managerial efforts.
Yelderman said he thinks the market has overread the section. “Owning a digital collectible isn’t a security, any more than owning a physical Pokémon card would be,” he said. “But if you start doing things like fractionalizing the ownership, outsourcing management, and creating a fund to invest in collectibles, you need to do the full analysis. That’s all they’re saying, in my opinion.”
Katz was less sanguine.
“For protocols that have been offering fractionalization as a core product, this guidance is not ambiguous,” he said. “The SEC is saying: we see what you are doing, we get it, and it is a securities offering.”
Both Reg D and Reg A+ registration pathways exist, he noted, but represent a substantial compliance lift that most of these platforms have not taken on.
A Watershed Moment
Against that backdrop of open questions, experts were emphatic that the guidance represents a watershed moment for the industry. The core shift, according to Katz, is that the SEC has effectively reversed the presumption that defined the Gensler era.
“The Gensler-era position was that virtually every token was a security until proven otherwise,” Katz said. “This guidance inverts that presumption. Three of the five categories in the taxonomy are explicitly non-securities. The Commission is telling the market: we are regulating securities, not regulating crypto.”
For Yelderman, having any guidance at all is already significant.
“For years some in the government very openly used ambiguity and uncertainty to their strategic advantage,” he said. “It’s very good to see that era fully brought to a close.”
Arguably more important than any single classification, Katz said, is the fact that both agencies co-signed the taxonomy. It’s the first time the SEC and CFTC have publicly agreed on which assets belong to whom. “
David Carlisle, VP of Policy and Regulatory Affairs at Elliptic, said the guidance carries particular weight for traditional financial institutions that have been sitting on the sidelines.
“A more consistent taxonomy and aligned oversight give firms a clearer foundation to engage with digital assets in the US,” he said, “especially traditional financial institutions that have been reluctant to undertake certain activities owing to regulatory ambiguity.”
What Comes Next
The guidance is an interpretive release, not a formal rulemaking, which means it carries persuasive authority but does not bind future administrations. Chairman Atkins has signaled that formal rulemaking is forthcoming. Until that happens, Katz said, “this is a strong signal, not a guarantee.”
The SEC has invited public comment on the taxonomy and indicated it may refine the framework based on feedback, leaving open the possibility that some of the gray zones identified by legal experts could be addressed before the ink dries on a final rule.
For Carlisle, the shift in dynamic is already meaningful regardless of what comes next.
“The challenge now shifts to applying the SEC/CFTC interpretation in practice,” he said. “But there is now a more meaningful conceptual framework they can use to do so.”

England release brand new 2026 World Cup kits as Marcus Rashford models

AMD releases Adrenaline 26.3.1 driver, adding FSR 4.1 support for Radeon RX 9000 GPUs
Dog plunges into Scots river before being washed away as family left devastated


-
 Crypto World7 days ago
HYPE Token Enters Net Deflation as HyperCore Buybacks Outpace Staking Rewards
-

 Tech5 days ago
Your Legally Registered ‘Motorcycle’ Might Not Count Under Proposed US Law
-
 Tech3 days ago
Are Split Spacebars the Next Big Gaming Keyboard Trend?
-
Sports6 days ago
Why Duke and Michigan Are Dead Even Entering Selection Sunday
-

 Business5 days ago
Search for Savannah Guthrie’s Mother Enters Seventh Week with No Arrests
-

 Business6 days ago
US Airports Launch Donation Drives for Unpaid TSA Workers as Partial Government Shutdown Enters Fifth Week
-
Crypto World6 days ago
Coinbase and Bybit in Investment Talks: Could Bybit Finally Enter the US Crypto Market?
-

 Business4 days ago
Australian shares drop as Iran war enters third week
-

 Business6 days ago
Country star Brantley Gilbert enters growing non-alcoholic beer market
-

 Crypto World4 days ago
Crypto Lender BlockFills Enters Chapter 11 with Up to $500M in Liabilities
-

 Politics2 days ago
The House | The new register to protect children from their abusers shows Parliament at its best
-

 Sports7 days ago
College Basketball Best Bets: Conference Tournament Semifinal Picks
-

 News Videos2 days ago
RBA board divided on rate cut, unusually buoyant share market | Finance Report | ABC NEWS
-

 Fashion4 days ago
25 Celebrities with Curly Hair That Are Naturally Beautiful
-

 Tech13 hours ago
inKONBINI Lets You Spend Summer Days Behind the Register
-

 Crypto World2 days ago
Canada’s FINTRAC revokes registrations of 23 crypto MSBs in AML crackdown
-
 Politics3 days ago
Real-time pollution monitoring calls after boy nearly dies
-

 Crypto World6 days ago
Crypto Losses Drop 87% in February, But Hackers Are Now Targeting People, Not Code
-
 NewsBeat2 days ago
Residents in North Lanarkshire reminded to register to vote in Scottish Parliament Election
-

 Business4 days ago
Meta planning major layoffs as AI spending and automation reshape workforce


You must be logged in to post a comment Login