
Crypto World
HBAR Bears Face $4.9 Million Squeeze as Price Direction Shifts
Hedera has posted a muted recovery in recent sessions. HBAR price remains constrained by cautious sentiment across the broader cryptocurrency market. Uncertainty in Bitcoin and macro conditions continues to cap upside attempts.
However, bearish traders may need to monitor changing signals. Derivatives positioning and capital flow indicators suggest the current balance could shift.
Sponsored
Hedera Traders Could Be In Trouble
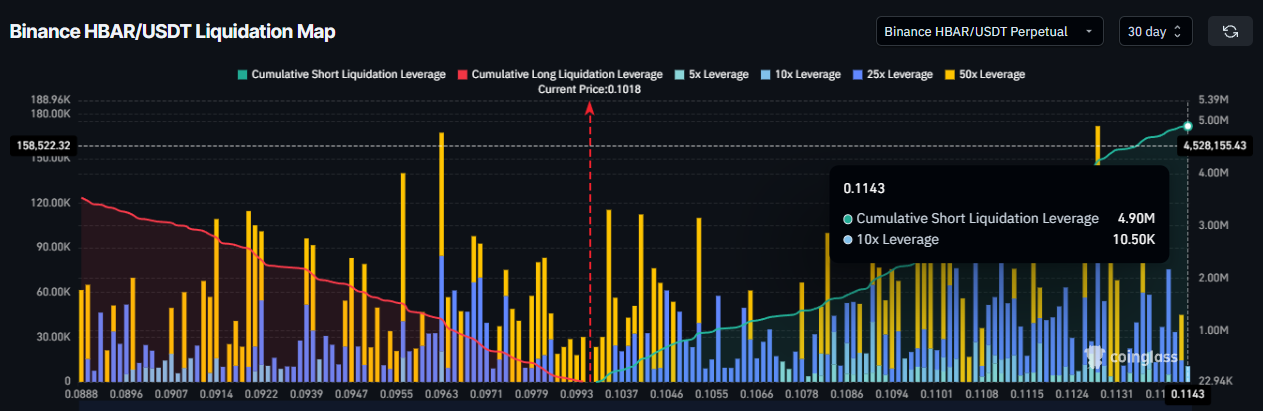
HBAR is currently experiencing strong bearish positioning in the futures market. Traders have opened a notable number of short contracts, reflecting expectations of further downside. The liquidation map highlights that positions are skewed toward bears at current levels.
Data shows that HBAR bears could face approximately $4.9 million in liquidations if the price crosses the $0.1143 mark. Such forced liquidations can trigger rapid upside volatility. When short positions unwind, buying pressure increases as traders close contracts.
Want more token insights like this? Sign up for Editor Harsh Notariya’s Daily Crypto Newsletter here.

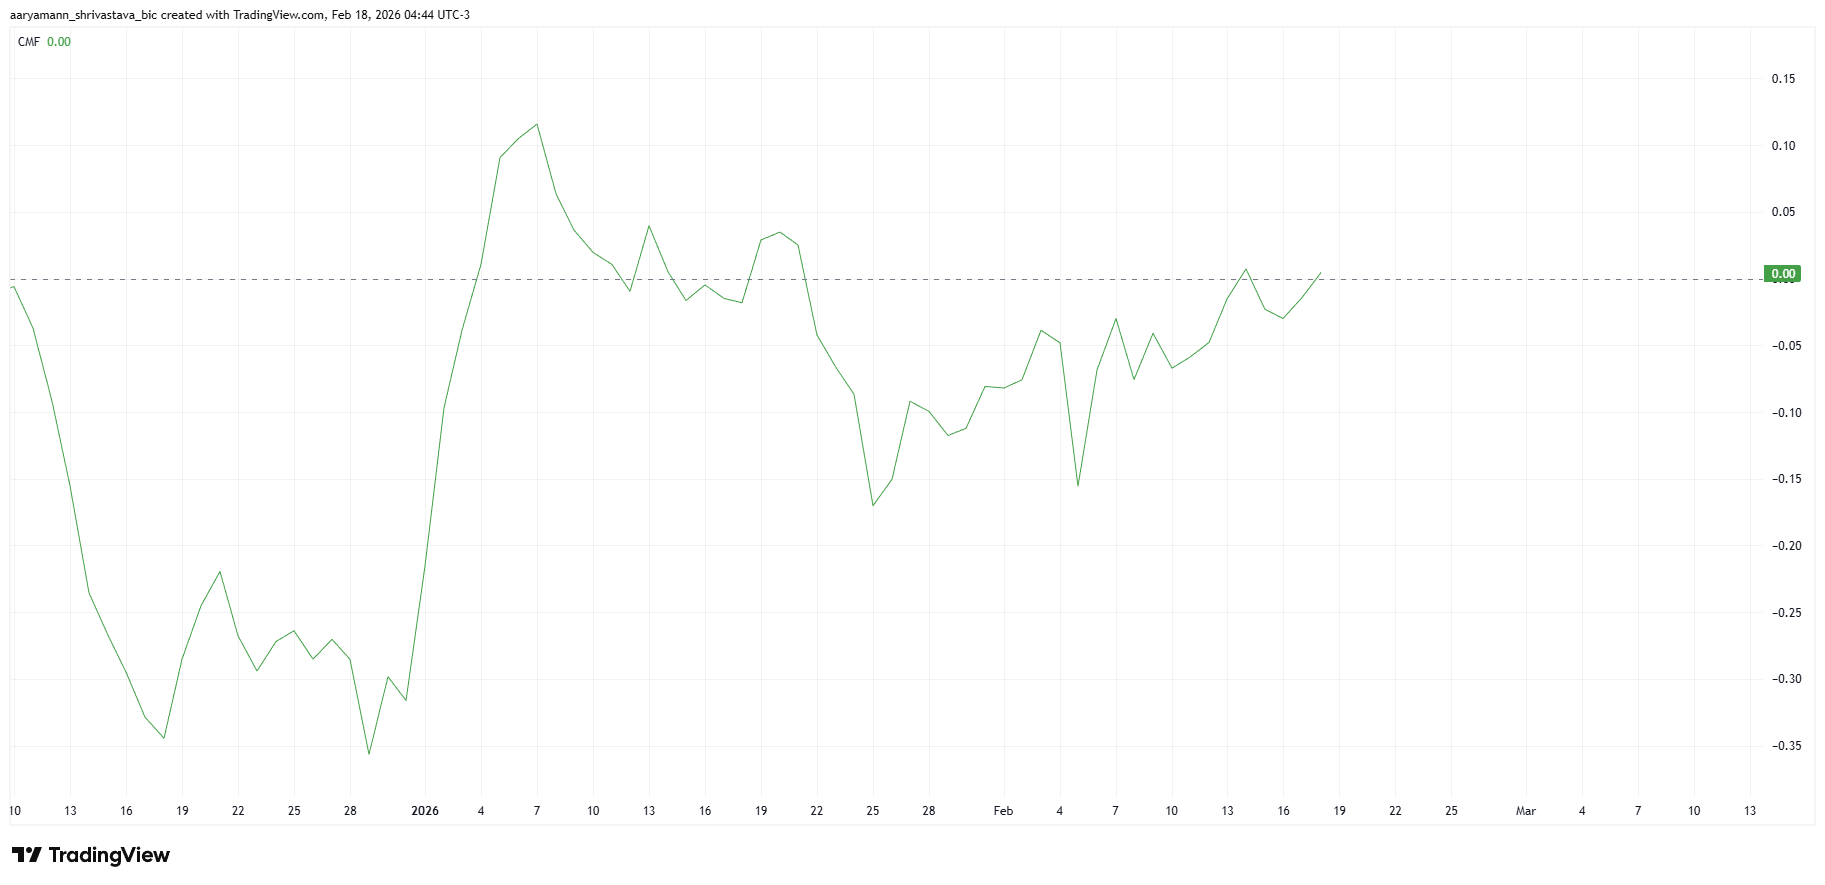
The Chaikin Money Flow indicator offers additional insight into capital movement. CMF measures inflows and outflows to assess whether buyers or sellers dominate. The indicator is currently rising, although it remains at the zero line.
Sponsored
An upward slope at zero suggests that outflows are at par with the inflows. However, the gap will likely diminish as inflows rise. Declining outflows often precede a shift toward net inflows. If this transition occurs, HBAR could gain the support needed for a short-term recovery.
Bitcoin Is Unhelpful
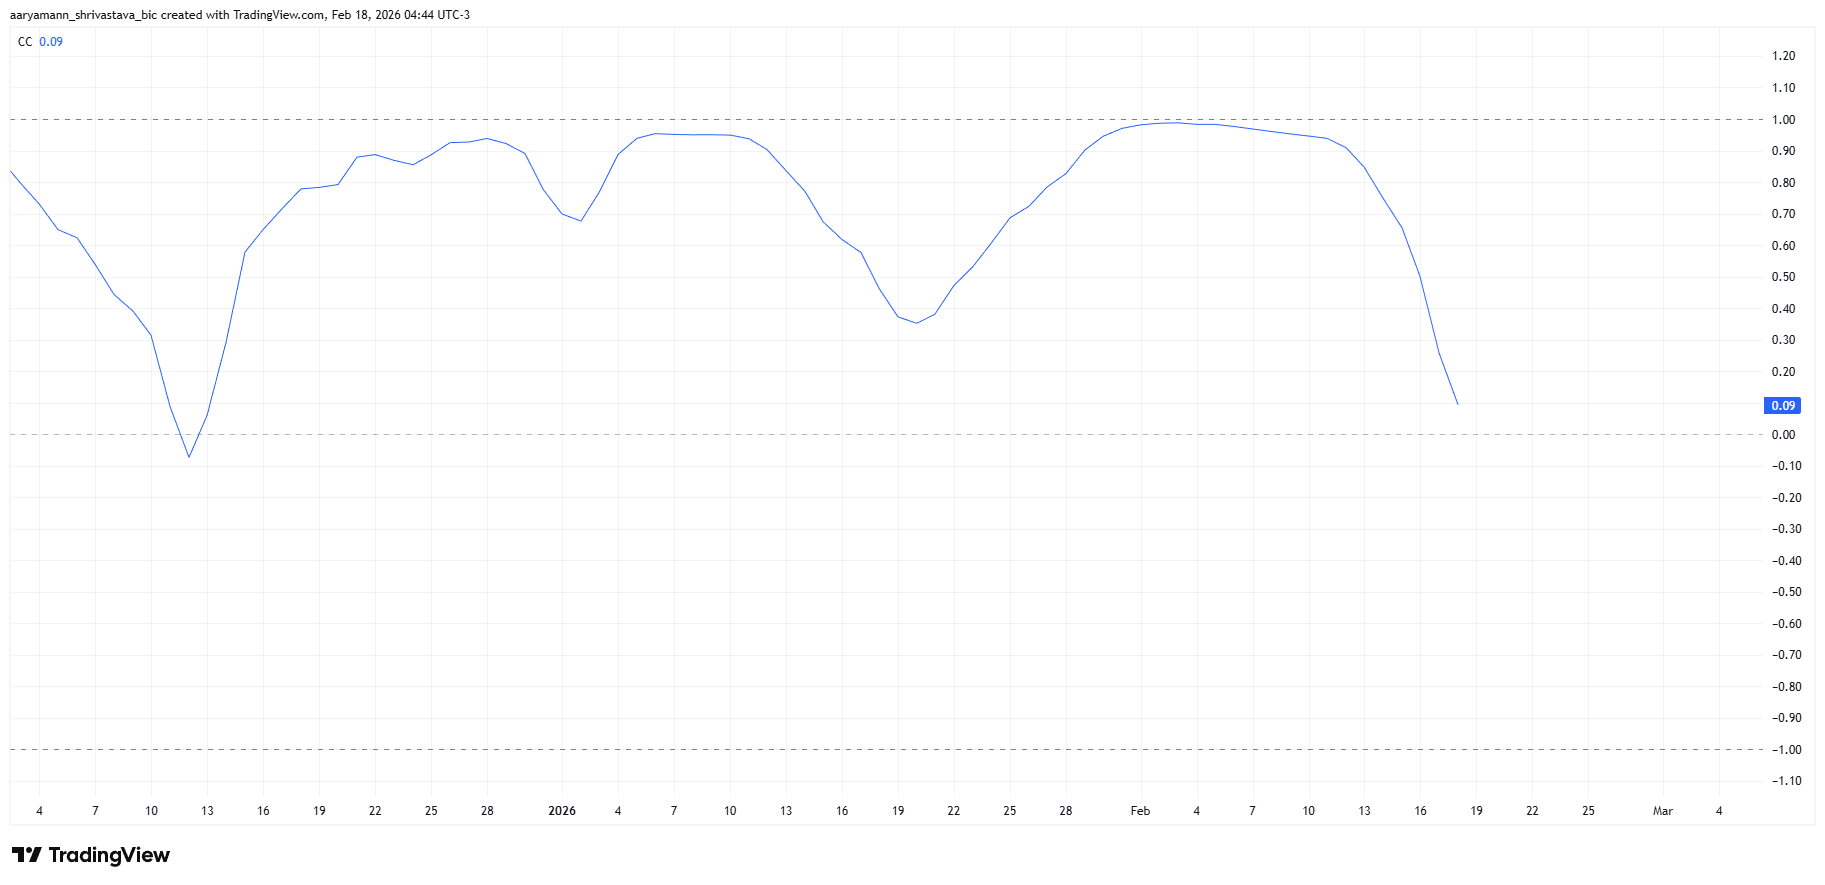
Correlation trends also support a potential shift. HBAR’s correlation with Bitcoin has declined in recent weeks. The current coefficient has dropped to 0.09, signaling weaker alignment with the crypto market leader, inching closer to completely dissociating with Bitcoin.
Sponsored
Reduced correlation can benefit altcoins during periods of Bitcoin uncertainty. If HBAR decouples further, price action may reflect investor-specific demand rather than broader market weakness. This flexibility could allow HBAR to chart an independent recovery path.
HBAR Price Has a Few Barriers To Breach
HBAR is trading at $0.1019 at the time of writing. The altcoin remains above the key $0.0961 support level at the 38.2% Fib line. However, it faces resistance at $0.1035, which aligns with the 50% Fibonacci retracement. This level currently caps upward momentum.
Sponsored
Flipping $0.1035 into support would mark a short-term breakthrough. Combined with declining outflows, this shift could fuel a recovery rally. HBAR would then target $0.1109 at the 61.8% Fibonacci.
This level is considered a critical support for an asset, and flipping it would likely trigger stronger buying among the investors, pushing the HBAR price higher.
This would bring HBAR past $0.1143, a level that threatens $4.9 million in shorts liquidations. Sustained strength could extend gains toward $0.1215 and $0.1349 eventually, helping recover year-to-date losses.

If bullish signals fail to materialize, consolidation may continue. Persistent outflows would limit breakout attempts. A breakdown below $0.0961support could expose HBAR to further downside near $0.0870. Such a move would invalidate the near-term bullish outlook and reinforce bearish control.

Crypto World
Best Crypto to Buy Now: Pepeto Raises Above $8.1M as Investors Look Past BTC and XRP During the Correction

Bithumb, South Korea’s second largest exchange, just postponed its IPO by two years after compliance fines, proving the industry is building for a longer timeline than this correction suggests. The correction is temporary, but the infrastructure underneath is permanent.
The best crypto to buy now is not the asset that needs billions to move 15%, it is the entry where the listing compresses the return into one day. Pepeto has raised above $8.1 million with live tools and a confirmed Binance listing.
Bithumb delayed its planned public offering by at least two years after fines and compliance issues, according to CoinGecko. The postponement confirms the infrastructure buildout will outlast the fear, as CoinDesk noted.
For the best crypto to buy now conversation, the correction is a pause in a longer story, and the entries positioned before the next chapter collect the most.
Best Crypto to Buy Now in 2026: Pepeto, BTC, and XRP
Pepeto
The correction has large cap holders watching BTC grind sideways, but the wallets searching for the best crypto to buy now already found the answer. Pepeto runs a zero fee swap engine that eliminates cost from every trade, and a cross chain bridge that connects networks so tokens move freely. These tools are live, which means every wallet using them interacts with a finished product at a price the Binance listing erases permanently, and that gap between presale pricing and listing day is where every dollar of real return lives.
The wallet behind the original Pepe project is part of the build alongside a former Binance expert, and the SolidProof audit confirmed the contract. The presale has collected above $8.1 million at $0.000000186 while the Fear and Greed Index sat at 9, and a $50,000 position earning 189% APY through staking returns roughly $98,000 in one year before the listing multiplier adds on top.

The correction will pass, the recovery will arrive, and the presale price will be gone, which means every day without a position is a day the reader’s money misses returns that the wallets already inside are set to collect.
The market always recovers, and the entries that turn corrections into wealth have tools working before the recovery starts. The Binance listing closes this window, and the presale counter ticks toward zero while the reader decides whether their money enters at presale pricing or pays whatever the open market charges after listing day rewrites the price.
BTC Holds $66,927 as Institutional Capital Builds Slowly
Bitcoin trades near $66,927 with dominance at 56.2%, according to CoinMarketCap. Institutional inflows are rebuilding, confirming the recovery forms underneath the fear.
Analysts target $72,000, but BTC needs billions more just to move 15%, math designed for pension funds. The best crypto to buy now for real returns is the entry where one listing delivers what BTC takes a quarter to produce.
XRP Holds $1.32 as CLARITY Act Approaches
XRP trades near $1.32 with support at $1.30 and resistance at $1.35, according to CoinGecko. The CLARITY Act reaching the Senate by mid April could shift sentiment.
The bullish case targets $2.00, a credible 50% gain, but that return takes months and depends on macro conditions the best crypto to buy now at presale pricing does not need.
The Bottom Line
Bithumb postponing its IPO proves the industry is building for a timeline far longer than this correction, and the recovery forming beneath the fear is going to reward the entries positioned before it arrives. BTC needs billions to move 15% and XRP targets $2.00 over months, but neither offers the presale pricing that a Binance listing transforms overnight.
Above $8.1 million committed during fear is the proof, and the Pepeto official website still shows the figure that listing day erases. The reader searched for the best crypto to buy now and the answer led them here, because early wallets acted before the crowd had reason to look, and the reader’s money right now sits at presale pricing with a working exchange behind it, which is how every early fortune in crypto started.
Click To Visit Pepeto Website To Enter The Presale

FAQs
What is the best crypto to buy now during the correction?
Pepeto leads with above $8.1 million raised, live exchange tools, and a confirmed Binance listing. The correction is temporary and the presale price ends when the listing opens.
Why are large caps not the best crypto to buy now for returns?
BTC needs billions to move 15% and XRP targets 50% over months. The best crypto to buy now at presale pricing delivers the listing return from one event the Pepeto official website still shows.
Will the market recover from this correction?
Institutional infrastructure is expanding, exchanges are building for decades, and capital inflows are rebuilding. The correction is a pause, and the entries positioned before the recovery collect the most.
Disclaimer: This is a Press Release provided by a third party who is responsible for the content. Please conduct your own research before taking any action based on the content.


Coinbase has received conditional approval from the Office of the Comptroller of the Currency for a national trust bank charter — a first for any major U.S. crypto exchange — as community banking groups wasted no time calling the decision a grave mistake.
Summary
- Coinbase has received conditional approval from the Office of the Comptroller of the Currency for a national trust bank charter, the company confirmed on April 2.
- The approval positions Coinbase to offer federally regulated digital asset custody services nationwide under a single federal license.
- Community banking groups have pushed back sharply, with the Independent Community Bankers of America calling the OCC’s direction a “grave mistake.”
Coinbase has received conditional approval from the Office of the Comptroller of the Currency for a national trust bank charter, making it the first major U.S. crypto exchange to clear this specific federal regulatory hurdle. The company confirmed the approval through an April 2 blog post authored by Greg Tusar, Co-CEO of Coinbase Institutional, following a Bloomberg report that first broke the news.
The conditional charter would allow Coinbase to operate a national trust bank focused on digital asset custody and related settlement services. The entity will not accept retail deposits or issue traditional loans — its scope mirrors the structures already granted to Ripple, Circle, Paxos, and BitGo, which received their initial OCC approvals in December 2025. For Coinbase, the practical outcome is significant: a federal trust charter replaces a patchwork of state-level licenses with a single, nationwide regulatory status. It also positions the exchange directly inside the stablecoin custody and settlement infrastructure being built under the GENIUS Act.
Coinbase Chief Legal Officer Paul Grewal confirmed the news on X, writing: “Consistent rules and regulatory trust are what allow us to innovate with confidence. Today’s conditional @USOCC approval is yet more proof that our approach is working.”
The banking backlash
The approval has not been well received by traditional financial institutions. The Independent Community Bankers of America, which represents thousands of small lenders, described the OCC’s direction as a “grave mistake” in remarks reported by American Banker. The ICBA has repeatedly urged the OCC to pull or revise its crypto charter framework, arguing that digital asset firms are accessing bank-like federal status under lighter regulatory conditions than traditional banks face.
The Bank Policy Institute has gone further, weighing potential legal action against the OCC over what it describes as an improper reinterpretation of federal licensing rules — a possible lawsuit that could delay or complicate final approval for Coinbase and others in the pipeline.
Institutional and market context
Coinbase’s conditional charter comes as the exchange is already embedded in U.S. institutional crypto infrastructure, serving as custodian for multiple spot Bitcoin and Ethereum ETFs. Full OCC authorization will require meeting operational, governance, and capital thresholds — the same conditions applied to earlier approvals before they became final. Until then, the conditional status means the charter is approved in principle but not yet operational.
Crypto World
Figure Technology Solutions (FIGR) Stock Surges on Record Q1 Loan Growth and Token Adoption

Key Takeaways
-
FIGR shares advance 4.93% following 113% annual increase in Q1 lending volume
-
Monthly loan activity reaches $1.19B in March, demonstrating accelerating momentum
-
YLDS token circulation expands to $598M, indicating growing platform adoption
-
Available capital from lenders increases 14% as liquidity deepens
-
Democratized Prime data reveals synchronized expansion across borrowers and lenders
Shares of Figure Technology Solutions (FIGR) finished regular trading at $34.51, posting a 4.93% gain following a robust intraday surge and subsequent stabilization. During extended hours, the stock retreated modestly to $34.44, representing a 0.20% decline. The upward movement came after the company disclosed preliminary operating results for March and the first quarter of 2026, revealing substantial growth across multiple business segments.
Figure Technology Solutions, Inc. Class A Common Stock, FIGR
Lending Platform Volumes Reach New Heights
Figure Technology disclosed impressive performance in its consumer lending marketplace throughout March 2026. The blockchain-powered platform facilitated $1.19 billion in transactions, representing a 33% sequential gain from February activity. Year-over-year comparisons proved even more dramatic, with volumes doubling from March 2025 levels at a 102% growth rate.
First quarter results demonstrated ongoing momentum, with total platform volume hitting $2.9 billion. This figure exceeded the previous quarter by 7% while soaring 113% compared to the same period last year. The data underscores accelerating demand for distributed ledger-based credit origination and secondary market trading capabilities.
The organization maintains its marketplace operations as a primary revenue generator, offering home equity lines of credit, debt service coverage ratio mortgages, and unsecured consumer loans. Transaction activity through Figure Connect bolstered overall platform engagement. The expanding scope demonstrates the company’s increasing influence within tokenized lending markets.
YLDS Token Achieves Significant Milestone
Figure announced impressive progress for its YLDS offering, which debuted in February 2025. Outstanding tokens reached a valuation of $598 million during March 2026, advancing 2% from the prior month. The metric represents a dramatic escalation from the mere $3 million circulating during March 2025.
First quarter comparisons unveiled even stronger momentum, with YLDS circulation soaring 83% above fourth quarter 2025 levels. This trajectory indicates accelerating acceptance of tokenized credit instruments throughout the platform ecosystem. Furthermore, the expansion reflects increasing confidence in blockchain-enabled financial products among marketplace participants.
The firm characterizes YLDS as unsecured digital certificates collateralized by its affiliated entity’s asset portfolio. Consequently, the instrument enhances liquidity and capital formation across its lending infrastructure. The swift uptake aligns strategically with the organization’s comprehensive asset tokenization initiatives.
Democratized Prime Platform Records Symmetric Expansion
Figure’s Democratized Prime offering maintained consistent matched transaction levels throughout March 2026. The outstanding balance totaled $368 million, remaining relatively flat versus February figures. Borrower appetite edged higher to $376 million, demonstrating persistent credit demand.
Lender capital availability climbed to $453 million during March, posting a 14% monthly gain. This increase suggests enhanced funding capacity within the platform’s liquidity pools. The system maintains equilibrium between available capital and borrower requirements.
Quarterly comparisons revealed substantial acceleration across all measurements, including a 79% expansion in matched transaction balances. Borrower demand advanced 53%, while lender capital surged 112% compared to the final quarter of 2025. These metrics underscore broadening participation and strengthening liquidity throughout the platform architecture.


President Trump has fired Pam Bondi and replaced her with Todd Blanche as interim U.S. Attorney General — handing control of the Justice Department to the official who dismantled the DOJ’s crypto enforcement unit in April 2025 and holds up to $485,000 in personal digital asset holdings.
Summary
- President Trump has replaced Attorney General Pam Bondi with Todd Blanche, the DOJ official who disbanded the National Cryptocurrency Enforcement Team in April 2025.
- Blanche, now acting AG, holds up to $485,000 in personal crypto holdings and authored the memo ending the DOJ’s regulation-by-prosecution approach to digital assets.
- The appointment hands the Justice Department’s leadership to one of the most crypto-friendly figures in U.S. federal law enforcement history.
President Trump has fired Pam Bondi and replaced her with Todd Blanche as interim U.S. Attorney General — handing control of the Justice Department to the official who dismantled the DOJ’s crypto enforcement unit in April 2025 and holds up to $485,000 in personal digital asset holdings.
Bondi confirmed her departure in an April 2 post on X, writing that she would be “working tirelessly to transition the office of Attorney General to the amazing Todd Blanche” before moving to an unspecified private sector role. NBC News confirmed that Bondi was fired following growing frustration from the president over her handling of key priorities.
Blanche is not a new name in the digital asset industry. As Deputy Attorney General, he authored the April 2025 memo that formally disbanded the National Cryptocurrency Enforcement Team, declaring in plain language that the DOJ “is not a digital assets regulator” and criticizing the prior administration’s approach as a “reckless strategy of regulation by prosecution.”
The memo directed prosecutors to stop pursuing cases against crypto exchanges, mixers, and offline wallets for end-user behavior, shifting enforcement focus to individuals directly defrauding investors. The decision triggered a swift backlash from Democratic lawmakers, who argued it opened the door to sanctions evasion, drug trafficking, and large-scale financial fraud.
Blanche also holds reported personal crypto exposure of up to $485,000 — a detail that will almost certainly draw scrutiny from Congress as he leads the nation’s top law enforcement agency.
What changes at the DOJ
Blanche’s elevation to acting AG signals continuity — and likely intensification — of the DOJ’s current posture toward digital asset enforcement. The NCET, which handled major crypto fraud cases and supported cross-border law enforcement coordination, remains disbanded. Its closure, combined with the prior directive to deprioritize structural crypto enforcement, has already reshaped how federal prosecutors approach the space.
With Blanche now at the top, those policy choices become structurally harder to reverse regardless of who eventually takes the permanent AG role. Trump announced the change via Truth Social, describing Blanche as a “very talented and respected Legal Mind.” The White House has not yet specified a timeline for a permanent nomination, with EPA Administrator Lee Zeldin reportedly under consideration.


A U.S. fighter jet identified as an F-15 was shot down over Iran on April 3, with one crew member rescued and President Trump briefed, adding a sharp new layer of escalation to a conflict that has already pushed Bitcoin down more than 40% from its October 2025 all-time high.
Summary
- A US fighter jet, identified by CNN analysis as an F-15, was shot down over Iran on April 3, with one crew member rescued, according to sources cited by CNN.
- The White House confirmed President Trump has been briefed, and Trump posted on X referencing reopening the Strait of Hormuz “with a little more time.”
- Bitcoin, already trading near $67,000 amid weeks of war-driven pressure, faces renewed downside risk as oil markets prepare to price in the latest escalation.
A U.S. fighter jet identified as an F-15 was shot down over Iran on April 3, with one crew member rescued and President Trump briefed, adding a sharp new layer of escalation to a conflict that has already pushed Bitcoin (BTC) down more than 40% from its October 2025 all-time high. Iranian state media published images of the downed aircraft, which CNN analysis matched to an F-15. The White House press secretary confirmed that “President Trump has been briefed,” with live coverage updated at 1:12 p.m. EDT.
Bitcoin was trading near $67,000 at the time of writing, down modestly on the day. The downed aircraft adds a new variable to an already fragile macro backdrop. As crypto.news has tracked, Bitcoin has repeatedly tested the $65,000–$67,000 range as a support zone during periods of heightened U.S.–Iran tension, with sharper downside reserved for moments of genuine escalation — the initial U.S. strikes sent BTC briefly to $63,000 before markets stabilized.
The incident lands on Good Friday, with traditional U.S. equity markets closed for the Easter holiday. Oil, already trading above $100 per barrel amid the ongoing Strait of Hormuz closure, could spike sharply when Asian markets open overnight. A sustained move higher in oil would intensify inflation concerns and further reduce the Federal Reserve’s room to cut rates — a combination that has been the dominant headwind for crypto since the conflict began.
Trump’s Hormuz signal
In a separate post on X, Trump suggested the Strait of Hormuz could be reopened “with a little more time” — a statement investors read as leaving space for a negotiated resolution even as military operations continue. As crypto.news reported on April 2, Trump had addressed the nation from the White House describing U.S. forces as nearing the “final stages” of the campaign while warning of continued strikes over the following weeks. The contradiction between active military pressure and diplomatic signaling has kept markets in an uncertain holding pattern. For Bitcoin, any credible de-escalation — particularly one that restores Hormuz shipping and brings oil back below $100 — represents the single most significant potential catalyst for a sustained recovery from the current range.
Crypto World
BTC USD Price Hanging in The Balance: What is Quantum Computer, and Can Bitcoin Survive it?

BTC USD is hovering at the $66,000 – $67,000 price level, caught between a critical support floor and a quantum threat. The question isn’t just whether BTC can hold $66,000. It’s whether Bitcoin’s underlying cryptography survives the next decade of computing power. One risk is measured in weeks. The other, potentially in years. Both are moving faster than the market expects.
Quantum computing, the use of quantum mechanical phenomena to process information exponentially faster than classical computers, has shifted from theoretical threat to active development timeline. Google’s quantum milestones and competing programs from IBM and state-backed labs have reignited debate over Bitcoin’s SHA-256 hashing and elliptic curve cryptography (ECDSA), the two pillars securing every wallet and transaction on the network.
— BSCN (@BSCNews) March 31, 2026
 BREAKING: GOOGLE WARNS 6.9M BITCOIN WILL BE VULNERABLE WHEN QUANTUM COMPUTERS BECOME POWERFUL ENOUGH
A new Google Quantum AI whitepaper has identified approximately 6.9 million Bitcoin $BTC vulnerable to future quantum at-rest attacks.
Around 1.7 million BTC sits in old… pic.twitter.com/pCwKrhXL4e
Analysis of Google’s quantum paper found the crypto sector broadly underestimates the asymmetric risk. A sufficiently powerful quantum machine could, in theory, derive private keys from public addresses, rendering cold storage irrelevant. Bitcoin Core developers have acknowledged the long-term threat, with post-quantum cryptography upgrades discussed but no consensus timeline confirmed.
For now, BTC USD price action is the more immediate variable. Support at $66,000 is the line we should be watching.
Discover: The best pre-launch token sales
Can BTC USD Price Recover Above $78,000, Or Is $50,000 the Next Target?
Bitcoin is sitting at $66,800–$67,000, effectively range-bound with no decisive momentum in either direction. Volume has compressed, a pattern that historically precedes either a sharp breakdown or a relief rally, rarely a slow grind higher.
The $66,000 level is load-bearing. Analysts flagged it as primary support, with a confirmed close below opening a path toward $50,000, or a 25% drawdown from current levels. On the upside, resistance clusters between $78,000 and $87,000 based on multiple technical models.
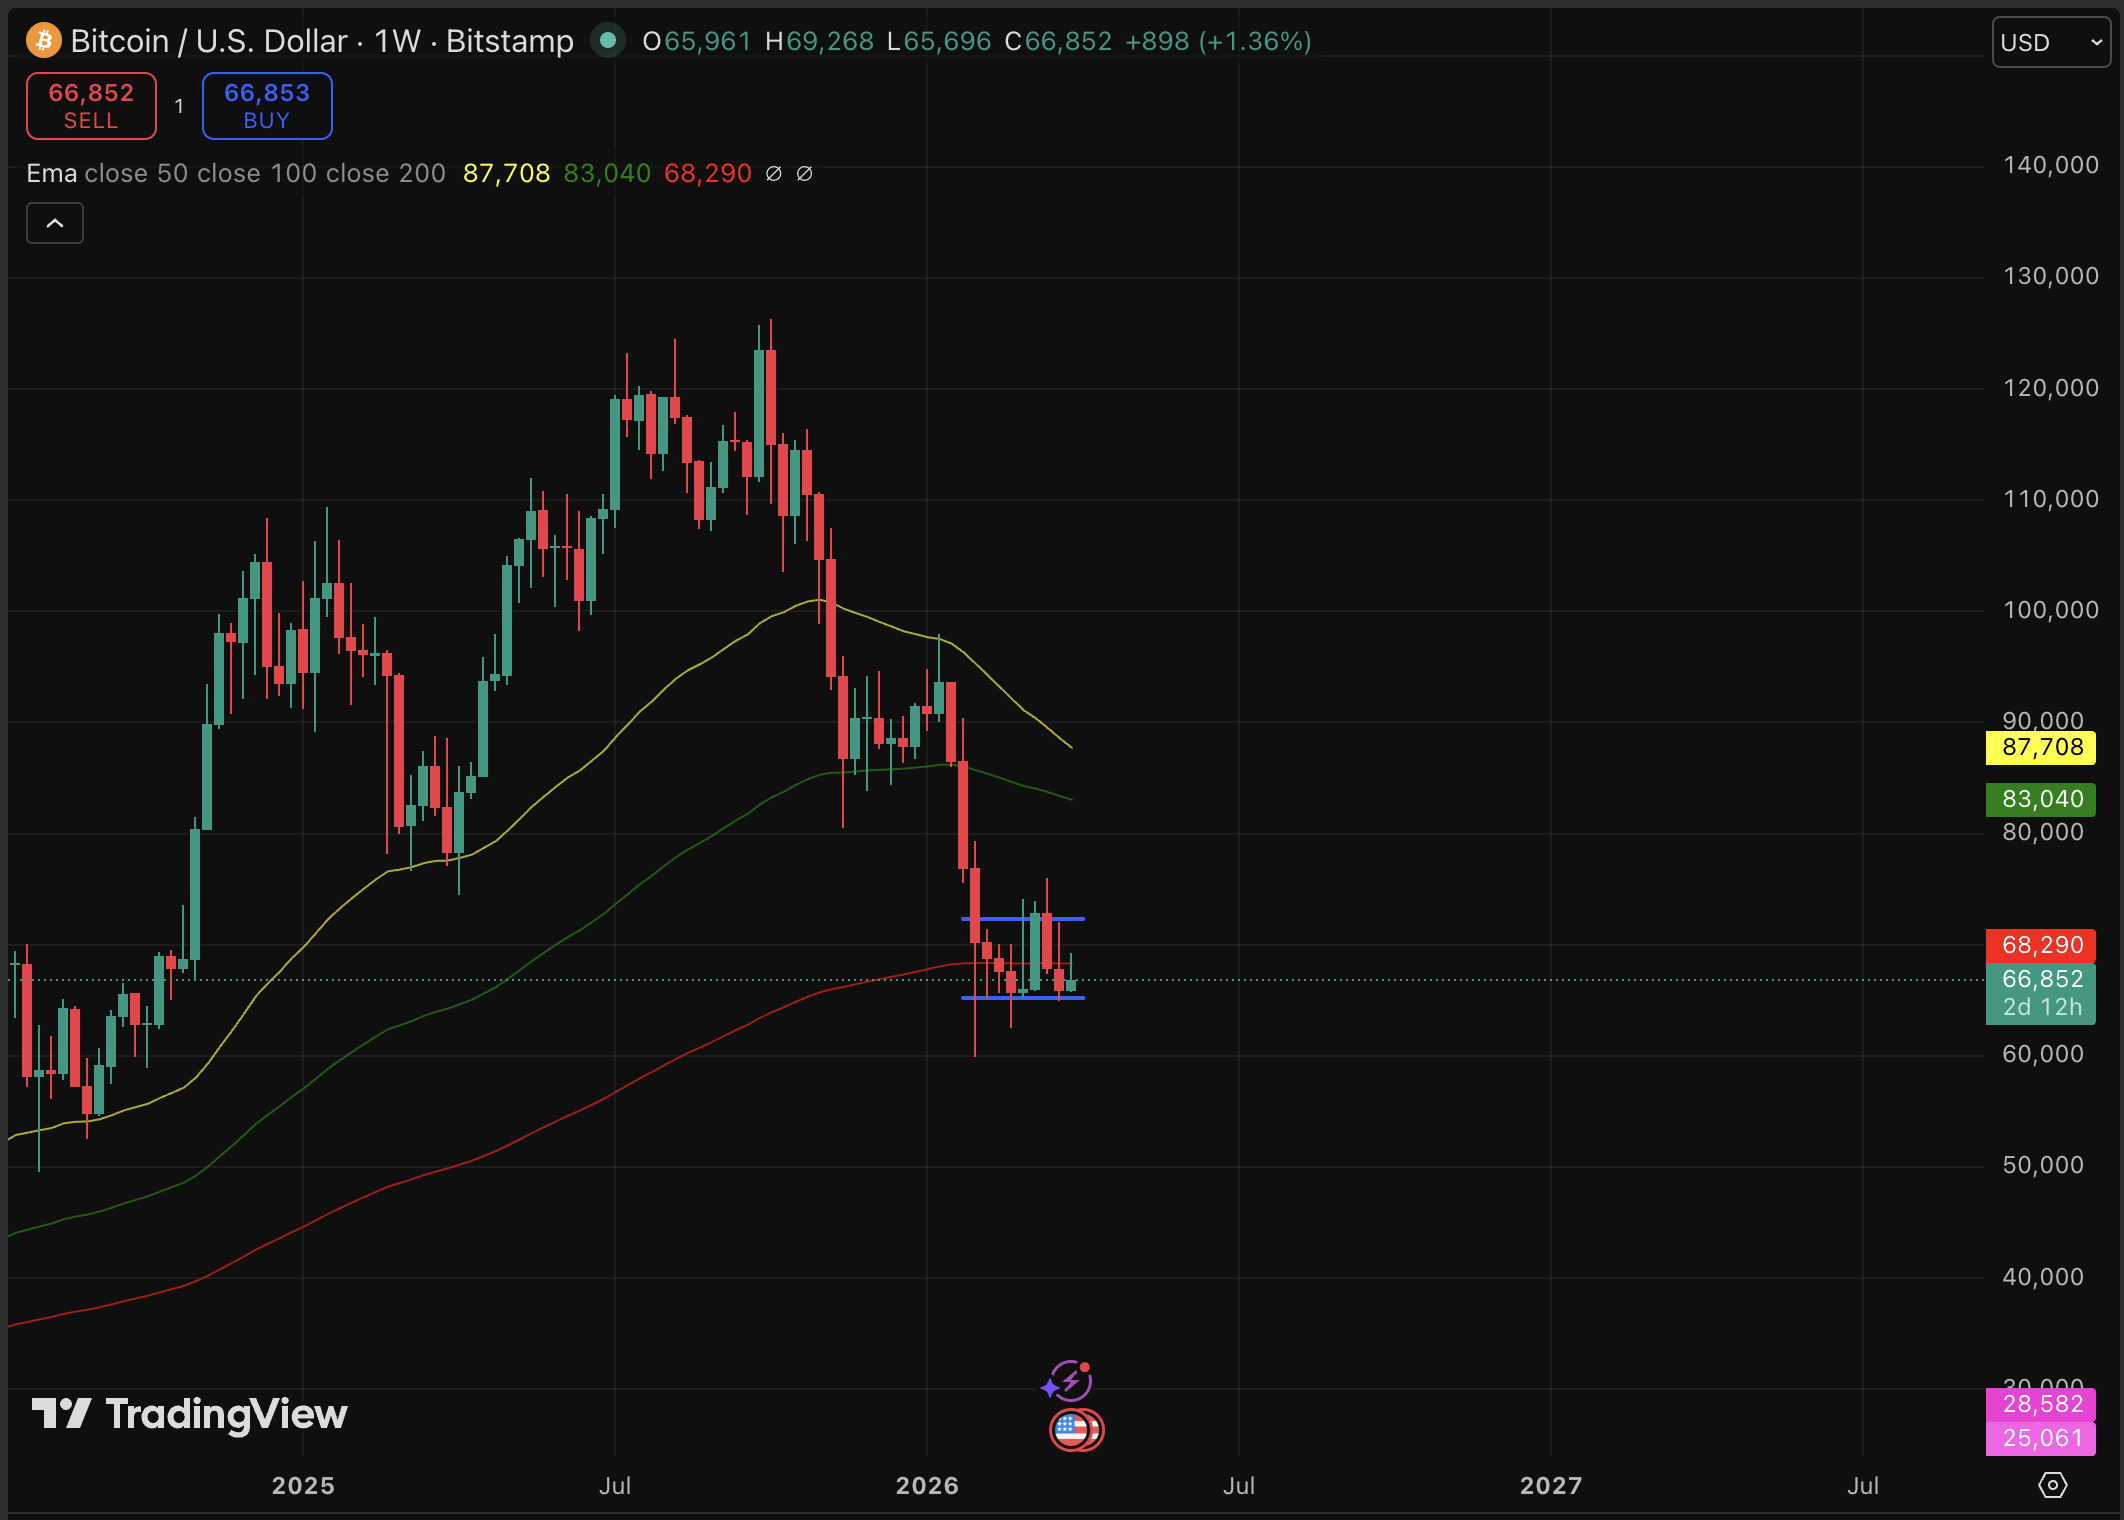
BTC could always hold $66,000, reclaims $70,000 on volume, and momentum builds toward the $78,000 resistance zone ahead of Q2 macro catalysts. But a consolidation between $64,000–$70,000 through April, with direction determined by macro risk appetite and ETF flow data, could also be in play.
For bear, though, a daily close below $66,000 with elevated selling volume targets $58,000–$50,000 — invalidating the near-term recovery thesis entirely is on the wishlist.
Changelly’s April model prices in a potential peak near $78,020, suggesting the bull isn’t unreasonable, but it requires clean price action from here. The quantum threat adds a longer-term overhang that institutional allocators are quietly beginning to model into risk frameworks.
Discover: The best crypto to diversify your portfolio with
Bitcoin Hyper Targets Early Mover Upside as Bitcoin Tests Key Levels
BTC at $66,739 offers upside, but analyst consensus caps the near-term move at roughly 20% toward $80,000. For traders who’ve already been through the cycle, that’s a reasonable hold. For fresh capital seeking asymmetric exposure, it’s a different calculation entirely.
Bitcoin Hyper is positioning directly at the intersection of Bitcoin’s structural limitations and its quantum-era upgrade needs. The project bills itself as the first-ever Bitcoin Layer 2 with Solana Virtual Machine (SVM) integration, delivering sub-second finality and smart contract capabilities while anchored to Bitcoin’s security model.
The pitch is essentially: Bitcoin’s trust, Solana’s speed, without choosing between them. Addressing Bitcoin’s core bottlenecks, such as slow transactions, high fees, and zero native programmability, is the core use case. The quantum debate only reinforces the argument that Bitcoin’s infrastructure needs to evolve.
The presale has raised $32,262,965.45 at a current price of $0.013678, with high-APY staking available to early participants. Numbers at that raise level signal genuine demand — though presale projects carry significant execution risk and early pricing does not guarantee post-launch performance.
Traders researching the infrastructure angle can explore Bitcoin Hyper here.
The post BTC USD Price Hanging in The Balance: What is Quantum Computer, and Can Bitcoin Survive it? appeared first on Cryptonews.


X is preparing to automatically lock any crypto scam account that mentions cryptocurrency for the first time in its posting history, with Head of Product Nikita Bier saying the measure should eliminate 99% of the economic incentive behind the platform’s most persistent category of fraud.
Summary
- X Head of Product Nikita Bier confirmed on April 1 that the platform is implementing auto-locking and verification for any crypto scam account that posts about cryptocurrency for the first time in its history.
- The measure is designed to remove the economic incentive behind scam accounts that hijack or newly weaponize established profiles to promote fraudulent crypto schemes.
- Bier said the feature should kill 99% of the incentive, and also called out Google for failing to stop phishing emails at the inbox level.
X is preparing to automatically lock any crypto scam account that mentions cryptocurrency for the first time in its posting history, with Head of Product Nikita Bier saying the measure should eliminate 99% of the economic incentive behind the platform’s most persistent category of fraud. Bier confirmed the plan in an April 1 post on X replying to Benjamin White, founder of prediction market Predictfully, who publicly shared his account hack experience after a phishing email disguised as a copyright violation notice stole his credentials.
White’s experience is a textbook example of the attack pattern X is now targeting. His credentials were stolen through a fake login page that captured both his password and two-factor authentication code in real time. The hijacked account was then immediately redirected toward fraudulent crypto promotions — a sequence that has become standard practice among organized scam networks operating on the platform. “Yeah, we’re aware,” Bier wrote in reply. “We are in the process of implementing auto-locking + verification if a user posts about cryptocurrency for the first time in the history of their account. This should kill 99% of the incentive, especially since Google isn’t doing shit to stop the phishing.”
The scale of the problem
Crypto scams on X have intensified through 2026. In March, on-chain investigator ZachXBT traced a coordinated network of more than ten X accounts that used war-related panic posts to funnel users toward fraudulent crypto schemes, with on-chain evidence showing the cluster earned six figures from the campaign. Earlier in September 2025, X itself disclosed a bribery network in which scammers paid middlemen to reinstate suspended crypto fraud accounts, prompting legal action from the company.
How the feature works — and its limits
The auto-lock mechanism targets a specific and near-universal signature of scam activity: accounts with no prior history of crypto discussion suddenly posting promotional or transactional crypto content. By requiring verification before that first crypto post goes live, X introduces friction at the exact point where hijacked account abuse begins.
The feature does not appear to affect established accounts that already have a history of discussing crypto on the platform. Bier acknowledged that Google’s inaction on phishing emails remains a compounding vulnerability in the broader scam chain — one that X cannot fully control from its end alone.
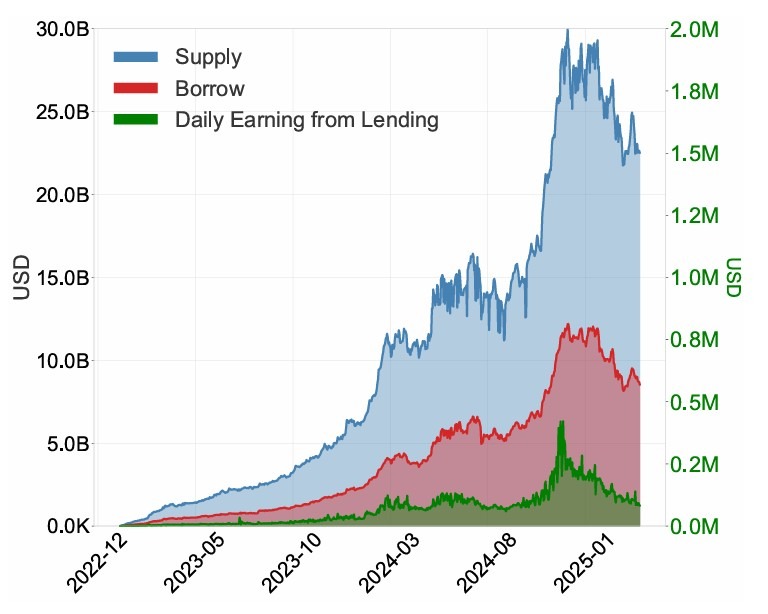
A Bank of Canada staff paper found that Aave V3 reported zero non-performing loans in 2024, with overcollateralization and automated liquidations helping prevent lender losses in its Ethereum lending market.
Using transaction-level data from Jan. 27, 2023, to May 6, 2025, the study found that positions were typically liquidated before collateral values fell below outstanding debt, helping contain lender losses across the sample.
But the model came with a tradeoff, the paper said. While it protected lenders from unrecovered losses, it also shifted risk onto borrowers and constrained capital efficiency compared with traditional lending systems.
According to the paper, Aave V3’s design relies on automated risk controls rather than traditional underwriting, requiring borrowers to post more collateral than they borrow and liquidating positions when they breach risk thresholds.

Recursive leverage fueled borrowing demand
According to the paper, Aave V3’s lending activity was not driven solely by users seeking liquidity. It found that recursive leverage accounted for over 20% of total borrowed volume and 8.2% of borrowing transactions during the sample period.
Recursive leverage involves repeatedly borrowing against collateral, redeploying the borrowed assets as new collateral and borrowing again to amplify exposure.
Related: Aave V4 goes live on Ethereum after governance vote clears rollout
The study said the dynamic made borrowers more exposed when markets turned. According to the paper, liquidations on Aave V3 tended to occur in concentrated waves, with four assets accounting for 90% of total liquidated value.
This includes Wrapped Ether (WETH), Wrapped Staked Ether (wstETH), Wrapped Bitcoin (WBTC) and Wrapped eETH (weETH).
The paper estimated that borrower losses during major liquidation events could be significant. It said liquidation fees typically ranged from 5% to 10% of liquidated value, while missed gains from subsequent price recoveries pushed combined losses to about 10% to 30% in some cases.
The staff paper suggested that while the design for Aave V3 helped prevent unrecovered bad debt in the sample, it did so by exposing borrowers to abrupt losses when collateral prices fell sharply.
Cointelegraph reached out to Aave for comment but did not receive a response before publication.
Magazine: Are DeFi devs liable for the illegal activity of others on their platforms?
Crypto World
Ripple (XRP) Price Prediction: CLARITY Act Targets April Markup While Taurox (TAUX) Nears Phase 4 In a Month After Launch

The topic of Ripple (XRP) price prediction is gaining renewed attention as the CLARITY Act moves toward a late April markup with 72% odds of passing according to prediction market data. XRP is trading around $1.30 following a 22% decline triggered by Trump Liberation Day tariffs on April 2, which imposed duties ranging from 10% to 50% across global trading partners.
Six spot XRP ETFs now hold approximately $1 billion in combined assets under management. Taurox (TAUX) is a decentralized hedge fund protocol where AI agents will trade pooled capital and stakers keep 80% of all profits.
XRP Price Prediction for 2026 and 2028 as Digital Commodity Status Reshapes Outlook
Standard Chartered projects XRP at $2.80 by the end of 2026 and $12.60 by 2028, contingent on sustained ETF inflows and regulatory clarity from the CLARITY Act. The SEC and CFTC have classified XRP as a digital commodity, removing the securities overhang that suppressed institutional adoption for years. Ripple Prime now appears on the DTCC and NSCC directory, signaling deeper integration with traditional settlement infrastructure.
Argentina’s YPF recently tokenized $800 million in energy assets on the XRP Ledger, and an AI-driven security upgrade identified more than 10 bugs in the XRPL’s 14-year codebase. A survey of institutional allocators found that 25% of fund managers plan to add XRP to their portfolios this year. Stakers in protocols built around yield generation keep 80% of trading profits, a structure absent from XRP’s validator-based fee model.

Taurox IO Offers the Structural Upside That XRP Cannot Match Before the End of the Presale
For XRP to reach Standard Chartered’s $12.60 target, its market capitalization would need to exceed $700 billion, a figure that places it above every crypto asset except Bitcoin. The Fear and Greed Index has remained at 9 for more than 47 consecutive days, and the S&P 500 fell 5.1% in Q1, its worst first quarter since 2022. Tariff-driven volatility and compressed risk appetite make large-cap moonshots harder to justify.
Taurox operates on a different scale entirely. The protocol is still in its presale phase with a $0.015 entry, listing target of $0.08, and a path to $1 that represents a 100x return. Before the end of the presale, each closing round raises the floor price permanently. That is a structural advantage no large-cap token can offer at its current valuation.

Two Sold-Out Phases and a $0.015 Entry Make Taurox the Sharpest Position in This Market
Phase 1 sold out in under 24 hours at $0.01. Phase 2 sold out at $0.012. Phase 3 is live at $0.015, and the protocol has raised over $890K across all rounds. The listing price of $0.08 is a 5.33x multiple from current entry. The $1 target represents a 100x return. At a $1 billion pool, the implied TAUX value reaches $1.85. A $500 position at $0.015 buys 33,333 TAUX. At the $0.08 listing that is $2,666. At $1 that is $33,333. The protocol charges zero management fees with 5% taken from profits only. Thirty percent of all fee revenue is burned permanently, 70% flows to the DAO treasury. The total supply is fixed at 2 billion tokens with no minting capability. Every phase that closes removes the lowest entry point from the table.
Conclusion
XRP at $1.30 carries institutional momentum from ETF inflows and commodity classification, but the upside math at large-cap scale is measured, not sharp. Taurox at $0.015, with two sold-out phases, over $890K raised, AI agents that will trade pooled capital, and 80% profit share to stakers, compresses the same institutional thesis into a fraction of the entry cost.
FAQs
What is the Ripple (XRP) price prediction for 2026?
Standard Chartered projects XRP at $2.80 by end of 2026, driven by ETF inflows and the CLARITY Act passing with 72% odds. XRP is currently trading around $1.30 after a tariff-driven selloff.
Will XRP benefit from the CLARITY Act passing?
If the CLARITY Act passes markup in late April, it would formalize XRP’s digital commodity status and remove remaining regulatory uncertainty. That clarity could accelerate institutional allocation from the 25% of fund managers already planning XRP positions.
How does Taurox compare to holding XRP for returns?
Taurox Phase 3 is priced at $0.015 with a listing target of $0.08 and a $1 path that represents 100x. XRP at $1.30 targeting $2.80 offers roughly 2x. The structural gap in upside potential is the primary reason capital is rotating.
Learn More
Buy TAUX: https://taurox.io
Whitepaper: https://docs.taurox.io/
Official Telegram: https://t.me/tauroxlabs
Official X/Twitter: https://x.com/TauroxProtocol
Disclaimer: This is a Press Release provided by a third party who is responsible for the content. Please conduct your own research before taking any action based on the content.

Macro investor and former hedge fund manager James Lavish warns that markets may be pricing in a swift settlement to the Iran conflict, but a drawn-out flare-up could unleash renewed inflation pressures and a sweeping asset repricing across equities, bonds, and crypto. In a recent Cointelegraph interview, Lavish laid out how persistent geopolitical risk could shape the macro landscape and test Bitcoin’s role as a hedge in ways not seen since the early post-crisis era.
Lavish argued that if the conflict drags on and keeps oil prices elevated, inflation dynamics could reaccelerate and stoke fears of stagflation. That combination would complicate the Federal Reserve’s policy calculus: the central bank would face a difficult trade-off between avoiding recession through aggressive hikes and not stoking inflation by keeping rates too high for too long. In such a setting, Bitcoin’s behavior—already divergent from gold and traditional equities in recent months—could come under pressure if a broad risk-off regime takes hold and correlations across risky assets rise toward one.
Markets may be pricing in a quick resolution to the Iran conflict, but if that assumption proves wrong, the consequences could be severe,
Lavish noted that a deeper macro downturn could see Bitcoin retreat further, with a plausible path toward the low-to-mid 40,000s or the low 50,000s if risk-off dynamics intensify. He stressed, however, that his longer‑term view of Bitcoin remains constructive and that such a pullback would not automatically invalidate the asset’s underlying thesis. Instead, it could present a meaningful opportunity for investors who balance exposure and leverage amid headlines driven by war fears, bond stress, and shifting expectations about Fed policy.
The interview touches on a broad spectrum of themes that matter for crypto markets—safe-haven dynamics, energy markets, Treasury yields, and the broader money-printing debate. Lavish’s perspective is anchored in a wary reading of how geopolitics interact with inflation, policy, and asset pricing, offering a lens for traders to navigate a landscape where macro shocks can rewire correlations and reinvestment flows.
Readers who want the full context can watch the entire discussion on Cointelegraph’s YouTube channel, where Lavish expands on his framework for war risk, recession risk, and Bitcoin’s next move.
Key takeaways
- Prolonged Iran-related conflict and higher oil prices could reignite inflation, intensifying stagflation fears and prompting a broad market repricing.
- The Federal Reserve may face a policy conundrum: aggressive rate hikes risk recession, but persistent inflation complicates any easy path to rate cuts.
- Bitcoin’s recent resilience versus gold and equities may not hold in a genuine panic regime with rising correlations across risk assets.
- In a deeper drawdown, BTC could slide toward the high 40,000s to around 50,000, highlighting the importance of risk management and position sizing.
- Even with near-term risks, Lavish suggests a long-run constructive view on Bitcoin, advocating balanced exposure rather than extreme leverage or complete abstention.
Market backdrop and Bitcoin’s test in a macro shock
The core tension centers on how geopolitics translates into macro momentum. An extended Iran flare-up could push energy prices higher for longer, feeding a renewed inflation scare that rubs against central-bank normalization efforts. In Lavish’s framing, the market would be forced to price in a more complicated trajectory for the Fed: keep policy tight to prevent inflation from reigniting, while acknowledging the risk of growth deterioration if that stance triggers a recession.
This setting is particularly relevant for Bitcoin, which has carved out a narrative as a hedge or diversification asset in recent quarters. Yet the same conditions that helped BTC resist traditional sell-offs at times could reverse under a “correlation-to-one” shock, where equities, bonds, and crypto all move in lockstep toward risk-off territory. Lavish’s view underscores a key paradox for investors: BTC’s elasticity to macro risk can be situational, and its protective qualities are not guaranteed in a full-blown panic scenario.
What to watch next: signals, flows, and policy shifts
Looking ahead, the path for Bitcoin will be tethered to three intertwined factors. First, oil and energy markets will test the durability of inflation expectations. Second, the Fed’s response—how quickly it leans into or against inflation signals—will shape risk appetites and funding costs across markets. Third, hedging dynamics and the behavior of large funds and treasuries will influence whether BTC remains an uncorrelated alternative or simply another risk asset tethered to the broader cycle.
Lavish also emphasizes prudent risk management: avoid over-leveraged positions in a volatile macro environment and maintain some exposure to Bitcoin without letting single headlines dictate allocations. The broader takeaway is not a bearish call for crypto, but a reminder that macro-driven shocks can realign asset relationships in meaningful ways—and preparedness matters for traders and investors alike.
As the situation evolves, readers should monitor geopolitical developments, energy price trajectories, and inflation data, all of which will feed into Fed expectations and, by extension, Bitcoin’s price path in the near term.
In the meantime, the full interview offers a deeper dive into war risk, economic resilience, and Bitcoin’s strategic role in a shifting macro landscape. It serves as a reminder that the most consequential moves in crypto often hinge on how macro narratives unfold when headlines dominate headlines and policy signals follow a volatile, uncertain arc.
This analysis was adapted from James Lavish’s remarks in a Cointelegraph interview. The discussion continues to illuminate how macro uncertainty can redefine what qualifies as “safe” in crypto markets and where opportunities may arise as the narrative evolves.
It overshadows Belfast’s most famous attraction – but this development is much needed

How Many Games Will Be Luka Doncic Be Out? Luka Doncic Hamstring Injury Timeline Uncertain

Best Crypto to Buy Now: Pepeto Raises Above $8.1M as Investors Look Past BTC and XRP During the Correction


-

 NewsBeat1 day ago
Steven Gerrard disagrees with Gary Neville over ‘shock’ Chelsea and Arsenal claim | Football
-

 Sports7 days ago
Sweet Sixteen Game Thread: Tide vs Michigan
-
Entertainment4 days ago
Fans slam 'heartbreaking' Barbie Dream Fest convention debacle with 'cardboard cutout' experience
-

 Business21 hours ago
No Jackpot Winner and $194 Million Prize Rolls Over
-

 Crypto World2 days ago
Gold Price Prediction: Worst Month in 17 Years fo Save Haven Rock
-
 Entertainment6 days ago
Lana Del Rey Celebrates Her Husband’s 51st Birthday In New Post
-

 Tech5 days ago
The Pixel 10a doesn’t have a camera bump, and it’s great
-
Crypto World3 days ago
Dems press CFTC, ethics board on prediction-market insider trades
-

 Tech5 days ago
Avatar Legends: The Fighting Game comes out in July and it looks pretty slick
-

 Sports3 days ago
Tallest college basketball player ever, standing at 7-foot-9, entering transfer portal
-

 Tech4 days ago
EE TV is using AI to help you find something to watch
-

 Fashion6 days ago
Amazon Sundays: Soft Spring Layers
-

 Business2 days ago
Login and Checkout Issues Spark Merchant Frustration
-

 Fashion7 days ago
When Evening Dressing Gets Colorful for Spring
-

 Tech5 days ago
Elon Musk’s last co-founder reportedly leaves xAI
-

 Tech3 days ago
How to back up your iPhone & iPad to your Mac before something goes wrong
-

 Tech4 days ago
Apple will hide your email address from apps and websites, but not cops
-

 Politics4 days ago
Should Trump Be Scared Strait?
-

 Crypto World4 days ago
U.S. rule change may open trillions in 401(k) funds to crypto
-

 Tech4 days ago
Flipsnack and the shift toward motion-first business content with living visuals
You must be logged in to post a comment Login