
Crypto World
HBAR Price Faces a 30% Crash Risk as ETFs Remain Absent
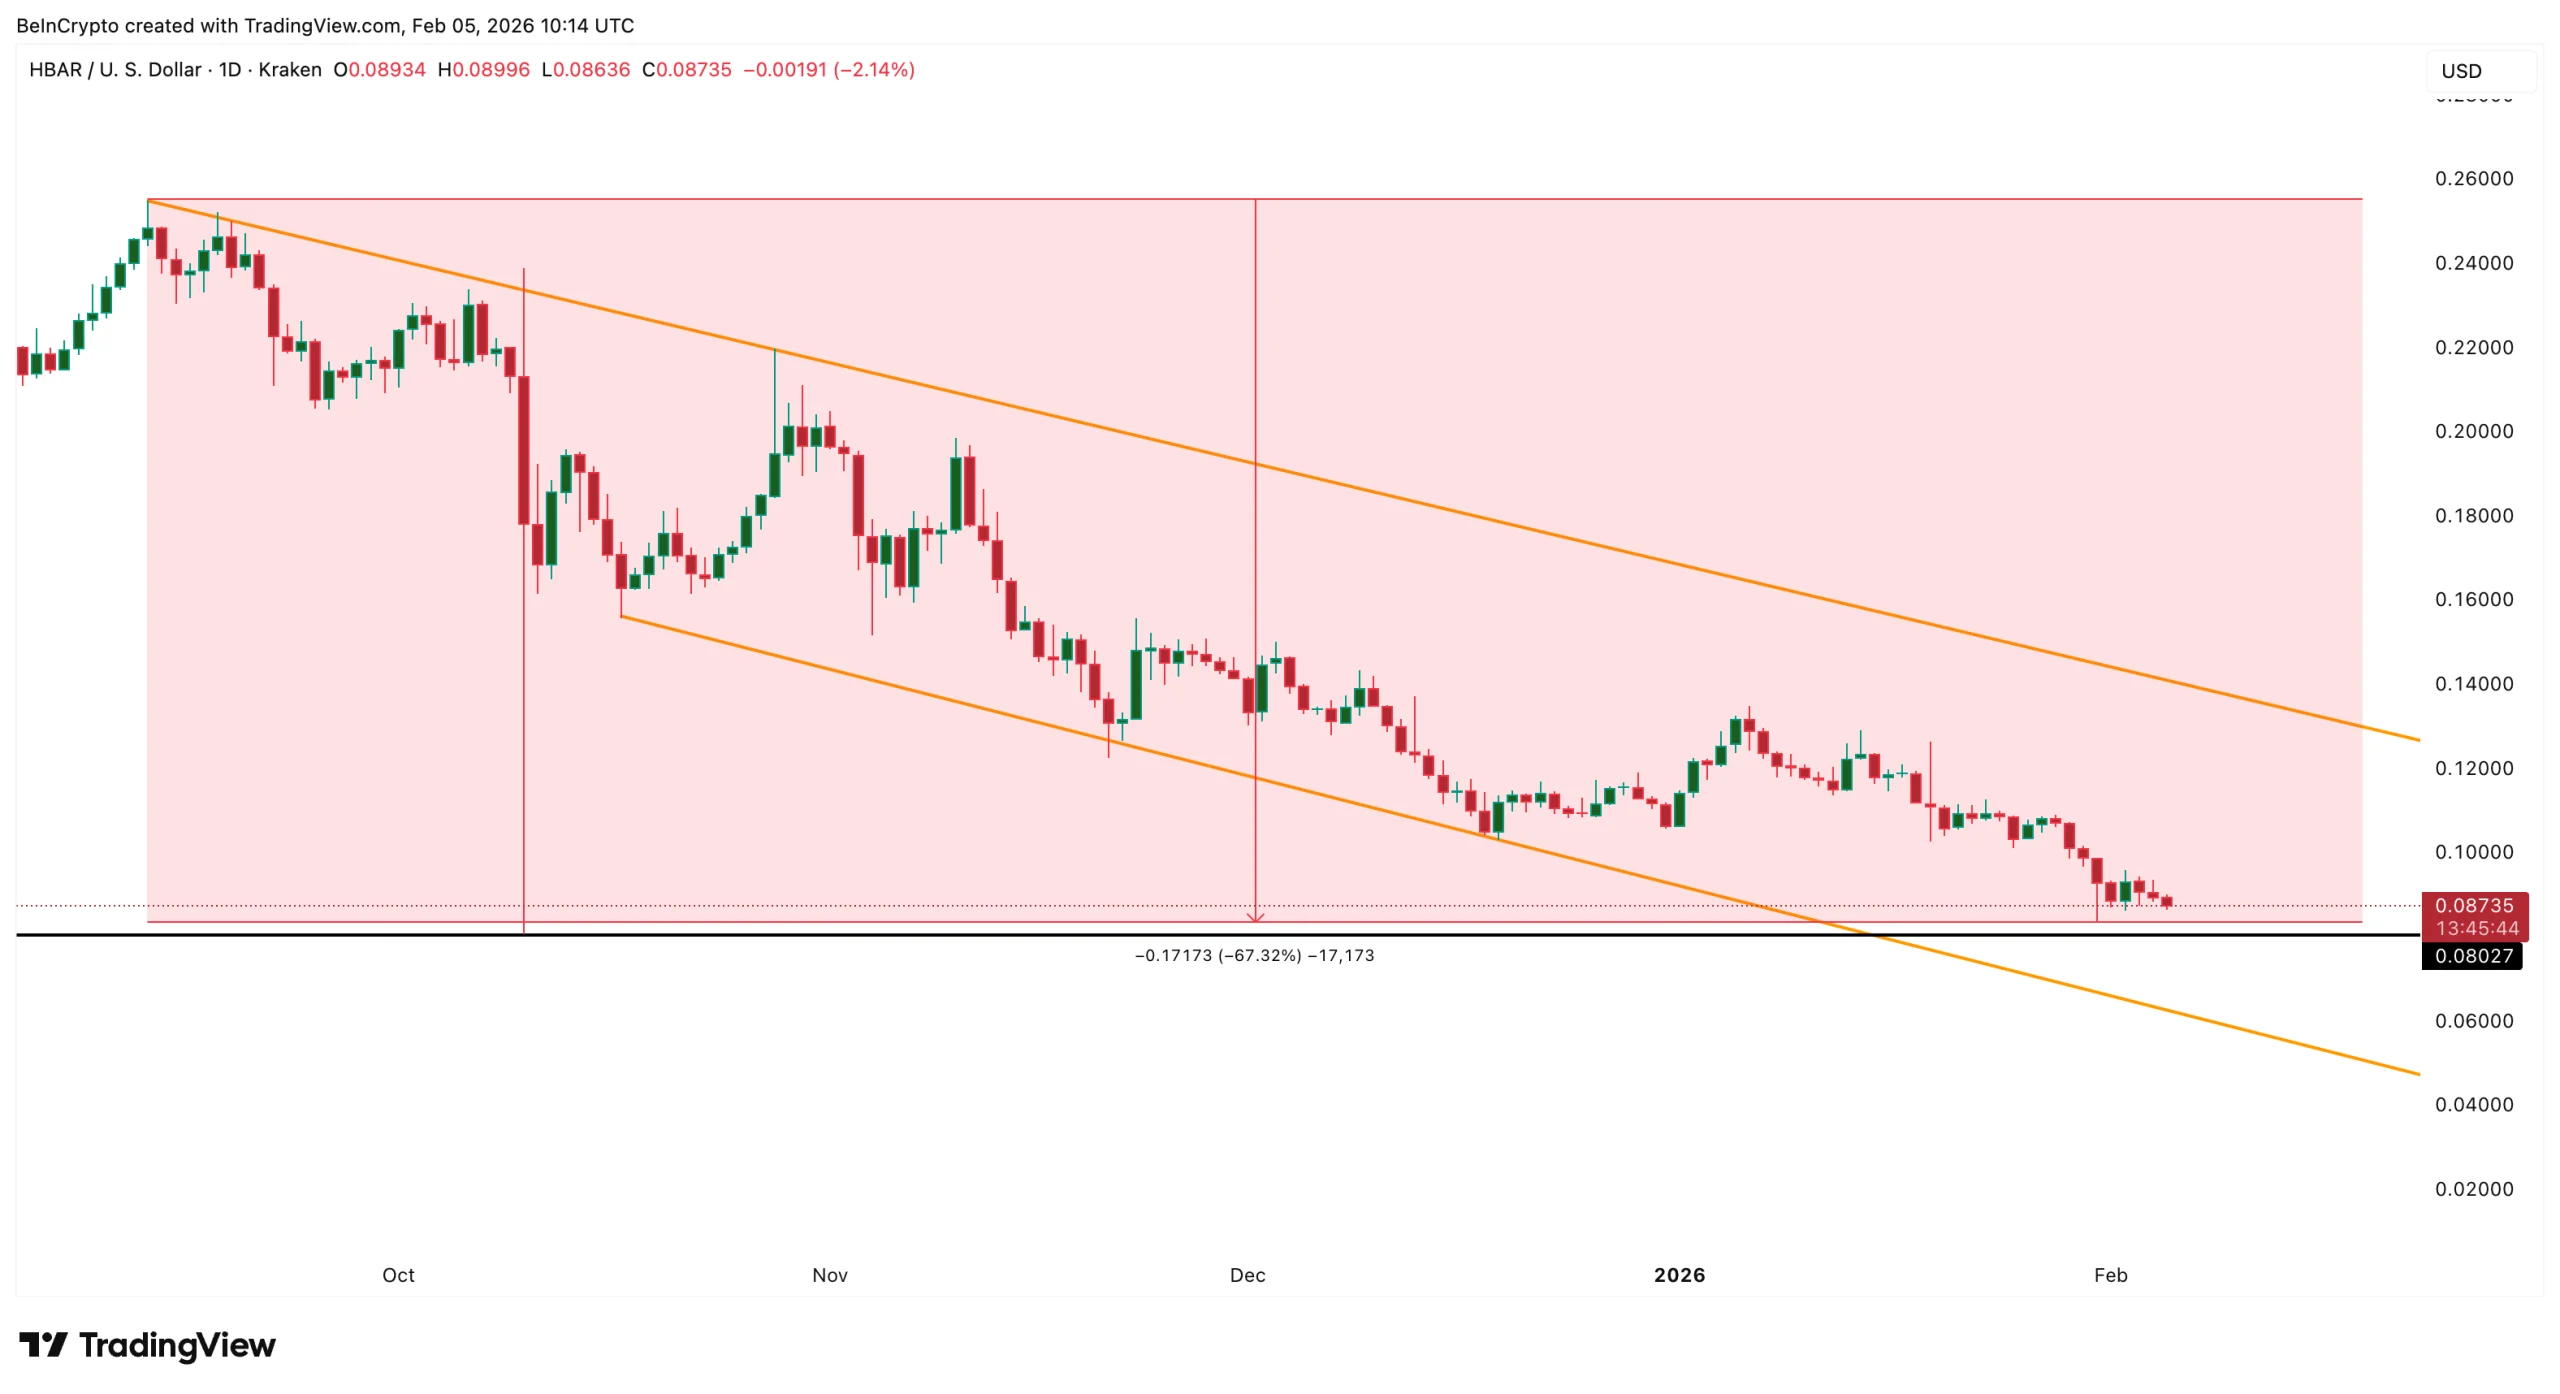
HBAR price remains under heavy pressure as the broader crypto market stays weak. The token is down nearly 47% over the past three months and has slipped another 6% in the past 24 hours, tracking Bitcoin’s latest decline. More importantly, this is not just a short-term sell-off. Hedera’s price has been falling steadily since September, losing almost 67% from its highs.
Behind this move is a deeper problem: shrinking network liquidity, weak institutional demand, and fading retail participation. As TVL continues to fall and ETF inflows remain absent, charts now suggest that HBAR could face another major downside leg. Here is what the data is showing.
Hedera’s TVL Collapse Shows Liquidity Has Been Leaving for Months
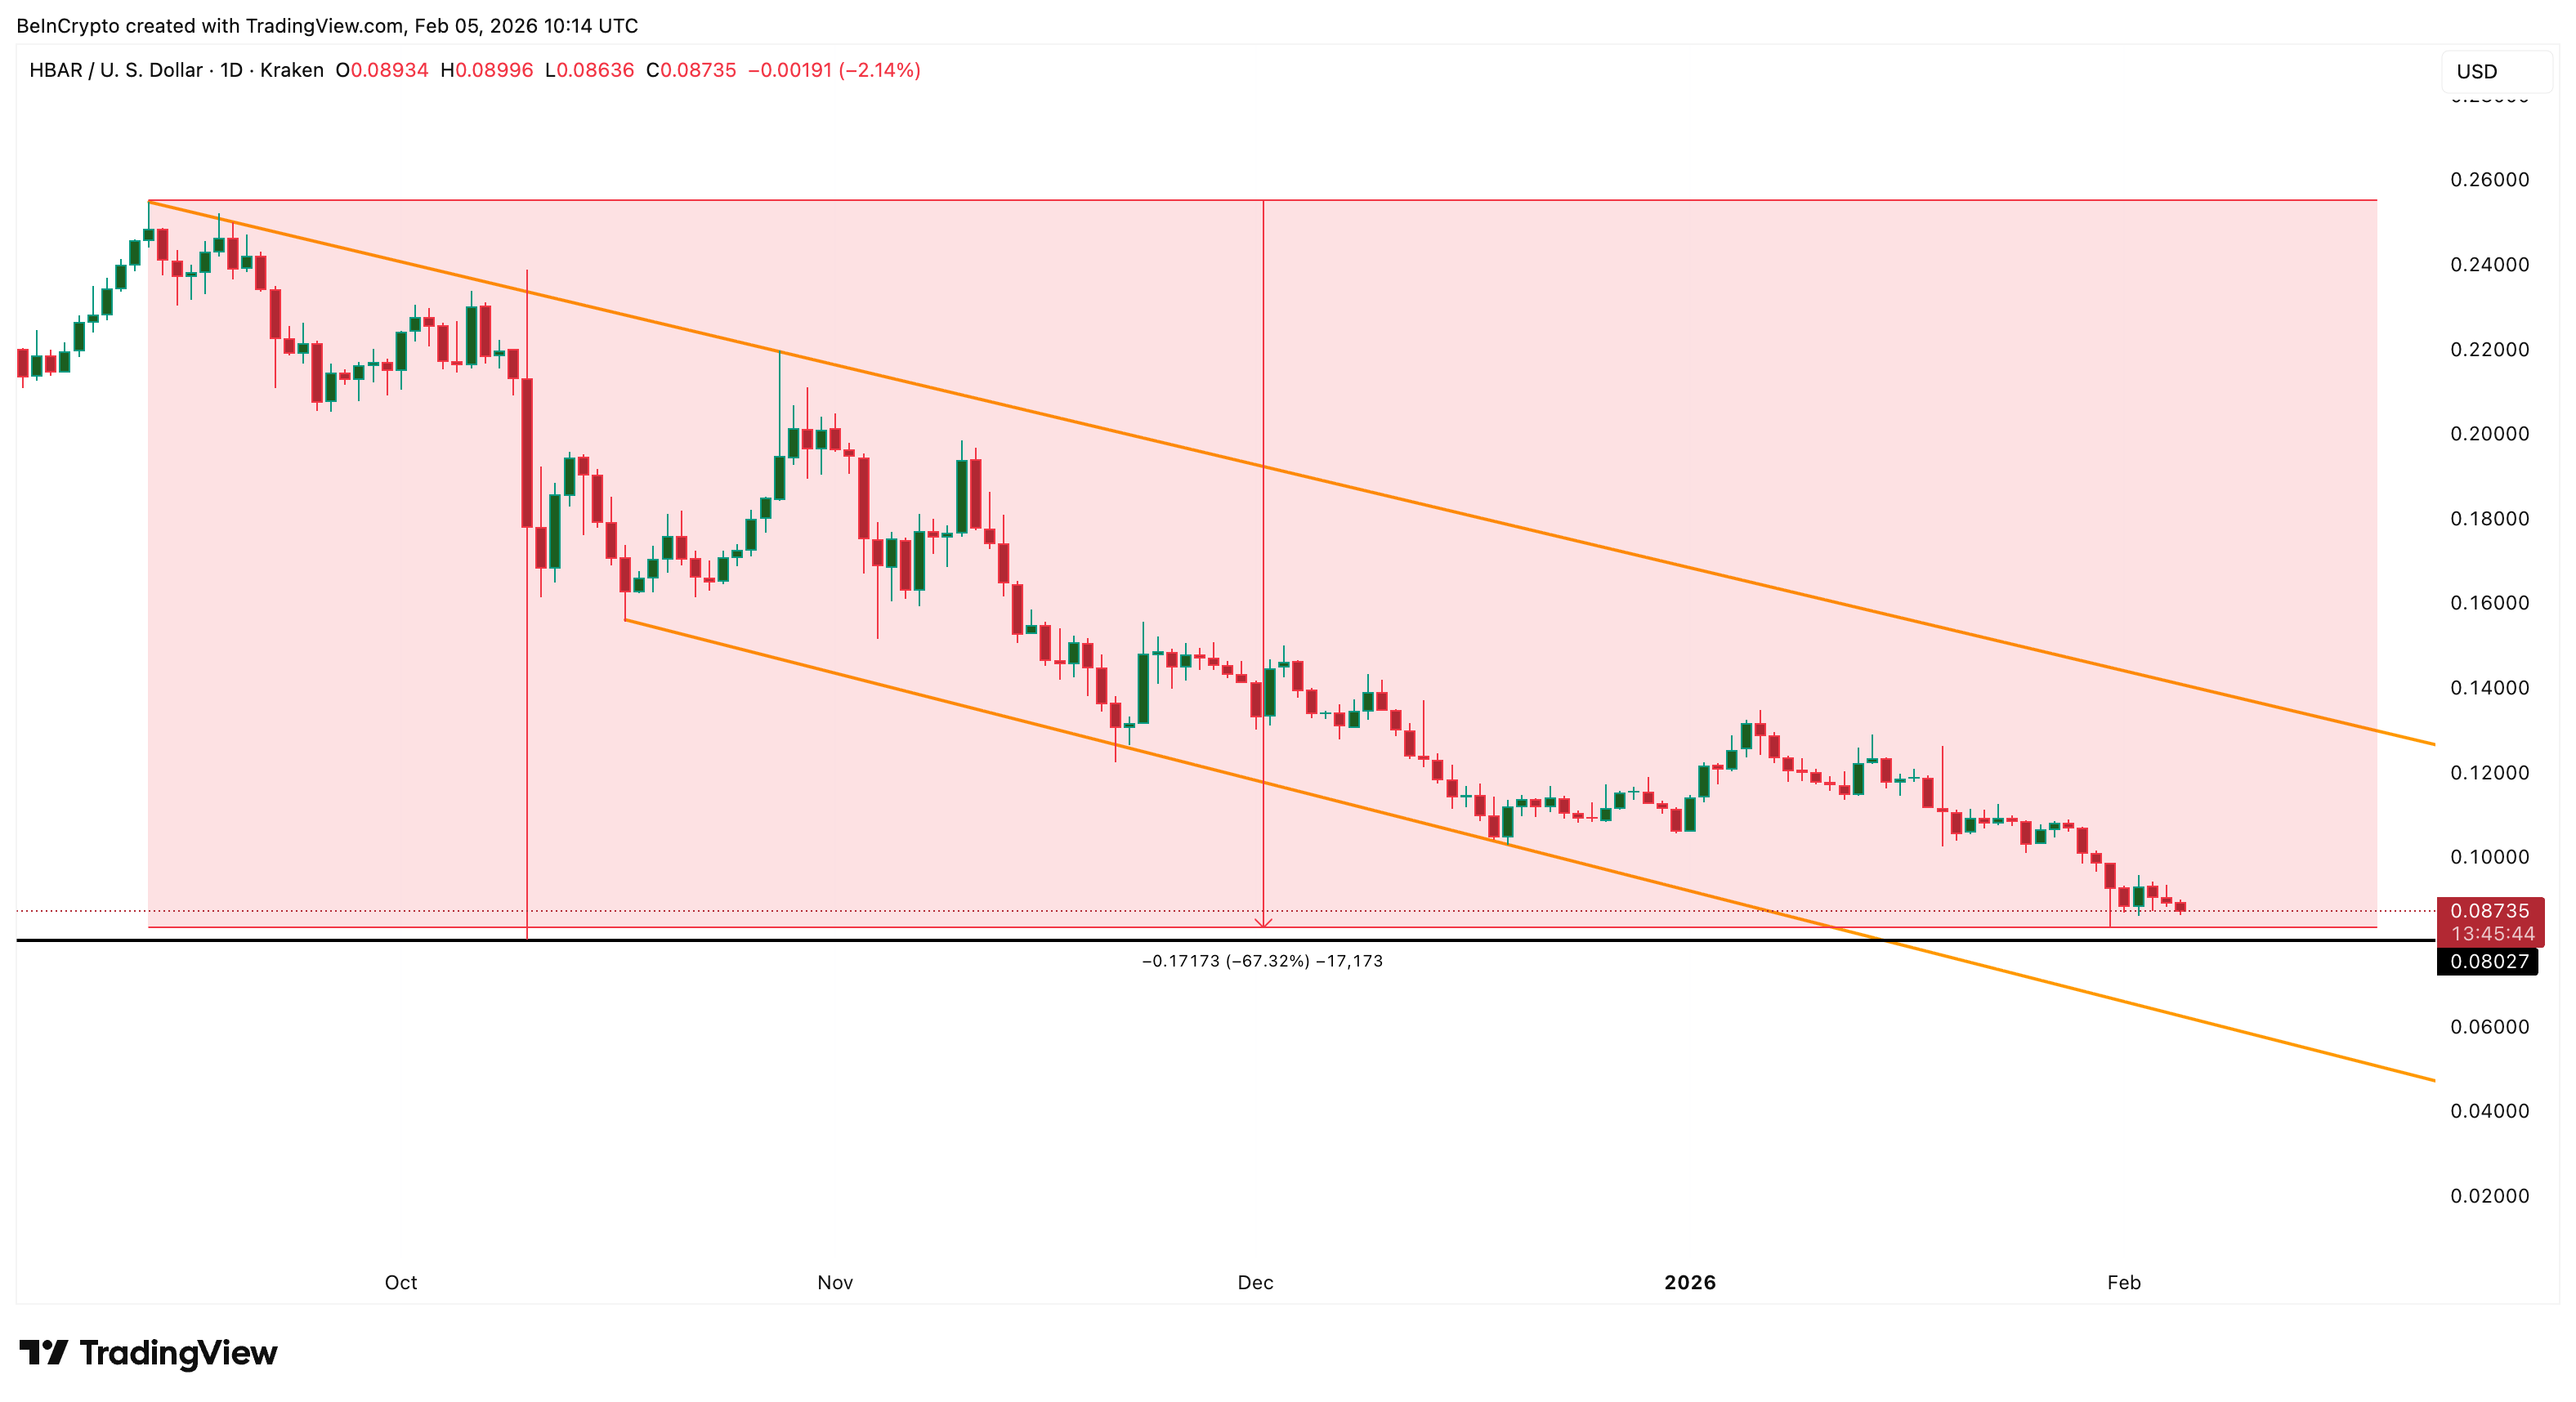
HBAR’s downtrend began in mid-September, when the price started trading against a falling trendline. Soon, the weakening prices entered a falling channel as lower highs met lower lows. Since then, every rally has been weaker, and each breakdown has pushed the token lower.
Sponsored
Sponsored
Want more token insights like this? Sign up for Editor Harsh Notariya’s Daily Crypto Newsletter here.
This HBAR price action mirrors what happened to Hedera’s on-chain liquidity.
Total value locked was near $122.5 million in September. It has now dropped to around $56 million, a decline of more than 50%. TVL measures how much capital is locked inside DeFi protocols. When TVL falls, it usually means users are withdrawing funds and activity is slowing.
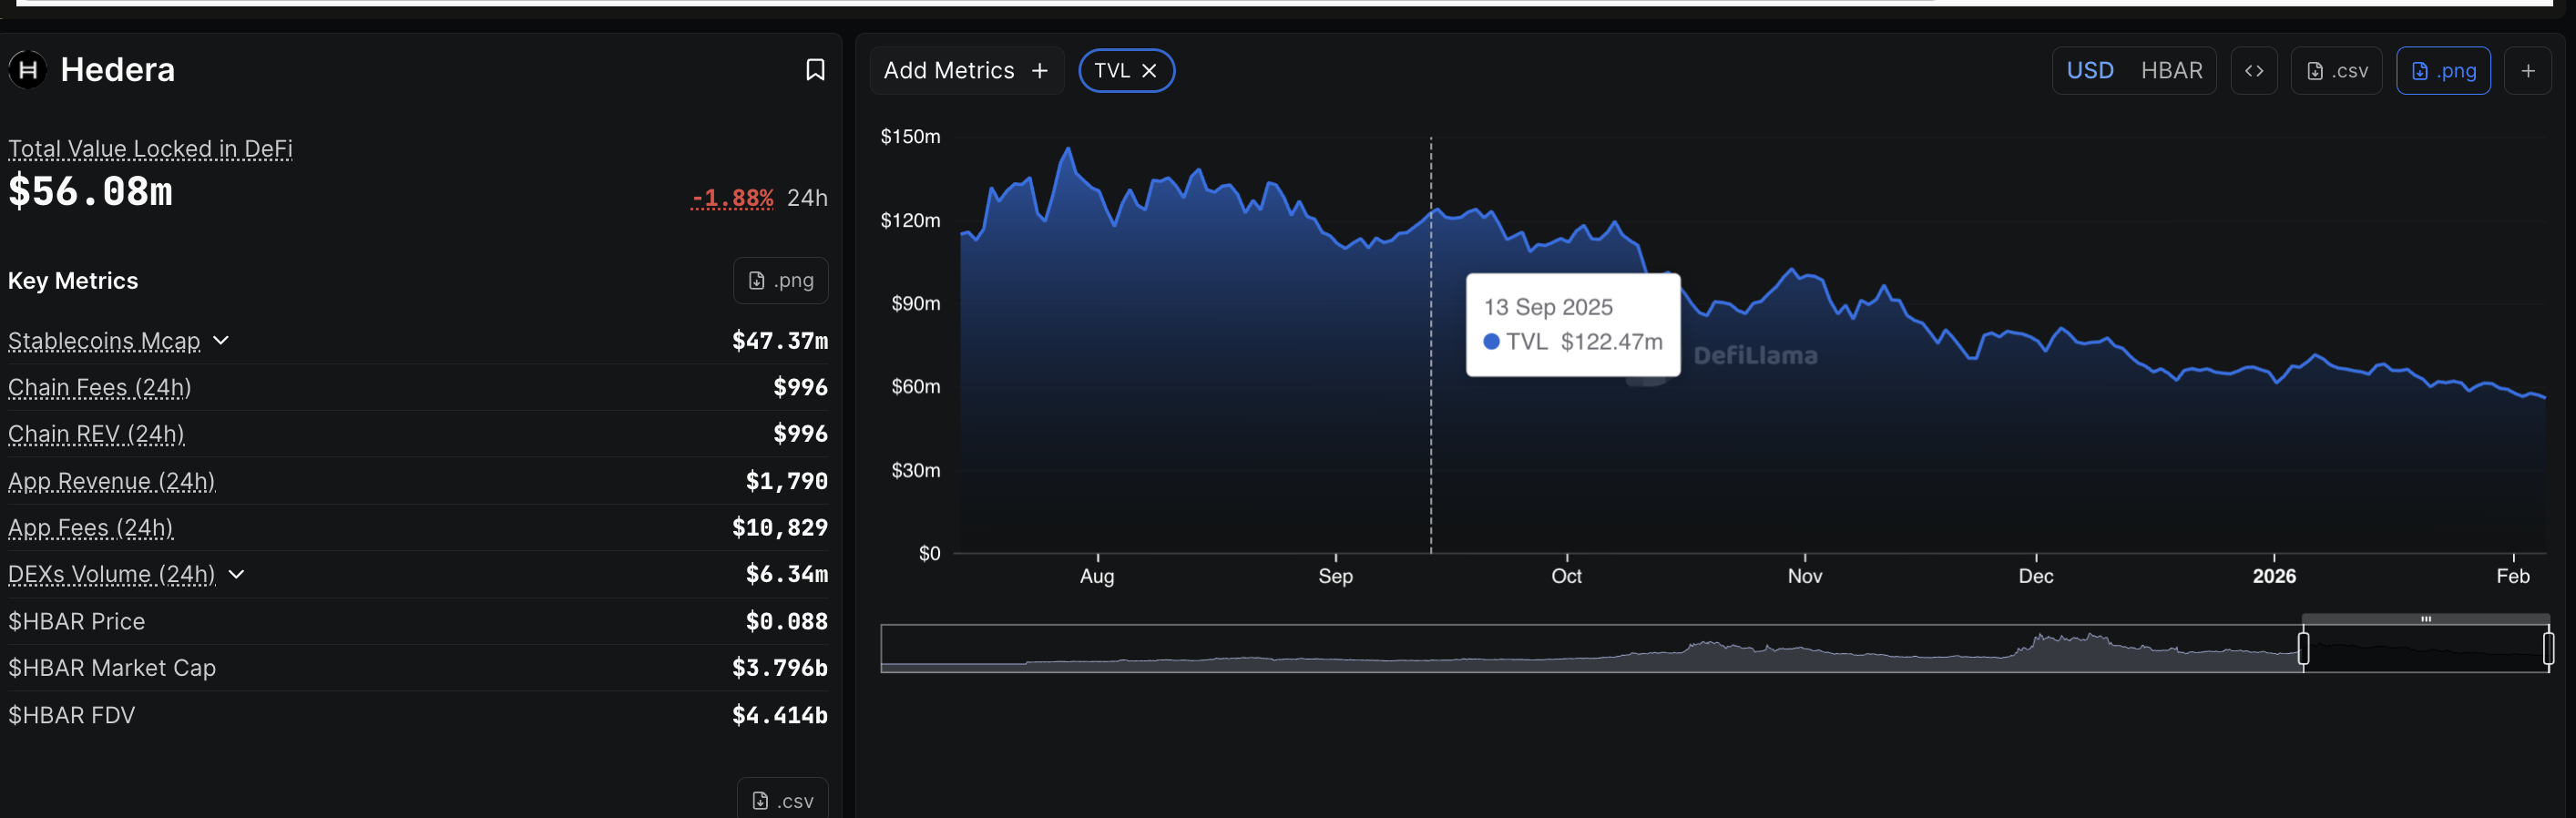
In simple terms, money started leaving the network months ago. The price just followed this fundamental weakness. This explains why HBAR’s decline looks gradual rather than sudden. Liquidity has been drying up steadily. Without fresh capital, rallies fail quickly.
As long as TVL stays weak, HBAR’s upside remains structurally limited.
Sponsored
Sponsored
CMF Shows Selective Buying, But ETF and Retail Demand Remain Weak
Not all signals are bearish.
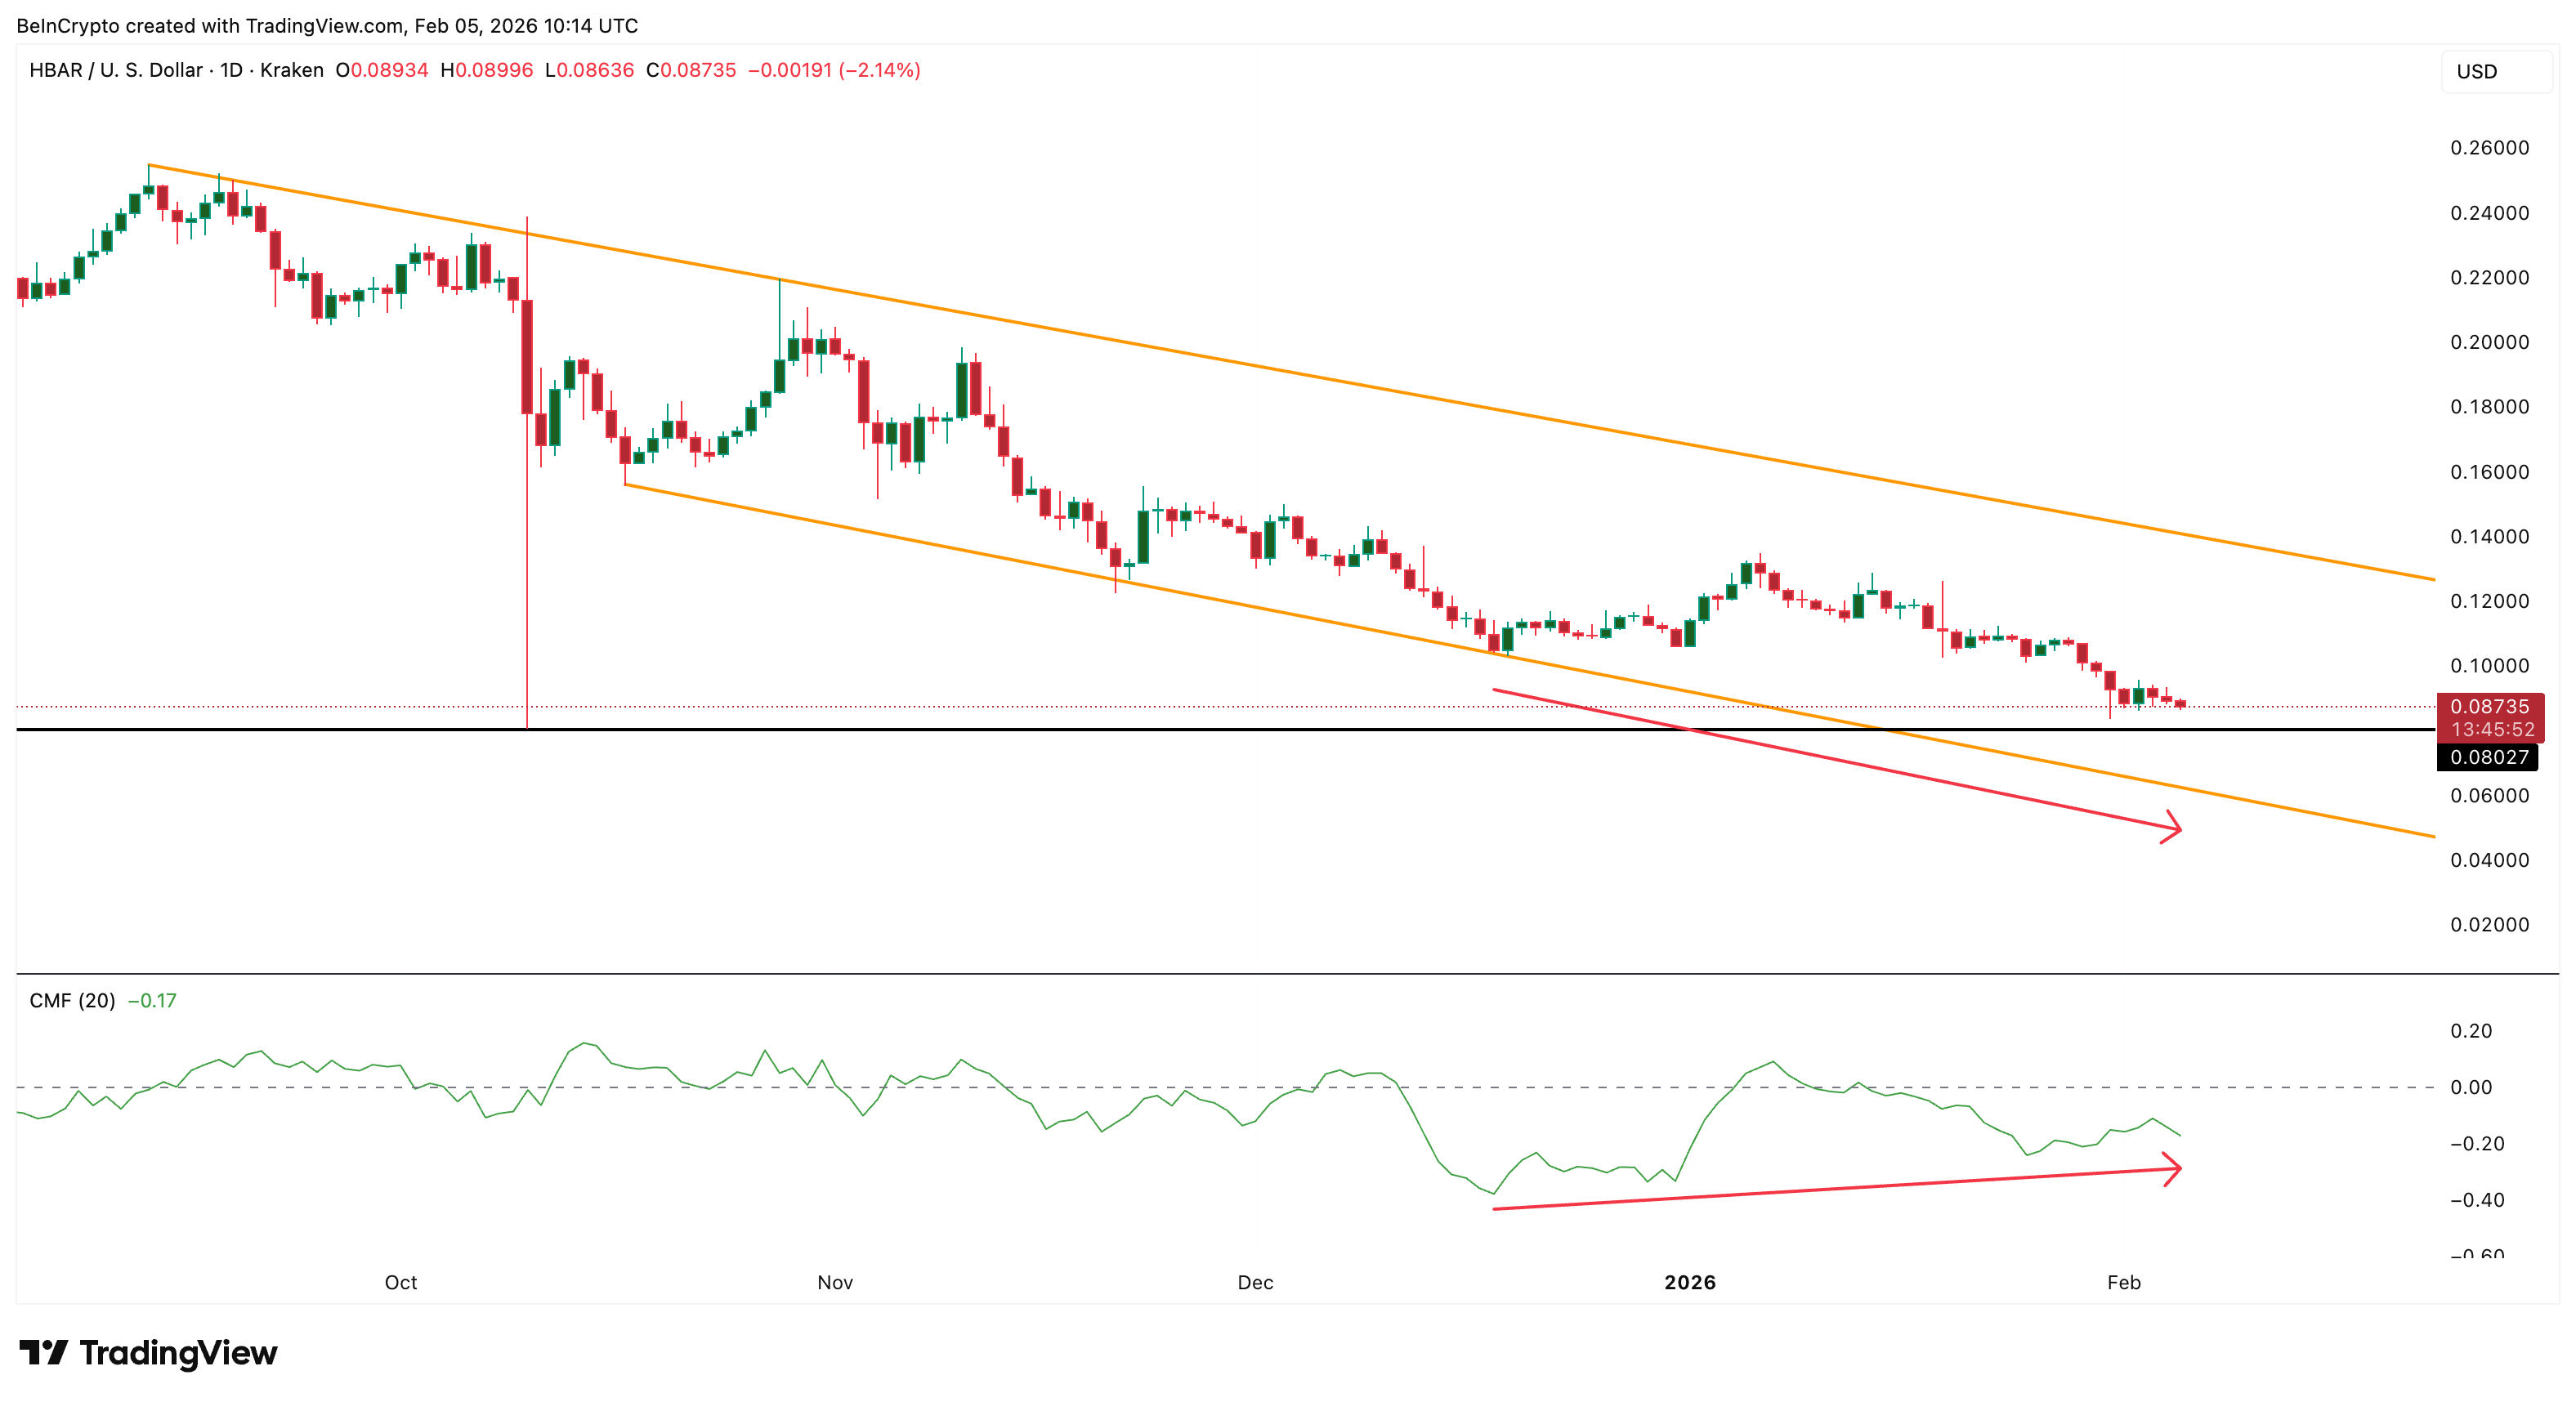
The Chaikin Money Flow has been rising since mid-December, even as the price moved lower. This creates a bullish divergence, showing that some larger investors are accumulating. However, CMF is still below zero. Outflows still dominate. Inflows are improving, but not strongly enough.
At the same time, spot HBAR ETFs have shown no recent inflows over the past two weeks. ETFs bring institutional capital and could help CMF move above the zero line. Their absence limits upside momentum.
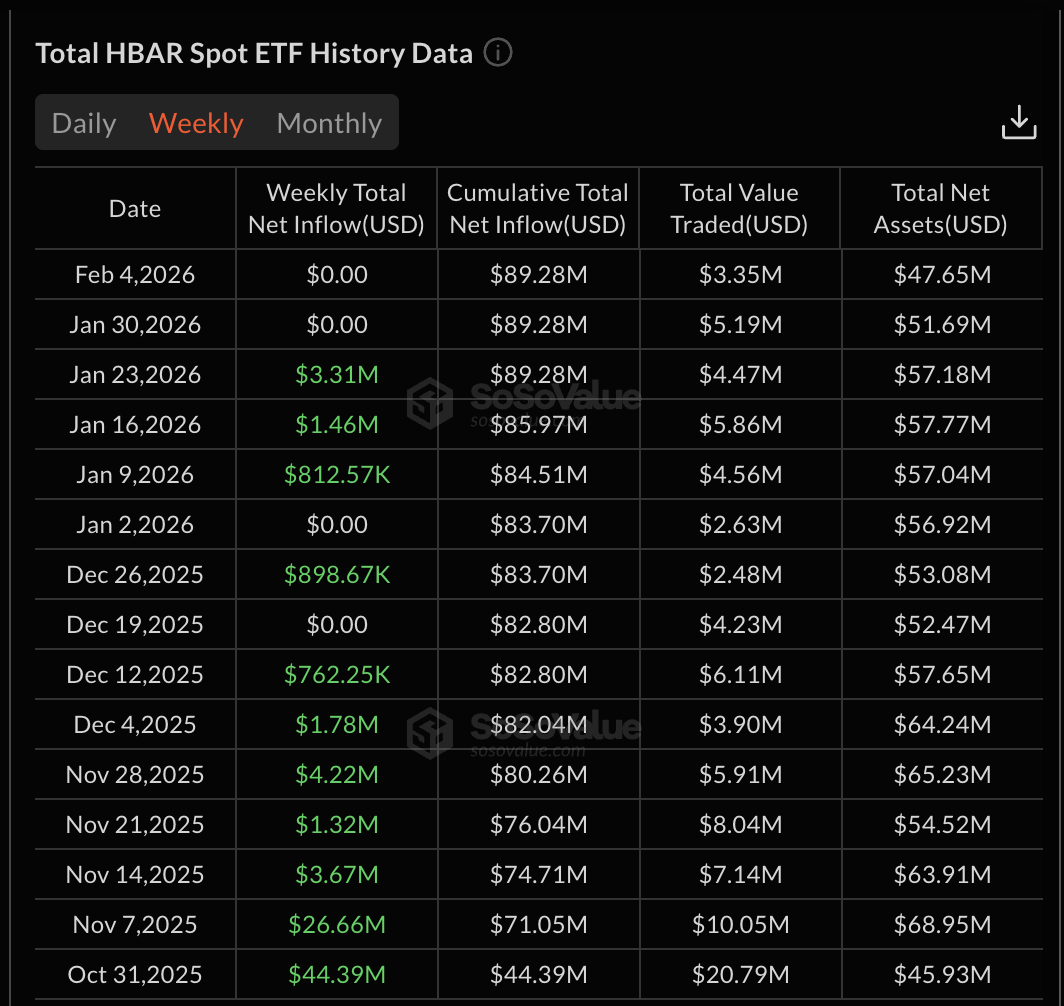
The bigger warning comes from On-Balance Volume. OBV has been trending lower since October. This showed that participation and conviction were steadily weakening even during short-term bounces. Recently, OBV broke below this descending support line.
When OBV loses long-term support, it signals that selling pressure is accelerating and that market participation is deteriorating. It suggests that fewer buyers are stepping in, even at lower prices.
Sponsored
Sponsored
So the current setup looks like this:
- Some large buyers are accumulating slowly (CMF divergence)
- Institutional flows remain weak (ETF inactivity)
- Broader participation is shrinking (OBV breakdown)
Without strong volume support, rallies lack follow-through. This explains why HBAR continues to fail at resistance despite occasional inflow signals.
Until OBV stabilizes and ETF demand improves, upside moves are likely to remain fragile.
Sponsored
Sponsored
Falling Channel and OBV Breakdown Point to a 30% Risk Zone
The Hedera Price structure confirms this fragile setup.
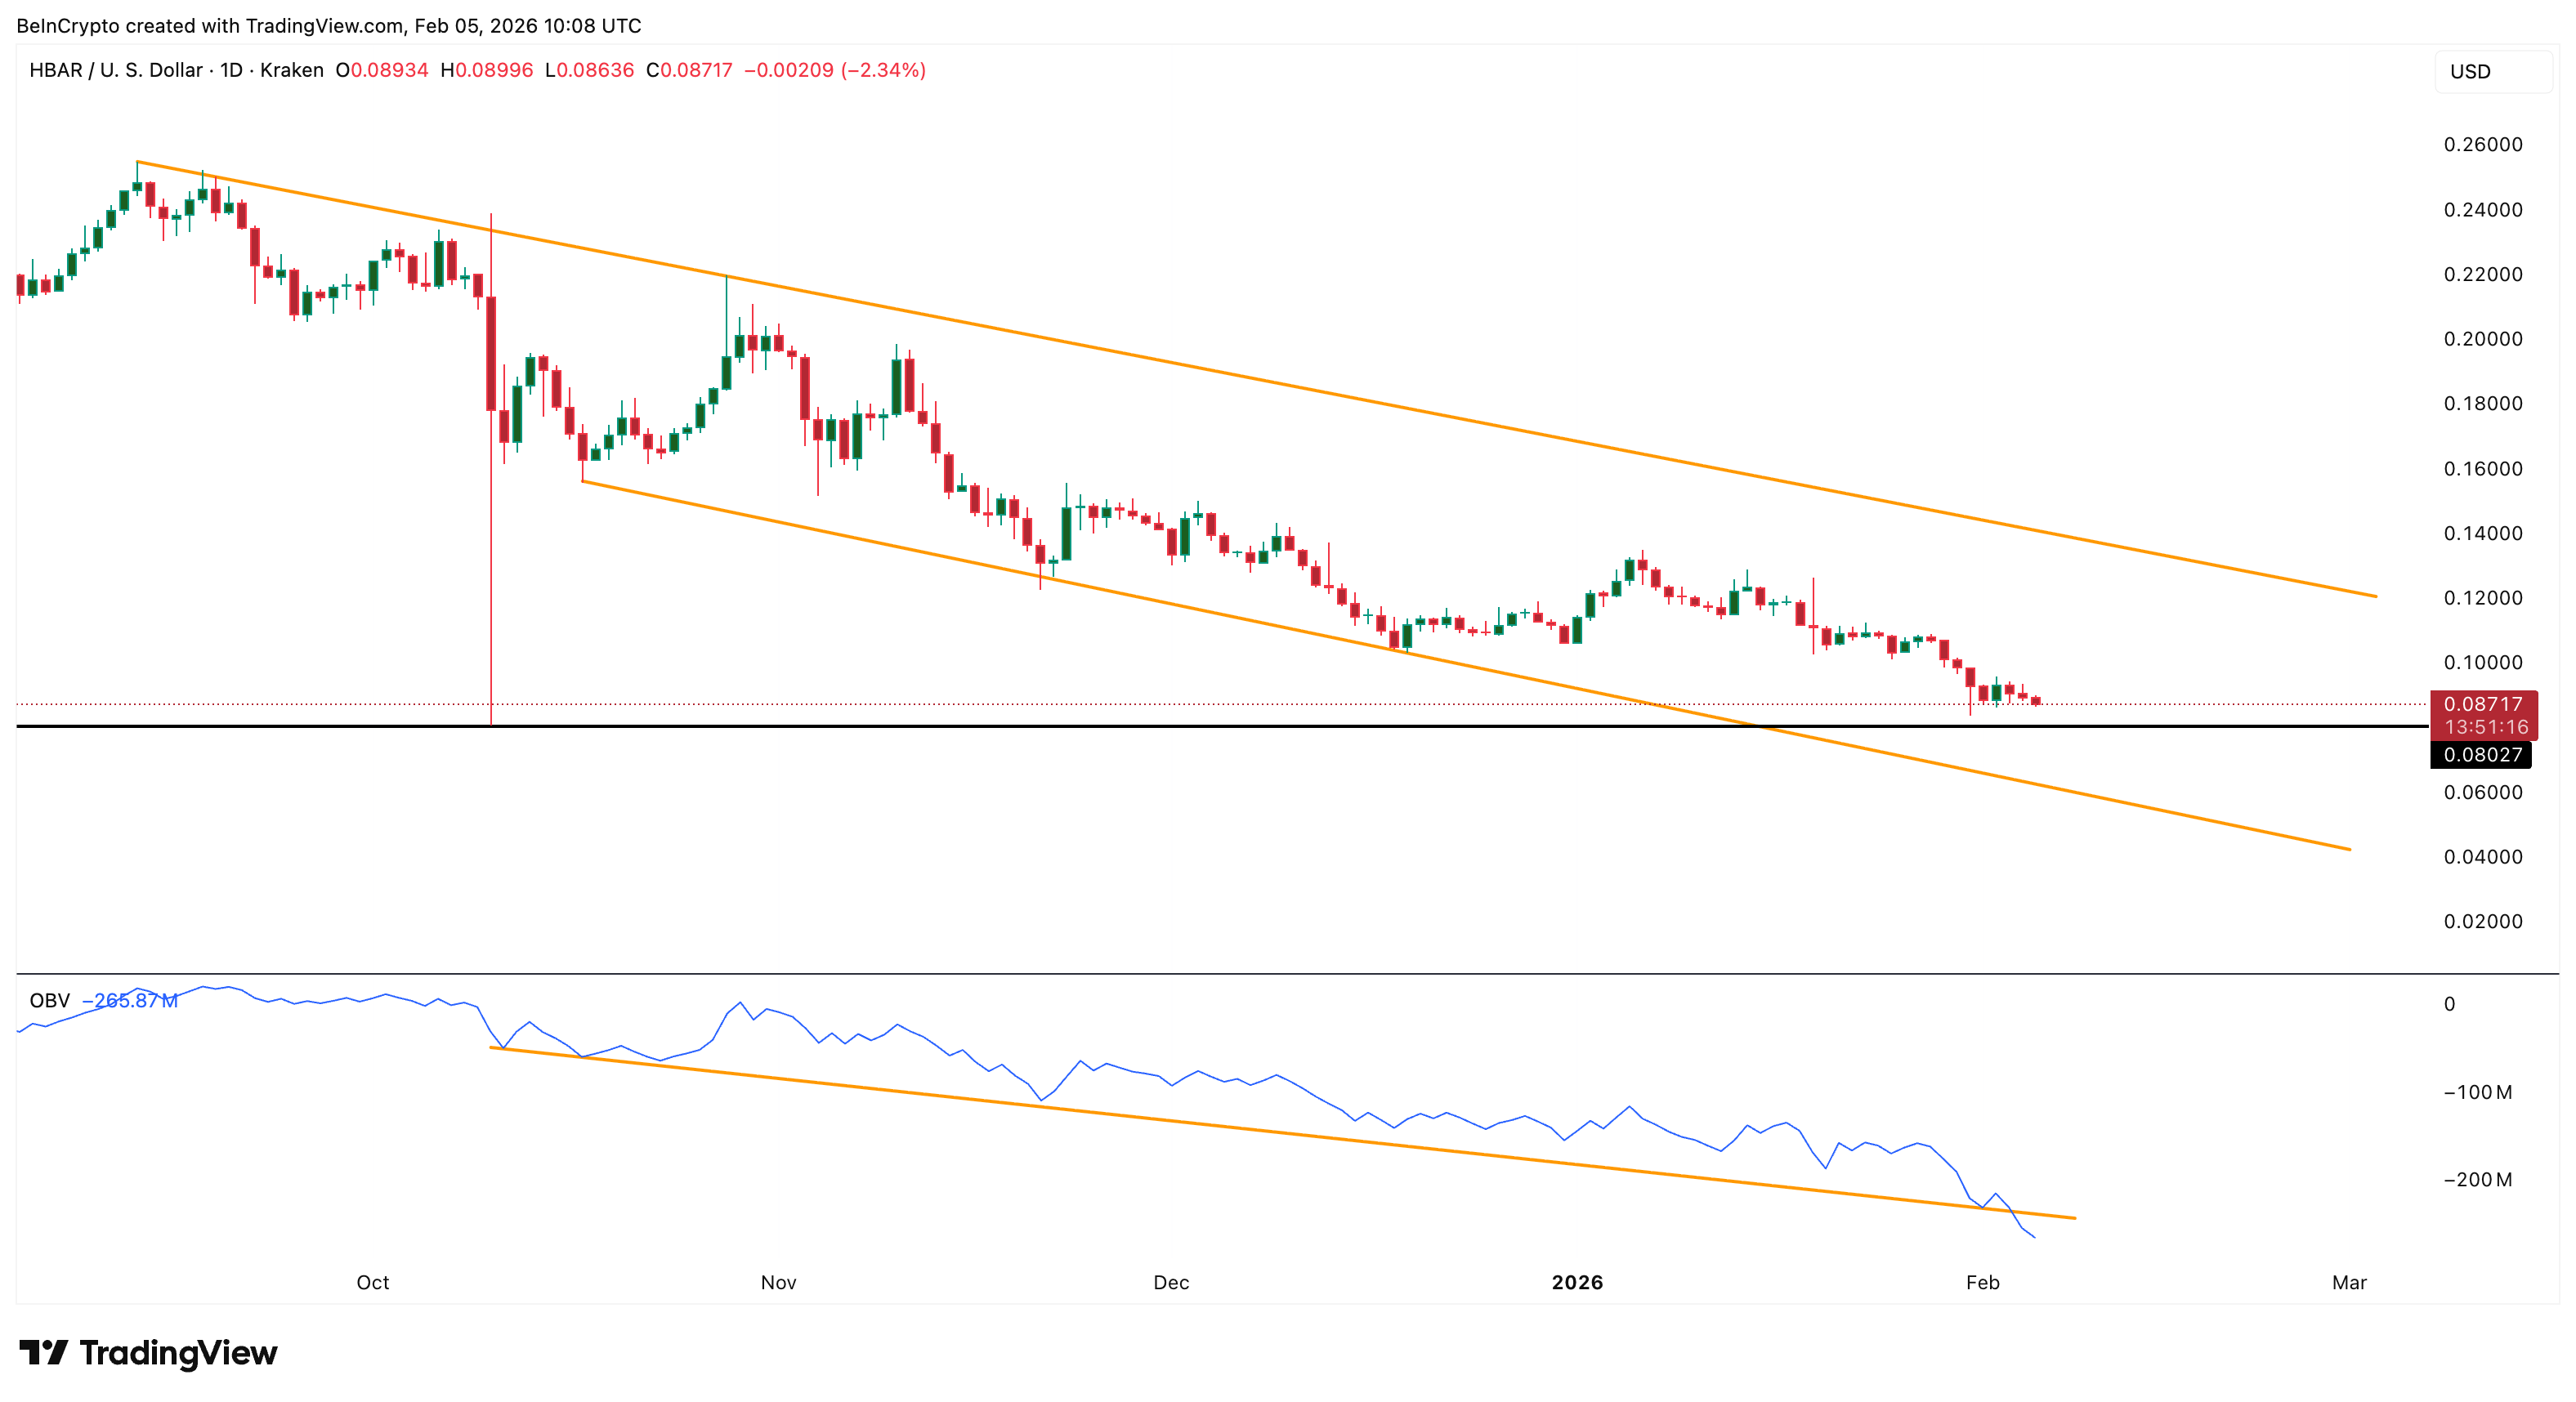
HBAR remains trapped inside a falling channel that has guided price lower since September, with a breakdown projection of around 30% if the lower trendline breaks.
The first major support sits near $0.080-$0.076. This zone has been in place since the October 10 crash. A daily close below it would weaken the structure. Below that, the next support lies near $0.062, based on Fibonacci extensions to the downside.
If this level breaks, the channel projection points toward $0.043, opening the 30% breakdown path. On the upside, recovery remains difficult.
HBAR must first reclaim $0.107. A move above $0.134 is needed to break the bearish channel. But that likely requires:
- A sustained TVL rebound
- Consistent ETF inflows
Without both, any HBAR price bounce attempt may fade quickly.


The crypto market saw several important developments today, including a warning from Hong Kong authorities about cryptocurrency scams, a new filing from Grayscale for a crypto-based ETF, and progress on the CLARITY Act in the U.S. Here’s a quick overview of the major events.
Summary
- Hong Kong senior lost HK$6.6M in three crypto scams involving fake experts.
- Grayscale files for HYPE ETF, offering exposure to Hyperliquid’s token.
- US lawmakers near agreement to regulate stablecoin yield to protect banks.
Hong Kong police warn after senior man falls victim to scams
Hong Kong’s Police Cyber Crime Bureau issued a warning today after a 66-year-old retired man lost HK$6.6 million to three separate cryptocurrency scams. According to reports, the elderly victim was first contacted in September 2025 by a fraudster claiming to be a cryptocurrency expert. The scammer convinced the victim to invest, promising guaranteed profits. The man transferred HK$1.4 million to the fraudster, only to realize later that he had been tricked.
Undeterred, the victim sought help from another fraudster posing as an expert to recover his losses. However, after paying a deposit of 600,000 yuan, the second fraudster also disappeared. In January of this year, the victim was once again approached by a scammer claiming to recover the previous losses. This time, the fraudster instructed the victim to purchase cryptocurrency worth 4.6 million yuan, which the victim did. Once again, the scammer vanished, leaving the man without his entire life savings.
Grayscale files for HYPE ETF linked to Hyperliquid token
In other news, Grayscale filed with the U.S. Securities and Exchange Commission to launch an exchange-traded fund (ETF) tied to Hyperliquid’s native token, HYPE. The proposed Grayscale HYPE ETF, if approved, would allow investors to gain exposure to the token’s price movement without holding the token directly.
Hyperliquid is a blockchain platform focused on decentralized perpetual futures trading. The proposed ETF would initially track the price of HYPE, with the potential for staking to be added later. Grayscale’s move adds to a growing list of firms exploring investment products tied to newer digital assets like HYPE, as interest in crypto ETFs continues to expand beyond Bitcoin and Ethereum.
U.S. lawmakers work on stablecoin yield agreement
Meanwhile, in the United States, progress on the CLARITY Act is moving forward. Reports suggest that lawmakers are close to a tentative agreement on stablecoin yield, a key issue that has slowed the progress of the cryptocurrency market structure bill earlier this year.
The proposed agreement would address concerns over stablecoin yield and its potential impact on bank deposits. If passed, the legislation could regulate how stablecoin issuers offer yield to their holders. The deal aims to protect innovation while limiting the risk of deposit flight from the banking system. It could be a significant step forward in regulating digital assets and stabilizing the U.S. crypto market.
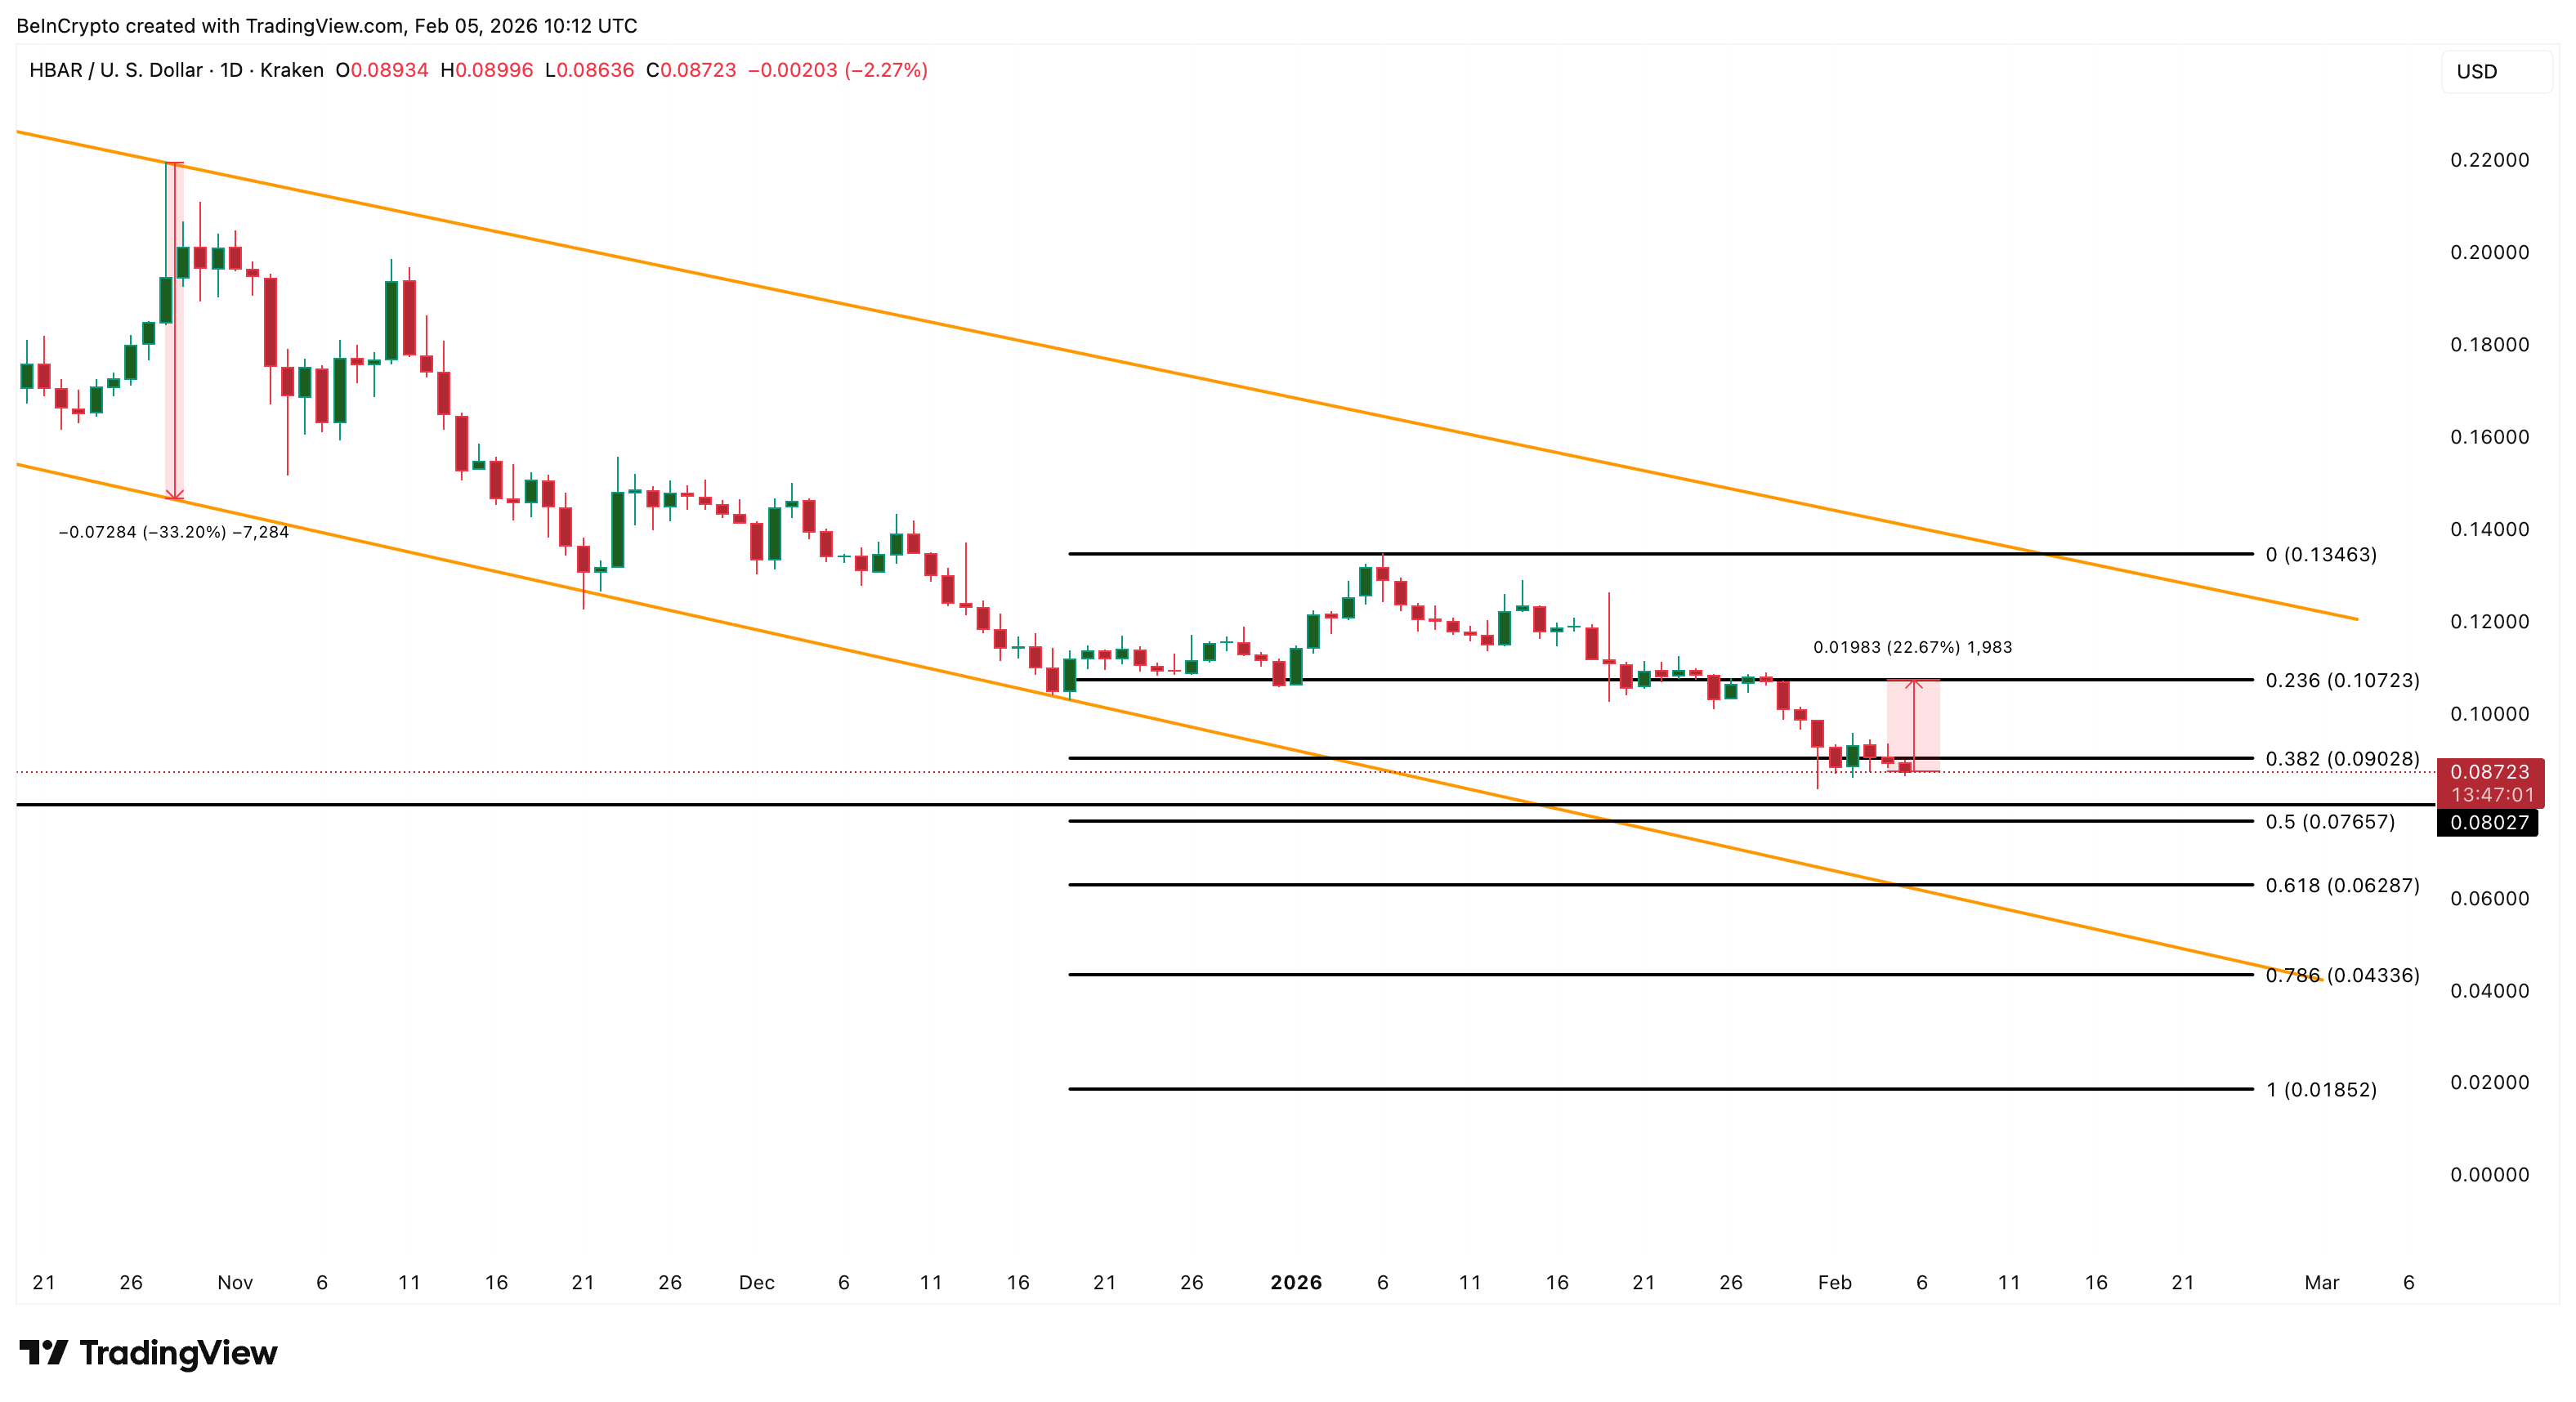
Bitcoin’s mining difficulty fell by around 7.7% at the latest adjustment on March 20 to 133.79 trillion at block 941,472, the sharpest drop since February, according to CoinWarz data.
The latest move takes difficulty down from around 145 trillion in mid-March and roughly 148 trillion at the start of the year. A lower difficulty means it takes less computational work to earn the same block reward, slightly improving revenue per unit of hashrate for firms that stay online.
The adjustment followed slower-than-target block production over the prior 2,016 blocks. CloverPool data showed average block times at about 12 minutes 36 seconds, well above Bitcoin’s 10-minute target, forcing the network to recalibrate lower.
In February, difficulty dropped sharply after weather-related disruptions in the United States temporarily knocked large American mining facilities offline, and it later rebounded by about 15% as hashrate returned to the network once power conditions normalized.
Bitcoin (BTC) difficulty measures how hard it is for miners to find a valid hash for the next block and is automatically adjusted to keep issuance steady at one block every 10 minutes.
When more computing power, or hashrate, joins the network, difficulty rises to prevent blocks from being mined too quickly, while a decline in hashrate triggers a lower difficulty, making it easier for remaining miners to earn rewards.

Related: Cango reports $285M Q4 loss as Bitcoin mining costs surge in 2025
The next difficulty adjustment is currently estimated for April 3, though that projection changes with each new block.
Miners pivot to AI as power costs bite
The difficulty reset also comes as several listed miners push further into AI and high-performance computing infrastructure in search of steadier returns on power and data-center capacity.
Last week, crypto trader Ran Neuner argued AI had become Bitcoin mining’s biggest competitor as both industries compete for electricity, even going as far as to say that “AI has killed Bitcoin forever.”
Bitcoin miners such as Core Scientific, MARA Holdings, Hut 8 and Cipher Mining have begun reallocating capacity or pivoting toward AI workloads, while some operators have reduced hashrate or shut down less efficient rigs as profitability tightens.
On Feb 21, Bitdeer liquidated 943 BTC from reserves and sold newly mined coins, cutting corporate holdings to zero. In its latest weekly update on March 21, it confirmed that its BTC holdings remained at zero.
Big questions: Would Bitcoin survive a 10-year power outage?


Former FTX CEO Sam Bankman-Fried, who is currently serving a 25-year sentence for fraud, has renewed public praise of U.S. President Donald Trump, adding to speculation that he hopes to secure a pardon.
In a recent post on X, written through a proxy using prison-approved communications, Bankman-Fried backed Trump’s decision to launch strikes against Iran. He framed the move as necessary to counter nuclear risk and claimed the operation had sharply reduced Iran’s military capacity.
The comments mark his latest in a string of statements supportive of the U.S. president. In earlier posts, he pointed to lower gas prices under Trump than in the Biden era and in other countries. He also credited Trump with “saving” the SEC by replacing former chair Gary Gensler with Paul Atkins, arguing the shift eased pressure on crypto firms and reduced inter-agency conflict.
The tone has drawn attention, given Bankman-Fried’s legal position. Presidential pardons have historically extended to financial crimes, and Trump has shown a willingness to grant clemency in high-profile cases. Ross Ulbricht, who operated a digital black market platform called Silk Road, was sentenced to life in prison without the possibility of parole in 2015 before Trump freed him shortly after being sworn in in 2025. For Bankman-Fried, whose conviction stemmed from one of the largest financial collapses in crypto history, public alignment with the president may serve a clear purpose.
His outreach comes as the remnants of his former empire continue to unwind. Earlier this week, the FTX Recovery Trust said it will distribute about $2.2 billion to creditors as part of an ongoing Chapter 11 process, pushing recovery rates close to full repayment for many claim classes.
Still, the damage from FTX’s collapse runs deep. Millions of customers lost access to funds in 2022, and the event shook trust in crypto markets. Prices fell, firms failed, and regulators stepped in with tighter scrutiny. The case remains a reference point for risk in the industry.
Bankman-Fried’s praise of Trump’s Iran policy lands as that decision faces growing criticism, with some warning the conflict could strain public finances and disrupt global oil supply, as well as concerns about inflation and higher costs for households and businesses.
For now, Bankman-Fried remains behind bars, communicating through intermediaries while his former company repays creditors. His lawyers filed a motion for a new trial in February, which the government opposed. His public messaging, however, suggests he is trying to shape an outcome beyond the courtroom.


The Hong Kong Police Cyber Crime Bureau has issued a warning after a 66-year-old retired man fell victim to three separate cryptocurrency scams.
Summary
- A Hong Kong senior loses HK$6.6M in three separate cryptocurrency scams.
- Police warn against transferring money or crypto to strangers to avoid fraud.
- Fraudsters impersonating experts tricked the victim into losing all his savings.
In total, the elderly victim lost HK$6.6 million after being misled by fraudsters posing as cryptocurrency experts, according to local reports.
In September 2025, the victim received a WhatsApp message from a fraudster claiming to be a cryptocurrency investment expert. The scammer promised guaranteed profits and offered to teach the victim how to invest in cryptocurrencies.
Trusting the individual, the elderly man handed over HK$1.4 million. After the cryptocurrency was deposited into the fraudster’s account, the scammer vanished. Realizing he had been deceived, the victim reported the incident to the police.
Not willing to give up, the victim went online to seek help from another “cryptocurrency expert” to recover his losses. The new fraudster reassured the victim that recovery was possible, but demanded 600,000 yuan as a deposit. Once the victim transferred the money, the so-called expert disappeared as well, and the victim realized he had been scammed a second time.
In January of this year, the victim was contacted by another fraudster claiming to be able to recover his previous losses. This time, the fraudster insisted that the victim purchase 4.6 million yuan worth of cryptocurrency and deposit it into a designated account. As with the previous scams, the fraudster disappeared after the victim complied. At this point, the elderly man had lost his entire life savings to scammers.
Police Warning and Advice
The police are urging citizens to be cautious and avoid transferring money or cryptocurrency to strangers. They emphasize that no one can guarantee to recover losses, and any offer that promises guaranteed returns or insider information is likely a scam. If someone offers to help recover funds after a previous scam, it is likely part of a serial fraud scheme.
Additionally, the FBI has issued a warning about fake tokens on the Tron blockchain impersonating the agency. Scammers are using these fake tokens to trick users into providing personal information under the false pretense that their wallets are under investigation.

Key takeaways
On-chain activity and the ETH exposure narrative
ETF flows, price backdrop, and what they signal
Bitmine’s conviction, DeMark signals, and the long arc of ETH
RLUSD Supply Adjustments and Treasury Activity
Ripple executed the latest burn through its treasury wallet, permanently removing nine million RLUSD tokens from circulation. Consequently, the move reduced the available supply and followed earlier large-scale burns during the same month. The action forms part of routine supply management tied to redemptions and liquidity balancing.
Earlier in March, Ripple eliminated twenty-five million RLUSD on the Ethereum blockchain through a similar treasury operation. Moreover, the firm conducted another ten million token burn on the XRP Ledger before this latest adjustment. These consecutive reductions indicate active oversight of the circulating supply across multiple blockchain networks.
🔥🔥🔥🔥🔥🔥 9,000,000 #RLUSD burned at RLUSD Treasury.https://t.co/3K4NW7GKCE
— Ripple Stablecoin Tracker (@RL_Tracker) March 20, 2026
Stablecoin issuers typically burn tokens when users redeem assets or when reserves require rebalancing. Therefore, Ripple maintains a one-to-one backing model by aligning supply with underlying reserves. This approach supports transparency and ensures compliance with audit expectations tied to regulated stablecoins.
RLUSD Market Growth and Slowing Momentum
RLUSD has recorded steady adoption since its launch in December 2024, supported by rising transaction volumes and integrations. Currently, the stablecoin holds a market capitalization of nearly 1.5 billion dollars with notable daily trading activity. However, continued burns have slowed the pace of net supply expansion despite earlier rapid growth.
Market participants had anticipated a quicker move toward the two billion supply level based on early adoption trends. Additionally, integrations with major financial institutions contributed to expectations of accelerated issuance and broader usage. Yet, the recent sequence of burns has offset minting activity and tempered that trajectory.
Despite slower growth, RLUSD maintains consistent demand across payment channels and institutional use cases. Moreover, transaction data shows ongoing utility rather than speculative accumulation driving activity. This pattern reflects stable adoption dynamics even as total supply growth stabilizes.
XRP Ledger Role and Institutional Context
The XRP Ledger continues to support RLUSD issuance and settlement alongside Ethereum-based operations. Consequently, Ripple uses multiple networks to distribute supply and manage cross-chain liquidity efficiently. This structure allows flexibility while maintaining consistent reserve backing across platforms.
Institutional integrations have played a key role in RLUSD adoption, especially within cross-border payment systems. Furthermore, partnerships with financial entities have increased transaction throughput and strengthened real-world usage. These developments contribute to steady demand, even as treasury burns adjust the circulating supply.
Ripple’s approach shows controlled supply management rather than unchecked expansion of its stablecoin ecosystem. Therefore, the firm balances minting and burning to reflect actual usage patterns and reserve requirements. This method supports long-term stability and aligns RLUSD growth with measurable demand conditions.

The crypto market recovered today as Bitcoin climbed back above $71,000 after recent losses. The broader market cap rose to $2.42 trillion, supported by derivatives activity. However, macro pressure and weak sentiment continue to shape short-term direction.
Key Highlights
- Bitcoin rebounds to $71K after major options expiry boosts momentum
- Ethereum struggles near $2.1K despite short-term institutional support
- XRP holds firm as retail demand offsets weaker institutional flows
- Crypto market cap climbs to $2.42T amid volatile macro backdrop
- Analysts warn of short-term rallies but highlight ongoing downside risks
⚡️ Bitcoin back above $71K.
Ethereum reclaims $2K — strength returning across the market.Momentum is building again. 🚀$BTC $ETH pic.twitter.com/vhMtAGvElD
— Nehal (@nehalzzzz1) March 20, 2026
Bitcoin Holds Above $71K as Options Expiry Drives Momentum
Bitcoin price trades near $71,000 after rebounding from post-FOMC lows earlier this week. The recovery follows the expiry of $1.7 billion in BTC options. This expiry event aligned with a max pain level near $70,000, supporting upward movement.
Moreover, implied volatility has increased, which signals rising short-term bullish sentiment. At the same time, traders reduced demand for downside protection, which reflects improved confidence. However, positioning remains tactical as the next quarterly expiry approaches.
Meanwhile, macro conditions continue to influence price action, as delayed rate cuts weigh on sentiment. ETF outflows have also added pressure in recent sessions. Still, strong support from institutional and derivatives traders has helped stabilize Bitcoin.
Ethereum Struggles Near $2,100 Despite Institutional Activity
Ethereum price trades around $2,150 after holding a key support zone near $2,100. The asset rebounded slightly after options worth nearly $380 million expired. However, the put-to-call ratio near 1.02 indicates balanced sentiment.
At the same time, implied volatility continues to rise, which suggests expectations of near-term price swings. Institutional accumulation has supported Ethereum, yet momentum remains weak compared to Bitcoin. This reflects ongoing uncertainty in broader market conditions.
In addition, macro risks and lower institutional demand continue to limit upside potential. Analysts expect Ethereum could retest levels below $2,100 if pressure builds again. Therefore, the current rebound appears fragile despite temporary support.
XRP Maintains Strength as Retail Demand Supports Price
XRP price holds near $1.40 as steady retail demand supports its recent performance. The asset shows resilience despite weaker institutional participation. Expanding utility also contributes to its relative stability in the current market cycle.
Furthermore, analysts expect XRP could rise toward $1.50 in the short term. This outlook depends on continued demand and stable market conditions. However, broader uncertainty could still limit sustained upward movement.
At the same time, market dynamics continue to shift as traders adjust positions. Altcoins, including XRP, may benefit from declining Bitcoin dominance. Yet, analysts warn that sudden reversals could trigger repeated stop-outs for short-term traders.
Macro Trends and Oil Markets Shape Crypto Sentiment
Global macro developments continue to influence crypto market direction. Oil prices have declined after signals of increased supply and reduced geopolitical escalation. This has improved risk sentiment across financial markets.
Additionally, policy discussions around Iranian oil sanctions have contributed to price declines. However, supply risks remain, as disruptions could push oil prices significantly higher. This uncertainty continues to affect broader market stability.
As a result, crypto assets remain sensitive to external economic signals. While the current rebound reflects short-term relief, underlying risks persist. Therefore, market participants continue to adjust strategies based on evolving conditions.


The cryptocurrency market has experienced a slowdown in the past 24 hours, with Bitcoin’s price showing little movement. As of now, Bitcoin (BTC) trades within a narrow range, oscillating between $69,500 and $70,600.
Summary
- Bitcoin stabilizes around $70K after volatility, with a minor correction from earlier highs.
- Altcoins show minimal price changes, with most trading within a narrow range.
- Market uncertainty persists amid rising geopolitical tensions, with Bitcoin driving altcoin performance.
Meanwhile, this is after a week of high volatility and substantial liquidations in the derivatives market. The altcoin market also reflects a similar lack of significant price action, suggesting a calm period before potential price shifts.
Bitcoin’s price has been relatively stable around $70,000 following a week of intense volatility. At the time of writing, Bitcoin is closer to $71,000, but the market volume has slowed down as expected for the weekend. Earlier in the week, BTC surged past $76,000 but has since corrected by nearly 10%.
This price drop is partly attributed to ongoing geopolitical tensions, particularly the conflict between the US, Israel, and Iran. Rising oil prices and inflation fears have added to the uncertainty, leading to a broader market correction. The risk-on markets, including crypto, have experienced a downturn, and the future direction of Bitcoin’s price may depend heavily on the resolution of these global issues.
Altcoin market shows minimal movement
The altcoin market has shown minimal price changes over the past 24 hours. Most cryptocurrencies have remained within a narrow range, with price fluctuations generally between -1% and +1%.
Some altcoins, such as WLFI, have shown modest gains of over 4%, but these are exceptions and do not suggest sustained upward momentum. The broader market remains cautious, with little to suggest that a breakout in altcoins is imminent. In the current market conditions, the altcoins’ performance is largely influenced by Bitcoin’s price movements.
Disclosure: This article does not represent investment advice. The content and materials featured on this page are for educational purposes only.
BlackRock has moved a fresh batch of Bitcoin and Ethereum to Coinbase Prime, totaling over $140 million in value. The transfers follow recent ETF outflows and weaker price momentum across major crypto assets. The activity adds pressure to a market that has already shown signs of slowing institutional demand.
Bitcoin Transfers Reflect ETF Pressure
BlackRock transferred 544 Bitcoin to Coinbase Prime as ETF outflows increased across the sector. The transaction aligns with recent declines in ETF inflows and softer price action. Additionally, Bitcoin has struggled to maintain upward momentum after its recent rally.
BlackRock just deposited 47,728 $ETH($102.13M) and 544 $BTC($38.3M) to Coinbase Prime.https://t.co/qmuDIrPHc6 pic.twitter.com/kmqXk3XzEx
— Lookonchain (@lookonchain) March 20, 2026
Data shows that the transferred Bitcoin is worth about $38.3 million at current market prices. The movement links directly to wallets associated with BlackRock’s IBIT Bitcoin ETF. Consequently, the transfer suggests a response to redemption activity within the fund.
Bitcoin ETFs recorded continued outflows over two consecutive sessions, with total withdrawals exceeding $90 million. This trend follows a period of strong inflows earlier in the quarter. However, the current slowdown reflects reduced demand at higher price levels.
Ethereum Movement Signals Liquidity Shift
BlackRock also transferred 47,728 Ethereum tokens to Coinbase Prime during the same transaction window. The Ethereum portion accounted for approximately $102.13 million of the total transfer. Moreover, the scale of the movement highlights significant liquidity repositioning.
The transferred Ethereum originates from wallets tied to BlackRock’s ETHA Ethereum ETF. This connection indicates that ETF-related flows continue to influence on-chain activity. Hence, the movement may reflect adjustments to meet redemption or trading requirements.
Ethereum has faced uneven performance despite broader market recovery attempts in recent weeks. Price action remains sensitive to both ETF flows and macro sentiment. Additionally, large transfers often increase short-term volatility expectations in the market.
Market Context and Institutional Positioning
BlackRock continues to dominate both Bitcoin and Ethereum ETF markets despite recent outflows. The firm relies on Coinbase Prime for custody and execution of its crypto transactions. Therefore, transfers to the platform often signal preparation for trading activity.
Market participants interpret the latest deposits in different ways, depending on broader sentiment. Some view the transfers as preparation for asset sales following ETF withdrawals. However, others consider the possibility of liquidity setup for future positioning.
The broader crypto market has shown reduced momentum as Bitcoin trades near the $70,000 level. This price range has acted as a resistance zone after the recent rally phase. Consequently, large institutional flows now play a more visible role in shaping direction.

Institutional demand for digital assets remains resilient even as markets endure ongoing turbulence. New data show that large investors are preparing to increase allocations despite a sharp sell-off since October, signaling that institutions see crypto as part of a diversified, regulated portfolio rather than a short-term trade. In parallel, stablecoins are expanding their footprint beyond trading floors into regulated financial channels, with Japan moving forward on regulated USDC lending products and new models tying digital assets to real-world assets taking shape. At the same time, traditional capital markets are increasingly a venue for crypto enterprises, as Abra pursues Nasdaq listing plans via a SPAC merger. Taken together, these developments suggest a crypto market that continues to mature through regulated, compliant pathways even as volatility and policy questions persist.
On the investor side, sentiment remains constructive. A January survey of 351 investors conducted with Coinbase and EY-Parthenon found that a majority plan to increase their digital asset exposure this year, with 73% indicating they would buy more and 74% expecting price Appreciation over the next 12 months. Bitcoin and Ether continue to anchor entry points for many, but interest is widening into stablecoins and tokenized assets. Notably, roughly two-thirds of respondents expressed a preference for gaining exposure via regulated vehicles, such as exchange-traded products, underscoring a demand for structures that blend crypto access with traditional oversight.
Key takeaways
- Institutional appetite for crypto persists despite volatility: a January survey found 73% of respondents plan to buy more digital assets this year, with 74% anticipating higher prices over the next 12 months.
- Regulated access remains central: two-thirds favor exposure through regulated vehicles like exchange-traded products, signaling a continued shift toward compliant crypto investment avenues.
- Japan expands regulated USDC use: SBI’s USDC lending efforts illustrate a move beyond trading into retail-friendly, regulated stablecoin products in a mature market.
- Crypto firms press for public-market access: Abra is pursuing Nasdaq listing via a SPAC merger, reflecting a broader interest in traditional capital markets amid uneven IPO activity.
- Real-world assets enter yield-enabled crypto models: Theo launches a $100 million gold-linked yield stablecoin vault, a sign that asset-backed and yield-bearing structures are becoming more mainstream.
Institutional demand endures amid volatility
Despite a broad crypto market trough since October, institutional investors appear undeterred about the medium-term trajectory. The Coinbase–EY-Parthenon survey paints a picture of continued capital deployment into digital assets, with participants signaling readiness to scale exposure even as price volatility remains a defining feature of the current cycle. While BTC and ETH remain the core entry points, institutions are increasingly exploring stablecoins and tokenized collateral as part of diversified portfolios. A notable share also indicates a preference for regulated vehicles—such as exchange-traded products—as a preferred channel for gaining crypto exposure—an indicator that risk controls and governance frameworks are expected to accompany future inflows.
The persistence of institutional demand matters for several reasons. First, it helps sustain liquidity and depth in established markets, even when spot prices swing. Second, it accelerates the adoption curve for regulated products and custodial solutions that can meet more conservative risk profiles. Finally, it supports longer-term price discovery that is anchored in institutional participation rather than speculative retail flows alone. As this dynamic unfolds, market participants will be watching how custody, compliance, and reporting standards evolve to accommodate an increasingly diversified investor base.
Japan advances regulated USDC lending and stablecoin use
In Japan, the regulated pathway for stablecoins is expanding beyond trading desks. SBI’s Vic Trade arm has moved forward with a retail USDC lending service, a development that aligns with regulatory clarity already established for Circle’s USDC in the country. The platform will let users lend USDC in exchange for yield, marking one of the first retail-facing products of its kind in Japan and signaling broader institutional confidence in dollar-backed tokens within a controlled framework. The move comes as licensed players gain greater scope to offer regulated stablecoin services, illustrating how formal regulatory acceptance can catalyze new onramps and product segments for both individuals and institutions.
Japan’s approach reinforces a broader pattern: stablecoins are moving from pure trading tools toward regulated financial products that can fit into everyday financial activity. This transition could influence global standards, as other jurisdictions consider how to balance innovation with consumer protection, tax treatment, and cross-border settlement efficiency. For investors, the development widens the menu of regulated entry points into crypto, potentially improving risk parity for diversified portfolios that include stablecoin yield strategies alongside traditional equities and bonds.
Abra eyes Nasdaq through SPAC amid IPO market ebbs and flows
Abra, a long-running crypto wealth manager, is pursuing a public listing via a merger with New Providence Acquisition Corp., a move that would place the combined company on Nasdaq under the ticker ABRX. The deal values the merged entity at approximately $750 million, reflecting a shift in Abra’s focus toward wealth management services—trading, custody, and yield products—after regulatory constraints constrained its earlier lending operations. The SPAC route provides a faster path to public markets in an environment where traditional IPO activity remains tepid, underscoring a continuing willingness among crypto firms to access public capital through alternative routes when regulatory and market conditions are uncertain.
The Abra strategy highlights a broader trend: crypto firms are increasingly pursuing traditional capital markets access as a means to scale and signal legitimacy, even as scrutiny from regulators remains intense. While SPACs can offer speed, they also bring ongoing governance and disclosure expectations that could shape Abra’s strategy in the coming years. Investors will be watching how the company harmonizes its wealth-management-centric model with the transparency and investor protections demanded by public markets, as well as how it navigates evolving digital-asset custody and compliance benchmarks.
Theo introduces gold-backed yield innovation
Theo, a tokenization platform, unveiled a new $100 million vault tied to a gold-backed, yield-bearing stablecoin. The product combines traditional commodity backing with on-chain financial mechanics to deliver price stability alongside yield opportunities. In this hybrid model, gold serves as the collateral underpinning the token’s value, offering an alternative to fiat-backed stablecoins while expanding the range of on-chain income strategies for users. The vault represents a growing wave of experimentation with yield-bearing stablecoins that move beyond simple price stability, exploring how real-world assets and yield-generation can coexist within a regulated, on-chain framework.
Such innovations underscore a broader industry push to bring real-world collateral and cash-flow mechanics into the crypto ecosystem. As platforms experiment with different collateral mixes and automated yield strategies, investors gain access to a wider set of risk-and-reward profiles. Observers will want to monitor how gold-backed models perform in practice, how liquidity and valuation are maintained across stressed market scenarios, and how regulators respond to asset-backed stablecoins that blur the lines between traditional financial products and crypto innovations.
Looking ahead, the momentum across institutions, regulated stablecoins, public-market access, and yield-focused innovations suggests a crypto landscape that is maturing through structured, compliant channels. Market participants should keep a close eye on regulatory developments in key jurisdictions, the rollout of retail products in regulated markets, and the continued evolution of asset-backed and tokenized yield vehicles as potential catalysts for broader adoption and more diverse investment strategies.
World Open: Ronnie O’Sullivan beats Wu Yize in decider to reach final

Expert Calls for ‘No-Body Homicide’ Approach as Search Continues
Robert Pattinson once got in trouble as a kid for lying and saying his dad was Michael Jackson


-

 Tech6 days ago
Your Legally Registered ‘Motorcycle’ Might Not Count Under Proposed US Law
-

 Politics19 hours ago
Jenni Murray, Long-Serving Woman’s Hour Presenter, Dies Aged 75
-
 Tech4 days ago
Are Split Spacebars the Next Big Gaming Keyboard Trend?
-

 Fashion19 hours ago
Weekend Open Thread: Adidas – Corporette.com
-
Sports7 days ago
Why Duke and Michigan Are Dead Even Entering Selection Sunday
-

 Business6 days ago
Search for Savannah Guthrie’s Mother Enters Seventh Week with No Arrests
-
 Crypto World7 days ago
Coinbase and Bybit in Investment Talks: Could Bybit Finally Enter the US Crypto Market?
-

 News Videos3 days ago
RBA board divided on rate cut, unusually buoyant share market | Finance Report | ABC NEWS
-
 Crypto World14 hours ago
NIO (NIO) Stock Plunges 6.5% as Shelf Registration Sparks Dilution Worries
-

 Business5 days ago
Australian shares drop as Iran war enters third week
-

 Crypto World5 days ago
Crypto Lender BlockFills Enters Chapter 11 with Up to $500M in Liabilities
-

 Politics3 days ago
The House | The new register to protect children from their abusers shows Parliament at its best
-

 Fashion5 days ago
25 Celebrities with Curly Hair That Are Naturally Beautiful
-

 Tech1 day ago
inKONBINI Lets You Spend Summer Days Behind the Register
-

 Crypto World3 days ago
Canada’s FINTRAC revokes registrations of 23 crypto MSBs in AML crackdown
-
 Politics4 days ago
Real-time pollution monitoring calls after boy nearly dies
-

 Crypto World7 days ago
Crypto Losses Drop 87% in February, But Hackers Are Now Targeting People, Not Code
-
 NewsBeat3 days ago
Residents in North Lanarkshire reminded to register to vote in Scottish Parliament Election
-

 Business5 days ago
Meta planning major layoffs as AI spending and automation reshape workforce
-

 News Videos3 days ago
PARLIAMENT OF MALAWI – PAC MEETING WITH REGISTRAR OF FINANCIAL ON AMARYLLIS HOTEL – INQUIRY LIVE


You must be logged in to post a comment Login