
Crypto World
Inside HYPE’s bear market resilience


The crypto bear market has dragged down most major digital assets this year, but HYPE has moved in the opposite direction. Year to date, the token is up 23.9%, matching gold’s gain over the same period. The S&P 500 is slightly negative, while bitcoin has fallen 23.7% and ether more than 33%.
The divergence is notable not only because HYPE is crypto-native, but because it has decoupled from the broader digital asset market. Its performance increasingly reflects the value of the platform behind it rather than the market’s direction.
HyperLiquid, the decentralized derivatives exchange that underpins HYPE, is built to monetize activity rather than price appreciation. In bull markets, capital tends to concentrate in spot exposure. In choppier conditions marked by drawdowns and macro shocks, derivatives volume tends to persist. Traders shift from buying to positioning, and the platform collects fees on both sides.
While trading volume on competitor platforms Aster and Lighter has tumbled in recent months, HyperLiquid’s has increased, rising from $169 billion in December to more than $200 billion for both January and February. Aster, meanwhile, went from $177 billion in December to less than $100 billion in February, with Lighter suffering an even sharper drop, DefiLlama data shows.
Total volume on HyperLiquid since its inception has now hit a whopping $4 trillion.
Volatility as a business model
HyperLiquid’s core product is perpetual futures, which allow traders to go long or short with leverage. When prices grind higher, leverage amplifies upside. When markets slide, shorting and basis trades step in. The exchange collects fees on both sides.
That structure becomes particularly relevant in a year marked by turbulence across asset classes. Rather than relying on sustained price appreciation, the exchange captures turnover. In sideways or declining markets, traders often increase frequency, hedge exposure, or rotate into relative-value strategies. Activity replaces direction as the primary driver.
And that business model has yielded positive results. Gross protocol revenue grew by 96% in Q3 of 2025 to $354 million, with the fourth-quarter total hitting $286 million, the majority of which came from perpetual trading fees.
That revenue comes from a super-lean team of fewer than 15 employees, with half focused on engineering. HyperLiquid founder Jeff Yan has also refused investment from venture capitalists to maintain independence – a bold approach uncommon in the crypto industry.
Trading beyond market hours
More recently, HyperLiquid has expanded beyond crypto-native pairs. It now offers synthetic exposure to foreign exchange, commodities and major equity indices. It also provides weekend trading for U.S. equities, an innovation that resonates with retail traders accustomed to crypto’s round-the-clock rhythm.
For a generation raised on app-based brokerage platforms, the traditional market calendar feels restrictive. As seen over the past weekend, geopolitical escalations often land outside the typical weekday trading window. HyperLiquid’s structure allows traders to react in real time rather than wait for Monday’s open.
HyperLiquid’s silver market has also been a resounding success with trading volume nearing $750 million over a recent 24-hour trading period despite traditional markets being closed for the majority of Sunday.
The exchange has also introduced pre-IPO perpetual markets tied to companies such as Anthropic, OpenAI and SpaceX. These instruments are synthetic and do not confer equity ownership, but they offer directional exposure to private companies. In effect, they create a parallel venue for price discovery among retail participants otherwise excluded from late-stage venture valuations.
The product FTX tried to build
The model carries echoes of an earlier vision. FTX pitched 24-hour trading, tokenized equities and seamless leverage across asset classes. Its collapse stemmed from custody risk, shoddy balance-sheet practices, and the commingling of funds.
HyperLiquid operates on a non-custodial framework, with on-chain settlement and transparent vault mechanics. Users interact with smart contracts rather than deposit funds into a centralized entity’s balance sheet. In a post-FTX landscape, that distinction carries weight. Retail traders who absorbed losses from centralized failures remain sensitive to counterparty exposure.
HyperLiquid delivers many of the features once marketed by FTX, but through infrastructure designed to reduce reliance on a single custodian.
The exchange also leans into competition and gamification. Leaderboards prominently rank traders by performance, creating protagonists like James Wynn, who lost $100 million on HyperLiquid after engaging in a high-risk long-only trading strategy using leverage when bitcoin was above $100,000.
The mechanic encourages engagement. Traders can build reputations through short positions, market-neutral strategies or well-timed directional bets, and that creates a buzz on social media – effectively acting as a marketing vehicle even in volatile markets.
The centralization test
Claims that HyperLiquid is insulated from bear markets require context. One year ago, the protocol faced a credibility shock that raised questions about decentralization.
In April 2025, the total value locked in the Hyperliquidity Provider vault fell from $540 million to $150 million within a month. The trigger was a trading episode involving a token called JELLY. A trader opened a large short position on HyperLiquid while simultaneously buying the token on illiquid decentralized exchanges. Thin liquidity distorted price feeds and forced the vault into a toxic position via liquidation.
As JELLY’s reported price spiked to levels unsupported by deep liquidity, the vault’s unrealized losses mounted. HyperLiquid intervened, force-closing the market and settling JELLY at $0.0095 rather than the roughly $0.50 price being relayed by oracles. The decision protected the vault from substantial losses, but it ignited backlash.
Critics argued that a protocol marketed as decentralized had exercised discretionary control reminiscent of a centralized exchange. Governance optics deteriorated quickly. Yield on the vault fell sharply, and users withdrew capital.
Security researchers described the episode as an economic design flaw rather than a smart contract exploit. Jan Philipp Fritsche of Oak Security characterized it as unpriced vega risk, where leveraged exposure to volatile assets drained the risk fund in a predictable manner. The episode underscored that economic vulnerabilities can be as destabilizing as technical bugs.
HyperLiquid later modified its governance process, shifting asset delistings to an on-chain validator voting mechanism. The change did not eliminate scrutiny, but it addressed one of the central criticisms.
The vault has since recovered to $380 million in TVL, offering users a 6.93% APR.
Resilience through activity
Despite the controversy, trading volume on the exchange remained robust, and with competitors Aster and Lighter losing momentum, HyperLiquid is positioning itself as a mainstay in the ongoing cryptocurrency bear market.
Risks remain. Regulatory attention could intensify around synthetic exposure to private companies and U.S. equities. Liquidity fragmentation in thinner markets could resurface pricing distortions. Governance mechanisms will continue to be tested under stress.
Yet HYPE’s relative strength this year reflects a structural distinction. Rather than functioning as a high-beta bet on digital asset appreciation, it increasingly behaves like a claim on a venue that monetizes volatility.
In a cycle defined less by sustained rallies and more by sharp swings, that positioning has mattered.

Crypto World
Seven Methods for Finding and Closing AI Services Clients When You’re Starting from Zero Followers and Zero Case Studies

Host a Local AI Meetup
Business owners feel curious about AI but overwhelmed. They distrust strangers offering solutions. When you host a community event, you’re automatically positioned as the local authority.
Find free venues: libraries, coworking spaces, coffee shops with meeting areas. Create a simple event page. Post in local business groups and LinkedIn. Keep the format straightforward: a 20-minute presentation on how local businesses currently leverage AI, followed by questions.
Critical element: demonstrate something live. Open your computer. Show a workflow executing. Display a lead arriving and receiving an automatic response. When people witness value operating in real-time, the conversation fundamentally shifts.
Collect email addresses. Follow up within 24 hours. That becomes your pipeline.
Direct Outreach to Local Markets
Traditional. Proven. Underutilized. Walk into 10 local businesses this week: dental offices, real estate brokerages, law firms, contracting companies. Or send 20 LinkedIn messages daily to business owners managing 10-50 employees in your geography.
Don’t lead with your solution. Begin with diagnosis: what’s the most expensive bottleneck in your daily operations? Start conversations about their specific problems, not your services. Those who respond are self-selecting—they already know something requires fixing.
Withhold pitches in initial outreach. Understand their situation completely. Propose solutions mapped directly to their stated problems. This approach converts 3-5x more consistently than leading with I build AI automations.
The Speed-to-Response Diagnosis
This technique is exceptionally effective for speed-to-lead sales. Select a niche. Use Google to identify local businesses. Find ones with website contact forms. Submit test inquiries. Track response time.
Most respond after hours. Many after days. Some never respond. You’ve collected data. Now email them: I submitted an inquiry through your website 3 days ago. Still waiting. How many leads do you estimate you’re losing? I build systems responding within 60 seconds, 24/7.
This isn’t a cold pitch. It’s a diagnosis. You identified and quantified a problem, then offered a solution. Completely different conversation.
Free Discovery Audits
You know business owners: colleagues, acquaintances, former coworkers, gym contacts. Offer complimentary 20-minute audits. I’ll review your current processes and identify automation opportunities. No charge—I’m building my portfolio.
Yes, you’re working for free initially. But you gain practical experience, they receive legitimate value, and they’ll recommend you. The audit itself becomes your sales conversation. By its conclusion, you understand their problems better than they do. The proposal writes itself.
After establishing case studies, start charging for audits. The audit becomes a paid service.
Partner with Service Providers
Other service providers already possess your target clients. Marketing agencies, business coaches, accountants, web developers—they consult with business owners constantly. Many get asked about AI and lack confidence answering.
Approach them: I specialize in AI automation for small businesses. When your clients ask about AI, I’d appreciate being your referral partner. Happy to split revenue on closed deals. You just built a sales team without employment. In tight-knit industries, one solid partnership generates sustained pipeline.
The best partnerships are with providers whose services complement AI but aren’t competitive. Web developers, accountants, and business coaches all have hungry clients who need automation.
Coworking Community Office Hours
Contact local coworking spaces. Volunteer to host free weekly AI Office Hours for members. Two hours weekly. Members arrive with questions. You provide solutions on the spot.
You gain credibility as the resident AI expert, access to warm prospects who already trust you, and content fodder—every question becomes potential social media material. Most spaces accept because it adds member value. Paying clients develop naturally.
The implicit positioning is powerful: you’re the person who knows AI in this community. When someone needs help, they think of you first.
Consistent Social Documentation
Document every client success. Built a lead response system for an HVAC contractor. 2 hours setup. Now responds to every lead within 60 seconds. Automated appointment reminders for a dental practice. Reduced no-shows 40%. Runs entirely on autopilot.
You don’t need massive following. You need consistency. Post 3-5 times weekly for 90 days. Mix wins with educational content. The objective isn’t virality. It’s staying top-of-mind so when someone needs AI implementation, they think of you first.
Post everywhere: LinkedIn, Twitter, even TikTok or YouTube if that fits your style. Different platforms reach different people. Consistency matters more than platform choice.
Building Your Personal Sequencing
Start with methods 2 and 4: direct outreach and free audits. These generate first clients fastest with zero infrastructure required. You can start today.
Once you have case studies, add method 3: the speed-to-response diagnosis. This is most effective once you have a success story to reference.
As you establish credibility, layer in methods 1, 5, and 6. These take more setup but generate steady referrals.
Use method 7 throughout. Social documentation works best when you have wins to document, but you can start immediately.
Key Takeaways
- Bitcoin briefly surged to $71,200 after President Trump announced a five-day pause on strikes against Iran, pulling it further from the critical $65,000 liquidation zone.
- Over $400 million in crypto positions were liquidated within hours as markets swung sharply on conflicting headlines between Washington and Tehran.
- With BTC now hovering around $70,000, the $3 billion in long positions clustered below $65,000 remains a live threat as geopolitical uncertainty persists.
Bitcoin caught a brief but significant boost on Monday after U.S. President Donald Trump announced a five-day pause on military strikes targeting Iran’s energy infrastructure, describing the move as the result of “very good and productive” talks aimed at a complete resolution of hostilities. The announcement sent Bitcoin surging from $67,500 to above $71,200 within hours, temporarily widening the distance between BTC’s price and a critical $65,000 liquidation zone.
The move followed a weekend of geopolitical threats and a subsequent de-escalation, with broader asset classes and benchmark indices reacting together. For Bitcoin bulls sitting on leveraged positions, the rally offered a moment of relief.
Relief, Then Reversal
The rally did not hold. Iran’s Foreign Ministry denied any communication had taken place with the United States, framing the five-day suspension as a retreat rather than diplomacy. Bitcoin, shown at $70,464 in one snapshot, retreated to levels seen in early February after multiple failed attempts to convincingly surpass $75,000. The $400 million in liquidations indicates positions were both sizable and tightly clustered around optimistic breakouts toward $75,000. Bitcoin settled back around $70,000, although still above $65,000, but not a comfortable price level. Investors also weighed the potential impact on other risk assets.
The $3 Billion Risk Remains
Before Monday’s geopolitical headlines, Coinglass data had already flagged a dangerous build-up of over $3 billion in long positions concentrated below the $65,000 level across Binance, OKX, and Bybit. That exposure has not disappeared. Bitcoin has traded between $70,533 and $64,700 since early February, forming a tight range. Heavy liquidation clusters remain around $70,500 on the upside and $65,000 on the downside.
Analysts describe such concentrations as “liquidation magnets,” that is, price levels where a large volume of forced closures can compound selling pressure once breached. The October 10 event, which saw $19 billion wiped from the crypto market in a single day, followed a near-identical pattern of heavy leveraged build-up before a key level broke.
What Comes Next
As traders watch whether Bitcoin can reclaim $70,000 and fill the CME gap, one open question persists: will current liquidity and geopolitical developments allow BTC to return to breakout attempts near $75,000, or has this episode reset expectations for a lower, more volatile trading band?
For now, the Trump ceasefire announcement has bought the market some breathing room. But with Iran denying any talks and a break above $70,000 still needed to signal renewed bullish momentum toward $75,000.
🚨 ALERT: Over $3 billion in long positions risk liquidation if $BTC drops below $65,000. pic.twitter.com/EaiPNwDt1E
Silver price has retreated sharply in the last 48 hours, defying last week’s prediction and analysis of $200. While the metal had climbed 161% year-over-year from $33 area, recent sessions saw XAG/USD slump as real yields surged and the dollar strengthened, widening the gold-to-silver ratio toward a precarious 63:1.
This pullback comes despite supply constraints from imminent China export restrictions effective 2026, which many analysts expected to floor prices.

The market is currently wrestling with contradictory signals: safe-haven bids from geopolitical tensions versus industrial demand fears triggered by inflation. Is the structural deficit enough to hold the line? As silver price forecasts recalibrate for a “higher-for-longer” rate environment, traders are eyeing critical support levels that could define the trend through Q2.
Discover: The best pre-launch token sales
Silver Price Analysis: Can It Reclaim $100 Amid PPI Volatility?
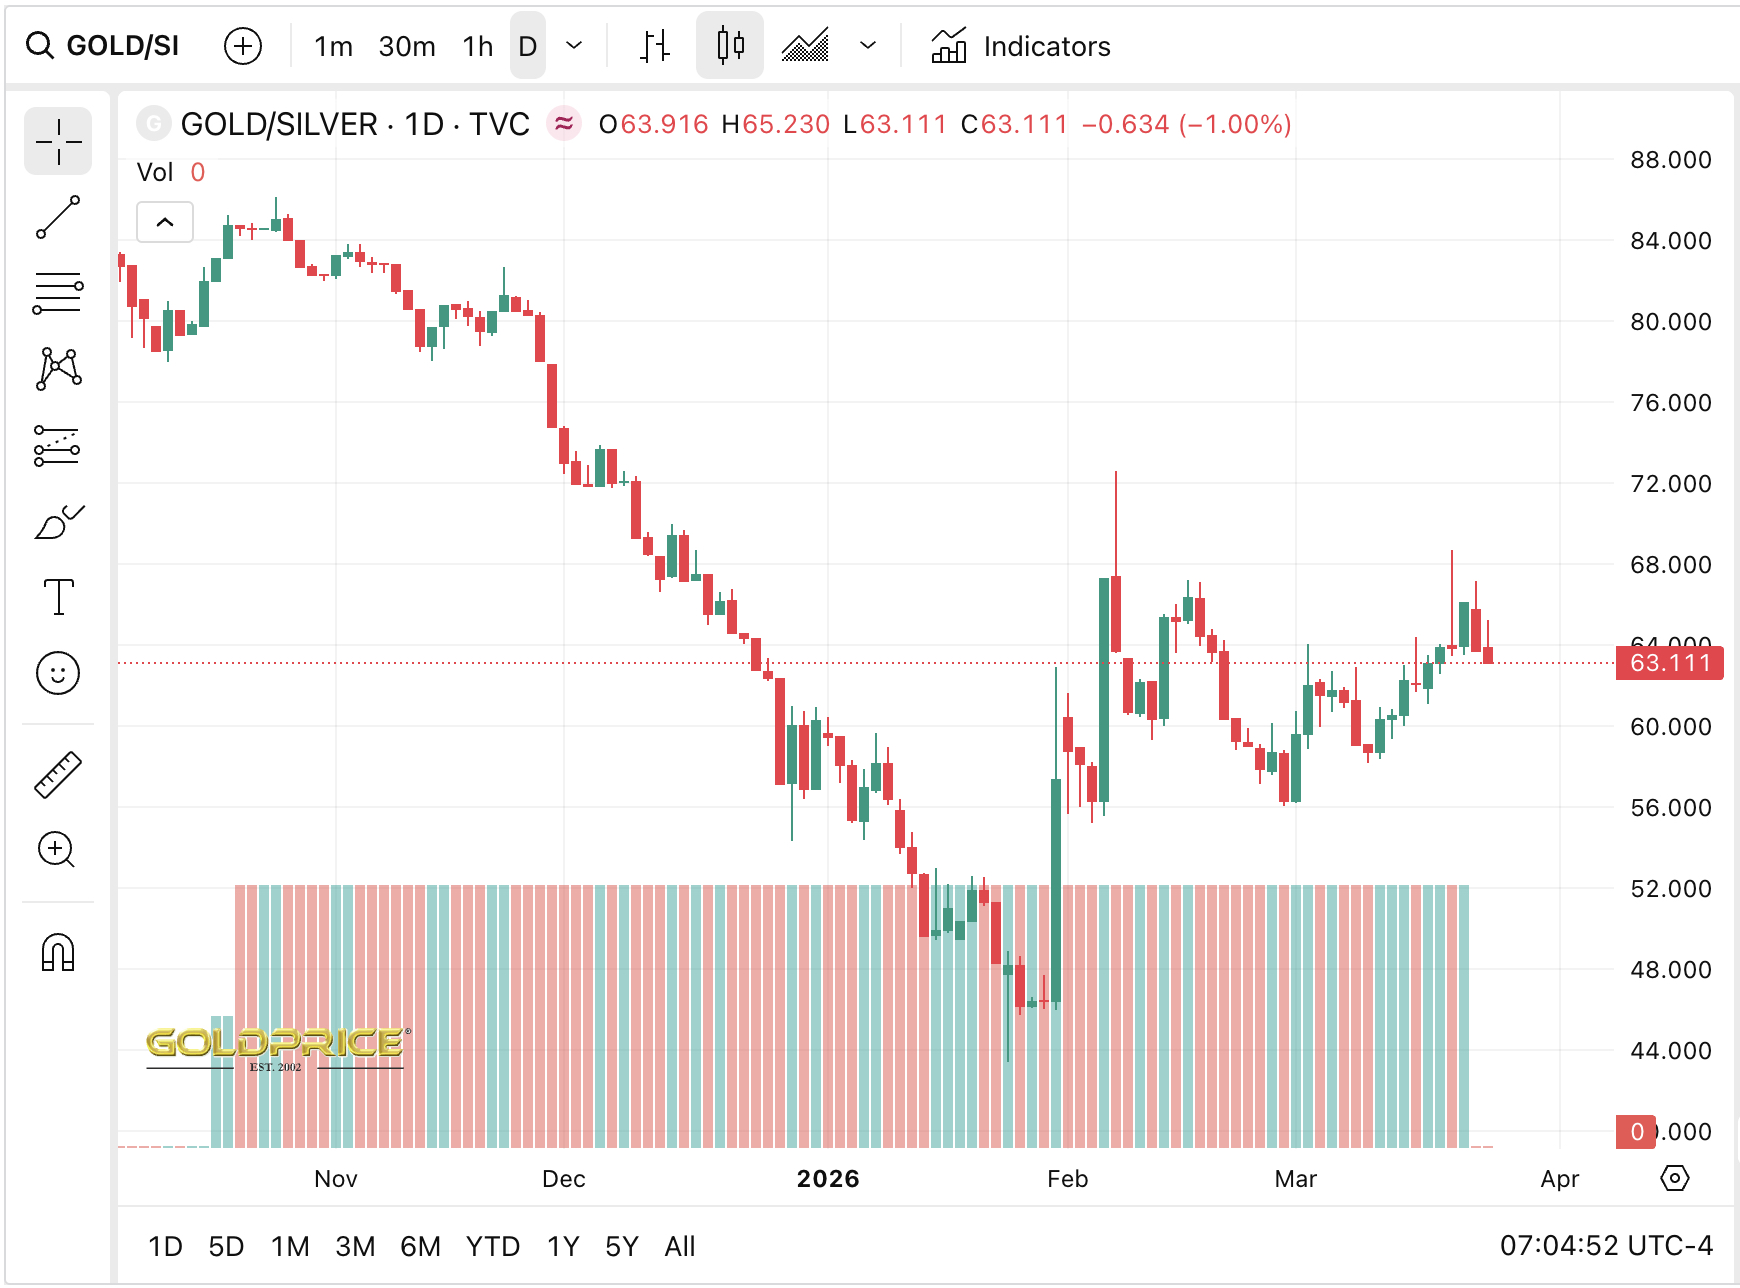
As of today, prior to the PPI shock, silver traded at $69 level. The metal is currently falling but might be hitting a bottom at the same time, testing the patience of bulls who bought near the January peak above $120.
Crucial support lies here, and a break below this level could expose the widely watched $58 magnet, a psychological floor for institutional accumulation. Conversely, reclaiming the $90 resistance is essential to target.

Institutional outlooks remain divergent, creating a complex landscape for position traders. While J.P. Morgan forecasts a conservative 2026 average of $81/oz, others are eyeing significantly higher ceilings. Bank of America has set a target of $135/oz by 2026, and aggressive models from analysts like Rashad Hajiyev point toward targets as high as $240–$260.
The disparity suggests that while short-term downside risks persist, the long-term supply deficit remains a potent catalyst for commodities investors willing to weather the volatility.
Discover: The best pre-launch token sales
LiquidChain Targets Early Mover Upside as Silver Consolidates
While silver arguably offers a safe hedge against currency debasement, its recent heavy price action highlights the limitations of commodities in a high-yield environment.
Capital seeking aggressive multipliers is increasingly rotating out of stagnant traditional assets and into infrastructure plays that solve fragmentation issues in the crypto economy. Enter LiquidChain ($LIQUID), a Layer 3 protocol gaining traction by unifying liquidity across Bitcoin, Ethereum, and Solana.
LiquidChain distinguishes itself with a “deploy-once” architecture, fusing the three largest ecosystems into a single execution environment. This effectively eliminates the friction of cross-chain bridging—a multi-billion dollar headache for developers.
The project is currently in a presale phase that has raised more than $600K at the moment. Early participants are securing tokens at $0.0143, and enjoying more than 1700% APY of staking rewards.
For those tired of waiting for silver to break $100, LiquidChain represents a high-beta pivot into the plumbing of the next bull cycle.
The LiquidChain presale is open now for investors researching unified liquidity layers.
Disclaimer: This article is not financial advice. Cryptocurrency and commodities markets are highly volatile. Do your own research before investing.
The post Silver Price Analysis: XAG to XAU Ratio Drops as Metals Fall appeared first on Cryptonews.


Hyperliquid’s HIP-3 market has reached a new high as demand for tokenized asset trading continues to grow.
Summary
- Hyperliquid HIP-3 open interest hit $1.74 billion after rising 25% in just one week overall.
- Tokenized oil and silver pairs led trading volume as Trade.xyz posted new activity records Monday.
- HYPE gained as Hyperliquid generated $14 million in weekly fees and expanded market products further.
Open interest across HIP-3 markets climbed to $1.74 billion on Sunday, up 25% from $1.39 billion a week earlier. The move shows rising activity in perpetual futures linked to tokenized traditional assets.
Aggregated open interest across Hyperliquid’s HIP-3 markets hit a record $1.74 billion on Sunday. By Monday, that figure eased slightly to $1.73 billion, but it still stayed near the platform’s peak level.
The rise extends the growth of Hyperliquid’s permissionless perpetual futures market for tokenized traditional assets. HIP-3 launched about six months ago, and it has quickly become one of the main areas of activity within the broader Hyperliquid ecosystem.
Trade.xyz remains the largest HIP-3 market platform. Built by Hyperliquid’s tokenization arm, Hyperunit, Trade.xyz accounts for $1.58 billion in open interest, or 91.3% of the total HIP-3 market.
That level of concentration shows how much of the current activity sits on one venue. It also shows that tokenized real-world asset trading is becoming a major part of the platform’s expansion.
Trade.xyz also posted new records in daily activity on Monday. The platform reported $5.6 billion in 24-hour trading volume and 45,300 unique daily traders.
The most active pairs on the platform are tied to tokenized traditional assets. WTI oil led with $1.27 billion in 24-hour volume, followed by Brent oil at $1.04 billion and silver at $1.01 billion.
This pattern shows that traders are using the platform to gain exposure to commodities through perpetual markets. The product allows them to trade these assets at any hour rather than waiting for standard market sessions.
That round-the-clock structure has become more relevant during periods of market stress. Recent tension in the Middle East increased volatility in oil prices, and that pushed more traders toward platforms offering “24/7 trading capability” for ongoing price discovery.
HYPE gains as ecosystem growth continues
Hyperliquid’s native token, HYPE, has also moved higher as activity on the platform increased. At the time of reporting, HYPE traded at $38.3, up 2.8% over the past 24 hours and 30.6% over the past 30 days.
The token’s move has come alongside rising platform revenue. As Crypto News reported, Hyperliquid is generating about $14 million in weekly fees, while some analysts say HYPE still trades below levels seen in comparable centralized exchange-style businesses.
The platform is also preparing for another product expansion. Hyperliquid recently introduced HIP-4, which would allow “permissionless prediction market listings” and could widen the range of tradable markets on the network.
Disclosure: This article does not represent investment advice. The content and materials featured on this page are for educational purposes only.
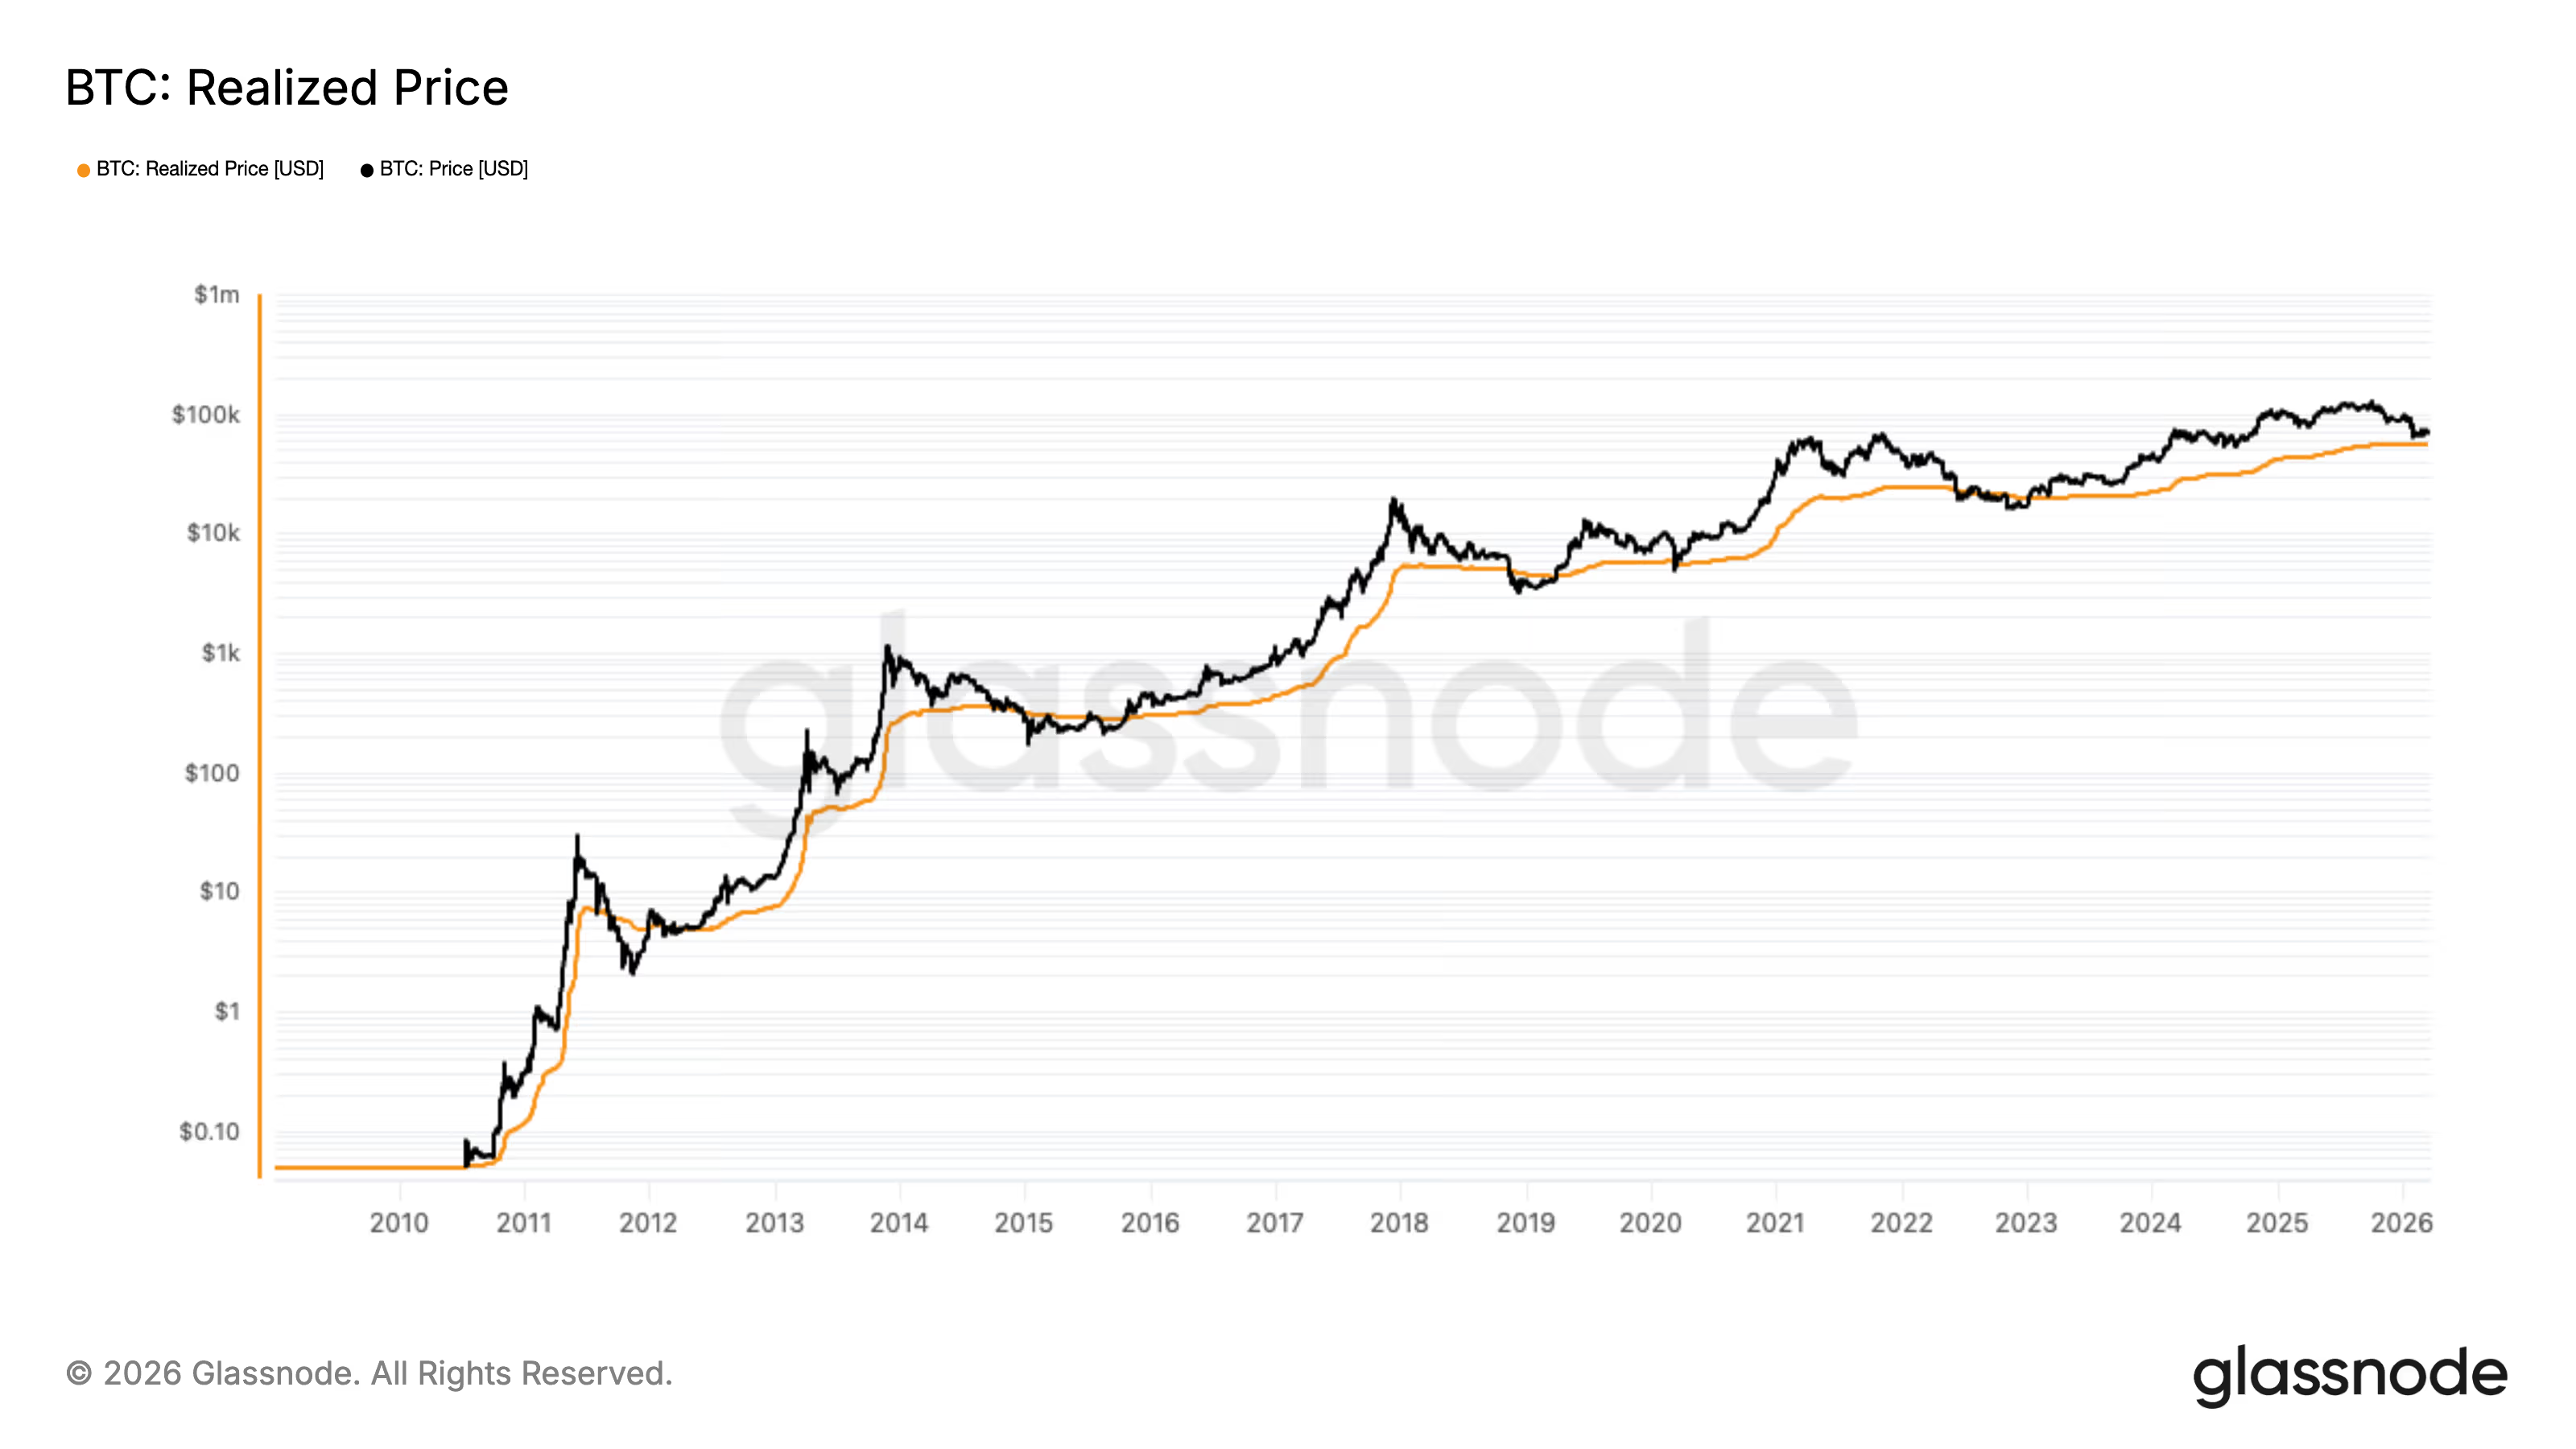
Bitcoin recently found support at a key onchain metric — the average realized price for a specific year — in this case the 2023 cost basis.
The 2023 average realized price currently sits around $63,700. During the local bottom in early February, when bitcoin dropped roughly 50% from its October all-time high, to roughly $60,000, price effectively tested and held this level as support.
This behavior mirrors the previous cycle. In early 2023, as the bull run began, bitcoin experienced several small corrections and repeatedly used the 2023 realized price as support. This can be observed in March, July, and September 2023, when price consolidated in the $20,000 to $26,000 range.
Looking at newer cohorts, the 2026 average realized price started the year near $90,000 and has since declined to around $77,000. With bitcoin currently trading just above $70,000, the average 2026 buyer is underwater. Notably, this cohort’s cost basis has also fallen below both the 2024 cohort at $81,500 and the 2025 cohort at $96,400.
Zooming out further, the aggregate realized price, which represents the average cost basis of all coins in circulation, is currently around $54,360. Historically, bitcoin has traded below this level in every major bear market, including 2011, 2015, 2019, and 2022.
So far in this cycle, bitcoin’s lowest price has been around $60,000. If that level fails, it becomes the next key support to watch, with the realized price at $54,000 acting as a deeper historical floor.


Key Highlights
-
Company achieves milestone profitability with RMB436M net income for 2025.
-
Unit deliveries surge to 1.6M, with projections surpassing 4M for 2026.
-
Partnerships with leading Chinese automakers drive multiple-lidar vehicle designs.
-
Robotics sector expansion accelerates through Unitree, Dreame, and MOVA alliances.
-
FMC500 chip launch and NVIDIA partnership advance technological capabilities.
Hesai Group (HSAI) experienced upward momentum, closing at $23.58 with a 3.19% increase. Trading activity pushed shares toward $23.80 before pre-market sessions revealed a decline to $22.57, representing a 4.28% drop. The fluctuation occurred after Hesai disclosed comprehensive 2025 earnings data and outlined production targets for 2026.
The company reached its inaugural year of GAAP-compliant profitability, propelled by robust sales performance and disciplined expense control. Unit deliveries expanded threefold beyond 1.6 million, generating total revenues that surpassed RMB3 billion (approximately US$433 million). Financial disclosures revealed GAAP net earnings of RMB436 million (roughly US$62 million) alongside non-GAAP earnings reaching RMB551 million (about US$79 million).
Balance sheet strength improved with net assets climbing to approximately RMB9 billion (US$1.3 billion), while the organization maintained positive operating cash generation for its third consecutive year. Manufacturing capacity is slated to exceed 4 million annual units throughout 2026. This aggressive scaling addresses both autonomous vehicle ADAS requirements and emerging robotics applications, accommodating increased lidar sensor density per platform.
Automotive and Robotics Sector Momentum
Design contracts were secured with China’s entire top-tier automotive manufacturer roster, encompassing more than 160 vehicle platforms. Multiple-sensor configurations for brands including Li Auto, Xiaomi, and Changan are scheduled for manufacturing launch between 2026 and 2027. This strategic positioning establishes Hesai as a frontrunner in the industry’s shift toward multi-sensor lidar architectures.
The company successfully penetrated the affordable vehicle segment targeting models under RMB100,000, substantially widening its total addressable marketplace. Sensor technology enables autonomous navigation, collision avoidance, and driver assistance functionality across diverse platforms. Strategic objectives emphasize increasing per-vehicle sensor integration while pursuing international market penetration.
Within robotics applications, Hesai captured top rankings across humanoid systems, quadruped platforms, autonomous taxis, delivery vans, and automated lawn maintenance equipment. Strategic agreements with Unitree, Dreame, and MOVA generated significant order volumes, demonstrating robust automation sector demand. These developments signal substantial long-term revenue opportunities as global deployment volumes accelerate.
Technological Advancement and Global Alliances
November 2025 marked the debut of the FMC500 system-on-chip architecture, consolidating MCU, FPGA, and ADC components for superior operational capabilities. The redesigned ATX sensor incorporating FMC500 technology enters production during April 2026. Proprietary “Photon Isolation” technology mitigates cross-channel laser interference, elevating safety standards and system dependability.
International expansion included designation as principal lidar provider for NVIDIA’s DRIVE Hyperion 10 reference platform. Southeast Asian market access expanded through collaboration with Grab. An intellectual property portfolio exceeding 2,071 lidar-related patents reinforces technological leadership and competitive positioning.
Management projects 2026 sensor deliveries ranging between 3 million and 3.5 million units, indicating sustained growth trajectory. Upcoming product introductions target substantial market opportunities while strengthening international presence. These coordinated strategic moves underscore organizational commitment to production scalability and application diversity across automotive and robotics verticals.

Crypto World
Invesco (IVZ), a $2.2 trillion asset manager, joins BlackRock and peers in tokenized fund push


Invesco, a U.S.-based asset manager overseeing $2.2 trillion in assets, will take over management of Superstate’s tokenized U.S. Treasury fund in a move that brings a large traditional asset manager deeper into blockchain-based finance.
The USTB fund holds short-term U.S. government securities and represents more than $900 million in assets. It ranks among the largest tokenized Treasury funds, a fast-growing corner of the market bringing money market funds onto blockchain rails.
After the transition, expected in the second quarter of 2026, the fund will be renamed to Invesco Short Duration US Government Securities Fund while keeping its ticker and token setup.
The move marks Invesco’s formal entrance in the fast-growing, $12 billion tokenized U.S. Treasuries market, joining rival global asset managers such as BlackRock (BLK), Franklin Templeton and Fidelity Investments.
Unlike traditional financial infrastructure, blockchain-based tokens allow near-instant settlement, transparent reserves and round-the-clock access. BlackRock CEO Larry Fink has said in its annual letter that tokenization could make investing faster, cheaper and more accessible by recording ownership on digital ledgers.
“Invesco has been strategically building the capabilities required to support institutional-grade digital asset products,” said Kathleen Wrynn, Invesco’s global head of digital Assets. “Superstate’s onchain infrastructure pairs naturally to support Invesco’s ambitions to scale tokenized offerings over time.”
The USTB tokenized fund will keep its structure and strategy under Invesco’s banner, while Superstate will continue to run the fund’s technology layer. That includes issuing fund shares as tokens, settling transactions onchain and maintaining a digital transfer agent system.
Invesco will handle day-to-day investment decisions through its global liquidity team, which manages over $200 billion in short-term assets.

European Central Bank Executive Board member Piero Cipollone warned that tokenized deposits and stablecoins in Europe will only scale if they rest on tokenized central bank money as a public settlement anchor. In remarks delivered in Brussels, Cipollone pointed to Pontes, the Eurosystem’s distributed ledger technology settlement initiative, which aims to connect market DLT platforms with the Eurosystem’s TARGET Services and settle transactions in central bank money.
The ECB has signaled that Pontes could be launched in the third quarter of 2026, enabling market participants to settle DLT-based transactions using central bank money. The comments extend the ECB’s broader Appia initiative, which the central bank outlined on March 11 as a blueprint for a future European tokenized financial ecosystem by 2028.
Related: The ECB has been advancing work on tokenization and digital finance, including efforts around the digital euro and related settlement infrastructure.
Key takeaways
- Tokenized financial assets in Europe would require tokenized central bank money to serve as a low-risk settlement anchor, reducing exposure to price volatility or credit risk.
- Pontes, the Eurosystem’s DLT settlement initiative, aims to interlink market DLT platforms with central bank payment rails, with a planned initial launch in Q3 2026.
- The Appia roadmap seeks to establish interoperability standards so tokenized assets can transfer smoothly across different DLT ecosystems, supported by standardized data formats and smart contract protocols.
- Beyond technology, Cipollone underscored the need for a coherent legal framework and stronger public-private collaboration to support tokenized markets at scale.
- Regulatory progress is underway, but industry participants—along with issuers of stablecoins—are pressing for broader guidance, including expansion of the DLT Pilot Regime and related cash account services for authorized providers.
Tokenized markets hinge on central bank settlement rails
In his Brussels address, Cipollone framed the issue around the core risk that currently limits scale: when a seller of a tokenized security is paid in an asset they would rather not hold, the resulting counterparty risk and volatility can chill adoption. He emphasized that central bank money can serve as a stable, trusted settlement asset, mitigating liquidity and credit concerns that might otherwise deter market participants from embracing tokenized instruments. The stance aligns with a broader ECB push to anchor tokenized finance in public money while maintaining market resilience.
As part of this vision, Pontes is described as a bridge between private market platforms and the Eurosystem’s settlement rails. If successful, the project would make it feasible to settle tokenized trades directly in central bank money, enhancing finality and reducing settlement risk across Europe’s growing tokenized ecosystem.
Appia: interoperability as the backbone of a tokenized Europe
The Appia initiative, introduced by the ECB, is designed to provide a blueprint for a European tokenized financial infrastructure through 2028. A central pillar is an interoperability standard for assets, enabling cross-platform transfers of tokenized securities and other instruments. In practice, this means harmonizing data formats and smart contract standards so that tokenized assets can move between DLT networks without bespoke bridge solutions.
Cipollone urged market infrastructure operators, banks, custodians and technology providers to engage with the Appia roadmap, offering feedback to help foster broader public-private partnerships. The underlying expectation is that a shared standard will reduce fragmentation, lower integration costs and accelerate adoption across European markets.
Legal clarity and the regulatory path forward
Beyond technology, Cipollone argued that Europe needs a more explicit legal framework to support tokenized issuance and transfer across the bloc. He flagged that while Appia and other initiatives push the technical envelope, a coherent regulatory foundation is essential to prevent a patchwork of rules that could hinder scalable settlement infrastructure.
The European Commission’s proposal to extend the DLT Pilot Regime was described as an important step, yet Cipollone cautioned that without a comprehensive tokenization framework, the region risks building high-value settlement infrastructure atop inconsistent rules. In this context, a dedicated legal framework for tokenized assets could help harmonize issuance, transfer and custody across member states.
Industry response and the next steps
The interview comes on the heels of industry activity responding to Europe’s tokenization push. Recently, stablecoin issuer Circle submitted feedback to the European Commission’s Market Integration Package, urging lawmakers to broaden the DLT Pilot Regime and to allow e-money token cash accounts for authorized crypto-asset service providers. The broader takeaway from market participants is a call for practical, scalable paths to tokenized finance, rather than piecemeal reforms that complicate cross-border settlement.
Looking ahead, the ECB’s public-private collaboration around Appia, the Pontes settlement rails, and the evolving legal framework will be in focus for institutions seeking to participate in Europe’s tokenized finance era. As with any large-scale infrastructural shift, progress will likely hinge on coordinated industry input, regulatory clarity and tangible pilot outcomes.
Readers should watch upcoming updates on Pontes’ pilot milestones and the Appia roadmap’s public consultation cycles. While the Q3 2026 launch window is a concrete near-term milestone, the broader question remains: can Europe converge on a unified framework that makes tokenized central bank money the default settlement anchor for tokenized markets?
TLDR:
- Ethereum exchange reserves have fallen to roughly 16.2 million ETH, the lowest recorded level since 2016.
- Around 37 million ETH locked in staking contracts is actively reducing circulating supply and sell-side pressure.
- Surging active addresses and lower gas fees from EIP-4844 reflect real user demand, not speculative activity.
- Staking-based ETH ETF launches and U.S. regulatory clarity are drawing fresh institutional capital into Ethereum.
Ethereum’s on-chain data points to a structural supply shift that is quietly building price pressure. Exchange reserves have fallen to around 16.2 million ETH, the lowest level since 2016.
Meanwhile, approximately 37 million ETH remains locked in staking contracts. Active addresses have also surged in recent weeks.
Together, these trends suggest that Ethereum’s current market phase may be driven more by fundamentals than by speculation.
Exchange Reserve Drop and Network Activity Signal Tightening Supply
Ethereum’s exchange reserves have reached their lowest point since 2016, sitting at around 16.2 million ETH. This drop reduces available sell-side liquidity on trading platforms.
As fewer coins sit on exchanges, any new demand can move prices more sharply. The reduced float creates conditions for heightened price sensitivity.
At the same time, around 37 million ETH is currently locked in staking. This removes a large share of the circulating supply from active trading.
Together, the staking lock-up and low exchange reserves shrink available market supply considerably. That combination puts structural pressure on price over time.
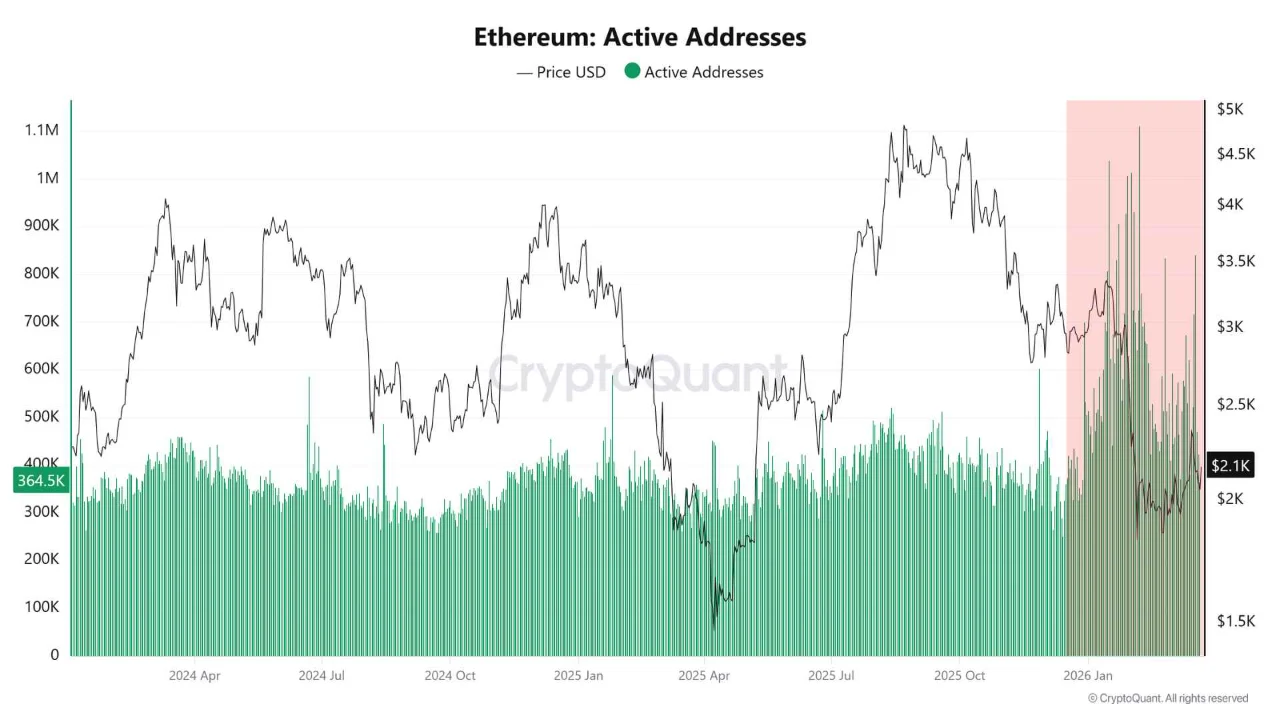
Active address counts have surged recently, pointing to genuine network usage. This rise in activity comes from real users, not speculative positioning.
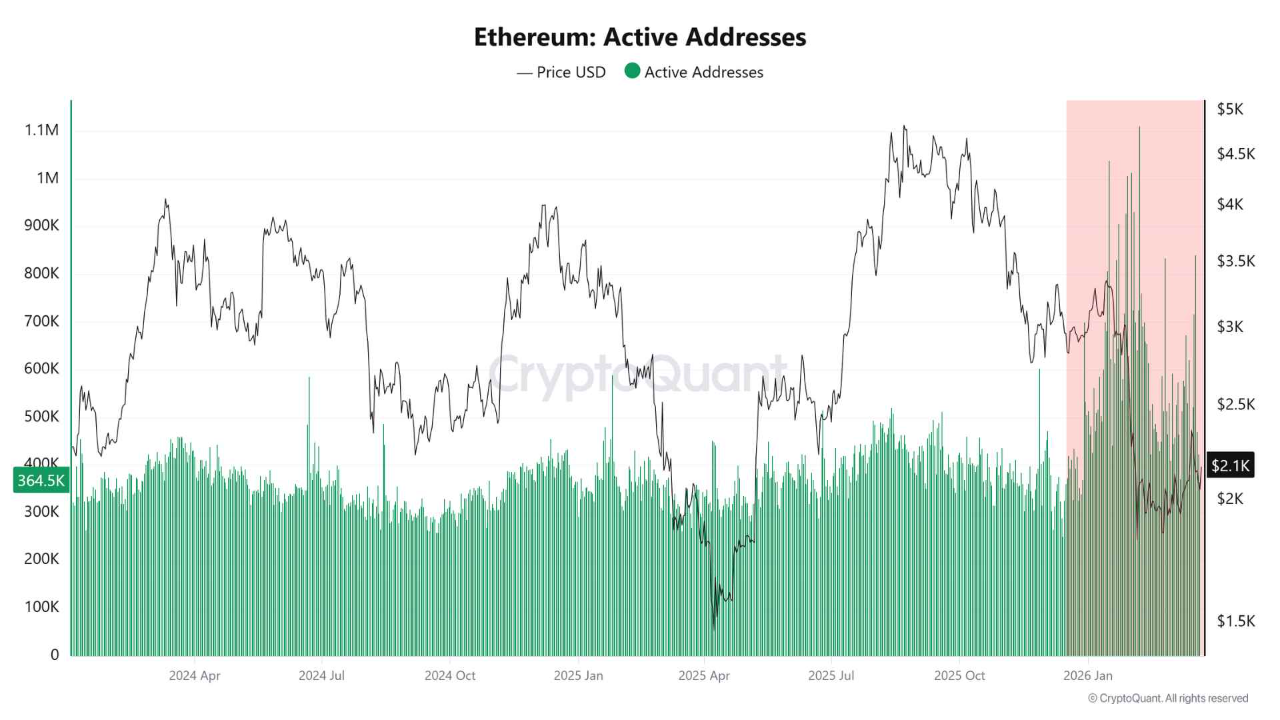
Source: Cryptoquant
Lower gas fees following EIP-4844 have made Layer 2 transactions cheaper and faster. As a result, more users are engaging with these applications than before.
Unlike prior market cycles, usage appears to be leading price rather than following it. Transaction volume on Layer 2 networks has grown steadily since EIP-4844.
This shift shows that adoption is organic and tied to improved infrastructure. The data, therefore reflect demand driven by utility rather than momentum trading.
Derivatives Reset and Institutional Access Add a New Layer of Support
Open interest in Ethereum derivatives was flushed out following prior market highs. That washout cleared excessive leverage from the system.
Since then, open interest has been rebuilding gradually and at a steadier pace. This pattern points to a healthier positioning structure in the derivatives market.
Moderate open interest growth, without aggressive funding rates, further supports this reading. Fresh capital appears to be entering rather than recycled speculative money.
The absence of extreme funding rates reduces the risk of a sudden leveraged unwind. Traders are, therefore, taking on new positions with more measured risk.
Analyst Trader Tardigrade noted on social media that Ethereum recently invalidated a bearish chart setup. The asset triggered a breakdown below support, which then reversed quickly.
That false breakdown, also known as a fakeout, is generally read as a bullish reversal pattern. The analyst cited the move as a technical shift in Ethereum’s short-term direction.
Separately, the launch of staking-based ETH exchange-traded funds has expanded institutional access to Ethereum. Regulatory clarity from U.S. agencies has further reduced uncertainty around the asset.
These developments have made ETH more accessible to a wider range of capital. Institutional participation, combined with tightening supply, adds another layer of support to current market conditions.


SIREN has reversed sharply after a fast rally on BNB Chain, with the AI-focused token falling more than 70% from its March 22 all-time high. The drop came after several days of outsized gains and fresh scrutiny over supply concentration and wallet activity.
Summary
- SIREN dropped over 70% after reaching an all-time high during a sharp rally.
- Wallet concentration concerns added pressure as scrutiny around the token grew across crypto circles.
- The BNB Chain token now struggles to stay above $1 after the crash.
SIREN traded near $0.40 on March 10 before climbing to an all-time high of about $3.61 on March 22. The move placed it among the stronger short-term performers in the market during a period when many larger assets posted smaller weekly gains.
That run then reversed. CoinGecko data showed SIREN trading near $1.01 on March 24, leaving the token down about 72% from its peak. Its 24-hour trading range stretched from about $0.80 to $2.56, showing how unstable the market remained after the sell-off began.
Part of the pressure came as onchain researchers raised concerns about supply concentration. Bubblemaps said one cluster held close to 50% of SIREN’s supply and warned that the setup carried clear downside risk if those wallets started to move tokens into the market.
The same scrutiny added to wider discussion across crypto social media about whether the token’s rally reflected normal market demand. Public claims on X linked the wallet cluster to known market participants, but no official confirmation was presented in the material reviewed here. That part remains unverified in public reporting.
The latest drop has left SIREN trying to hold above the $1 level after a rapid collapse from its record high. CoinGecko’s market page also showed bearish community sentiment on March 24, reflecting weaker confidence after the reversal.
Disclosure: This article does not represent investment advice. The content and materials featured on this page are for educational purposes only.
XL bully dog savaged man, 84, who later died ‘as if he were its prey’, jury told

Seven Methods for Finding and Closing AI Services Clients When You’re Starting from Zero Followers and Zero Case Studies

What to Wear to a Conference in 2026


-
 Crypto World4 days ago
NIO (NIO) Stock Plunges 6.5% as Shelf Registration Sparks Dilution Worries
-

 Fashion4 days ago
Weekend Open Thread: Adidas – Corporette.com
-

 Politics4 days ago
Jenni Murray, Long-Serving Woman’s Hour Presenter, Dies Aged 75
-
 Tech7 days ago
Are Split Spacebars the Next Big Gaming Keyboard Trend?
-

 Crypto World3 days ago
Best Crypto to Buy Now: Strategy Just Spent $1.57 Billion on Bitcoin During Fear While Early Investors Quietly Enter Pepeto for 150x Potential
-

 News Videos6 days ago
RBA board divided on rate cut, unusually buoyant share market | Finance Report | ABC NEWS
-

 Crypto World3 days ago
Bitcoin Price News: Bhutan Sells $72 Million in BTC Under Fiscal Pressure, but the Smart Money Entering Pepeto Sees What the Market Does Not
-

 Politics6 days ago
The House | The new register to protect children from their abusers shows Parliament at its best
-

 Tech4 days ago
inKONBINI Lets You Spend Summer Days Behind the Register
-
 Politics7 days ago
Real-time pollution monitoring calls after boy nearly dies
-

 Crypto World6 days ago
Canada’s FINTRAC revokes registrations of 23 crypto MSBs in AML crackdown
-

 Sports1 day ago
Remo Stars and Kano Pillars Strengthen Survival Hopes in NPFL
-
 NewsBeat6 days ago
Residents in North Lanarkshire reminded to register to vote in Scottish Parliament Election
-

 News Videos6 days ago
PARLIAMENT OF MALAWI – PAC MEETING WITH REGISTRAR OF FINANCIAL ON AMARYLLIS HOTEL – INQUIRY LIVE
-

 Politics5 days ago
Gender equality discussions at UN face pushbacks and US resistance
-

 Business2 days ago
No Winner in March 21 Drawing as Prize Rolls to $133 Million for Next
-

 Business6 days ago
Who Was Alex Pretti? 5 Key Facts About the ICU Nurse Killed by Federal Agents in Minneapolis
-

 Sports24 hours ago
Gary Kirsten Accuses Pakistan Cricket Board Of ‘Interference’, Mohsin Naqvi Responds
-

 Tech2 days ago
Give Your Phone a Huge (and Free) Upgrade by Switching to Another Keyboard
-

 Sports4 days ago
2026 Kentucky Derby horses, odds, futures, preview, date: Expert who nailed 12 Derby-Oaks Doubles enters picks
You must be logged in to post a comment Login