
Crypto World
Is the U.S. Economy Heading Into a Recession? Multiple Indicators Signal Growing Risk N

TLDR:
- January 2026 recorded 108,435 layoffs, the highest January figure since the 2009 recession period.
- Job openings plummeted to 6.54 million while hiring plans hit record lows at just 5,306 in January.
- Housing market shows 47% more sellers than buyers, creating 630,000 excess sellers—a record imbalance.
- Corporate credit stress affects 14-15% of bond segments as inflation trends below 1%, risking deflation.
The U.S. economy faces mounting questions about a potential recession as critical economic indicators deteriorate across multiple sectors.
January 2026 witnessed 108,435 announced layoffs, the highest January figure since the 2009 recession, raising alarm bells about economic health.
Labor market weakness, housing imbalances, and credit stress are converging in patterns that historically precede economic contractions, prompting analysts to assess whether the nation is approaching a downturn.
Labor Market Collapse Points Toward Economic Slowdown
The labor market is delivering the strongest early warning signals of potential recession, with job data weakening at an alarming rate.
According to Bull Theory, a market analysis platform, the situation is particularly concerning because “jobs usually weaken before the economy officially slows.”
Weekly jobless claims jumped to 231,000, exceeding expectations and indicating more workers are filing for unemployment benefits.
This acceleration in layoffs suggests companies are not conducting normal seasonal restructuring but preparing for significantly weaker growth ahead.
Bull Theory emphasized that January’s layoff numbers represent something more serious, noting “that is not normal seasonal restructuring” but rather “companies preparing for weaker growth ahead.”
Job openings have fallen sharply to approximately 6.54 million according to JOLTS data, marking the lowest level since 2020.
When job openings decline while layoffs simultaneously increase, displaced workers face fewer opportunities for reemployment.
Hiring has effectively collapsed, with companies announcing just 5,306 hiring plans in January, the lowest level ever recorded for that month. Businesses are freezing expansion rather than growing their workforce, a clear sign of anticipated economic weakness.
Housing and Bond Markets Flash Recession Warnings
The housing market is displaying critical recession indicators through unprecedented imbalances between supply and demand.
Approximately 47% more sellers than buyers currently exist, equal to roughly 630,000 excess sellers representing the widest gap ever recorded.
Bull Theory analyzed this phenomenon, explaining that “when sellers heavily outnumber buyers, it means people want liquidity” as they prefer “cash instead of holding property risk.”
Housing slowdowns create cascading effects throughout the broader economy, impacting construction, lending, materials, and employment sectors simultaneously.
When real estate transactions freeze, the economic slowdown broadens beyond housing into adjacent industries. Consumer confidence surveys are already showing multi-year lows as job uncertainty spreads, leading households to reduce spending on homes, cars, travel, and discretionary purchases.
The Treasury yield curve is bear steepening again, with long-term yields rising faster than short-term rates near four-year highs.
Investors are demanding higher returns to hold long-term U.S. debt, reflecting concerns the analysis identifies as worries about “fiscal deficits, debt levels, and long-term growth outlook.”
Historically, yield curve shifts of this nature have preceded recessions multiple times, making the current trend particularly concerning for economic forecasters.
Credit Stress and Deflation Risks Intensify Recession Probability
Corporate credit markets are showing dangerous stress levels, with approximately 14% to 15% of certain bond segments either distressed or facing high default risk.
When companies encounter debt pressure, they respond with aggressive cost-cutting measures including layoffs, reduced spending, and halted expansion.
Business bankruptcy filings have been climbing steadily, disrupting supply chains and removing liquidity from the financial system.
Another overlooked recession risk involves disinflation moving dangerously close to deflation territory. Real-time inflation trackers like Truflation show inflation trending near or below 1%, far beneath the Federal Reserve’s 2% target.
Bull Theory warned that “if inflation falls too fast, spending slows because people expect lower prices later,” adding that “deflation cycles are historically more damaging than inflation.”
The Federal Reserve maintains a relatively hawkish tone despite weakening forward indicators, continuing to emphasize inflation risks while labor, housing, and credit data soften.
Bull Theory assessed the overall situation, stating that when combining all these factors, “you get a macro backdrop that historically aligns with late-cycle slowdown phases.”
However, the analysis clarified that “this does not mean recession is officially here yet” but rather “the economy is becoming fragile and markets are starting to react to that risk.”


The crypto market rebounded 1.2% on Monday to $2.4 trillion in a relief rally amidst signs of potential de-escalation of the ongoing U.S. and Iran war in the Middle East.
Summary
- The crypto market rebounded modestly as hopes of U.S.–Iran de-escalation eased risk-off sentiment, lifting major assets including Bitcoin and Ethereum.
- Relief rally came despite heightened derivatives volatility, with roughly $350 million in liquidations led by long positions, indicating fragile market positioning.
- Macro risks persist as rising oil prices and hawkish rate expectations continue to weigh on sentiment, limiting upside despite a slight improvement in the fear and greed index.
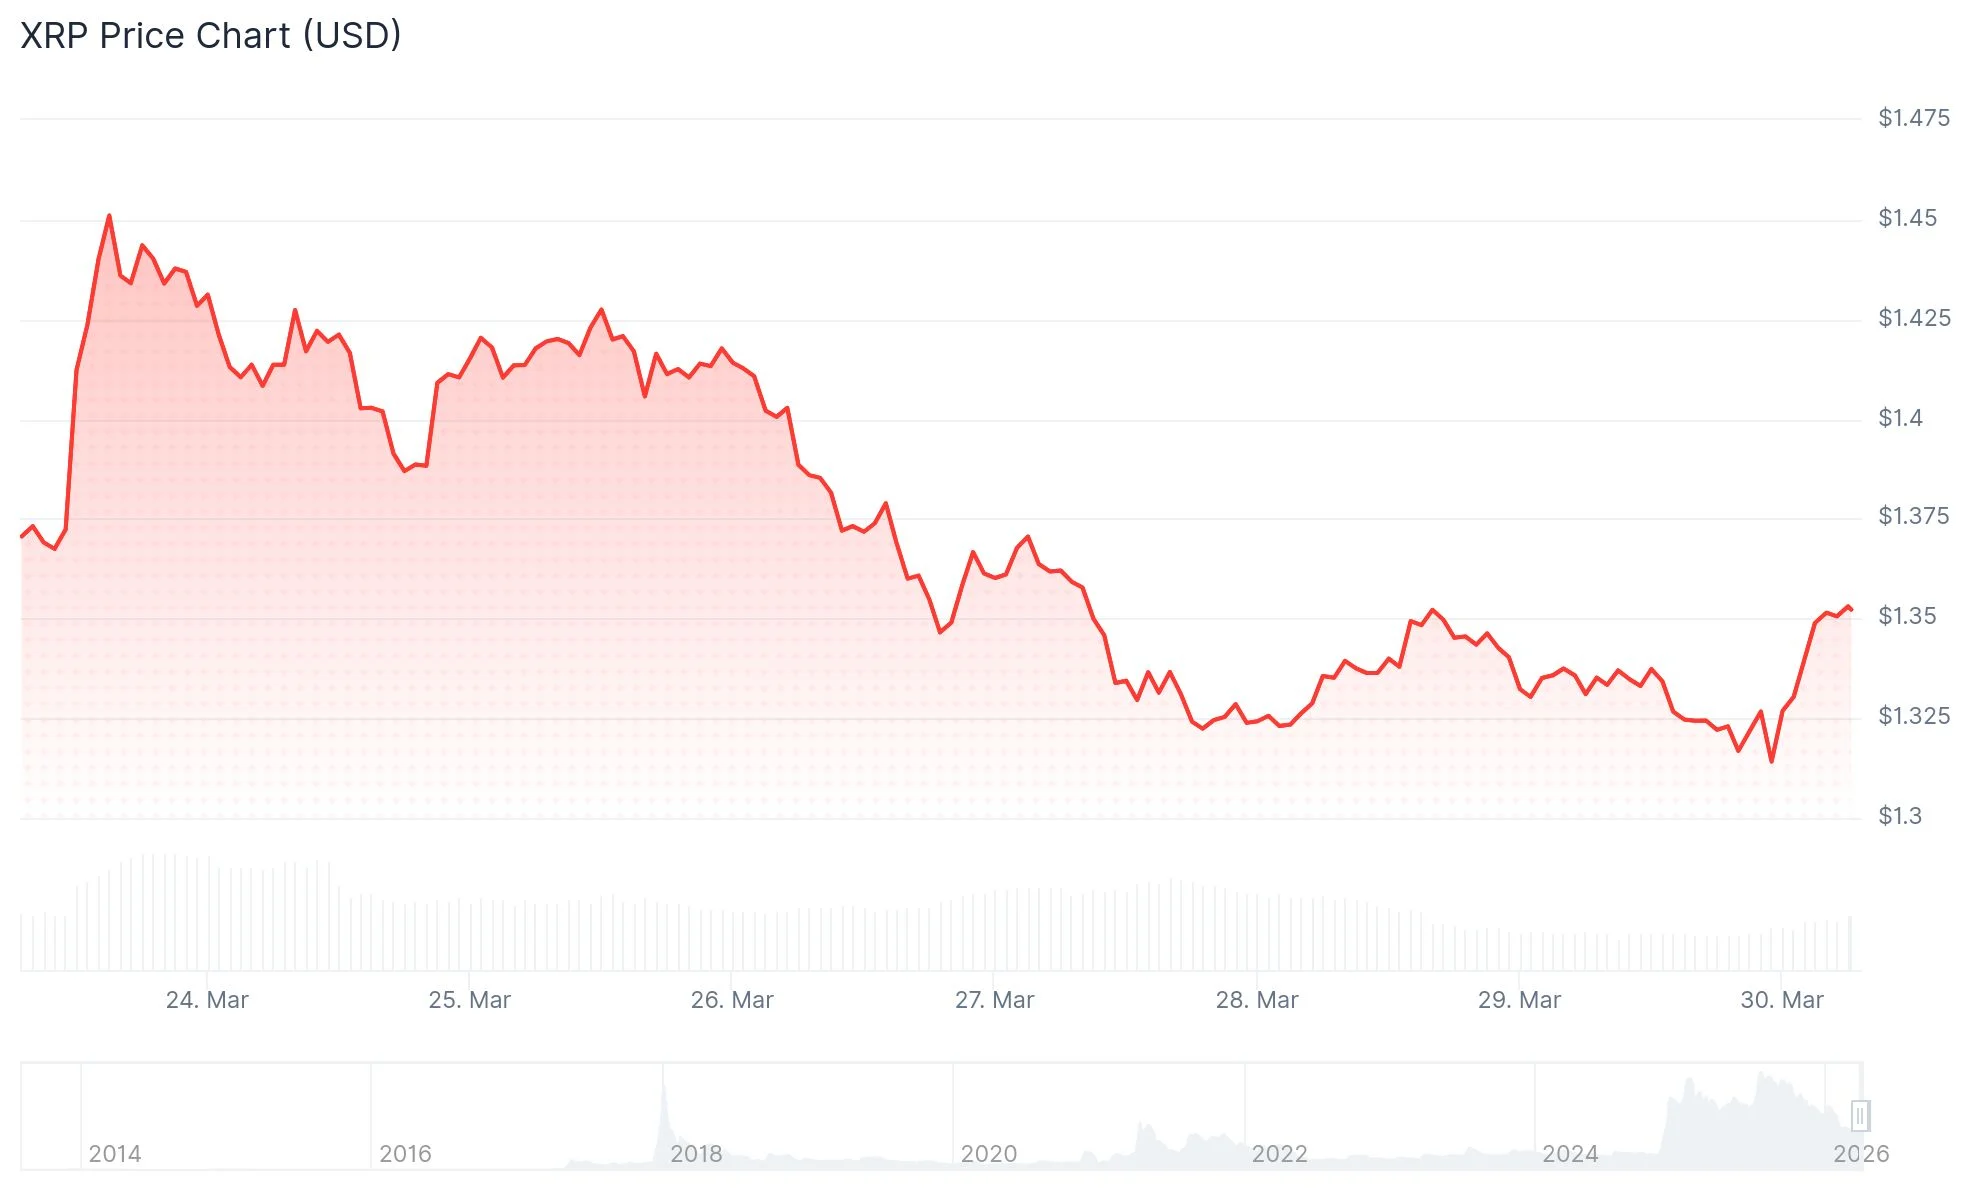
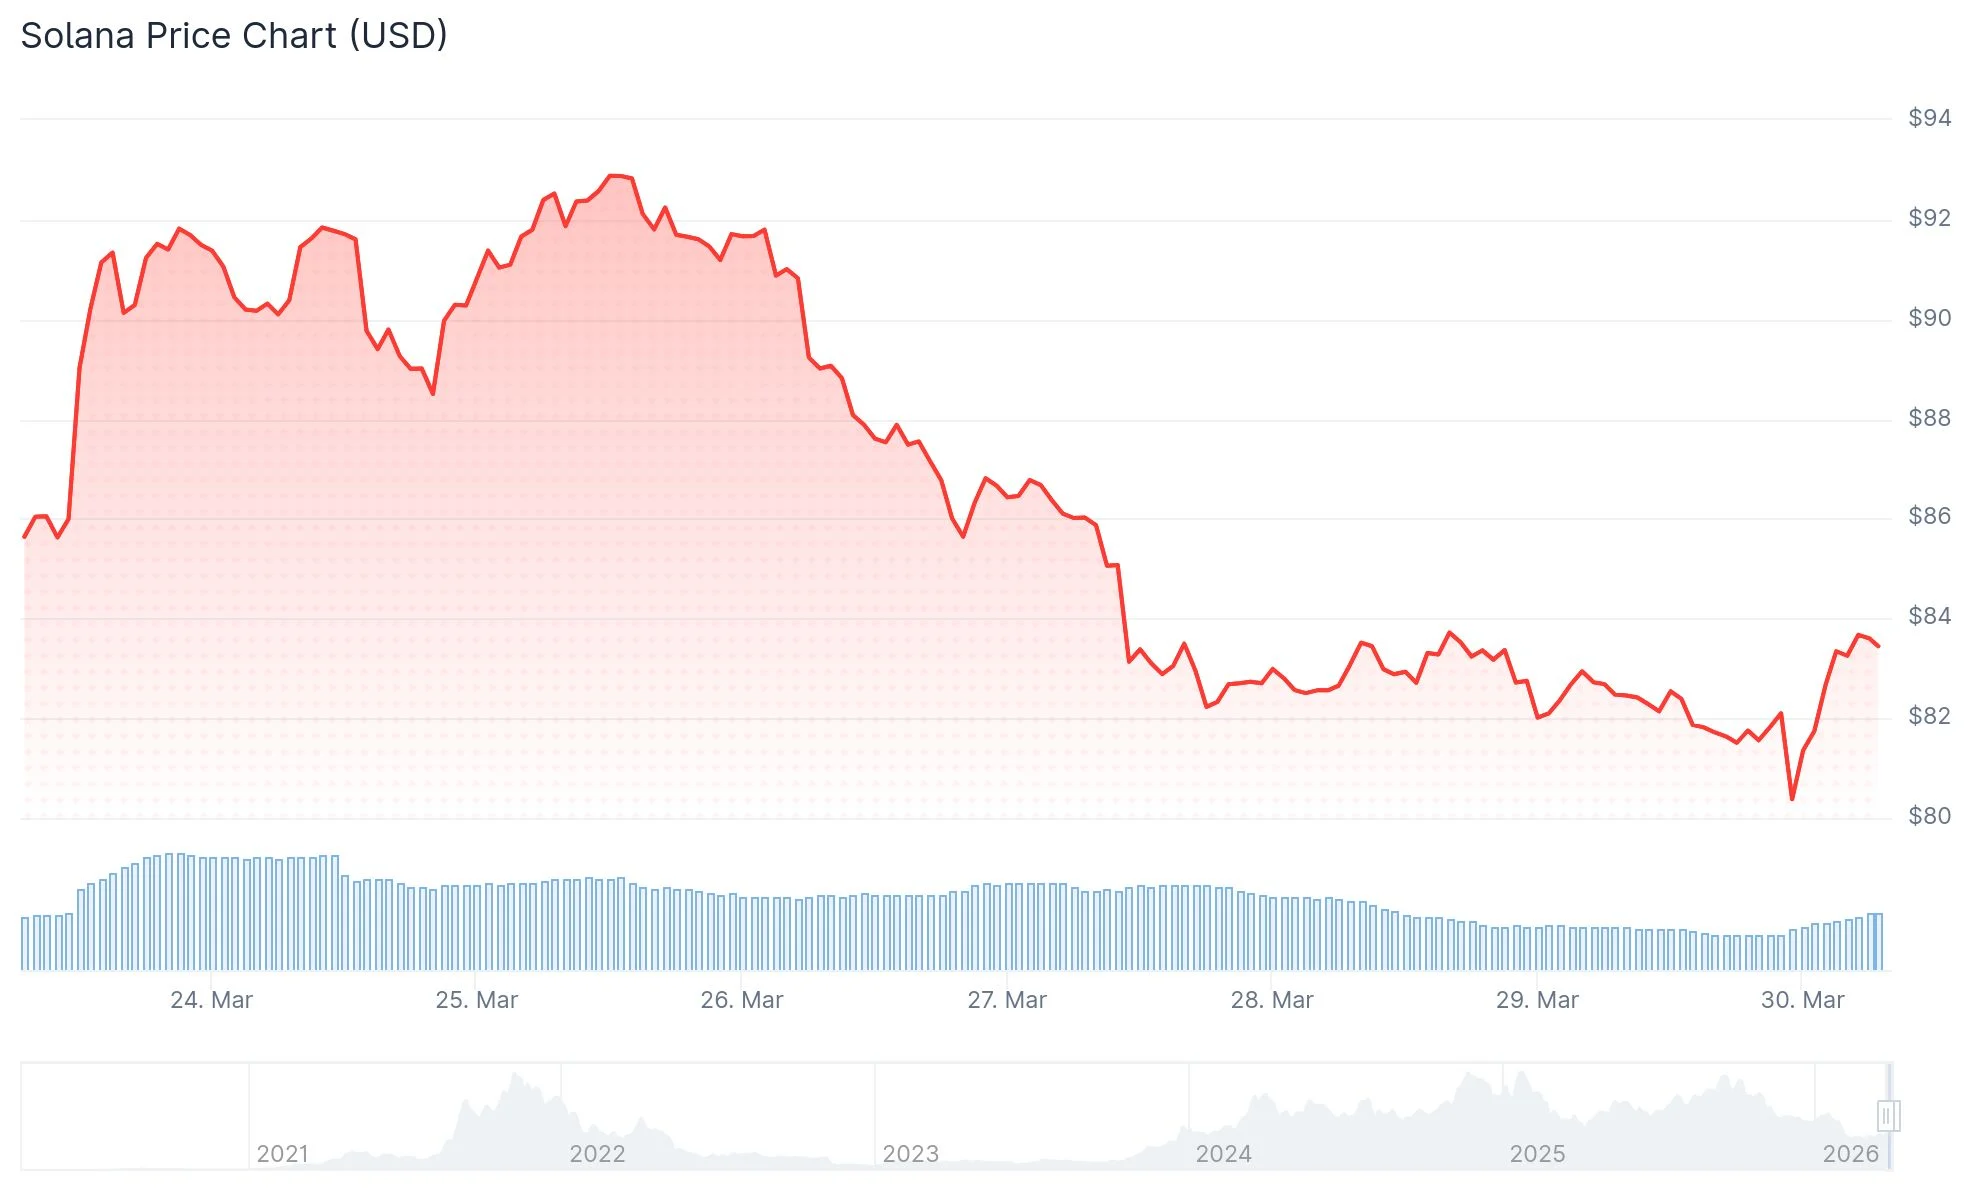
Bitcoin (BTC) rose 1.4% to back above $67,600 after dropping to a 4-week low around $65,000 earlier today. Ethereum (ETH) was up 2.2% to over $2,000, while major crypto assets such as XRP (XRP), Solana (SOL), and Dogecoin (DOGE) posted gains between 1 and 2% each.
Despite a rebound in spot crypto prices, significant volatility was observed across crypto derivatives markets. Data from Coinglass shows that over the past 24 hours, nearly $350 million worth of positions were liquidated from the market, with the brunt of the liquidations coming from trades that held long positions.
Meanwhile, the crypto fear and greed index jumped 4 points to 27,, suggesting some easing, although overall sentiment remains shaky.
The crypto market took a breather on Monday after reports emerged that Pakistan is preparing to host peace talks between the U.S. and Iran to end their war in the Middle East region after diplomats from both sides agreed to meet.
The news seemed to have calmed investor nerves as the war entered its fifth week, with both nations going back and forth against each other’s energy and military infrastructure.
The two-day talks in the Pakistani capital that began on Sunday are being led by Pakistani Foreign Minister Ishaq Dar over possible ways to bring an end to the war in the region as well as the blockade in Islamabad.
This came after Iran allowed 20 Pakistani commercial vessels to pass through the Strait of Hormuz, easing a naval blockade that has stifled regional trade.
Elsewhere, U.S. President Donald Trump has recently instructed the Pentagon to pause strikes on Iranian power and energy infrastructure for five days to allow for these productive talks.
Concerns remain
Meanwhile, Iranian parliament speaker Mohammad Bagher Qalibaf has dismissed the proposed talks in Islamabad as a tactical distraction after the arrival of thousands of U.S. troops in the Middle East, stating that Iran was ready to retaliate if necessary.
Earlier, Trump had announced that the U.S. would deploy 10,000 additional troops to expand its military options in the region.
Amidst the ongoing tension, traditional safe-haven assets such as gold and precious metals continued their march. Gold rose by 1.1% over the day to $4,544, while Silver gained by 1.5%.
Against this backdrop, oil prices across the globe have surged back above $100. West Texas Intermediate (WTI) crude oil was trading at $100.7, up 1% over the day, while Brent crude was up 2.2% to $115.
This trend could further dampen investor sentiment, as rising crude oil prices tend to fuel fears of persistent inflation. Such inflationary pressure could, in turn, motivate the Federal Reserve to delay highly anticipated rate cuts, keeping borrowing costs higher for longer.
At press time, the odds of the Fed holding interest rates steady at 3.5% to 3.75% stood at 96.4% while only 3.6% of market participants held out hope for a 25bps reduction.
Disclosure: This article does not represent investment advice. The content and materials featured on this page are for educational purposes only.
Bitcoin (BTC) price is entering April 2026 at a crossroads. March is closing with a barely positive 0.19% gain, a sharp fade from the over 5% monthly gain BTC held earlier.
With history, ETF flows, and whale behavior all sending mixed signals, April could define Bitcoin’s direction for the rest of 2026.
History Favors April, but the 3-Day Chart Does Not
The monthly returns chart shows that the Bitcoin price has struggled in 2026. January closed at -10.1%, and February dropped 14.8%, both defying their historically positive averages of +8.52% and +12.5%, respectively. March is barely holding at +0.19%, well below its historical average of +10.2%.
Want more token insights like this? Sign up for Editor Harsh Notariya’s Daily Crypto Newsletter here.
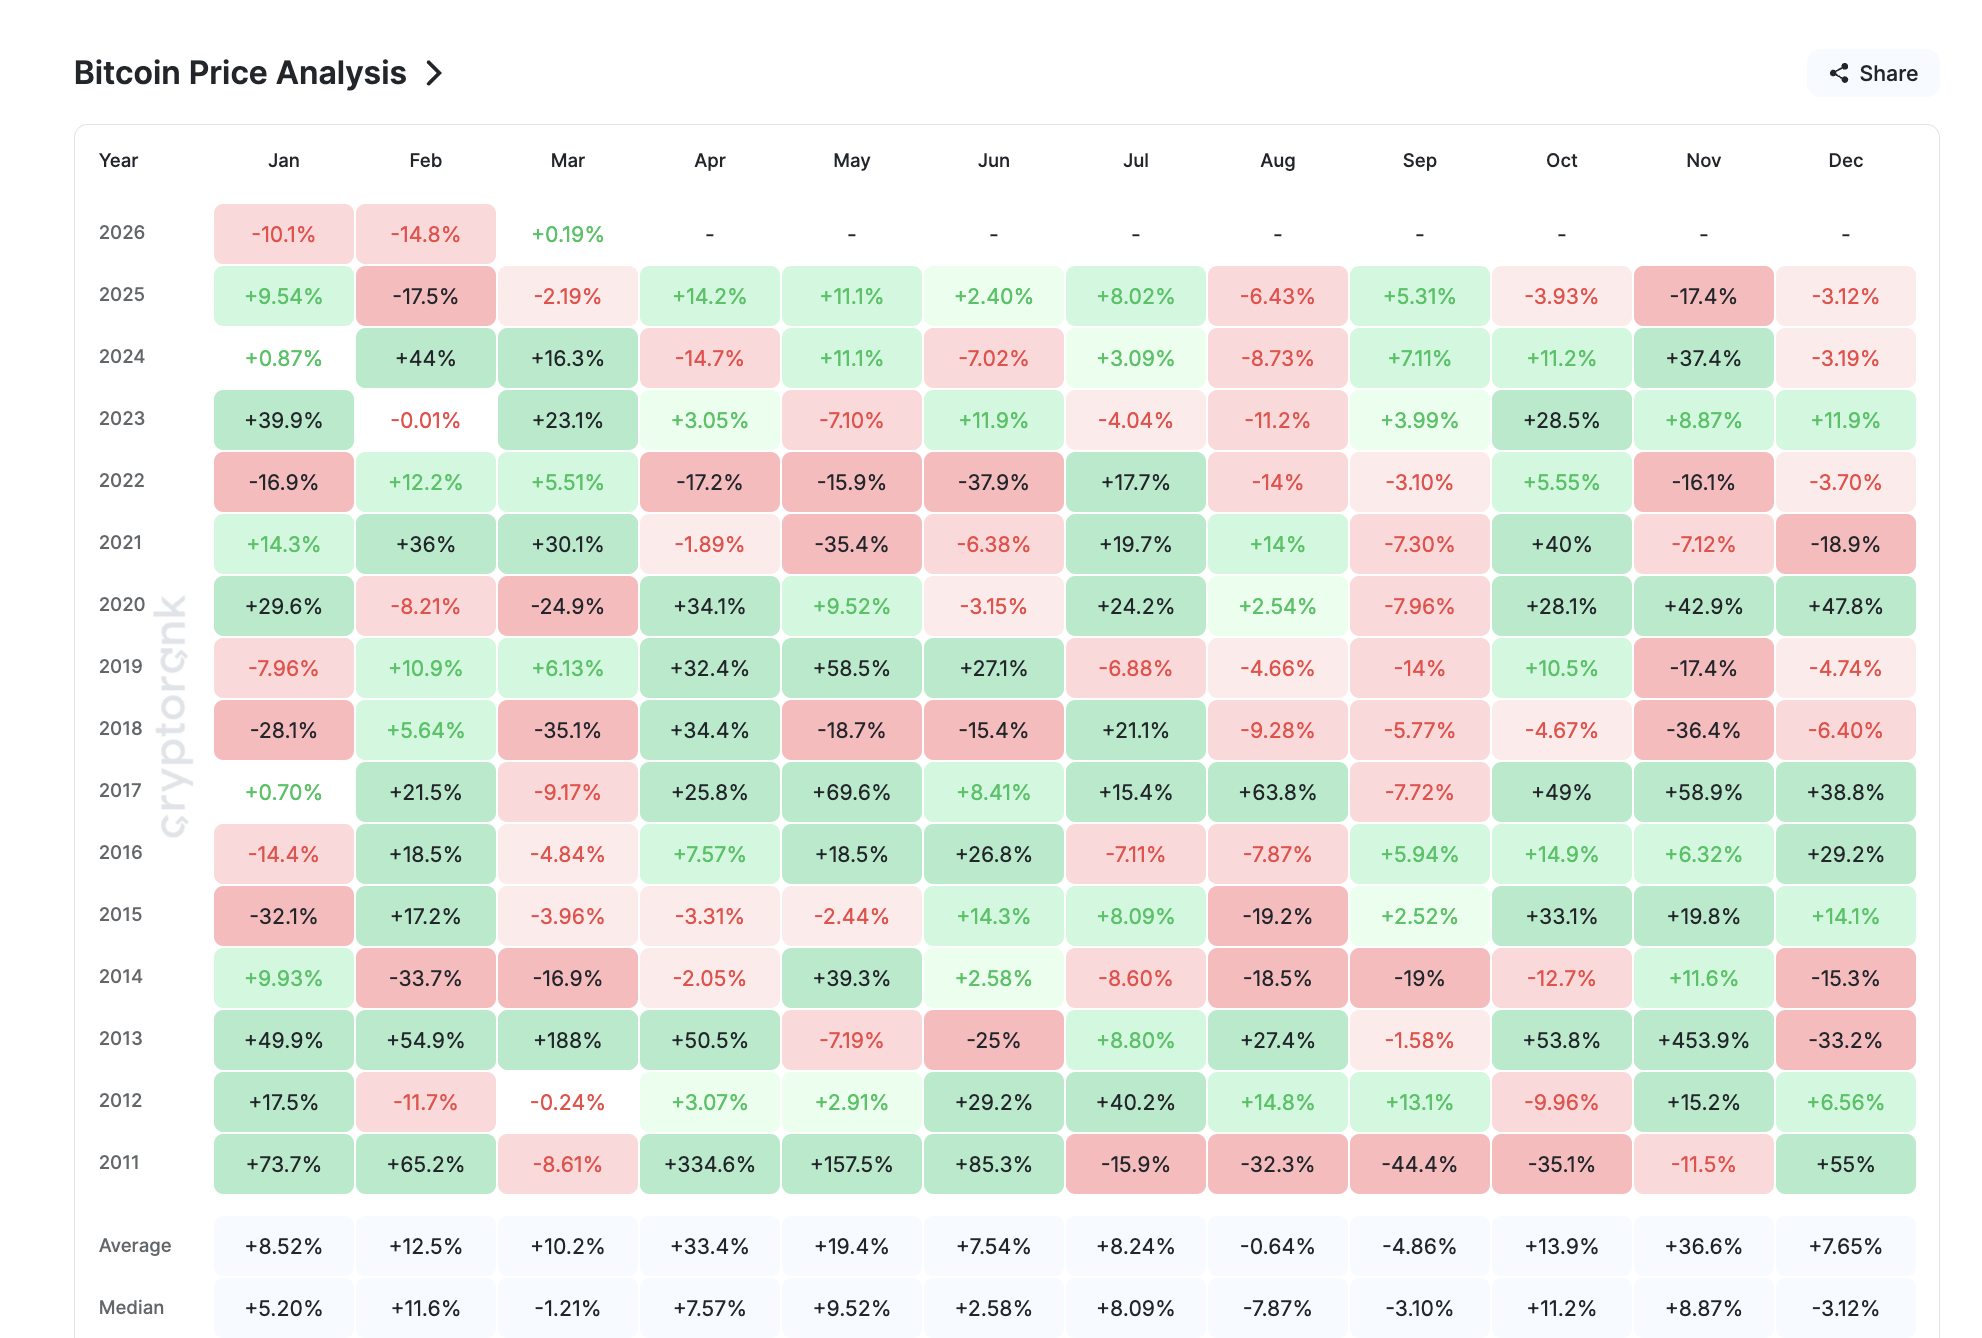
April has historically been one of Bitcoin’s strongest months, with an average return of +33.4% and a median of +7.57%. However, given that both January and February already broke their historical trends, relying on seasonal patterns alone would be risky.
The 3-day chart paints a concerning Bitcoin price prediction for the months ahead. Since peaking at $125,900 on October 4, 2025, BTC has dropped to $60,000 at its lowest, a decline of over 52%. The price action since the January lows resembles a bear flag, a consolidation pattern that typically resolves with another leg down matching the pole’s size.
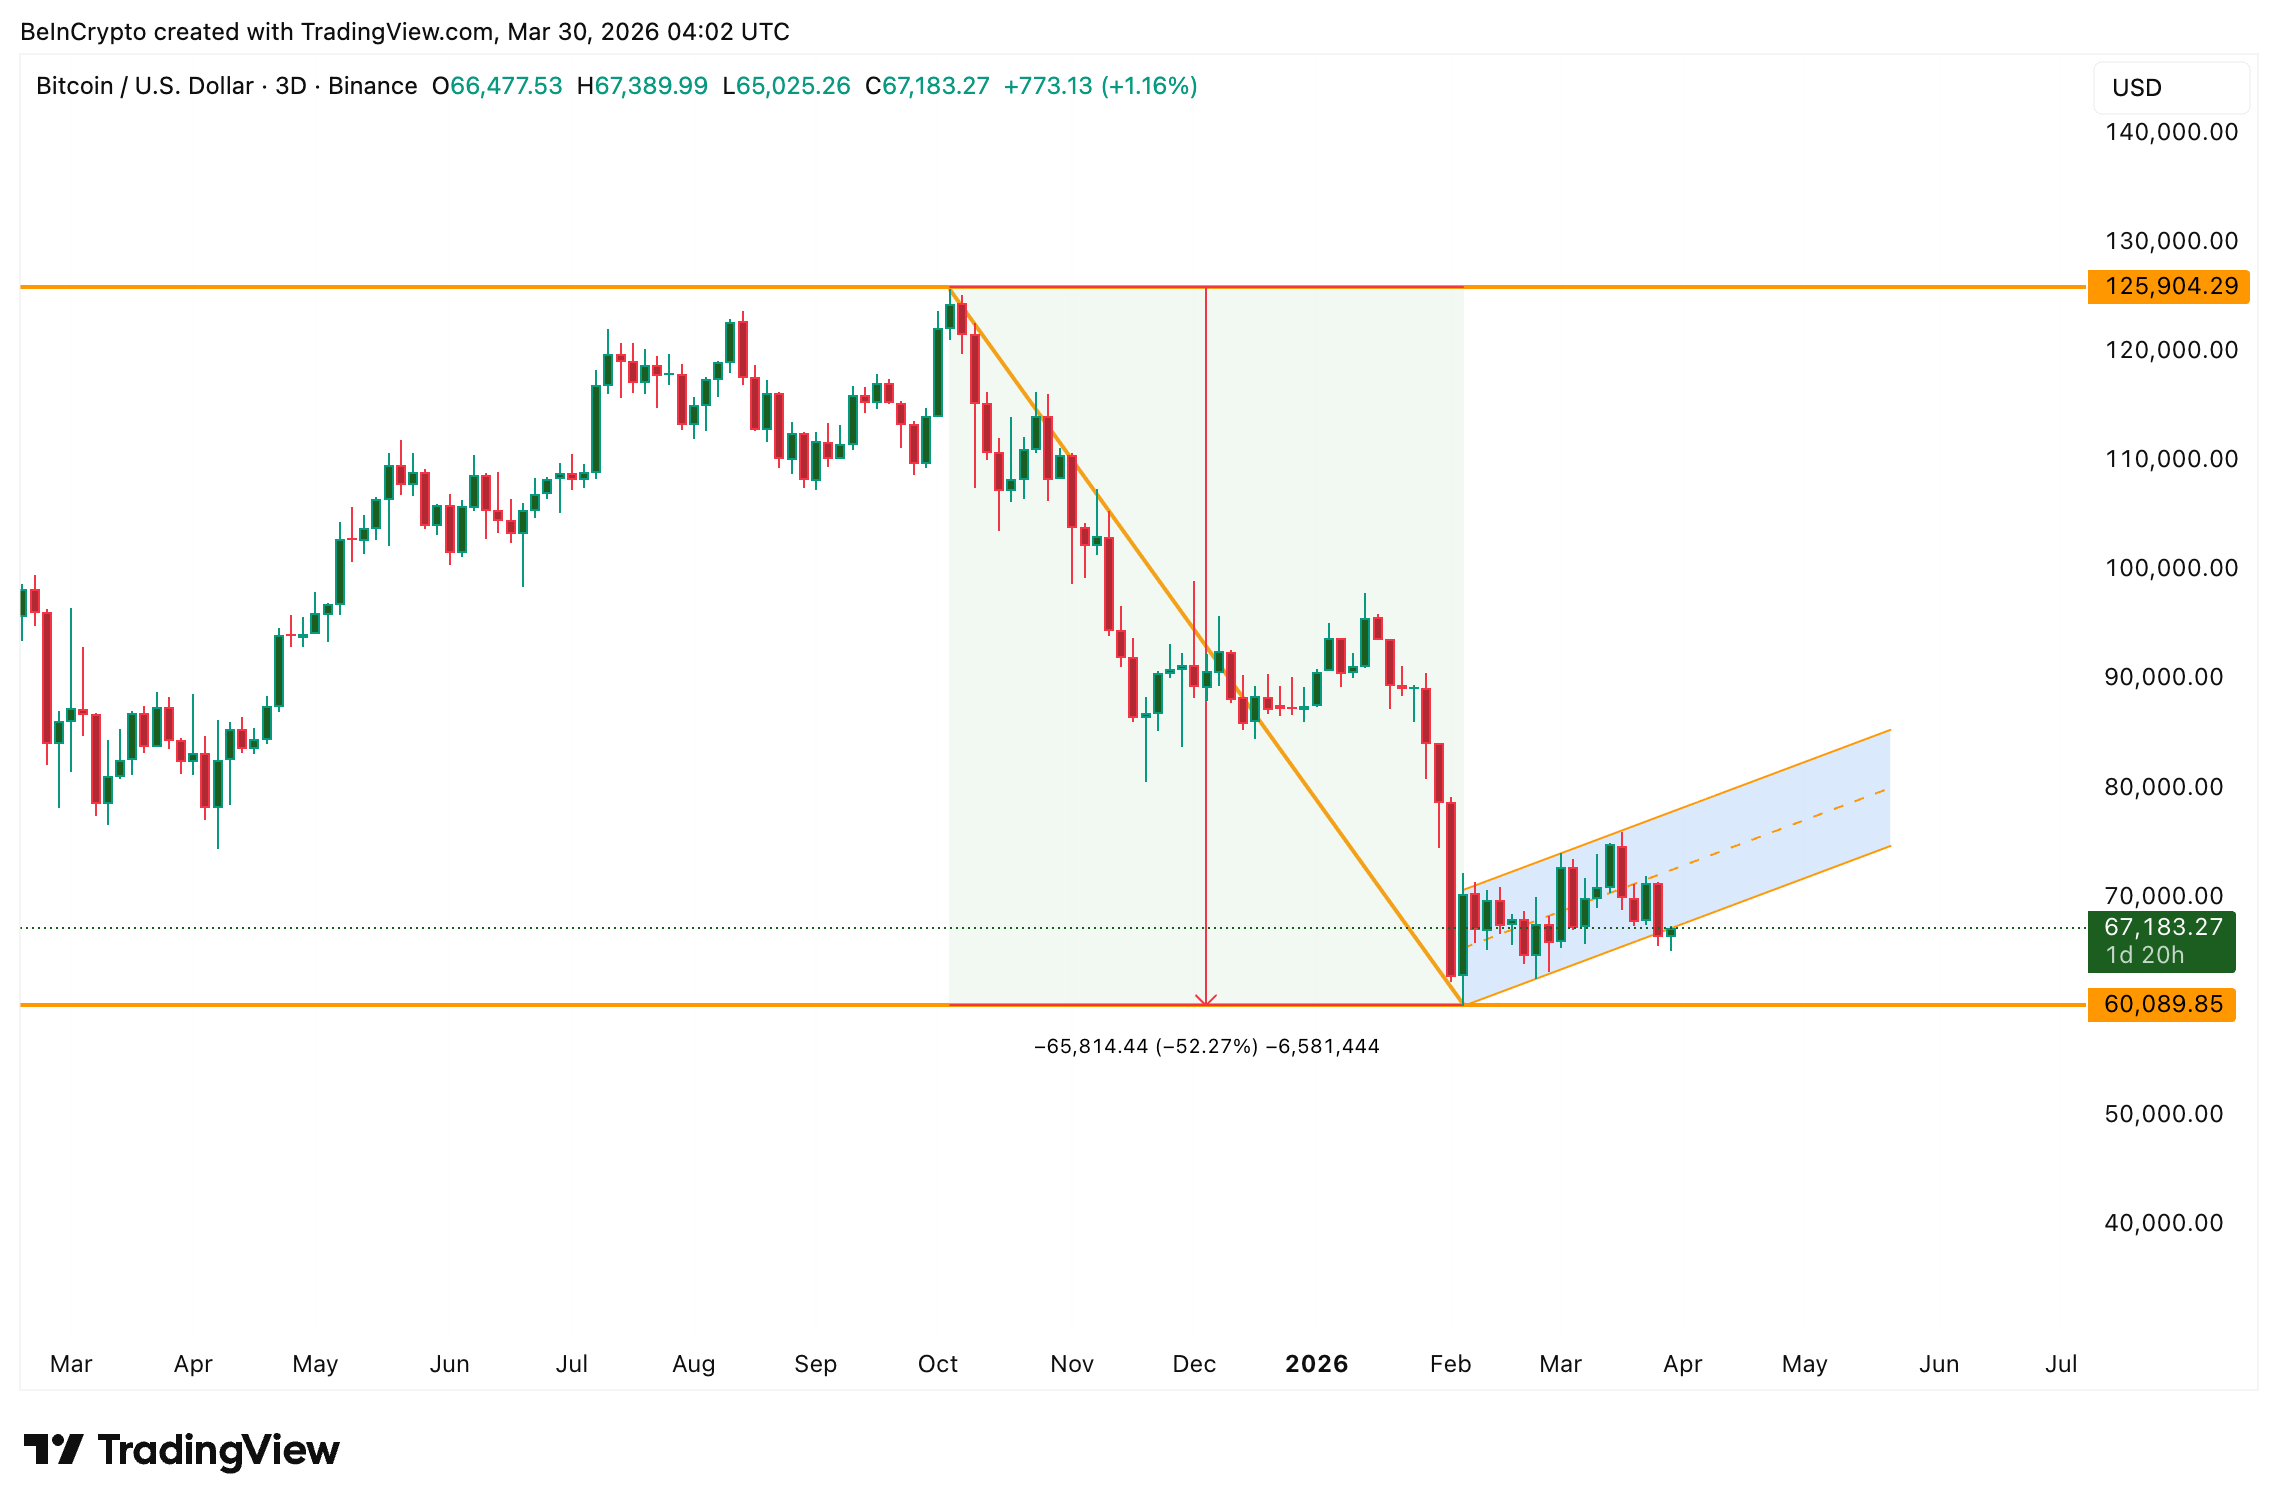
The price is currently testing the lower trendline of the flag. If the breakdown confirms on the 3-day chart, the measured move points to a significant further decline. That larger picture sets the tone for how April could unfold.
Bitcoin ETFs Show Cracks Beneath a Green Surface
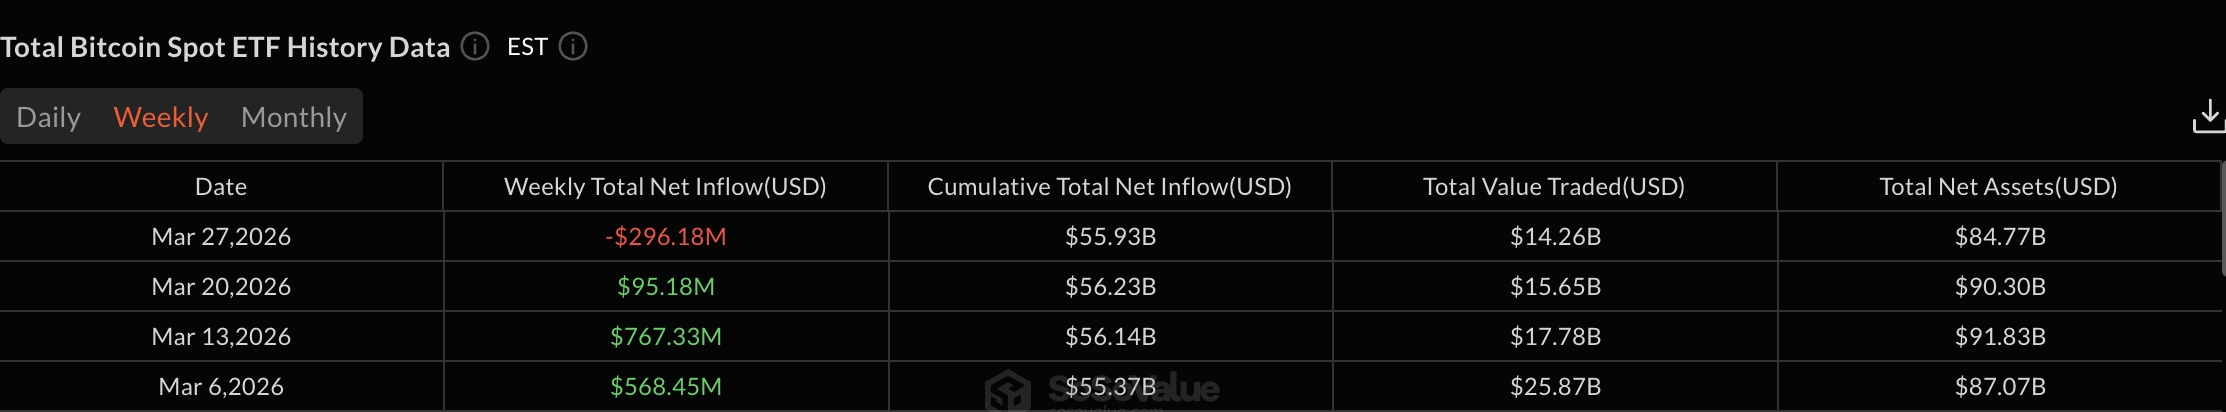
On the surface, Bitcoin ETF flows in March look encouraging. Monthly data shows $1.13 billion in net inflows, ending a four-month outflow streak. The reversal suggests institutional conviction is returning.
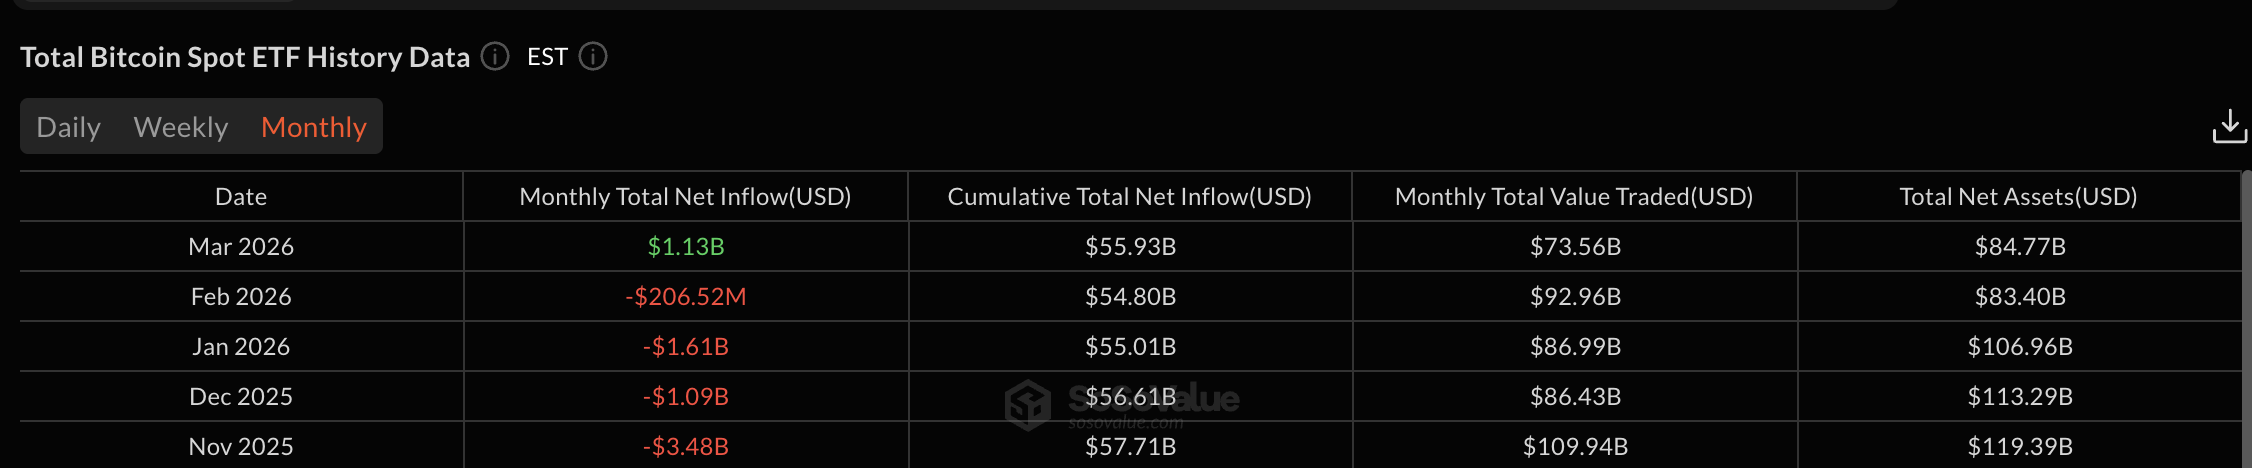
However, the weekly breakdown tells a different story. The week of March 6 brought $568 million in inflows. March 13 surged to $767 million. March 20 slowed to $95 million. And the week ending March 27 flipped red at -$296 million.
March started strong but is ending weak. The momentum that drove ETF inflows earlier in the month has faded, and the final week’s outflow could set the tone heading into April.
The Exchange Whale Ratio, a CryptoQuant metric that tracks the ratio of the top 10 exchange inflows to total inflows, reinforces this concern. On January 10, the ratio sat at 0.34, its lowest year-to-date level. By March 28, it had surged to 0.79, with two notable spikes on March 14 and March 28.
A rising whale ratio means Bitcoin whales are sending a larger share of coins to exchanges relative to all other participants. The upward trend throughout 2026 shows that large holders have been consistently distributing, and March offered no exception.
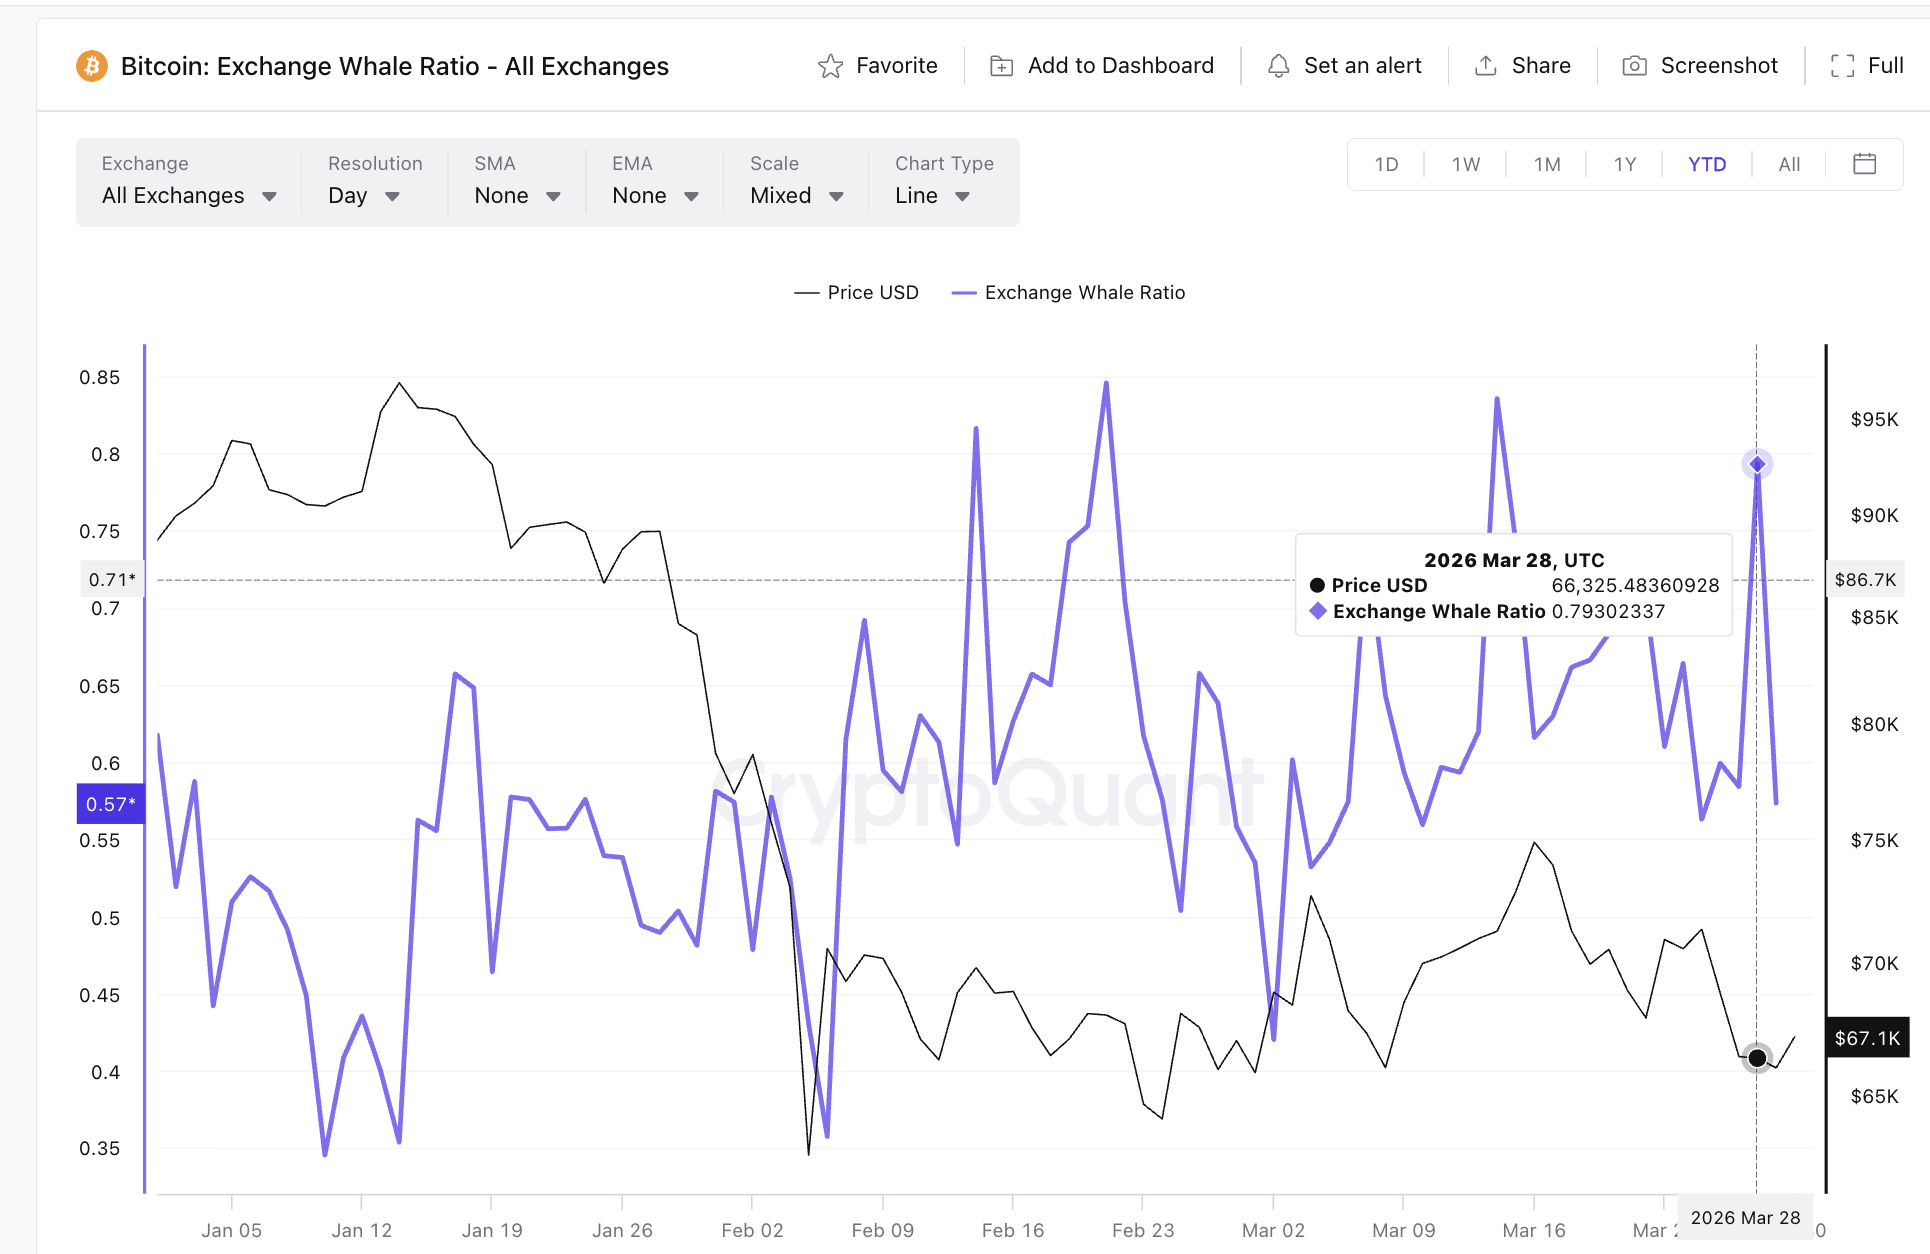
The combination of fading ETF inflows and rising whale selling heading into April weakens the demand picture at a time when the technical structure already leans bearish.
Bitcoin Price Levels To Watch in April
The most critical level for April is $67,000. It has acted as a strong support base throughout 2026, with every dip below it being quickly reclaimed. However, a clean 3-day close below $67,000, combined with the weakening ETF and whale data, could trigger the next leg down.
Below $67,000, the next support sits at $61,500 (the 0.382 Fibonacci level), followed by $60,000, a psychological and technical floor. April will likely be defined by whether Bitcoin can hold the $60,000 to $61,500 zone. A break under that range opens the door to $57,000 and eventually $52,600, which aligns with the 0.618 Fibonacci retracement.
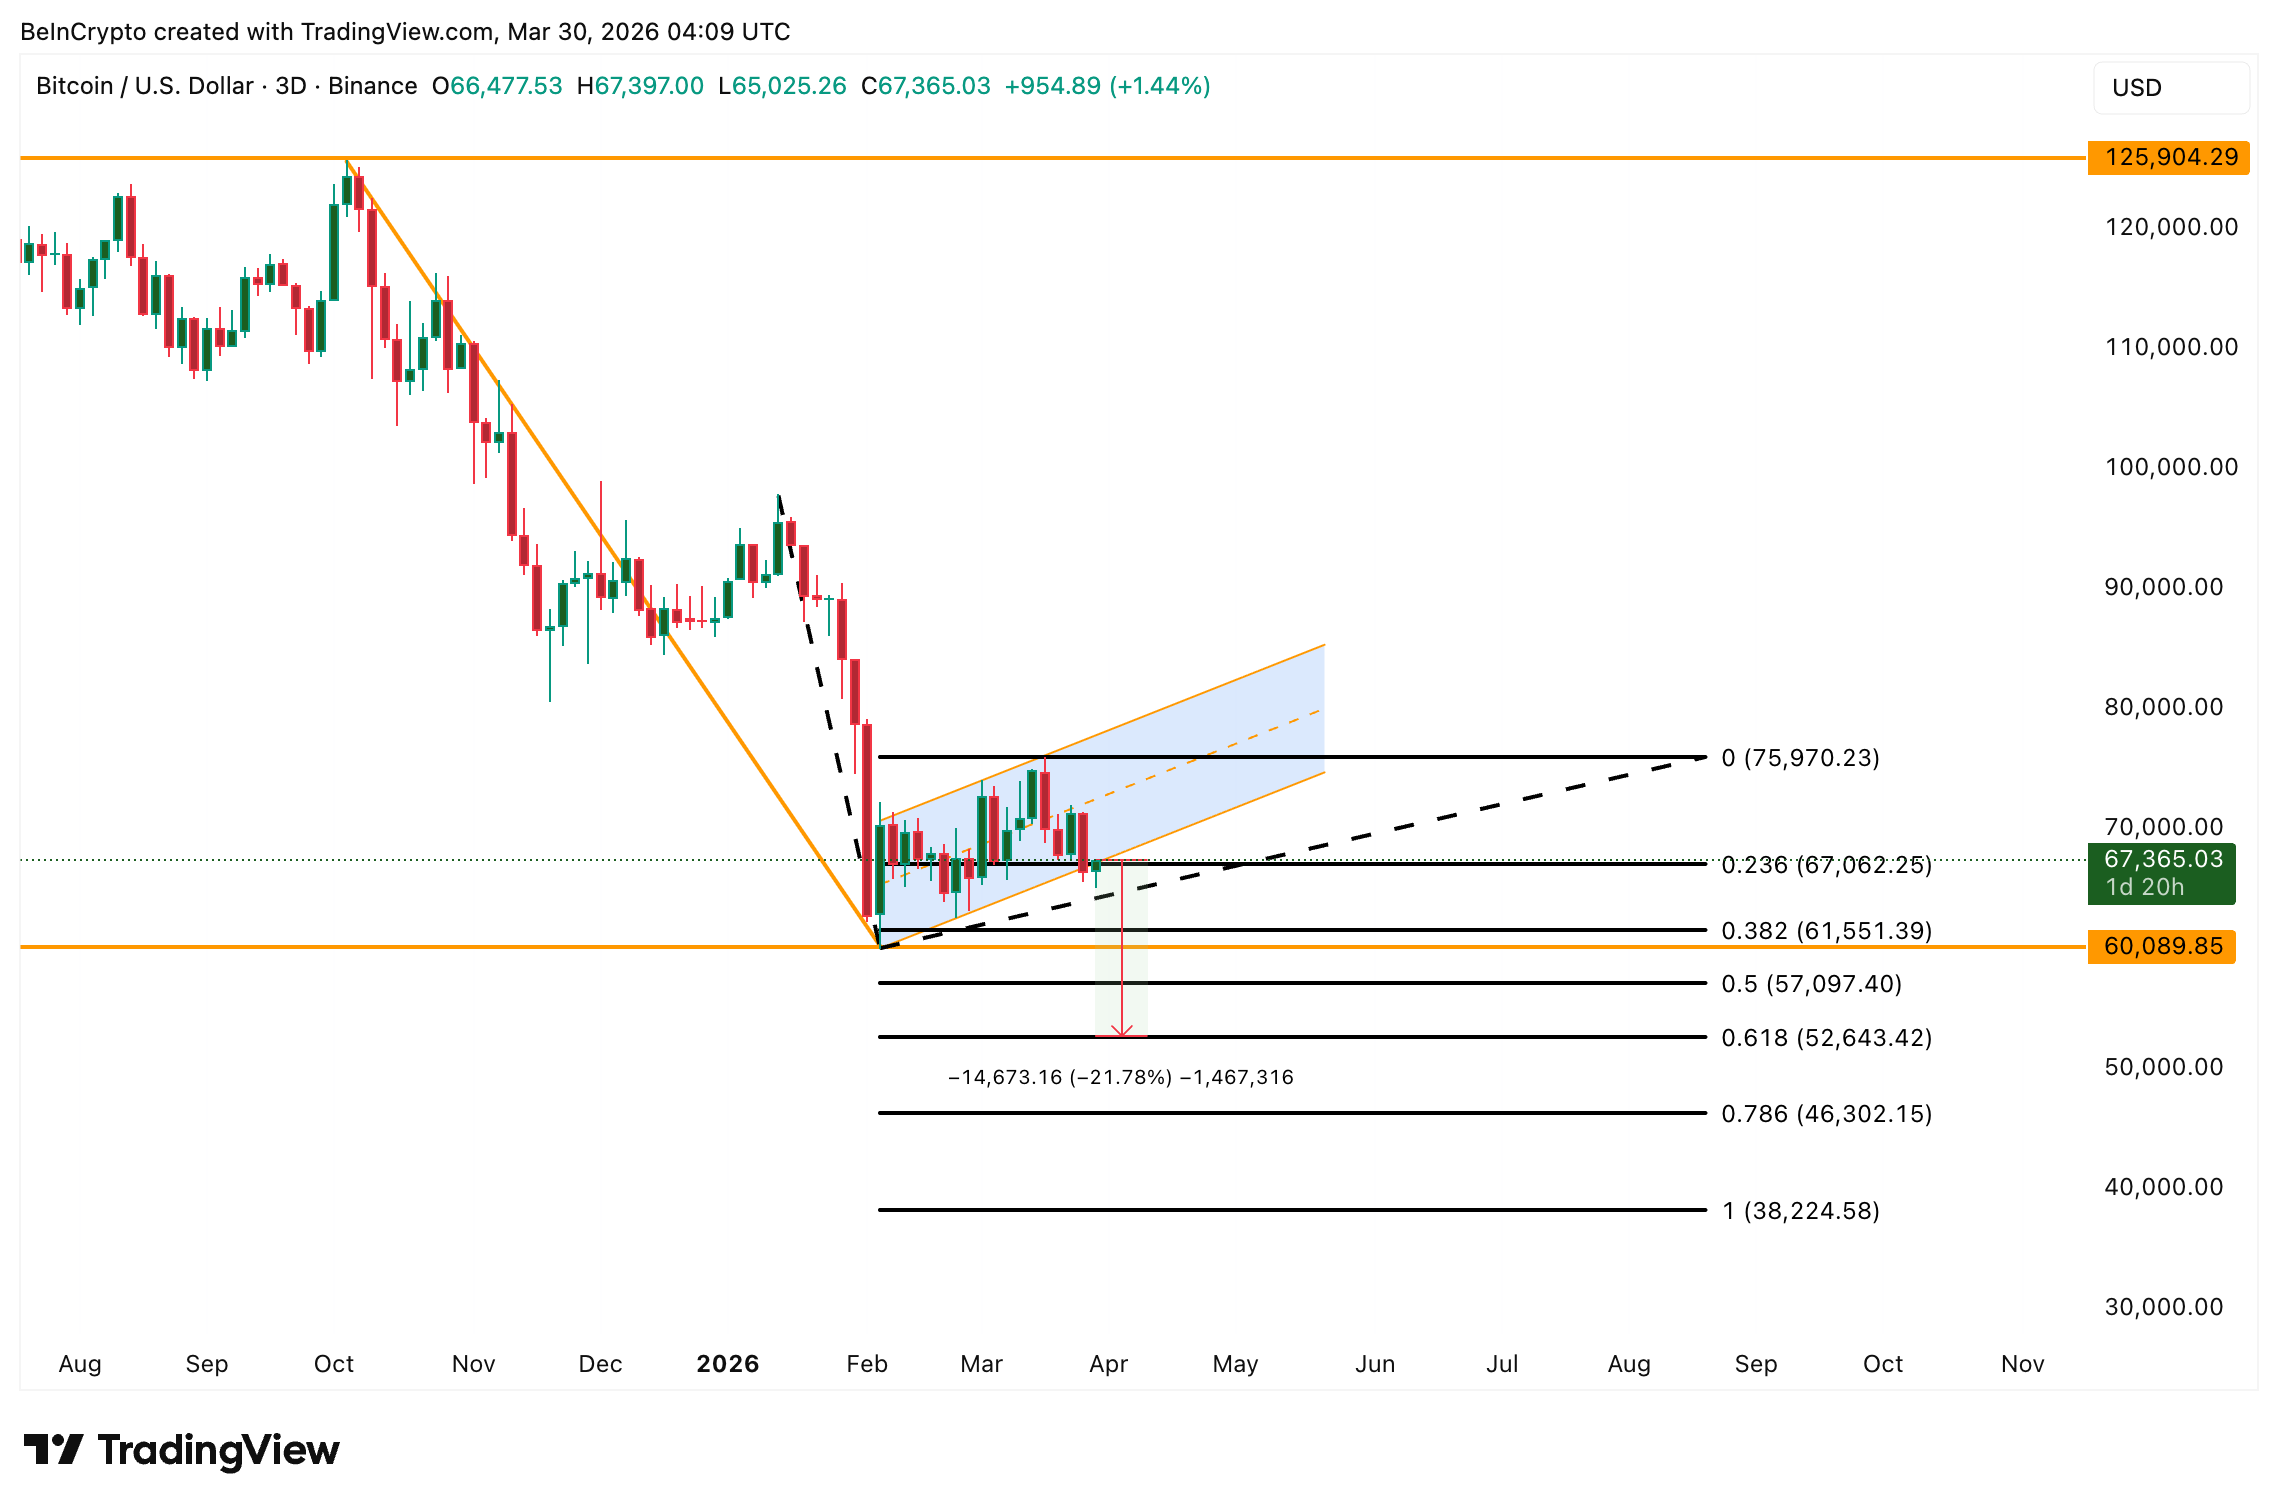
On the upside, strength returns if BTC reclaims and holds above $75,900, the March local high. A move above that would weaken the bear flag structure and shift the Bitcoin price prediction for April from defensive to constructive.
For now, April is about survival above $60,000. The ETFs, the whales, and the 3-day chart all suggest the path of least resistance still points lower.
The post Bitcoin Price Prediction: What To Expect From BTC In April 2026 appeared first on BeInCrypto.
Crypto World
Zoomex Launches Earning Initiative as Inflation Drives Shift Toward Capital Efficiency in Crypto Markets

Crypto exchange Zoomex has introduced a new user initiative focused on its earning products, as rising inflation and uncertain interest rate expectations continue to reshape how traders manage capital across digital asset markets.
The move comes amid a broader shift in investor behavior. With interest rates remaining elevated across major economies and macro conditions becoming less predictable, market participants are increasingly looking beyond trade execution to how capital is managed between positions.
From Market Timing to Capital Efficiency
While volatility remains a defining feature of crypto markets, Zoomex notes that trading activity alone is no longer sufficient in the current environment.
A key issue, according to the platform, is idle capital — funds that remain unutilised outside active positions.
“Traders have traditionally focused on timing the market, but in a high interest rate environment, the bigger question is what happens to capital when it is not being deployed,” said Fernando, Marketing Director at Zoomex.
This dynamic is becoming more visible as users balance short-term trading opportunities with longer holding periods, particularly during phases of macro-driven uncertainty.
Industry Shift: From Fragmented Tools to Integrated Strategies
The growing demand for yield-generating strategies has led many platforms to introduce earning products. However, these offerings are often fragmented, requiring users to move assets across multiple interfaces or sacrifice flexibility for returns.
According to Zoomex, this structure limits capital efficiency and adds operational complexity for users attempting to manage assets dynamically.
Instead, the platform sees trading, strategy, and earning as interconnected components of a broader capital management approach.
A Multi-Layer Approach to Continuous Capital Deployment
Zoomex integrates multiple modes of capital deployment within a single system, allowing users to shift between strategies without transferring funds across products or platforms.
The framework consists of:
- Trading Layer — enabling users to capture market volatility through spot and futures trading
- Strategy Layer — including tools such as grid trading, designed to systematically deploy capital in ranging or uncertain market conditions
- Earning Layer — allowing assets to generate yield when not actively used in trades
Together, this structure supports more continuous capital utilisation, whether through active trading, automated strategies, or passive yield generation.
“The market is no longer just about whether you are in or out of a trade,” Fernando added. “It’s about whether your capital remains productive across different market conditions.”
Beyond trading and earning within the platform, Zoomex is also expanding how capital can be utilized in real-world scenarios through the introduction of the Zoomex Card.
The card enables users to access and spend their digital assets more seamlessly, bridging the gap between on-platform capital management and everyday financial use. By allowing assets to remain connected to the broader Zoomex ecosystem, users can maintain flexibility while extending the utility of their funds beyond trading environments.
This development reflects a broader view of capital efficiency — not only in terms of generating yield or executing trades, but also in enabling liquidity and usability in daily life without unnecessary friction.
Importantly, the system is designed to remain accessible, reducing the need for complex allocation strategies or multi-platform management.
Zoomex Expands Access to Earning Tools Through New User Initiative
As part of this shift, Zoomex has introduced a new user campaign focused on its Earning products, aimed at improving accessibility for users entering the platform.
The initiative is designed to guide users through earning features, providing structured entry points into yield-generating strategies at a time when interest rate considerations are becoming increasingly central to investment decisions.
The company stated that the campaign is intended to simplify onboarding while helping users understand how to balance trading activity with capital efficiency.
Zoomex March New User Benefits |200% APY
Platforms Evolve Into Capital Management Systems
The development reflects a broader transition across the industry, where trading platforms are increasingly evaluated not only on execution performance, but on their ability to support capital management across varying market conditions.
Metrics such as capital utilisation, yield accessibility, and strategy flexibility are becoming more central to how users assess platform value.
Fernando said:
“Users are no longer choosing between trading and earning — they expect both to function seamlessly within the same environment.”
As macroeconomic uncertainty persists, the role of crypto platforms is expected to expand beyond trade execution toward integrated capital management.
In this context, the ability to maintain productive capital allocation — even outside active trading periods — may become a defining factor in how users navigate both volatility and long-term portfolio growth.
Zoomex indicated that its product development will continue to align with this shift, with a focus on enabling more efficient, flexible, and continuous capital strategies for users globally.
About ZOOMEX
Founded in 2021, Zoomex is a global cryptocurrency trading platform with over 3 million users across more than 35 countries and regions, offering 700+ trading pairs. Guided by its core values of “Simple × User-Friendly × Fast,” Zoomex is also committed to the principles of fairness, integrity, and transparency, delivering a high-performance, low-barrier, and trustworthy trading experience.
Powered by a high-performance matching engine and transparent asset and order displays, Zoomex ensures consistent trade execution and fully traceable results. This approach reduces information asymmetry and allows users to clearly understand their asset status and every trading outcome. While prioritizing speed and efficiency, the platform continues to optimize product structure and overall user experience with robust risk management in place.
As an official partner of the Haas F1 Team, Zoomex brings the same focus on speed, precision, and reliable rule execution from the racetrack to trading. In addition, Zoomex has established a global exclusive brand ambassador partnership with world-class goalkeeper Emiliano Martínez. His professionalism, discipline, and consistency further reinforce Zoomex’s commitment to fair trading and long-term user trust.
In terms of security and compliance, Zoomex holds regulatory licenses including Canada MSB, U.S. MSB, U.S. NFA, and Australia AUSTRAC, and has successfully passed security audits conducted by blockchain security firm Hacken. Operating within a compliant framework while offering flexible identity verification options and an open trading system, Zoomex is building a trading environment that is simpler, more transparent, more secure, and more accessible for users worldwide.
For more info: Website | X | Telegram | Discord
The post Zoomex Launches Earning Initiative as Inflation Drives Shift Toward Capital Efficiency in Crypto Markets appeared first on BeInCrypto.

Key Highlights
- The premier DeFi lending platform Aave has deployed to X Layer, the Ethereum Layer 2 network developed by OKX
- Users of OKX Wallet gain immediate access to lending and borrowing functionality without cross-chain asset transfers
- Available assets on X Layer include USDT0, xBTC, xETH, xSOL, with loan-to-value ratios reaching 88% for certain liquid staking token pairs
- With $23.5 billion in TVL, Aave recently achieved the milestone of $1 trillion in aggregate lending volume
- This marks Aave’s 21st blockchain deployment, expanding beyond networks like Ethereum, Arbitrum, and Base
The world’s leading decentralized lending platform, Aave, has officially deployed on X Layer, OKX’s Ethereum Layer 2 solution. This integration provides OKX Wallet users with seamless access to onchain financial services without requiring external wallets or asset bridging between networks.
The cryptocurrency exchange OKX confirmed the integration on Monday. Through the native wallet interface, users can now deposit assets, take out collateralized loans, and generate auto-compounding returns.
“The deployment to X Layer delivers proven, reliable infrastructure to OKX’s Layer 2 environment—fully permissionless, self-custodial, and integrated directly within OKX Wallet,” the exchange stated in an official announcement.
Stani Kulechov, who founded Aave Labs, shared his perspective on the deployment. “This expansion to X Layer bridges Aave’s deep liquidity with an emerging network of users and decentralized applications, simplifying the process of earning yields, borrowing funds, and developing on the platform,” Kulechov explained.
The deployment supports multiple digital assets including USDT0, USDG, GHO, xBTC, xETH, xSOL, xBETH, and xOKSOL. The platform operates without traditional credit verification or centralized intermediaries.
X Layer’s Expanding DeFi Infrastructure
X Layer went live in May 2024. The network currently maintains approximately $25 million in total value locked. Transaction costs average just $0.0005, with blocks produced every second.
Several established DeFi platforms have already integrated with X Layer, including Uniswap, Chainlink, and Stargate. Aave represents the most significant protocol integration thus far.
The Layer 2 network has implemented six specialized “eModes” optimized for its asset composition. These configurations enable loan-to-value percentages as high as 88% for specific liquid staking token combinations.
This development aligns with OKX’s strategic initiative to incorporate DeFi capabilities directly into its wallet infrastructure, mirroring approaches from rivals such as Coinbase and Binance. Last November, OKX introduced integrated DEX trading functionality for Base, Solana, and X Layer within its wallet.
Aave’s Performance Metrics and Growth
Aave maintains approximately $23.5 billion in total value locked distributed across over 20 different blockchain networks. This figure exceeds its nearest rival, Morpho, by more than three times—Morpho currently holds around $10 billion.
In late February, the protocol achieved a historic milestone by surpassing $1 trillion in total lending volume, becoming the first DeFi platform to reach this benchmark.
Revenue generation for Aave topped $6.2 million over the past 30 days, outpacing Morpho’s earnings by more than five times during the identical timeframe.
Cumulative net deposits across Aave exceed $40.4 billion. X Layer represents the protocol’s 21st blockchain integration.
This launch follows an overwhelmingly positive Aave DAO governance vote approving the Version 4 mainnet roadmap, demonstrating ongoing development momentum throughout the protocol ecosystem.

Quick Overview
- XRP serves primarily as a payments and cross-border transaction solution, creating a specialized but limited application
- Solana functions as a versatile blockchain platform supporting DeFi, NFTs, gaming, stablecoins, and Web3 applications, providing diverse expansion opportunities
- Ripple’s substantial XRP reserves continue raising questions among investors monitoring long-term token distribution
- Solana demonstrates superior developer engagement, typically indicating healthier long-term ecosystem vitality
- Both assets involve risk factors, though Solana’s diversified ecosystem provides additional avenues for sustainable growth
When evaluating long-term cryptocurrency investments, XRP and Solana consistently emerge as two of the most discussed assets. Each boasts substantial communities, practical applications, and significant growth potential. However, their fundamental architectures serve distinctly different objectives, making this distinction critical for investors planning three to five-year positions.

Ripple developed XRP specifically for facilitating rapid, cost-effective international money transfers. Conversely, Solana emerged as a comprehensive blockchain infrastructure supporting applications, decentralized finance, trading platforms, and digital asset creation. This fundamental distinction influences every aspect of their respective long-term performance trajectories.
XRP’s primary advantage lies in its focused mission. Ripple has dedicated years cultivating partnerships with banking institutions and payment service providers. This strategic positioning gives XRP legitimate utility within the cross-border finance sector.
Should blockchain-based settlement systems gain widespread adoption among financial institutions, XRP stands positioned to capture significant value. This represents a credible scenario driving many investors’ continued confidence in the asset.
The limitation, however, centers on XRP’s dependence on this singular growth corridor. Should institutional adoption proceed slower than anticipated, investor returns may fall short of expectations.
Solana’s Multi-Faceted Ecosystem Strategy
Unlike XRP’s specialized focus, Solana isn’t confined to a single application. The platform accommodates decentralized financial protocols, stablecoin infrastructure, NFT marketplaces, blockchain gaming, consumer-facing applications, and tokenized traditional assets.
This diversification creates multiple parallel growth trajectories. When activity decreases in one vertical, momentum in alternative sectors can sustain network demand and token value.
Developer engagement represents another domain where Solana demonstrates competitive superiority. Blockchains maintaining robust builder communities typically sustain relevance longer, as developers generate the applications attracting end users.
Elevated developer activity frequently serves as a predictive indicator of sustained platform viability. Measured against this criterion, Solana currently maintains a noticeable advantage over XRP.
Supply Economics and Investment Considerations
XRP employs a transparent supply mechanism. The token doesn’t utilize mining-based inflation, and minuscule amounts of XRP are destroyed with every transaction.
Nevertheless, Ripple’s substantial XRP treasury represents a persistent consideration for certain investors. This lingering supply overhang can constrain confidence regarding long-term price appreciation potential.
Solana incorporates inflationary mechanics into its economic design. However, this inflation receives partial counterbalancing through staking incentives and expanding on-chain economic activity.
As network utilization accelerates, organic demand for Solana can increase through transaction fees and ecosystem expansion. This dynamic provides more fundamental support for the token’s valuation over extended timeframes.
XRP’s primary uncertainties revolve around corporate adoption rates and regulatory framework development. Solana’s challenges relate more to technical execution and network stability, areas that have historically presented concerns.
Solana has recently maintained ecosystem momentum through additional stablecoin partnerships and consumer-oriented product launches, sustaining developer interest as 2025 approaches.
Investment Perspective
For investors prioritizing long-term positioning, Solana presents the more compelling platform investment thesis. While XRP maintains legitimate value within payments and settlement infrastructure, Solana’s expansive ecosystem architecture provides substantially more pathways for sustainable growth.
Key Takeaways
- ETH maintains position near $2,000 following rejection from $2,372 peak recorded earlier this month.
- Long/short ratio reaches 2.4, creating potential squeeze risk as price action remains stagnant.
- Ethereum ETFs listed in the U.S. experienced $92.5 million in withdrawals on March 26.
- Market volatility increased following $14.16 billion Bitcoin options expiration and heightened geopolitical concerns.
- Critical resistance zone positioned at $2,138–$2,151, while breach below $1,980 may trigger deeper corrections.
Ethereum currently changes hands around $2,048 as market participants attempt to defend the psychologically significant $2,000 threshold. Following a rally earlier this month, the cryptocurrency encountered strong resistance approaching $2,372. Subsequently, ETH has remained confined within a consolidation range spanning $1,900 to $2,200.
The asset trades beneath its 50-day exponential moving average positioned at approximately $2,160 and significantly under the 100-day EMA hovering near $2,420. This positioning reinforces a prevailing bearish technical structure.
Daily chart analysis reveals the RSI hovering around 44, registering below the neutral threshold of 50. Meanwhile, the MACD indicator remains beneath its signal line while drifting toward the zero mark. These technical signals collectively suggest diminishing bullish momentum.
Market observers are paying particular attention to the long/short ratio, which has escalated to approximately 2.4. This metric indicates that traders are predominantly positioning for upward movement. However, price action has failed to confirm this sentiment.
An accumulation of long positions without corresponding price appreciation often generates what market participants refer to as a “crowded trade.” Such conditions frequently precipitate a long squeeze scenario, wherein abrupt downward movement compels leveraged long holders to liquidate positions, amplifying downside momentum.
Institutional Withdrawals and Broader Market Dynamics
Data from March 26 shows U.S.-listed Ethereum ETFs registering $92.5 million in net withdrawals. These redemptions occurred within a broader pattern of outflows affecting cryptocurrency exchange-traded products.
According to SoSoValue data, on March 27 (ET), U.S. Bitcoin spot ETFs recorded a total net outflow of $225 million. Meanwhile, Ethereum spot ETFs saw a total net outflow of $48.54 million, marking an eight-day streak of net outflows. pic.twitter.com/ell1RDmAqI
— Wu Blockchain (@WuBlockchain) March 28, 2026
The preceding day witnessed a historic $14.16 billion in Bitcoin options reaching expiration on March 27. Substantial options expiry events frequently introduce volatility into cryptocurrency markets, and this occurrence contributed additional selling momentum across digital assets.
Macroeconomic and geopolitical developments further influenced market sentiment. Escalating crude oil valuations, connected to Iran’s warnings regarding a critical shipping corridor, intensified inflation anxieties. Such conditions typically create headwinds for risk-oriented assets including Ethereum.
Critical Price Thresholds for Traders
Examining resistance levels, $2,138 represents the 23.6% Fibonacci retracement calculated from the $3,402 peak down to the $1,747 trough. The Ichimoku Kijun indicator establishes another barrier at $2,151, with market participants monitoring a decisive close above this region as a potential catalyst for advancement toward $2,380.
Regarding support zones, initial downside defense stands at $1,990. Beneath this threshold, the channel bottom resides near $1,748. A confirmed breakdown through this area could accelerate bearish momentum.
Technical projections suggest ETH will likely consolidate between $1,980 and $2,170 throughout the upcoming five-session period, with probability calculations indicating less than 20% likelihood of upward price movement.
Ethereum $ETH faces a major test at $1,800! pic.twitter.com/7Jv5c8gTI3
— Ali Charts (@alicharts) March 30, 2026
Market analyst Ali Charts communicated via X that Ethereum confronts a “major test at $1,800,” indicating certain technical observers anticipate the possibility of substantially lower price levels should current support structures fail.
Separately, analyst Tom Lee has projected Ethereum could ultimately achieve $62,000, although this long-term forecast lacks a specific timeframe for realization.
With Ethereum ETF withdrawals reaching $92.5 million on March 26, ETH remains anchored near $2,000 while technical indicators continue signaling near-term vulnerability.

The Ethereum Foundation (EF) staked roughly $46.2 million worth of Ether (ETH), according to on-chain data from Arkham Intelligence. The deposit is the organization’s single-largest staking event.
The transaction marks a sharp acceleration in the Foundation’s treasury staking initiative, which launched in late February with an initial deposit of just 2,016 ETH worth approximately $3.8 million.
EF Moves From First Deposit to Record Stake
The EF announced its staking plans on February 24, 2026, outlining a target of approximately 70,000 ETH.
That initial deposit was modest, but the Foundation signaled from the start that further allocations would follow.
At current prices near $2,000 per ETH, the full 70,000 ETH target represents more than $140 million in staked capital.
The $46.2 million deposit reported by Arkham today brings the program significantly closer to that goal.
On-chain tracker Lookonchain also flagged the transaction, noting it surpassed all previous EF staking events by a wide margin.
Why the Foundation Is Staking Instead of Selling
For years, the EF relied on periodic ETH sales to fund operations, a practice that drew consistent criticism from the community.
Every sale created downward price pressure and sparked speculation about the organization’s long-term commitment.
The shift to staking addresses both concerns.
- By locking ETH into validators, the Foundation generates yield without reducing its treasury balance.
- Staking rewards flow back into the treasury to fund protocol research, ecosystem development, and community grants.
The program uses open-source tools from Attestant, acquired by Bitwise Asset Management in 2024. The infrastructure employs distributed signing across multiple jurisdictions and minority validator clients to reduce single points of failure.
Ethereum currently has more than 38 million ETH staked across roughly 1.17 million validators, representing about 30% of the total circulating supply.
A Stronger Signal at a Difficult Time
The record deposit arrives during a turbulent stretch for ETH. Prices fell sharply in early 2026, from above $4,800 in late 2025 to a low near $1,473 in February.
Co-founder Vitalik Buterin sold millions in personal ETH holdings during that period, amplifying community anxiety.
Against that backdrop, the Foundation’s willingness to commit its largest single staking deposit sends a different signal.
Rather than preserving maximum liquidity, the organization is tying up capital directly in network security.
Whether additional deposits follow at this pace will determine how quickly the EF reaches its 70,000 ETH target and how much yield it can generate going forward.
The post Ethereum Foundation Breaks Its Own Record With a $46.2 Million ETH Staking appeared first on BeInCrypto.


Walmart-owned OnePay has added more than a dozen crypto tokens to its platform in response to growing demand from its customers.
Summary
- OnePay expanded its crypto offering with more than a dozen tokens including SUI, Polygon, and Arbitrum following earlier listings such as Solana and Cardano.
- The Walmart-backed platform is building out a super app strategy after launching crypto support with Bitcoin and Ethereum in January.
In an announcement shared with crypto media, OnePay said its offering now includes tokens such as SUI (SUI), Polygon (POL), and Arbitrum (ARB), just days after listing Solana (SOL), Cardano (ADA), Bitcoin Cash (BCH), and PAX Gold (PAXG).
As previously reported by crypto.news, OnePay first announced plans to expand into digital assets last year in a bid to position itself within the emerging “super app” model. The platform subsequently launched in January this year with Bitcoin (BTC) and Ethereum (ETH) as its initial offerings.
“We plan on continuing to expand thoughtfully, prioritizing assets that meet a high bar: demand, liquidity, regulatory clarity and long-term utility,” Ron Rojany, OnePay’s general manager, said in a statement.
According to Rojany, the company intends to focus on building a curated set of assets that aligns with how customers use and manage their money, rather than chasing short-term trends.
OnePay currently offers a digital wallet that customers can use at checkout in Walmart stores and on the company’s website, alongside a broader suite of financial services.
Besides OnePay, a number of other financial and technology giants are racing to develop their own “everything” superapp that would integrate several financial services, including trading, banking, and social networking, into a single platform.
For instance, Coinbase CEO Brian Armstrong recently said that the company was prioritizing the creation of an “everything exchange.” By leveraging its Base network, Coinbase intends to serve as both a consumer-facing gateway and the underlying infrastructure for the broader on-chain economy.
Similarly, Startale Group has launched a super app on Ethereum’s Layer 2 infrastructure to serve as a unified entry point for Sony’s Soneium ecosystem, enabling users to participate in token generation events, airdrops, and reward programs through a single platform.
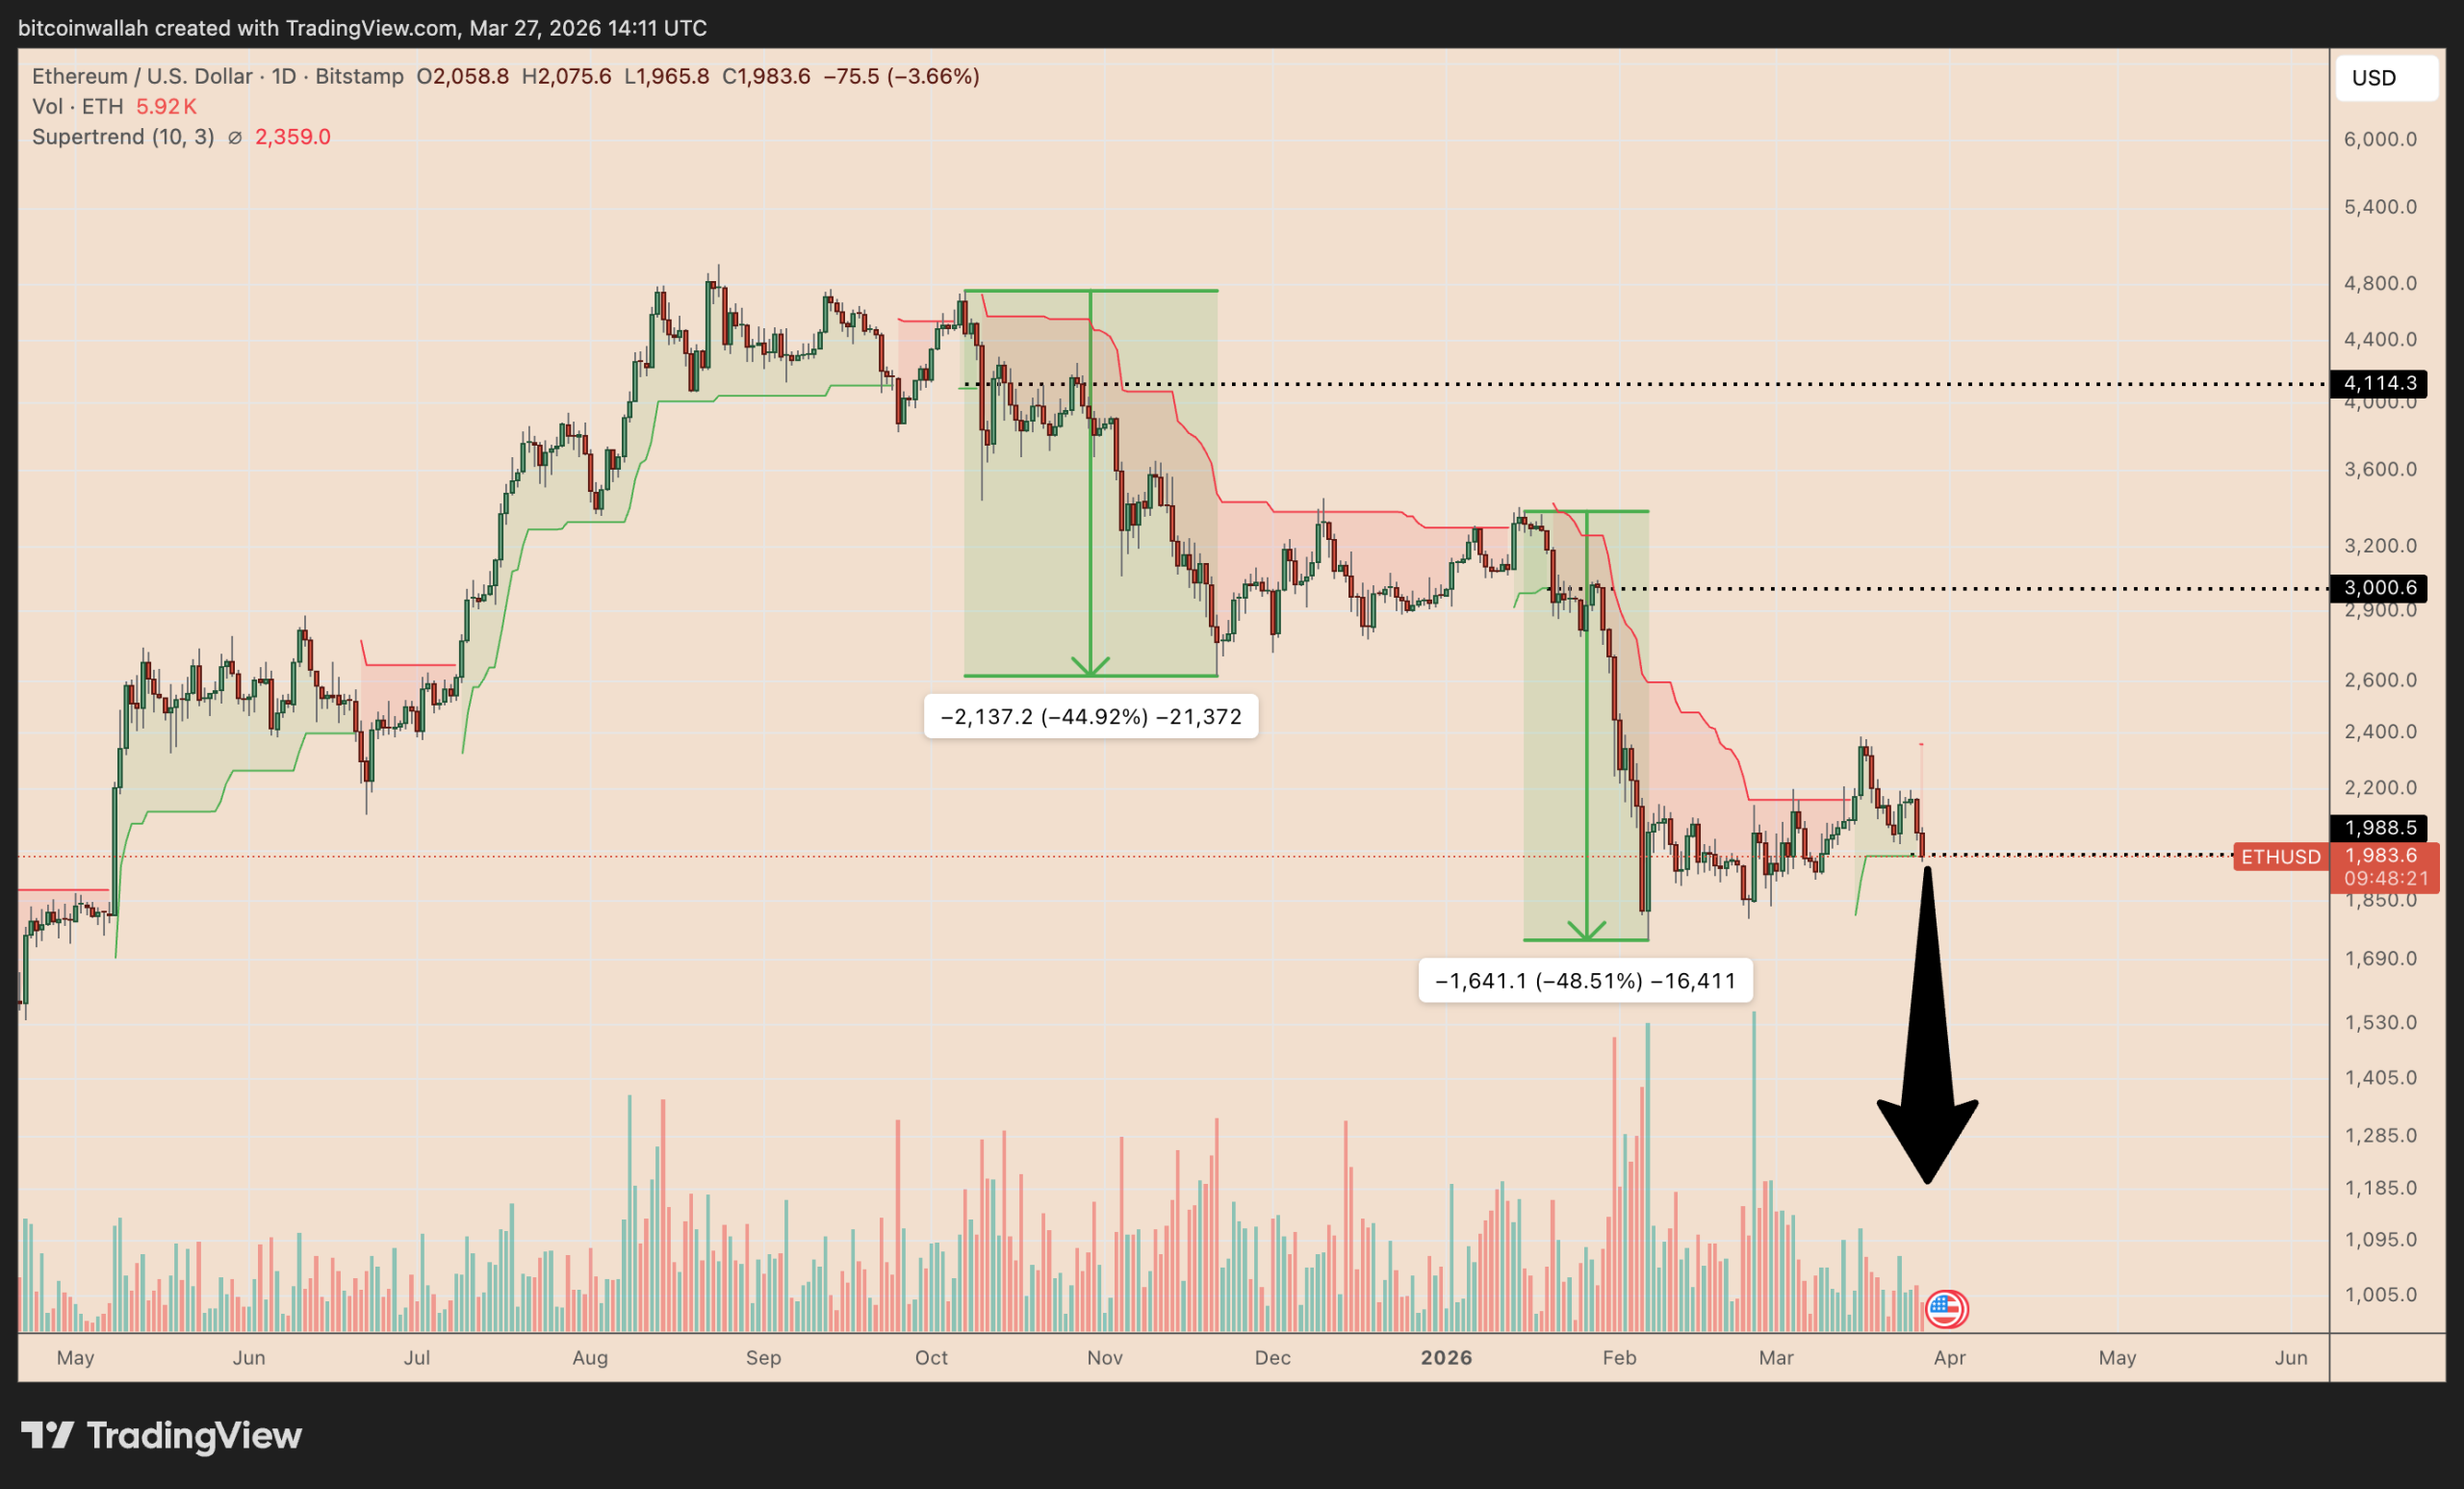
Ethereum’s native token, Ether (ETH), may decline 40% to $1,200 in the coming weeks, according to a fractal setup shared by analyst Leshka.eth.
Key takeaways:
Ethereum setup flashes bull trap warning
Ethereum’s $1,200 downside target comes from a Supertrend setup on the daily chart, where two earlier bullish flips failed and led to steep breakdowns.
The Supertrend is a simple trend-following line plotted directly on the price chart. It changes color to show the current market direction: green when the trend is rising and red when the trend is falling.
ETH flashed similar bullish flips in October 2025 and January 2026, but neither held.

In both cases, the price moved above the Supertrend’s upper band, which then started acting as support. Once ETH lost that support, the recovery unraveled and the price dropped 45% and 48%, respectively.
“Now the same setup is forming at $1,990,” said Leshka.eth, adding:
“If that level breaks, the next target is the $1,200 zone.”
That aligns with the measured downside target of Ethereum’s prevailing bear flag pattern, as shown below.

The bearish setups are taking shape as Ethereum gives back its March gains against a worsening macro backdrop.
Related: Ether traders see ‘further decline’ as ETH price slips below $2K
Risk appetite has weakened alongside the US–Israel and Iran war, recession fears have risen, and bond traders no longer expect the Fed to cut rates before December 2027.

ETH has fallen more than 17% from its monthly high from over two weeks ago. US spot Ether ETFs have seen roughly $300 million in net outflows over the same stretch.
The apparent demand for Ethereum has also slipped to its lowest in 16 months.
ETH holder accumulation remains weak
Ethereum’s latest rebound has not triggered broad-based accumulation across major wallet cohorts, Glassnode data shows.
For instance, the number of mega-whale wallets holding more than 10,000 ETH has flattened after peaking in late 2025, while the 30-day change has only just crawled back toward neutral after months of decline.

In other words, the biggest holders have not been accumulating aggressively.
The picture looks similar among smaller wallet cohorts.
Ethereum whales holding 1,000 to 10,000 ETH remain below their late-2025 highs, with the 30-day change hovering around flat to slightly negative levels.

Shark addresses holding 100 to 1,000 ETH also continue to trend well below last year’s peaks, suggesting that mid-sized and smaller large holders have not returned as strong buyers either.
Taken together, the data suggest ongoing distribution and weak conviction across key ETH holder cohorts, reinforcing the risk of a deeper drop if $1,990 breaks.
As Cointelegraph reported, one of the few bullish signs for Ethereum include the increasing amount of Ether staked and supply on exchanges falling to ten-year lows.
This article is produced in accordance with Cointelegraph’s Editorial Policy and is intended for informational purposes only. It does not constitute investment advice or recommendations. All investments and trades carry risk; readers are encouraged to conduct independent research before making any decisions. Cointelegraph makes no guarantees regarding the accuracy or completeness of the information presented, including forward-looking statements, and will not be liable for any loss or damage arising from reliance on this content.

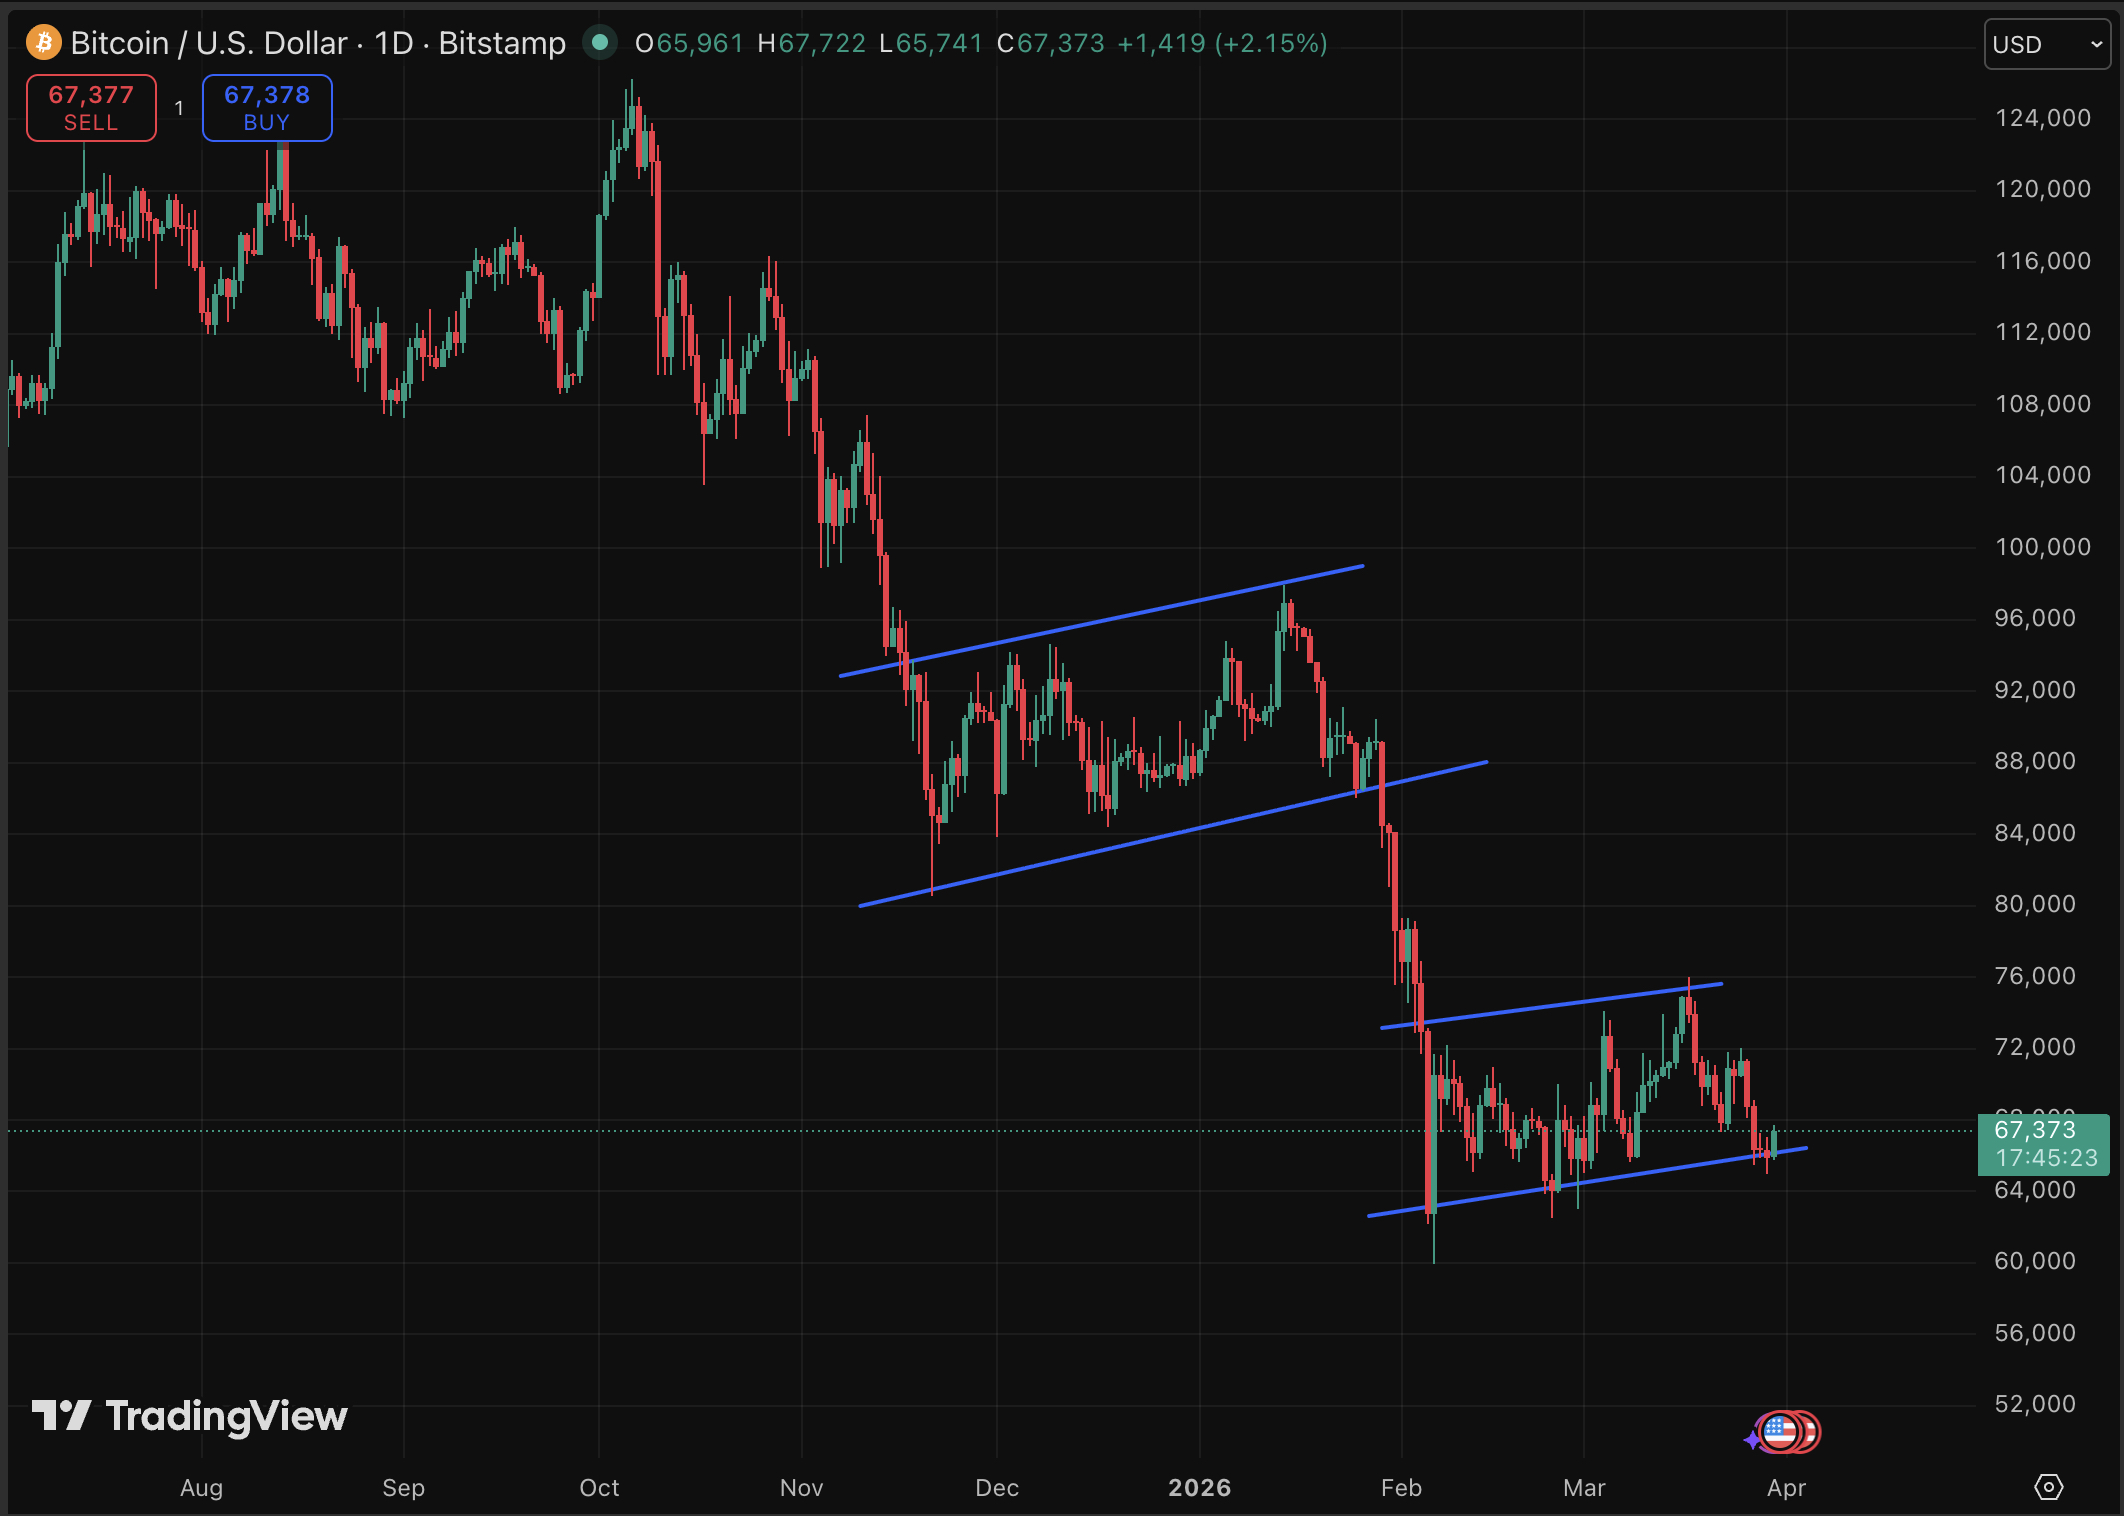
Why is Crypto Up? BTC just bounced above $67,000 from a $65,000 low, a 1.1% run on the day, clinging to gains that look thin against a backdrop of six consecutive red monthly closes.
March has been a grind. Bitcoin ranged from $65,000 on March 2 to a high of $75,000 on March 17, before sliding back to $68,000 by March 23 as U.S.-Iran geopolitical tensions amplified sell pressure. A record $14+ billion in options expiry compounded the volatility, forcing liquidations across the board.
Robinhood’s prediction market for BTC price shows contract activity concentrated at sub-$57,300 levels, a quiet but telling signal of where crowd sentiment actually sits. ETF inflows remain a counterweight, but geopolitical risk is winning the narrative for now. That tension between institutional demand and macro fear sets up a price structure that deserves close attention.
Discover: The best crypto to diversify your portfolio with
Really, Why is Crypto Up? Can Bitcoin Break $120K or Is This A Dead Cat Bounce?
At $67,000, Bitcoin holds a 2.5% gain over 30 days, a move that looks impressive until you stack it against the six red months. The short-term picture is murkier. The March low at $65,000 end of last week, driven by tension-led selling, now serves as the key structural support.
Resistance sits at the $74,400 March high, with it also acting as the psychological ceiling that traders are watching in real time.
Momentum is consolidating rather than accelerating. Volume has not confirmed the weekly uptick, and the slight intraday jump suggests buyers aren’t pressing hard. Rising Treasury yields continue to drain risk appetite, capping upside for speculative assets across the board.
#BTC is showing a key structural signal: — KriptoHolder
Price is rising while Open Interest is declining.
This indicates that the move is not driven by new long positions, but by short liquidations.
• Short squeeze is active
• The market is moving up by clearing out short positions
• Spot… https://t.co/iguy1aboCc pic.twitter.com/KwWEk78NYo
 (@kriptoholder) March 30, 2026
Three scenarios are in play. BTC could hold above $65,000 into the weekly close, ETF flows accelerate, and a push back toward $72,000 becomes viable within days. A rangebound chop between $65,000 and $68,000 could also persist through April as macro uncertainty lingers. But a daily close below $69,000 would invalidate the near-term bullish structure entirely, reopening a retest of March lows.
Extreme Fear sentiment, as flagged by multiple analysts, remains a drag that technical levels alone cannot override.
Discover: The best pre-launch token sales
LiquidChain Targets Early-Mover Upside as Bitcoin Tests Key Levels
Six red months compress capital and patience simultaneously. Traders holding blue-chip positions through this drawdown are questioning whether the next leg up rewards spot holders or whether early-stage infrastructure plays capture more asymmetric upside at this point in the cycle.
LiquidChain ($LIQUID) is a Layer 3 infrastructure project positioning itself as the cross-chain liquidity layer, fusing Bitcoin, Ethereum, and Solana liquidity into a single execution environment. Developers deploy once and access all three ecosystems through a Unified Liquidity Layer, Single-Step Execution, and Verifiable Settlement architecture.
A new layer emerges. Only a few see it first. — LiquidChain (@getliquidchain) March 24, 2026
The future is LiquidChain  ⟁https://t.co/vqvBcdSj94 pic.twitter.com/R7ZeZ0NPGl
That’s a direct response to the fragmentation that makes cross-chain DeFi unnecessarily expensive and slow. The presale is priced at $0.0144, with more than $600K raised to date, early-stage by any measure, especially with 1700% APY rewards as a bonus.
For traders navigating a market that keeps delivering red closes, researching LiquidChain may be worth the time before the presale price moves.
This article is not financial advice. Crypto assets are highly volatile. Always conduct your own research before investing.
The post Why Is Crypto Up? Six Straight Red Months Despite Today’s Bounce appeared first on Cryptonews.

Sharples School head of history is a real inspiration to pupils
M5 junction upgrade expected to unlock 20,000 homes by 2029

Why is the crypto market recovering today? (March 30)


-
 NewsBeat5 days ago
Manchester United reach agreement with Casemiro over contract clause amid transfer speculation
-

 News Videos4 days ago
Parliament publishes latest register of MPs’ financial interests
-

 Sports7 days ago
Gary Kirsten Accuses Pakistan Cricket Board Of ‘Interference’, Mohsin Naqvi Responds
-

 Sports7 days ago
Remo Stars and Kano Pillars Strengthen Survival Hopes in NPFL
-

 NewsBeat2 days ago
The Story hosts event on Durham’s historic registers
-

 Business3 days ago
Instagram, YouTube Found Responsible for Teen’s Mental Health Struggle in Historic Ruling
-

 News Videos7 days ago
Ch 9 Financial Management Part 1 | Detailed One Shot | Class 12 Business Studies Boards 2026
-
 NewsBeat5 days ago
Tesco is selling new Cadbury Dairy Milk bar and people can’t wait to try it
-
 Entertainment7 days ago
Cynthia Bailey Dishes on ‘RHOA’ Season 17, Discusses Kandi
-

 Tech7 days ago
Samsung will soon let you control smart home devices from your car’s dashboard
-
 Entertainment1 day ago
Lana Del Rey Celebrates Her Husband’s 51st Birthday In New Post
-
 NewsBeat7 days ago
Colombian military plane with 110 soldiers onboard crashes following takeoff
-

 Business6 days ago
More women enter wealth management, but few in advisory roles: study
-

 Fashion6 days ago
Does It Matter What You Wear When You’re Laid Off and Looking?
-

 Fashion7 days ago
Fringe Bags for the Season
-

 NewsBeat5 days ago
Entrepreneurs Forum survey reveals optimism in North East
-

 Business6 days ago
Late-paying firms face multimillion-pound fines under new crackdown
-

 Politics6 days ago
How Media Platforms Balance Performance and Accessibility in Image Delivery
-

 Sports5 days ago
Fantasy Baseball Week 1 Preview: Top sleeper hitters for both five- and 12-day period led by Munetaka Murakami
-
 NewsBeat6 days ago
NASA Artemis II Astronauts enter 14-Day quarantine as moon rocket reaches launchpad
You must be logged in to post a comment Login