
Crypto World
Kraken’s SPAC KRAKacquisition Corp Closes $345M IPO, Joins Nasdaq

TLDR
- KRAKacquisition Corp completed an upsized $345 million IPO, surpassing its initial target of $250 million.
- The company’s units began trading on Nasdaq on January 28 under the ticker KRAQU.
- Each unit consists of one Class A ordinary share and one-quarter of a redeemable warrant.
- Kraken, along with Natural Capital and Tribe Capital, sponsors the blank-check company.
- The offering included 34.5 million units, with 4.5 million sold through the exercise of the underwriter’s overallotment option.
KRAKacquisition Corp, a special purpose acquisition company (SPAC) backed by Kraken, has raised $345 million through its upsized initial public offering (IPO). The offering, which was completed on January 28, marks the company’s debut on the Nasdaq Global Market under the ticker symbol KRAQU. The deal exceeded initial expectations, raising more than originally planned, as investor demand led to an upsized offering.
The IPO included 34.5 million units, each priced at $10, with 4.5 million units sold following the exercise of the underwriter’s overallotment option. Gross proceeds reached $345 million before fees and expenses, far surpassing the initial target of $250 million. Kraken, an affiliate of Natural Capital and Tribe Capital, sponsors the blank-check company, which intends to pursue a future merger or acquisition.
KRAKacquisition’s Nasdaq debut
KRAKacquisition Corp’s units began trading on January 28 under the ticker KRAQU. The offering comprised units, each consisting of one Class A ordinary share and one-quarter of a redeemable warrant. Once the units separate, the shares will trade under the symbol KRAQ, and the warrants will trade as KRAQW. Each full warrant is exercisable at $11.50 per share.
Santander US Capital Markets served as the sole underwriter for the offering. A registration statement for the IPO became effective on January 27. “The IPO was completed successfully, thanks to strong demand from investors,” said the company in a press release.
Kraken’s strategy with SPAC-backed listing
KRAKacquisition Corp is sponsored by an affiliate of Kraken, which aims to assess potential merger or acquisition targets over time. The structure of the SPAC allows the company to hold capital in trust while maintaining the flexibility to pursue future transactions. Kraken and its partners are keeping their options open while awaiting the right opportunity for a potential deal.
The decision to use a SPAC route reflects Kraken’s strategic approach, as the company has not yet identified a specific target.


Crypto World
Tokenized Commodities Push Crypto Platforms Into Direct Competition With Traditional Finance

Key Takeaways
-
Digital asset perpetual contracts expand market presence as legacy financial venues experience declining share in commodities
-
Blockchain-based silver contracts reach 40% of conventional futures market benchmark trading volumes
-
Insufficient market depth maintains legacy systems’ competitive advantage despite cryptocurrency sector expansion
-
Round-the-clock access provides digital platforms competitive differentiation versus traditional exchange operating schedules
-
Price discovery challenges hinder widespread acceptance of blockchain-based metals instruments
Digital asset trading venues are experiencing substantial expansion within commodities sectors, gradually capturing volume from conventional financial platforms while transforming worldwide market accessibility. Nevertheless, traditional institutions maintain leadership positions through superior market depth and established pricing mechanisms. Blockchain-based commodity instruments demonstrate continued expansion, yet structural constraints impede faster integration across conventional finance participants.
Blockchain-Based Commodity Products Show Strong Market Traction
Crypto exchanges are experiencing accelerated expansion across tokenized commodity sectors, mounting a credible challenge to traditional finance’s long-standing control of derivatives trading. Particularly noteworthy, perpetual silver contracts have achieved substantial trading activity when measured against conventional futures exchange benchmarks. Consequently, digital platforms persistently attract participants seeking ongoing market participation outside traditional exchange operating windows.
Throughout recent trading periods, blockchain-based silver instrument volumes have risen dramatically compared to conventional futures marketplace activity. This development signals growing appetite for adaptable trading solutions absent from traditional financial infrastructure. Additionally, cryptocurrency platforms capitalize on continuous availability, whereas legacy markets face constraints imposed by predetermined operating schedules.
Perpetual gold derivatives have similarly exceeded trading volumes on multiple regional conventional exchanges during recent measurement periods. This expansion demonstrates how digital platforms are progressively increasing their footprint within commodity markets historically controlled by traditional finance. Nonetheless, legacy institutions preserve commanding positions through well-established operational frameworks and established credibility.
Market Depth and Price Discovery Sustain Traditional Finance Leadership
Blockchain-based commodity instruments encounter ongoing obstacles that restrict their competitive positioning against conventional marketplace infrastructure. Available liquidity remains substantially thinner compared to traditional platforms, which leverage centralized settlement frameworks. As a result, price inconsistency issues persist, affecting operational efficiency relative to established financial standards.
Crypto markets function without interruption, contrasting with traditional exchanges that suspend operations during weekends and recognized holidays. This operational distinction generates volatility exposure and diminished price benchmarking during periods when conventional venues remain closed. Legacy financial structures continue delivering stability through synchronized trading sessions and aggregated liquidity resources.
Traditional financial markets sustain greater credibility through validated reserve attestations and uniform contractual specifications. Cryptocurrency trading venues currently lack uniform verification protocols matching transparency benchmarks established by conventional finance. Institutional capital allocation remains predominantly channeled within traditional environments notwithstanding emerging digital alternatives.
Operational Evolution Underscores Intensifying Market Competition
Cryptocurrency perpetual futures instruments maintain upward momentum as substitutes for traditional derivatives offerings. These products remove expiration constraints, delivering streamlined exposure compared to conventional futures agreements. Consequently, market participants increasingly embrace digital solutions while maintaining connections to established traditional instruments.
Trading analytics demonstrate robust volume growth, indicating escalating competition between crypto platforms and traditional exchange operators. Non-business-day trading patterns particularly emphasize operational advantages over conventional systems that pause during significant international developments. Therefore, digital platforms deliver accelerated response capabilities to market movements occurring beyond traditional operating hours.
Traditional finance maintains comprehensive integration throughout worldwide financial networks with unparalleled market depth and regulatory transparency. Cryptocurrency exchanges persistently enhance operational capabilities to reduce performance disparities with conventional operations. Accordingly, competitive dynamics between digital platforms and traditional finance are becoming increasingly pronounced as both ecosystems advance through rapid innovation cycles.


The DOJ and CFTC filed to enjoin Arizona’s criminal and civil enforcement against prediction market platform Kalshi, arguing federally regulated event contracts fall under CFTC jurisdiction.
The U.S. Department of Justice and the Commodity Futures Trading Commission filed a motion in federal court on Thursday to block Arizona from pursuing criminal and civil enforcement actions against prediction market platform Kalshi. The regulators argue that event contracts regulated at the federal level under CFTC oversight fall outside the state’s jurisdiction.
The filing represents a direct challenge to state-level enforcement against prediction markets, asserting that federal commodity law preempts Arizona’s action. Kalshi operates as a CFTC-regulated derivatives exchange offering binary event contracts.
Sources: U.S. court documents
This article was generated automatically by The Defiant’s AI news system from publicly available sources.

Key Takeaways
- In March 2026, Hims & Hers transitioned away from compounded semaglutide to FDA-approved branded GLP-1 medications
- Bank of America reduced its HIMS price target to $21 from $23 while maintaining a Neutral stance
- Analysts project GLP-1 EBITDA contributions may decline by 50% compared to last year
- Amazon Pharmacy launched Eli Lilly’s oral GLP-1 medication Foundayo, intensifying market competition
- Year-to-date, HIMS shares have plunged approximately 39%, hovering near $20
In a significant strategic shift this March, Hims & Hers abandoned its compounded semaglutide offerings in favor of FDA-sanctioned branded GLP-1 treatments. Management positioned this decision as transforming the company into “the largest global consumer health platform for access to more affordable, approved medications.”
Hims & Hers Health, Inc., HIMS
This strategic reversal came after settling legal proceedings with Novo Nordisk. The resolution required Hims & Hers to distribute Novo Nordisk’s authorized GLP-1 medications instead of less expensive compounded alternatives.
Investors have responded harshly to these developments. HIMS shares have plummeted nearly 39% year-to-date through Wednesday, currently trading in the vicinity of $20.
BofA Securities analyst Allen Lutz reduced his price objective on HIMS this week from $23 down to $21. The analyst maintained his Neutral stance, pointing to valuation compression among comparable companies and anticipated near-term profitability headwinds.
Lutz’s forecast suggests 2026 EBITDA could land approximately 20% beneath current Wall Street expectations. His analysis indicates GLP-1-related EBITDA contributions might decline by up to 50% compared to the previous year.
Neverthstanding the conservative perspective, Lutz indicated his research team holds “slightly more optimistic” views regarding the company’s overseas expansion strategy. He further observed that the $149 monthly branded GLP-1 subscription plan might eventually deliver margins comparable to compounded options, contingent upon subscriber migration rates.
Subscriber Migration Rates Will Determine Success
BofA Securities projects that Hims & Hers might successfully transition between 40% and 50% of current subscribers to branded medication plans, while maintaining 5% to 10% on compounded alternatives. This conversion scenario would produce approximately $60 million to $90 million in GLP-1 revenues each quarter.
The telehealth platform is simultaneously pursuing international market opportunities. Management targets growing this division beyond $1 billion in annual revenue within a three-year timeframe, achieving mid-teens organic compound annual growth rates. Bank of America’s research into the Eucalyptus platform indicates approximately 90% of revenues will derive from branded GLP-1 distribution at roughly 40% gross profit margins.
Canaccord analyst Maria Ripps offered a more bullish assessment. She maintained her Buy recommendation, contending that the Novo Nordisk collaboration represents a “long-term tailwind” for the business. Ripps believes current valuations fail to recognize the value of the company’s telehealth infrastructure, customer base, and broadening treatment offerings.
Amazon Intensifies Competition With Foundayo Launch
Competitive dynamics became more challenging Thursday when Amazon Pharmacy revealed plans to distribute Eli Lilly’s recently authorized oral GLP-1 medication, Foundayo, featuring same-day delivery options. HIMS shares dipped 0.5% following this announcement. Novo Nordisk declined 1.5%.
Foundayo represents a once-daily oral therapy designed for adults managing obesity or overweight conditions with related health complications. Pricing begins at $25 monthly with insurance coverage, or $149 monthly for self-pay patients.
Amazon will provide same-day delivery across nearly 3,000 metropolitan areas, with plans to extend coverage to 4,500 locations before year-end. The e-commerce giant disclosed it has distributed GLP-1 medications since 2021, with customers saving over $200 million through automated coupon programs, where GLP-1 treatments represent the largest savings category.
Wall Street consensus on HIMS currently stands at Moderate Buy, based on four Buy ratings and 10 Hold ratings issued during the past three months. The mean price target of $26.36 suggests potential upside of approximately 36% from present trading levels.
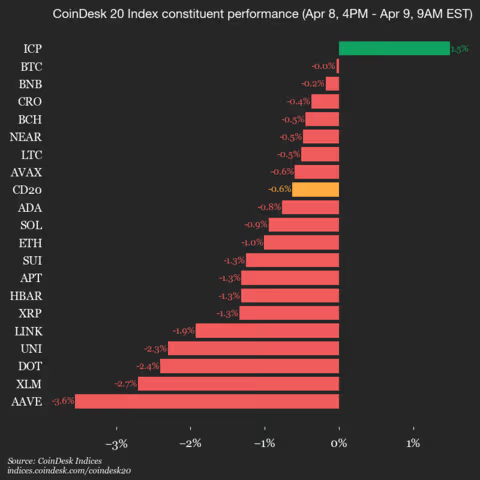
CoinDesk Indices presents its daily market update, highlighting the performance of leaders and laggards in the CoinDesk 20 Index.
The CoinDesk 20 is currently trading at 1982.06, down 0.6% (-12.51) since 4 p.m. ET on Wednesday.
One of 20 assets is trading higher.

Leaders: ICP (+1.5%) and BTC (+0.0%).
Laggards: AAVE (-3.6%) and XLM (-2.7%).
The CoinDesk 20 is a broad-based index traded on multiple platforms in several regions globally.


Key takeaways
- ADA is down 3% and is now trading around $0.2512 per coin.
- The bearish performance could see ADA slip below the $0.2400 support level.
Cardano (ADA) faces renewed selling pressure as bullish interest fades
Cardano (ADA) continues to face significant selling pressure, with the cryptocurrency extending its 4% loss from Wednesday, falling to the $0.2500 at the time of writing on Thursday.
The decline has been driven by intense long liquidations in ADA futures over the last 24 hours, signaling a diminishing bullish sentiment among traders. For a potential recovery, Cardano must reclaim the 50-day Exponential Moving Average (EMA) at $0.2672.
The broader market sentiment remains mixed, as the US-Iran ceasefire risks being undermined by Israel’s ongoing missile strikes on Lebanon. While Cardano futures initially saw some bullish interest following Tuesday’s ceasefire announcement, this has since diminished.
Data from CoinGlass reveals that liquidated ADA derivatives positions over the past 24 hours totaled $602,370, with $544,540 coming from long liquidations, indicating a significant wipeout of bullish positions. This liquidation pressure has contributed to an 6% drop in ADA futures Open Interest (OI), which now stands at $412.36 million.
Furthermore, the OI-weighted funding rate dropped to -0.0045% on Thursday, indicating that traders are increasingly shifting towards short positions.
ADA could dip below the $0.2400 support level
The ADA/USD 4-hour chart remains bearish and efficient following the recent day. ADA is currently trading below the 50-, 100-, and 200-day Exponential Moving Averages (EMAs).
Momentum indicators only hint at tentative stabilization rather than a clear bullish shift. The Moving Average Convergence Divergence (MACD) shows a marginally positive reading, while the Relative Strength Index (RSI) at 53 hovers just above the neutral midline level.

If the selloff continues, ADA could slip towards the March 29 low at $0.2328, with the February 6 low at $0.2205 providing further support.
On the flip side, if the bulls regain control, they would encounter initial resistance at the 50-day EMA around $0.2673. A daily close above this barrier would ease the immediate bearish tone and open the way toward the $0.2991 resistance level.
Crypto World
XRP Ripple Just Outpaced Bitcoin in Weekly ETP Inflows: Is $120 Million a Sign Institutions Are Loading Up?

Ripple XRP recorded $120 million in weekly ETP inflows for the period ending April 7, 2026 – its strongest weekly haul since mid-December 2025 and the single largest contributor to global crypto ETP inflows that week, according to CoinShares data.
Total global crypto ETP inflows for the week hit $224 million, rebounding sharply from a prior $414 million outflow.
XRP’s $120 million slice outpaced Bitcoin’s $107 million and Solana’s $35 million, accounting for over 50% of the entire market’s weekly intake.
The core question now: is institutional investment in XRP building a permanent structural position, or is this a single-week rotation that evaporates on the next macro shock?
Discover: The best crypto to diversify your portfolio with
Ripple XRP Price Outlook: Can XRP Break $1.50 as Institutional Money Arrives?
Ripple XRP was trading in the $1.35–$1.40 range during the inflow week, posting a 5–6% weekly gain partially driven by US-Iran ceasefire optimism. The recovery looks constructive on the surface. Dig into the chart structure and the picture is considerably more complicated.
The 3-day chart is showing a death cross – the 50-day EMA has crossed below the 200-day EMA. That same pattern preceded a 54% price collapse in January 2026.
RSI sits near 44 on the daily, not yet oversold but well below the 50 neutral line, reflecting a market still in damage-control mode rather than recovery mode.
Key support levels sit at $1.28, $1.18, and $1.05 – the last being a major structural floor from the pre-ETF launch period. On the resistance side, XRP faces a descending trendline from early March capping near $1.48, with $1.65 and $1.85 as the next meaningful ceilings if that line breaks with volume.
Derivatives open interest has been declining alongside the price recovery, which signals thin conviction behind the bounce – institutions buying ETPs aren’t the same as leveraged longs pushing spot price.
A clean breakout above $1.48 with sustained daily volume opens the door to $1.65, with $1.85 as the macro target if broader crypto sentiment flips.
For us, the invalidation is simple: a close below $1.28 on the daily reopens the path to sub-$1.10 and calls the entire inflow thesis into question. Prior price analysis on the $119.6M inflow week flagged this same trendline resistance as the decisive level.
Discover: The best pre-launch token sales
Bitcoin Hyper Targets Early Mover Upside as XRP Tests Key Resistance
XRP’s institutional setup is real. But at a market cap north of $75 billion, the math on asymmetric returns gets harder to ignore.
A 10x from current levels requires XRP to reach a market cap larger than Bitcoin’s current valuation – that’s not a trade, that’s a thesis that needs decades and dominant global payment rail adoption to validate.
Bitcoin Hyper (HYPER) is currently in presale, targeting early-mover upside in the Bitcoin yield infrastructure layer – a sector drawing serious institutional attention as US spot Bitcoin ETFs pulled in $471.3 million in a single week.
The presale has raised $32 million to date, with the current token price at $0.0093 and staking APY running at 86% annualized for early participants.
The core technical differentiator: Bitcoin Hyper operates as a Bitcoin-native Layer 2 executing smart contracts with BTC as the settlement asset – bypassing the wrapped-token credit risk that plagues existing BTC DeFi infrastructure. That’s a specific, verifiable architecture claim in a space full of vague interoperability promises.
For traders watching XRP’s institutional flows but frustrated by the price-action disconnect, the asymmetry argument is straightforward: ETP inflows into large-cap assets move sentiment; early presale positioning in infrastructure plays moves portfolios.
Research Bitcoin Hyper here before the presale window closes.
The post XRP Ripple Just Outpaced Bitcoin in Weekly ETP Inflows: Is $120 Million a Sign Institutions Are Loading Up? appeared first on Cryptonews.


Key takeaways
- ENJ is one of the best performers in the crypto market, up 45% in the last 24 hours.
- The rally could allow ENJ to surge towards $0.045 in the near term.
Enjin Coin (ENJ) continues to rally
Enjin Coin (ENJ) extends its gains, holding steady above $0.035 on Thursday following a remarkable 45% price increase in the last 24 hours.
This bullish momentum is underpinned by both on-chain and derivatives data, with a positive technical outlook suggesting that ENJ may continue its upward trend in the near future.
Data obtained from Santiment shows that Enjin Coin’s ecosystem trading volume surged to $216.97 million on Thursday, marking the highest trading volume since April 2025.
Meanwhile, CoinGlass data shows that ENJ’s futures Open Interest (OI) reached a new record of $74.68 million on Thursday, up significantly from $19.82 million on Tuesday. A rising OI indicates fresh capital entering the market, which could further propel the coin’s price upward.
Despite the rally, traders remain cautious as some early signs of buyer fatigue begin to surface. According to CryptoQuant, there is a rise in retail activity, suggesting a shift in market sentiment.
Furthermore, sell-side dominance in both the spot and futures markets may point to potential bearish pressure, signaling that the current rally could face resistance in the near term.
ENJ eyes further gains after 45% increase
The ENJ/USD 4-hour chart is bullish and efficient thanks to the 45% rally. The rally has lifted ENJ price back above the short- and medium-term Exponential Moving Averages (EMA), leaving only the 200-day EMA at $0.035 as immediate overhead resistance.
The Relative Strength Index (RSI) on the 4-hour chart reads 70, indicating a bullish bias. The Moving Average Convergence Divergence (MACD) histogram turning strongly positive reinforces growing upside momentum.

If the rally persists, initial resistance is seen at the 200-day EMA at $0.035. If the daily candle closes above this level, it could extend its rally towards the $0.051 resistance level, followed by $0.066 and $0.082 zones.
However, if the bears regain control, ENJ would likely face the initial support at $0.031. The 100-day EMA at $0.024 and the 50-day EMA at $0.022, together with the lower horizontal level at $0.019, form a deeper demand zone that could also prove to be bouncing support levels in the near term.
Cryptocurrency exchanges are taking a growing market share from traditional finance (TradFi) trading venues through tokenized commodities products, but the mainstream adoption of tokenized precious metals remains limited by pricing and liquidity issues.
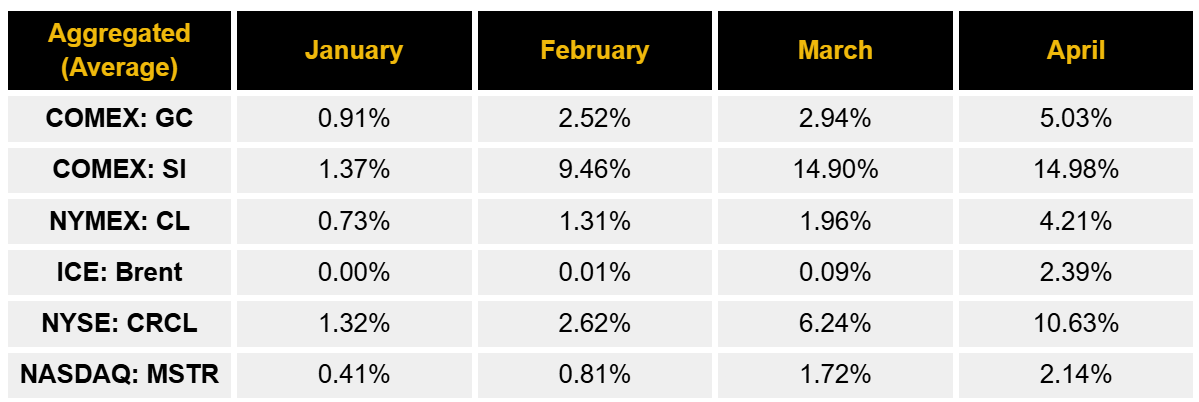
Silver perpetuals have reached about 40% of the equivalent volume of the Comex Silver (SI) Contract at their peak, the world’s largest silver futures market, which accounts for over 70% of global exchange-traded silver futures volume, according to a Thursday report from Binance Research.
During March and April, tokenized silver accounted for 14.90% and 14.98% of the Comex’s volume, respectively, up from just 1.37% in January.
The growth suggests crypto exchanges are capturing more demand for round-the-clock exposure to traditional assets, particularly in metals-linked perpetuals, but analysts at Kaiko said liquidity depth and price formation still pose major obstacles to wider adoption among traditional investors.

Crypto TradFi perps need reliable pricing, strong liquidity
Tokenized commodities offer 24/7 trading, which can create vulnerabilities compared to TradFi gold and silver futures, where the holiday and weekend close create “natural circuit breakers that actually protect market quality,” Kaiko research analyst Laurens Fraussen told Cointelegraph.
This exposes tokenized commodities to degraded order book debt, widened spreads and less reference pricing from closed traditional venues.
Legacy commodities offerings avoid these issues through centralized clearing, consolidated liquidity, standardized contracts and “coordinated operating hours that prevent liquidity deserts,” Fraussen said, adding that crypto needs “better chain abstraction and unified liquidity aggregation” to compete with TradFi.
Related: NYSE taps Securitize for 24/7 tokenized securities platform
Despite the infrastructure concerns, tokenized gold perps have surpassed the gold futures trading volumes of several regional commodity exchanges, a trend seeing monthly acceleration, according to Binance Research.

Binance Research also said gold perpetuals outpaced several regional commodity exchanges in March, reaching 401% compared to gold futures trading on the Japanese energy commodities futures exchange TOCOM, 228% of India’s Multi Commodity Exchange (MCX) and 216% of the Dubai Gold & Commodities Exchange (DGCX).
Binance attributed part of this growth to “market-moving events” that routinely occur on weekends, which would leave investors exposed to gap risks through traditional venues operating under regular trading hours.
Magazine: Can Robinhood or Kraken’s tokenized stocks ever be truly decentralized?
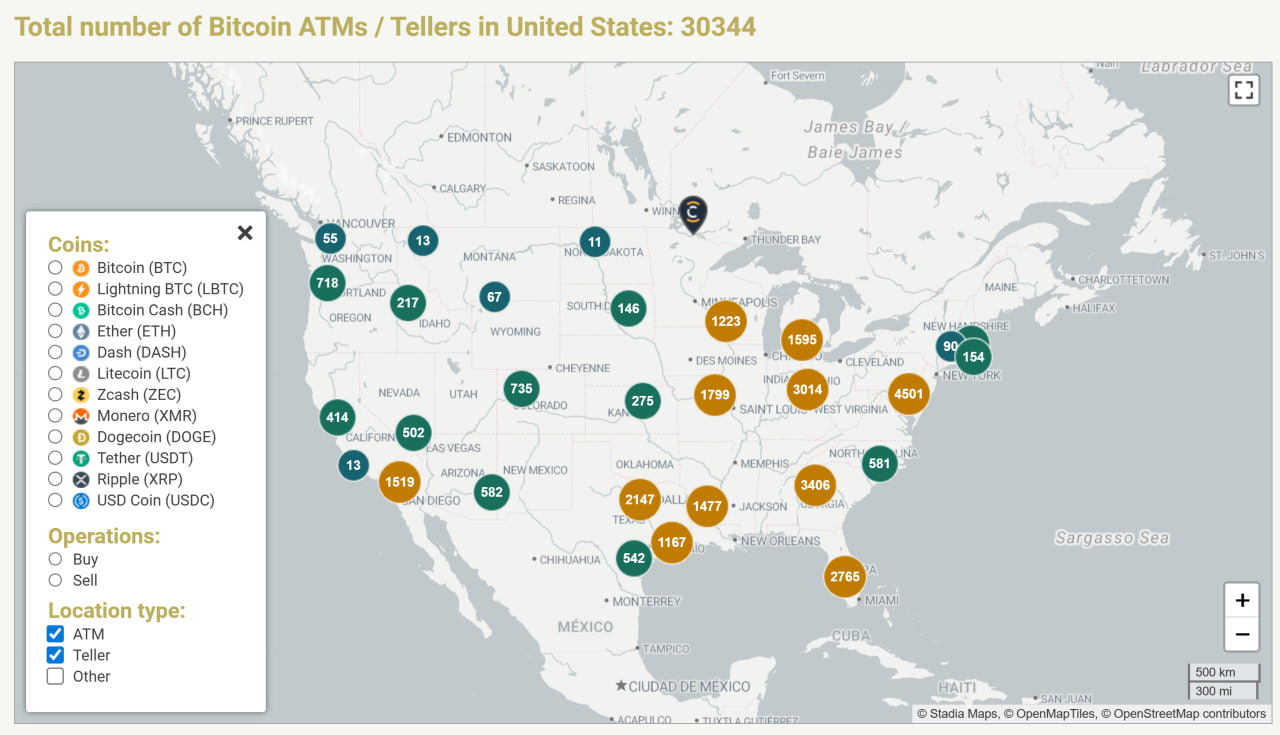
Crypto ATM operator Bitcoin Depot revealed that it lost about 50.9 Bitcoin, worth roughly $3.7 million, after a hacker gained access to some of its internal systems.
The breach happened on March 23 after the attacker took control of credentials linked to Bitcoin Depot’s corporate Bitcoin (BTC) wallets, according to a Monday filing with the US Securities and Exchange Commission. The company said that customer accounts, platforms and personal data were not affected.
Bitcoin Depot added that the attack has not had a major impact on daily operations, and said it has insurance that may cover some of the losses. “As the investigation of the incident is ongoing, the full scope, nature and impact of the incident are not yet completely known,” the filing states.
Shares of Bitcoin Depot jumped sharply on Wednesday, closing at $2.74, up $0.37 or 15.61% on the day, with additional gains in pre-market trading pushing the price to $2.90, a further 5.84% increase, according to data by Yahoo! Finance.
Related: Bitcoin Depot enters Hong Kong as part of Asia expansion
Bitcoin Depot under pressure
Bitcoin Depot has been facing growing legal and regulatory pressure across several US states. The company recently had its money transmission license suspended in Connecticut, along with a temporary cease-and-desist order, with regulators citing violations such as high fees and failure to fully refund scam victims.
The company has also faced a lawsuit from Massachusetts alleging overcharging and facilitating scams, and paid $1.9 million in Maine to compensate affected users.

In June 2024, Bitcoin Depot also experienced a data breach that exposed the personal information of 26,732 customers. The breach was linked to an external system, and authorities cleared the company to issue notifications only after the probe concluded in June 2025.
Related: Australia’s financial watchdog may gain power to ban crypto ATMs
US cities move to ban crypto ATMs
US cities are increasing pressure on crypto ATMs as concerns over fraud grow. Stillwater, Minnesota, has banned crypto ATMs after residents lost large sums to scams, while Spokane, Washington, introduced a citywide ban in June, calling the kiosks a “preferred tool for scammers” following a spike in fraud cases.
Haverhill, Massachusetts, is also considering banning crypto ATMs, with a proposed ordinance citing fraud and money laundering risks that would require all machines to be removed within 60 days if approved.
Magazine: Bitcoin may take 7 years to upgrade to post-quantum — BIP-360 co-author


Banks are approaching stablecoins cautiously despite rapid market growth, reflecting early-stage strategy and rising structural concerns, according to a report by S&P Global Market Intelligence.
According to the Wednesday report, the question is no longer whether stablecoins will endure, but how they will reshape business models, infrastructure and revenue, For banks, the trade-offs are sharp, spanning deposit risk, modernization costs and new competition.
A wait-and-see stance still dominates. S&P Global’s Q1 2026 U.S. Bank Outlook survey found just 7% of 100 mostly smaller institutions are developing frameworks, with none actively piloting, underscoring how exploratory strategies remain.
“Most financial institutions remain early and cautious,” said Jordan McKee, director of fintech research at S&P Global Market Intelligence, in emailed comments. “Our survey of U.S. banks shows that stablecoin strategy is still largely exploratory, with limited internal development and no active pilots among smaller institutions.”
Stablecoins, digital tokens pegged to assets like fiat currencies or commodities, have become a core layer for payments and settlement in crypto, widely used in trading and cross-border flows. The market is dominated by Tether’s USDT, followed by Circle Internet’s (CRCL) USDC.
The stablecoin market has grown rapidly into a roughly $300 billion-plus sector, with total market capitalization surpassing $316 billion in early 2026 after nearly doubling since 2023, according to multiple data sources.
Transaction volumes have also surged into the tens of trillions annually, underscoring rising use in trading, payments and cross-border transfers, while forecasts point to continued expansion, potentially reaching $500 billion or more in the near term as institutional adoption accelerates.
Pressure is building. The report pointed to growing concern over deposit cannibalization and customer migration, alongside a surge in stablecoin mentions on earnings calls following the GENIUS Act’s passage in July 2025.
Competition is also intensifying. S&P Global highlighted a wave of nonbanks pursuing charters to house stablecoin issuance, custody and settlement within regulated entities, positioning themselves as credible alternatives.
Banks are also wary of yield-like incentives in stablecoin ecosystems that could compete with deposits, even as direct interest payments remain restricted.
Responses will diverge. S&P Global analysts expect large, global banks to explore issuing tokenized deposits or bank-backed digital assets, while regional and midsize lenders focus on facilitating access via fiat on- and off-ramps. Regardless of strategy, banks will remain key gateways between fiat and stablecoin networks, but doing so will require significant upgrades to legacy systems ill-suited for real-time digital asset activity.
Cross-border banks face the strongest push to modernize as payments shift to multi-rail systems combining traditional, real-time and tokenized networks. Interoperability and wallet infrastructure will be critical, with large banks building multi-network connectivity and smaller firms leaning on fintech partners. Secure custody and embedded compliance are expected to become standard, the report added.
Read more: Stablecoin rewards restrictions can slow but not stop Circle’s USDC, says Citigroup

Rainbow Rare Earths Limited 2026 Q2 – Results – Earnings Call Presentation (OTCMKTS:RBWRF) 2026-04-09
Tokenized Commodities Push Crypto Platforms Into Direct Competition With Traditional Finance

Netflix Fans Hype About Drama In ‘Temptation Island’ S2


-

 NewsBeat7 days ago
Steven Gerrard disagrees with Gary Neville over ‘shock’ Chelsea and Arsenal claim | Football
-

 Business7 days ago
No Jackpot Winner and $194 Million Prize Rolls Over
-

 Fashion6 days ago
Weekend Open Thread: Spanx – Corporette.com
-

 Business5 days ago
Expert Picks for Every Need
-

 Business4 days ago
Three Gulf funds agree to back Paramount’s $81 billion takeover of Warner, WSJ reports
-

 Sports5 days ago
India men’s 4x400m and mixed 4x100m relay teams register big progress | Other Sports News
-

 Tech2 days ago
How Long Can You Drive With Expired Registration? What Florida Law Says
-
Business4 days ago
No Jackpot Winner, Prize to Climb to $231 Million
-

 Fashion3 days ago
Massimo Dutti Offers Inspiration for Your Summer Mood Board
-

 Tech7 days ago
Commonwealth Fusion Systems leans on magnets for near-term revenue
-

 Fashion2 days ago
Let’s Discuss: DEI in 2026
-
Politics6 days ago
Wings Over Scotland | The quality of mercy
-
 Business5 days ago
Akebia Therapeutics, Inc. (AKBA) Discusses Pipeline Progress and Strategic Focus on Kidney Disease Treatments at R&D Day – Slideshow
-

 Fashion7 days ago
Statement Sunglasses: The Accessory Shaping Modern Fashion
-

 Crypto World24 hours ago
Bitcoin recovers as US and Iran Agree a Ceasefire Deal
-

 Politics6 days ago
East Jerusalem Palestinian families eviction orders
-

 Sports7 days ago
Which German players will make final cut?
-

 Fashion7 days ago
For Love & Lemons’ Spring 2026 Line is for the Romantics
-

 Politics6 days ago
Why so many children are now classified as ‘disabled’
-

 Fashion7 days ago
Coffee Break: Santa Croce Tote
You must be logged in to post a comment Login