
Crypto World
Market Analysis: EUR/USD Breaks Higher As USD/JPY Loses Bullish Grip

EUR/USD started a decent upward move above 1.1880. USD/JPY declined below 155.00 and is currently consolidating losses.
Important Takeaways for EUR/USD and USD/JPY Analysis Today
· The Euro found support and started a recovery wave above the 1.1850 resistance zone.
· There is a connecting bullish trend line forming with support at 1.1890 on the hourly chart of EUR/USD at FXOpen.
· USD/JPY is trading in a bearish zone below 156.00 and 155.00.
· There is a short-term bearish trend line forming with resistance at 154.65 on the hourly chart at FXOpen.
EUR/USD Technical Analysis
On the hourly chart of EUR/USD at FXOpen, the pair started a fresh increase from 1.1765. The Euro climbed above 1.1800 and 1.1850 against the US Dollar.
The pair even settled above 1.1880 and the 50-hour simple moving average. Finally, it tested the 1.1930 resistance. A high is formed near 1.1928, and the pair is now consolidating gains above the 23.6% Fib retracement level of the upward move from the 1.1765 swing low to the 1.1928 high.
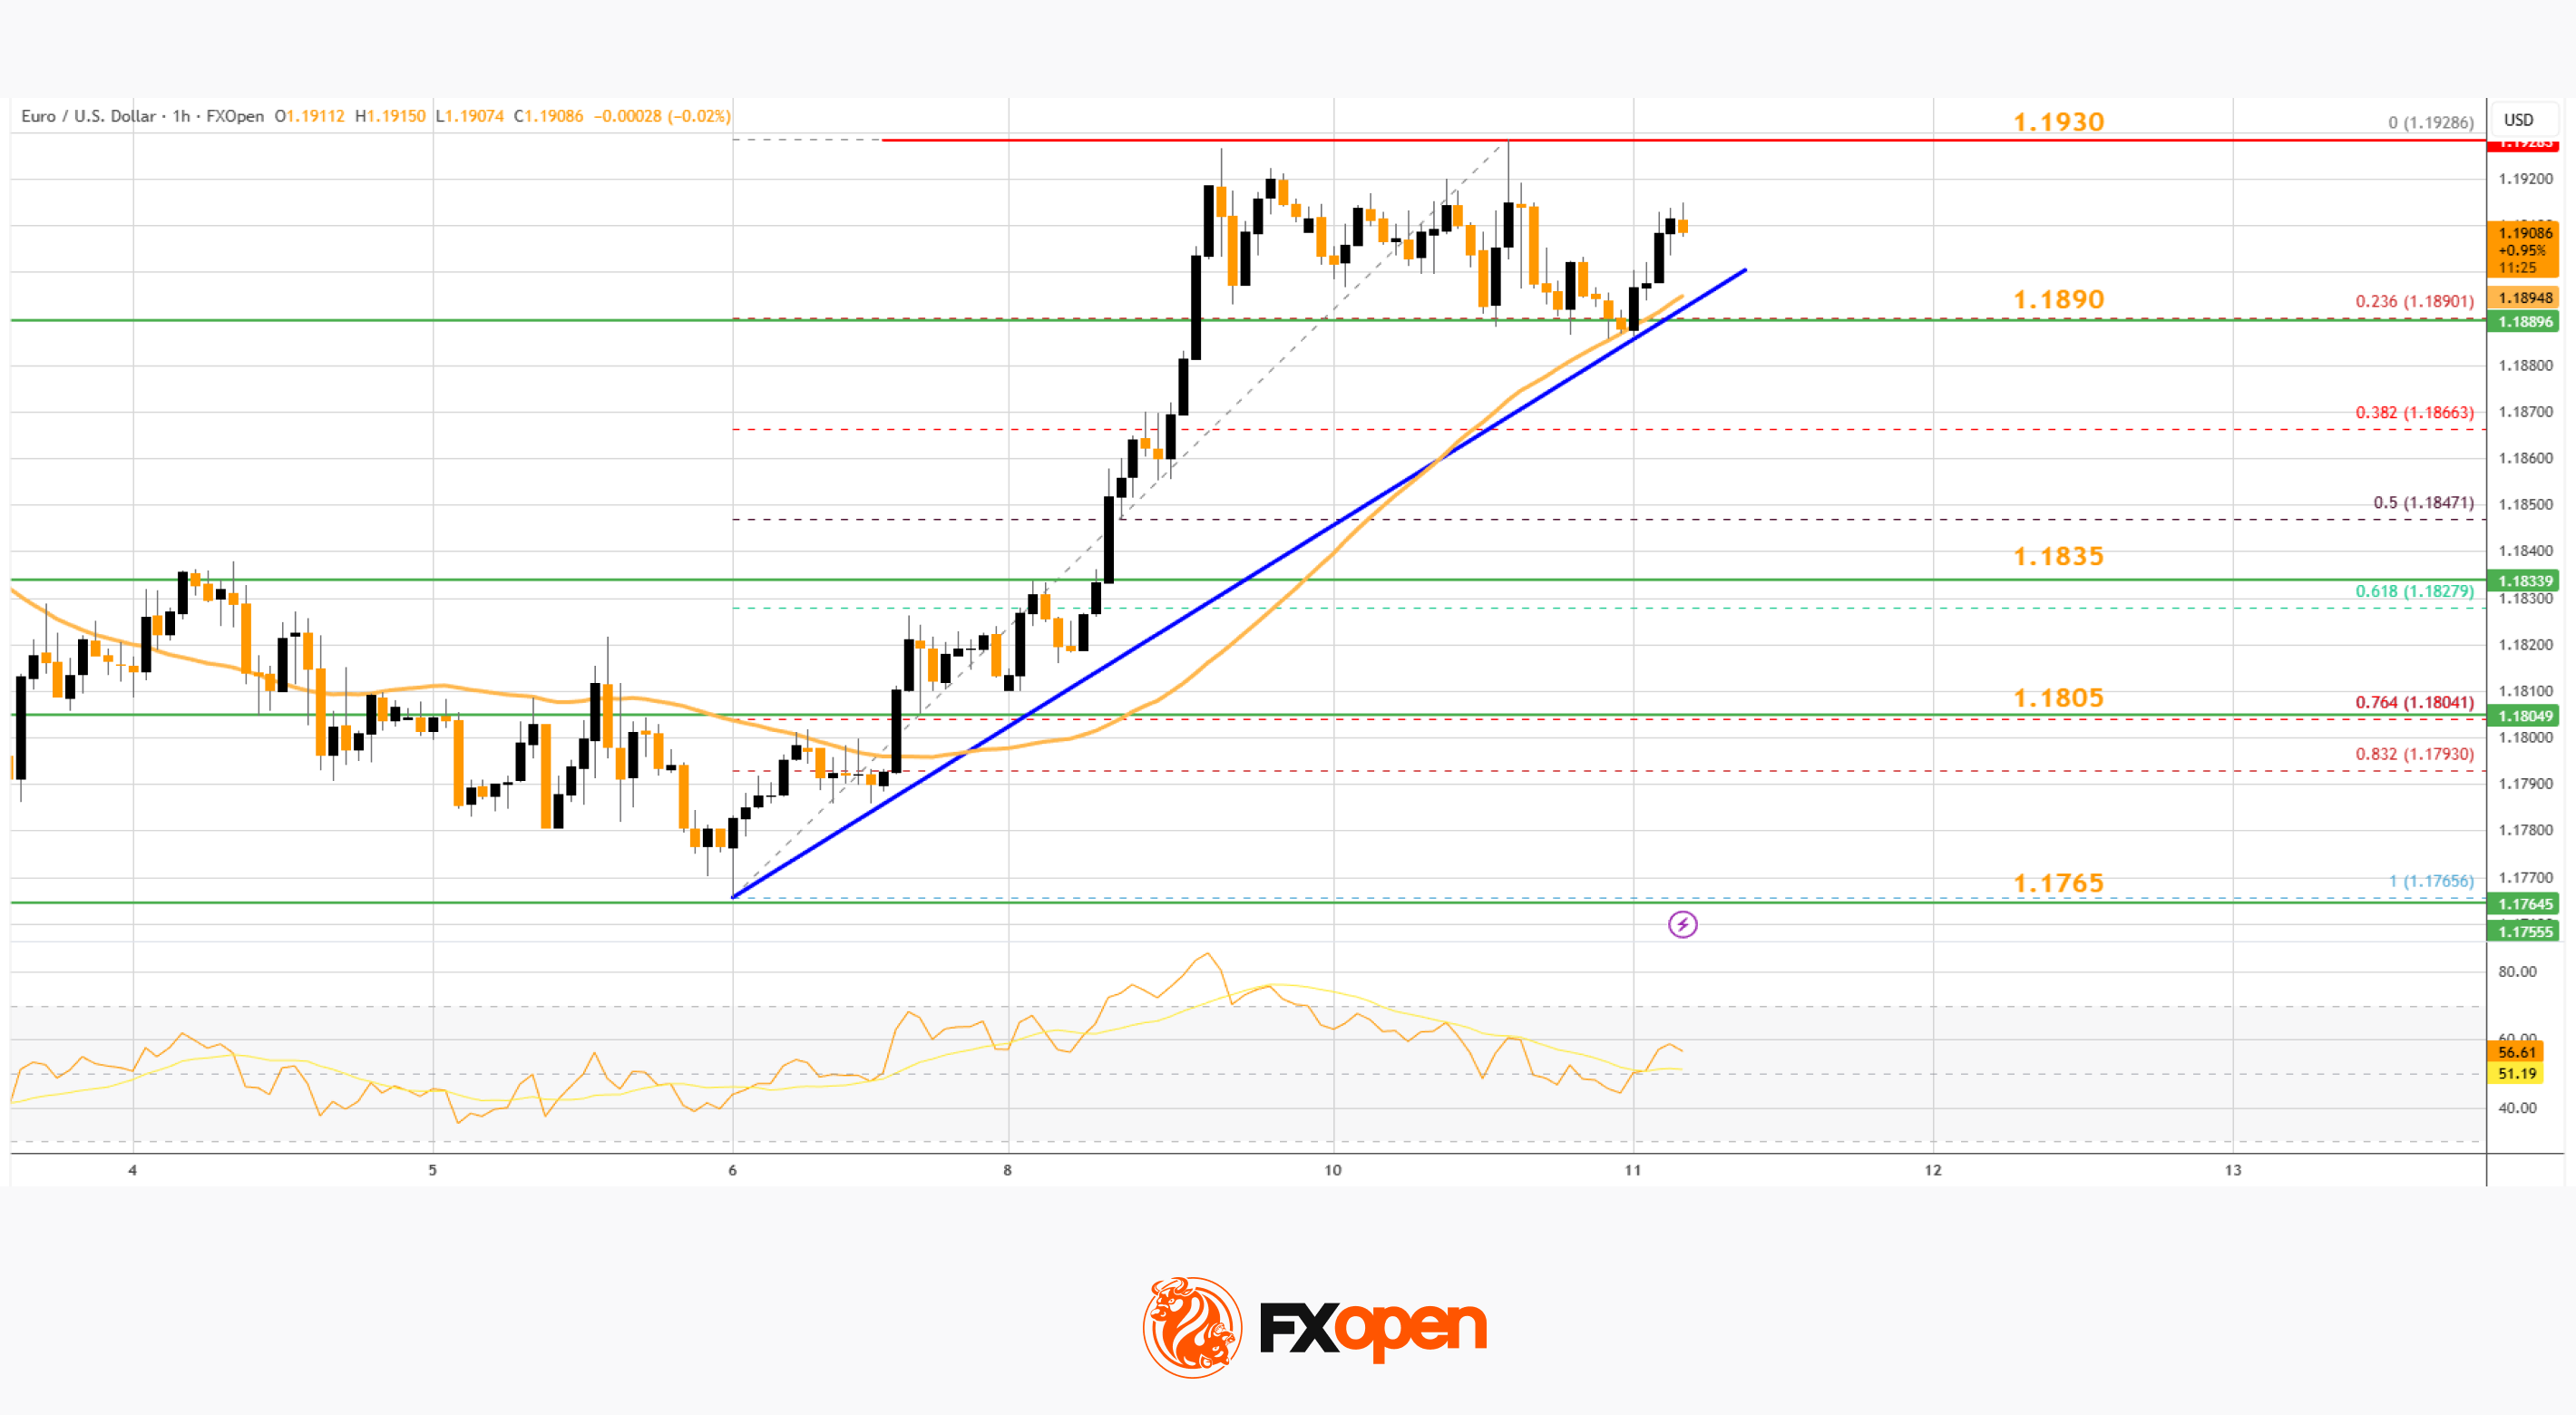
Immediate support is near a connecting bullish trend at 1.1890 and the 50-hour simple moving average. The next area of interest could be 1.1835.
The main breakdown zone on the EUR/USD chart sits near the 76.4% Fib retracement at 1.1805. If there is a downside break below 1.1805, the pair could drop toward 1.1765. Any more losses might send the pair toward the 1.1720 low.
On the upside, the pair is now facing resistance near 1.1930. The next hurdle is 1.1950. An upside break above 1.1950 could set the pace for another increase. In the stated case, the pair might rise toward 1.2000.
USD/JPY Technical Analysis
On the hourly chart of USD/JPY at FXOpen, the pair started a steady decline from well above 157.20. The US Dollar gained bearish momentum below 156.00 against the Japanese Yen.
The pair even settled below 155.00 and the 50-hour simple moving average. There was a spike below 154.50 and the pair traded as low as 153.34. It is now consolidating losses with a bearish angle. Immediate resistance on the USD/JPY chartis near the 23.6% Fib retracement level of the recent decline from the 157.65 swing high to the 153.34 low at 154.35.
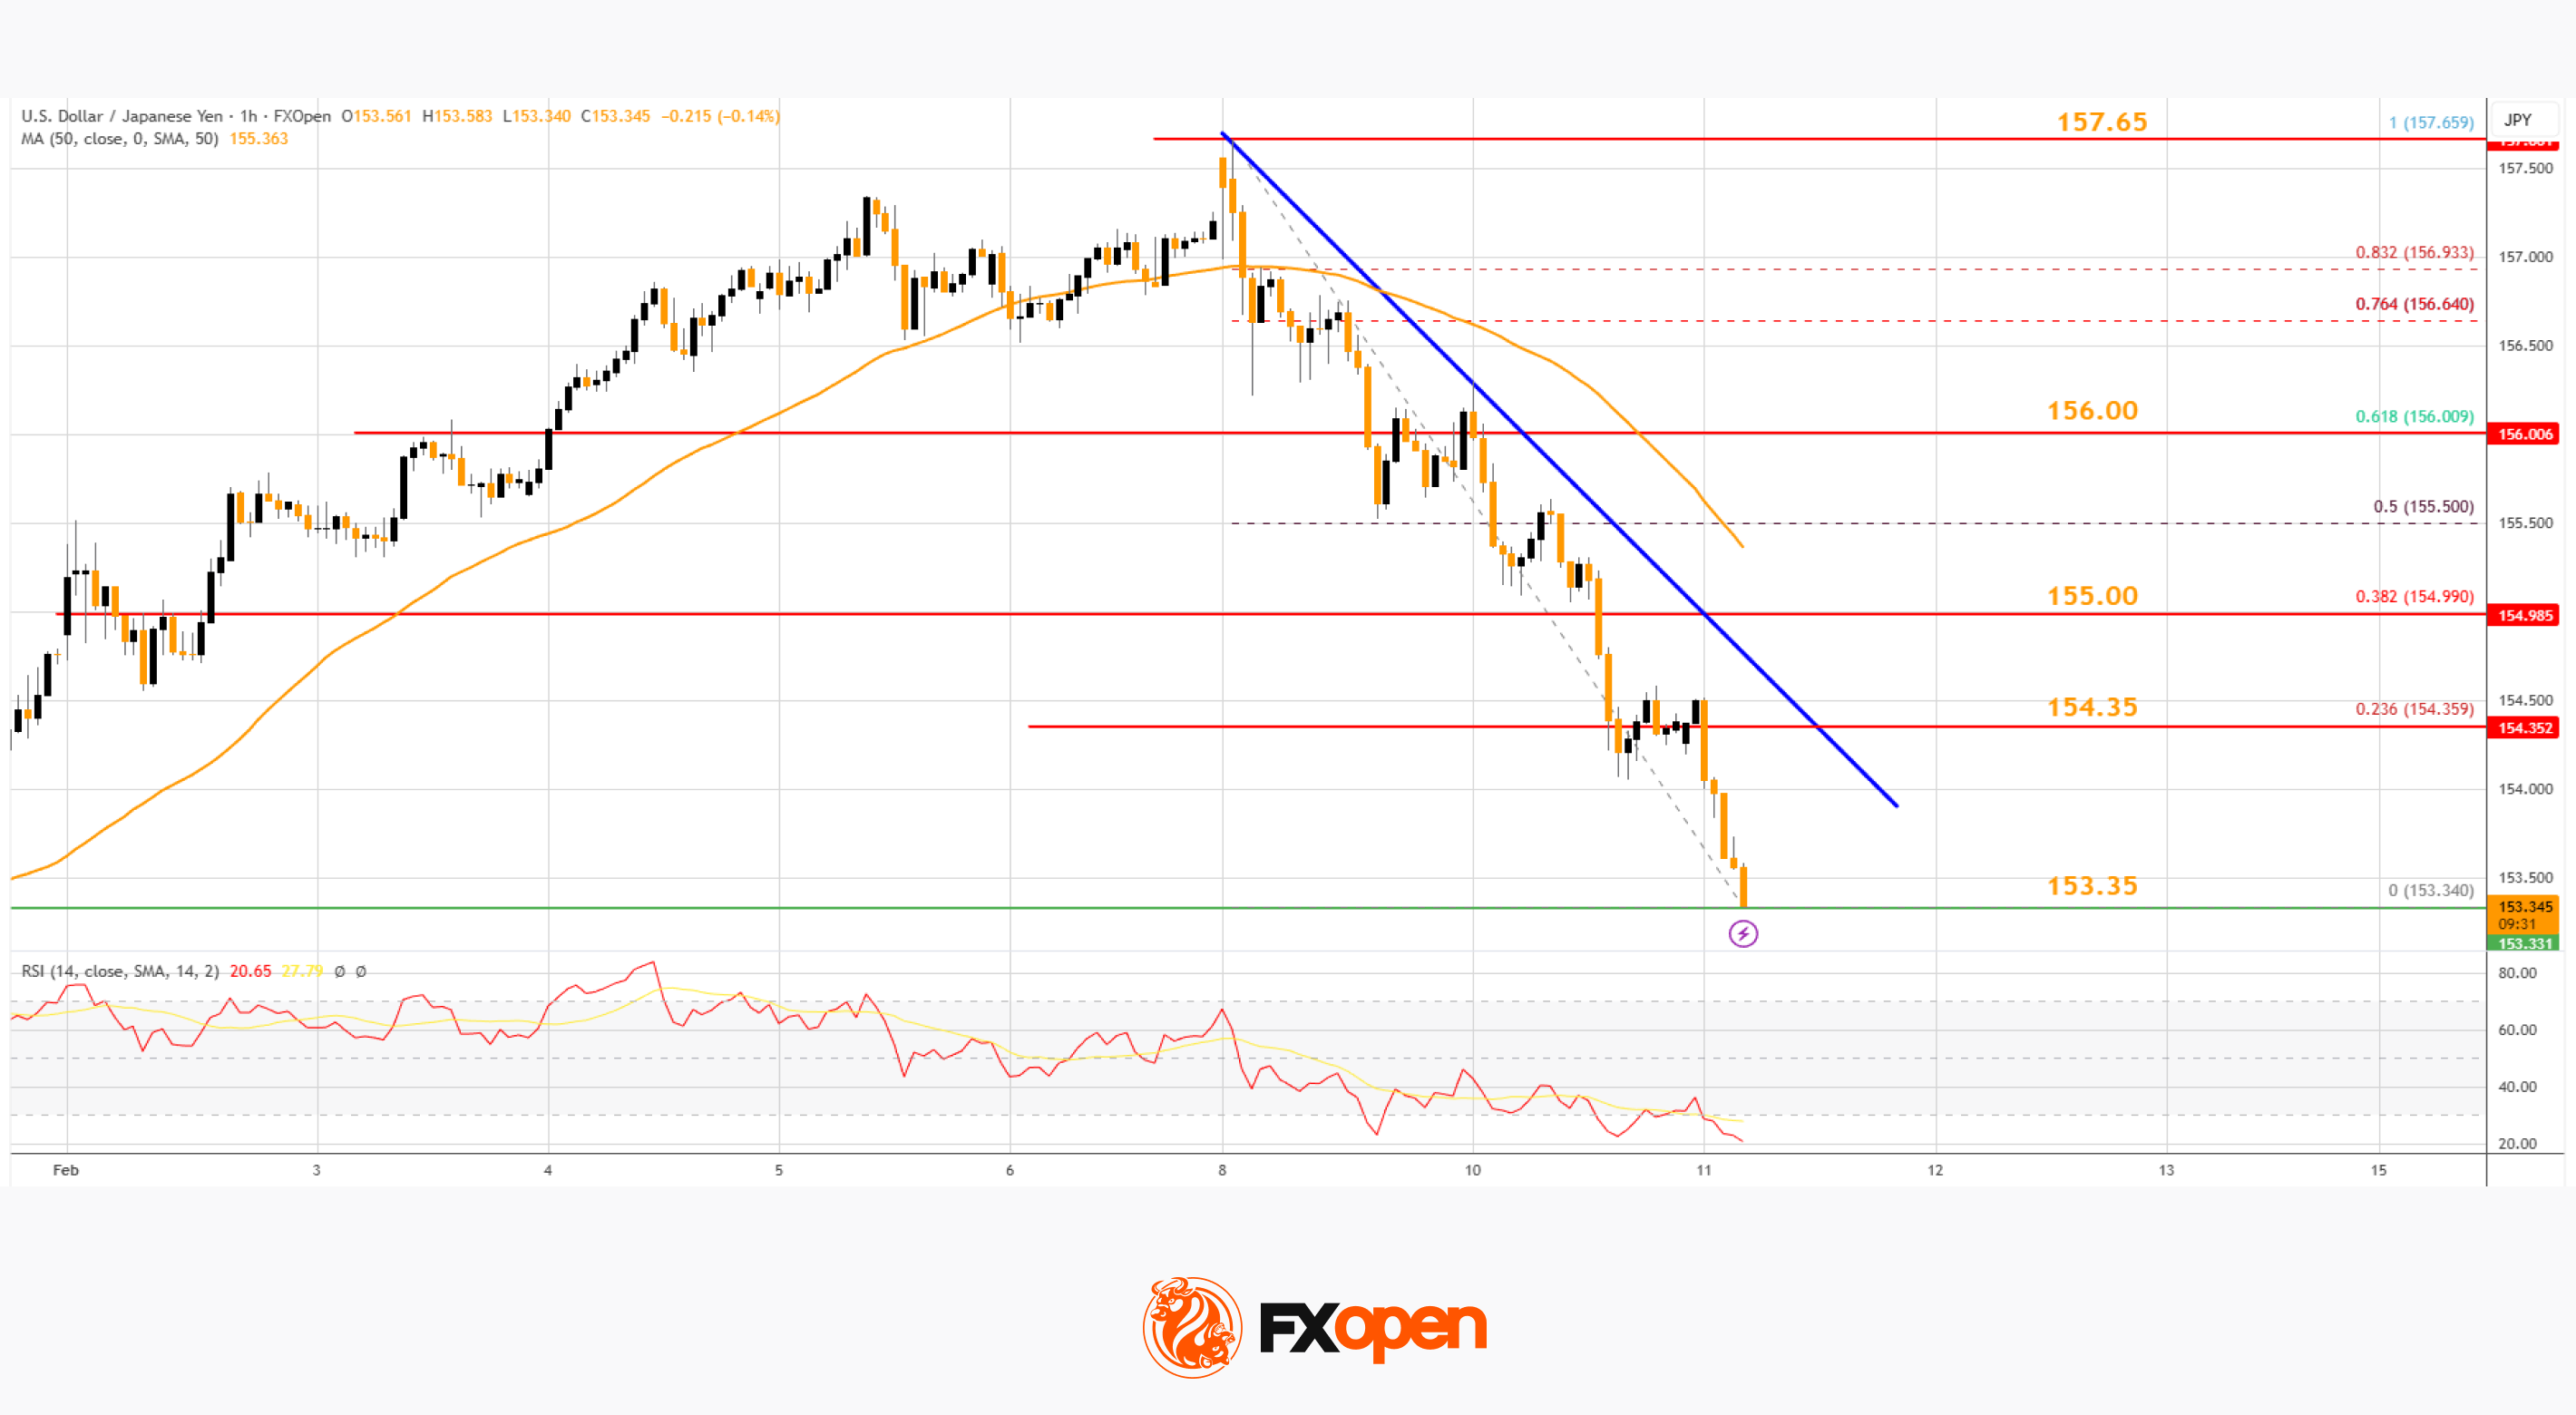
There is also a short-term bearish trend line forming at 154.5. The first barrier for the bulls could be near the 38.2% Fib retracement at 155.00.
If there is a close above the 155.00 level and the hourly RSI moves above 50, the pair could rise toward 156.00. The next key area of interest is near 156.60, above which the pair could test 157.00 in the coming days.
On the downside, the first major support is near 153.35. The next key zone is near 152.50. If there is a close below 152.50, the pair could decline steadily. In the stated case, the pair might drop toward 150.00.
Trade over 50 forex markets 24 hours a day with FXOpen. Take advantage of low commissions, deep liquidity, and spreads from 0.0 pips (additional fees may apply). Open your FXOpen account now or learn more about trading forex with FXOpen.
This article represents the opinion of the Companies operating under the FXOpen brand only. It is not to be construed as an offer, solicitation, or recommendation with respect to products and services provided by the Companies operating under the FXOpen brand, nor is it to be considered financial advice.

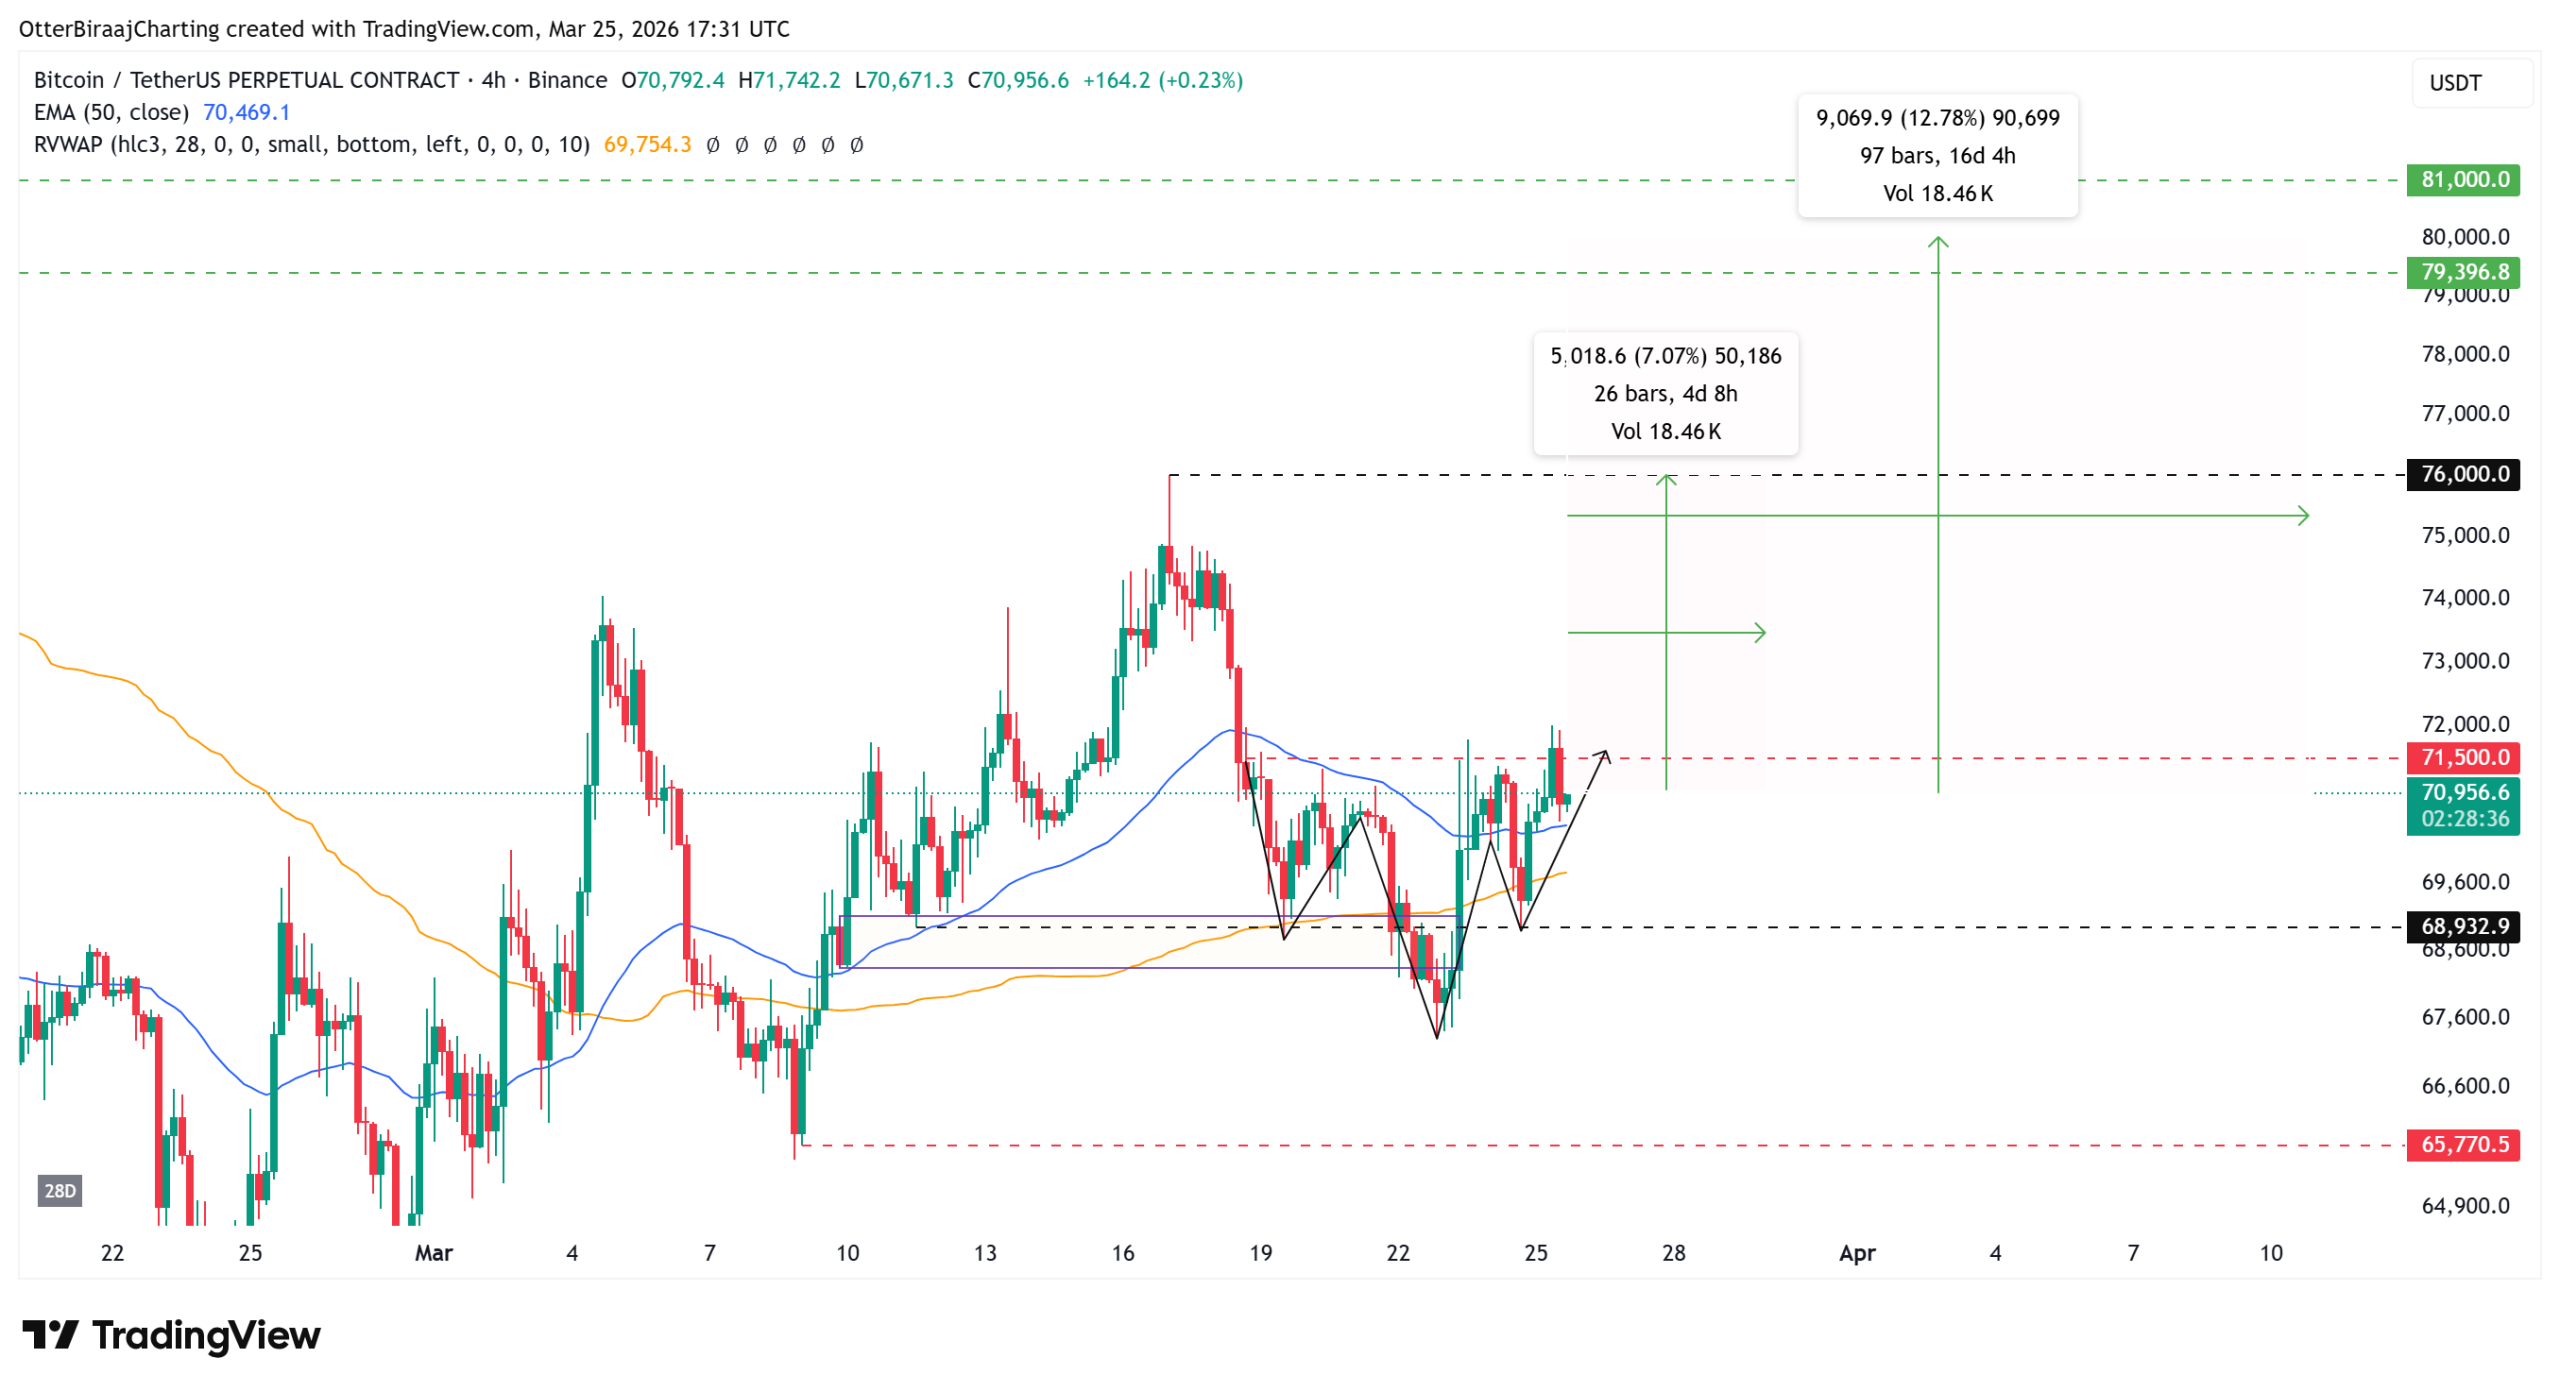
Bitcoin (BTC) is testing the $71,500 pivot, a key level across multiple timeframes and analysts noted that price action is tilted toward a possible rally to $80,000.
As traders remain split between futures-driven speculation and weak spot demand, Bitcoin has tested the $71,500 inflection point four times in the past seven days. A positive is that the price has held above the 50-period exponential moving average (EMA) on the four-hour chart, but the 50-day EMA on the daily chart continues to act as a level of resistance.
Will $80,000 be Bitcoin’s next stop?
Crypto trader Skew described the position as a “compression zone,” where the tightening price range and trading may lead to a strong directional move.
A bullish inverse head and shoulders pattern is also forming on the four-hour chart, with $71,500 acting as the neckline.

A confirmed breakout places the immediate technical target near monthly highs at $76,000, a 7.35% move from current levels. Market analyst Mikybull extends this projection toward $80,000.
Another onchain signal points to the possibility of a 10% to 14% Bitcoin rally. The seven-day standard deviation of short-term holder realized profit and loss flows to Binance dropped to 255 on March 24, returning to a level seen before prior rallies.

A similar reading near 277 on Feb. 27 was followed by a 14% rise, while a level around 289 in late December preceded a near 10% gain. The current compression shows a decline in sell-side volatility, with the short-term holder distribution becoming more controlled.
Related: Bitcoin holders shift from panic to cash-buffer discipline as volatility deepens
Bitcoin orderflow data remains split
The recent price strength followed market optimism tied to a potential ceasefire in the US and Israel-Iran war, but on Wednesday, Iran rejected the US peace proposal and outlined its own conditions for ending the conflict, according to the Kobeissi Letter.
BTC held steady through the update, while sensitivity to the US dollar strength and energy prices continues to guide short-term reactions.
The derivatives positioning shows increased activity. BTC open interest (in terms of USD) has risen by $500 million to $16.5 billion over the past 24 hours, with funding rates turning positive at 0.03% since Monday. The latest rally toward $70,000 was driven largely by futures markets.

The spot participation lags, with a weak aggregate cumulative volume delta of -$87 million and a negative Coinbase premium signaling softening US-based demand. Thus, the order flow data points to a distributive nature between buyers and sellers across the spot and futures markets.
Skew explained that for Bitcoin to sustain a breakout above $71,500, the rally needs to be backed by stronger underlying demand, specifically, strong buyer support, steady accumulation, and continued absorption of selling pressure from short traders.

A $60 million bid was filled during the New York session, highlighting renewed demand, but a clear follow-through is needed for the price to retain a bullish structure above $71,500.
Related: Bitcoin rebounds during Iran war, but safe haven role unproven
This article does not contain investment advice or recommendations. Every investment and trading move involves risk, and readers should conduct their own research when making a decision. While we strive to provide accurate and timely information, Cointelegraph does not guarantee the accuracy, completeness, or reliability of any information in this article. This article may contain forward-looking statements that are subject to risks and uncertainties. Cointelegraph will not be liable for any loss or damage arising from your reliance on this information.


A breakdown of DeFi’s yield sources reveals that borrowing demand, trading fees, and funding rates drove the bulk of returns, while more than half of stablecoin deposits in the Ethereum ecosystem are earning less than U.S. Treasuries.
Decentralized finance (DeFi) produced roughly $8 billion in onchain yield in 2025, according to a detailed analysis published by researcher Vadym that maps the full spectrum of where DeFi returns actually originate. The breakdown reveals that yield is abundant in aggregate but unevenly distributed, often circular, and in many cases difficult to package into structured products.
The findings land as yields across DeFi have dried up. Borrowing rates on major lending platforms have converged with the Federal Reserve’s policy rate, and “safe” stablecoin supply rates now average roughly 3% — below U.S. Treasuries and the Secured Overnight Financing Rate. On Aave, the 30-day average yield on USDC and USDT sits around 2%. Out of more than $20 billion in stablecoin vaults across Ethereum and its Layer 2s, 58% of TVL is earning under 3% APY, the report notes.
Where the $8 Billion Comes From
The analysis identifies five primary yield sources, each with distinct risk profiles and scalability constraints.
AMM trading fees were the largest single category at roughly $4.2 billion, with Uniswap, Meteora, and Raydium accounting for 62% of the total. But the analysis cautions that these fees are notoriously difficult to capture in structured products. Liquidity providers — particularly those using concentrated liquidity — frequently lose money to toxic order flow, and LP-manager vaults have failed to gain meaningful traction.
Borrow interest generated approximately $1.76 billion across money markets, including Aave, Morpho, Spark, Maple and Fluid. Money markets account for more than 60% of total DeFi TVL, making lending the sector’s economic backbone. However, the analysis found that roughly half of all borrowing demand is recursive — users borrowing to loop back into other yield sources, such as liquid staking tokens or yield-bearing stablecoins. On Aave’s Ethereum deployment, about 39% of borrowing demand goes toward leveraging ETH staking rewards, while another 11.6% loops Ethena’s sUSDe.
Perps funding fees, largely pioneered onchain by Ethena, contributed around $300 million. Ethena’s sUSDe derives its yield from staking rewards and short funding rates — a mechanism that drew both praise and alarm when it launched in 2024.
Real-world assets generated an estimated $600–900 million, with U.S. Treasuries holding the largest share of the RWA market at about 41% and private credit at 25%.
Network staking rewards and MEV comprise the remainder, with Ethereum’s issuance totaling roughly one million ETH in 2025. The MEV-derived portion of staking yield has been trending downward as private order flow routing — now handling about 90% of swaps — has reduced frontrunning opportunities.
Untapped and Underdeveloped Sources
The analysis also highlights categories where yield capture remains negligible. Insurance underwriting generated just $5.5 million in premiums in 2025, mostly through Nexus Mutual. Options — despite CeFi open interest of $30–50 billion — have roughly $1.8 billion in onchain OI with no breakout structured product. Volatility selling and protocol risk transfer remain largely untapped, which the analysis flags as a potential opportunity as risk curation grows more competitive.
Sky’s Balancing Act
As a case study in how protocols assemble these disparate yield sources, the analysis examines Sky (formerly MakerDAO), whose 3.75% USDS Savings Rate has attracted significant capital amid the compression. Sky’s TVL surged 38% in March, making it the fourth-largest DeFi protocol, with the sUSDS savings pool alone accounting for approximately $6.5 billion in deposits.
The breakdown reveals that approximately 70% of Sky’s income derives from offchain origination — primarily USDC earning Coinbase rewards through the peg stability module (PSM), and RWA exposure through products like BlackRock’s BUIDL and Janus Henderson funds. The remaining 30% flows from onchain sources, with Spark acting as Sky’s primary allocation arm, routing capital into Sparklend, Maple’s institutional lending, Anchorage, and other yield-bearing opportunities depending on prevailing rates.
The implication, the analysis argues, is that even as TradFi yield increasingly flows through permissioned channels, its redistribution happens onchain, providing a floor for DeFi rates and potentially setting the stage for a next generation of yield derivatives, including fixed-rate products, interest-rate swaps and structured tranches.
This article was written with the assistance of AI workflows. All our stories are curated, edited and fact-checked by a human.
Crypto industry executives on Wednesday told the US House of Representatives Committee on Financial Services that existing investor protections and financial surveillance regulations should apply to tokenized securities.
The hearing was held as legislators consider the Capital Markets Technology Modernization Act of 2026 and are exploring the impact of asset tokenization on capital markets and the “need to balance innovation with investor protection and market integrity,” according to a statement by panel chairman, Representative French Hill.
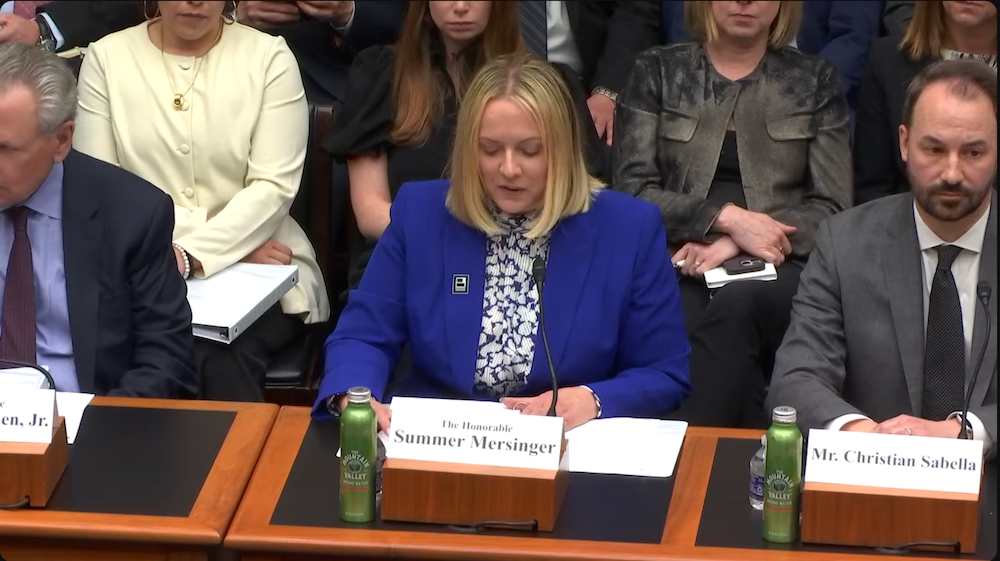
Tokenized real-world assets (RWA), traditional financial instruments represented by tokens on blockchain networks, reduce transaction costs and settlement times, Summer Mersinger, CEO of crypto advocacy organization Blockchain Association, told the committee.
“By replacing flawed manual record-keeping processes with more transparent timestamps and stamped records, tokenization lowers the cost and re-imagines US financial markets,” she said.

Mersinger and the other witnesses agreed that existing securities laws apply to tokenized instruments, arguing that the technology and the medium used to record securities transactions do not fundamentally alter investor protection laws or jurisdictional oversight.
Supporters of RWA tokenization contend the technology removes intermediaries from the settlement and clearing process, reducing transaction costs and improving capital velocity by introducing near-instant settlement times.
AML provisions and sanctions compliance remain lawmaker priority
Lawmakers questioned the panel about how tokenized asset issuers and platforms could enforce know-your-customer (KYC) checks, anti-money laundering provisions, and sanctions compliance.
Illinois Representative Bill Foster asked: “Once things are tokenized, are they going to be treated on a private, permissioned blockchain, or a variety of public blockchains, which often allow anonymous participation through self-hosted wallets?”

John Zecca, Nasdaq executive vice president and global chief legal, risk, and regulatory officer, told Foster that the exchange can collect KYC information at the protocol level because its system runs on a permissioned blockchain network.
Christian Sabella, managing director and deputy general counsel of the Depository Trust and Clearing Corporation (DTCC), the world’s largest clearinghouse company, said it was also possible to embed identifying information at the token level.
These identifiers would be immutable and would remain regardless of whether the RWA token was trading on a permissioned or a permissionless network, Sabella added.

Salman Banaei, general counsel for Plume Network, a permissionless RWA-focused blockchain, said the network embeds anti-money laundering (AML) and sanctions compliance checks at the token level, which allows tokens to be frozen.
However, Banaei told Foster that government regulators do not yet have a technological solution to identify wash trades or identify market participants with 100% confidence.
Magazine: Meet the onchain crypto detectives fighting crime better than the cops
Crypto World
Market structure bill compromise draws wide-ranging reaction from fractured crypto crowd
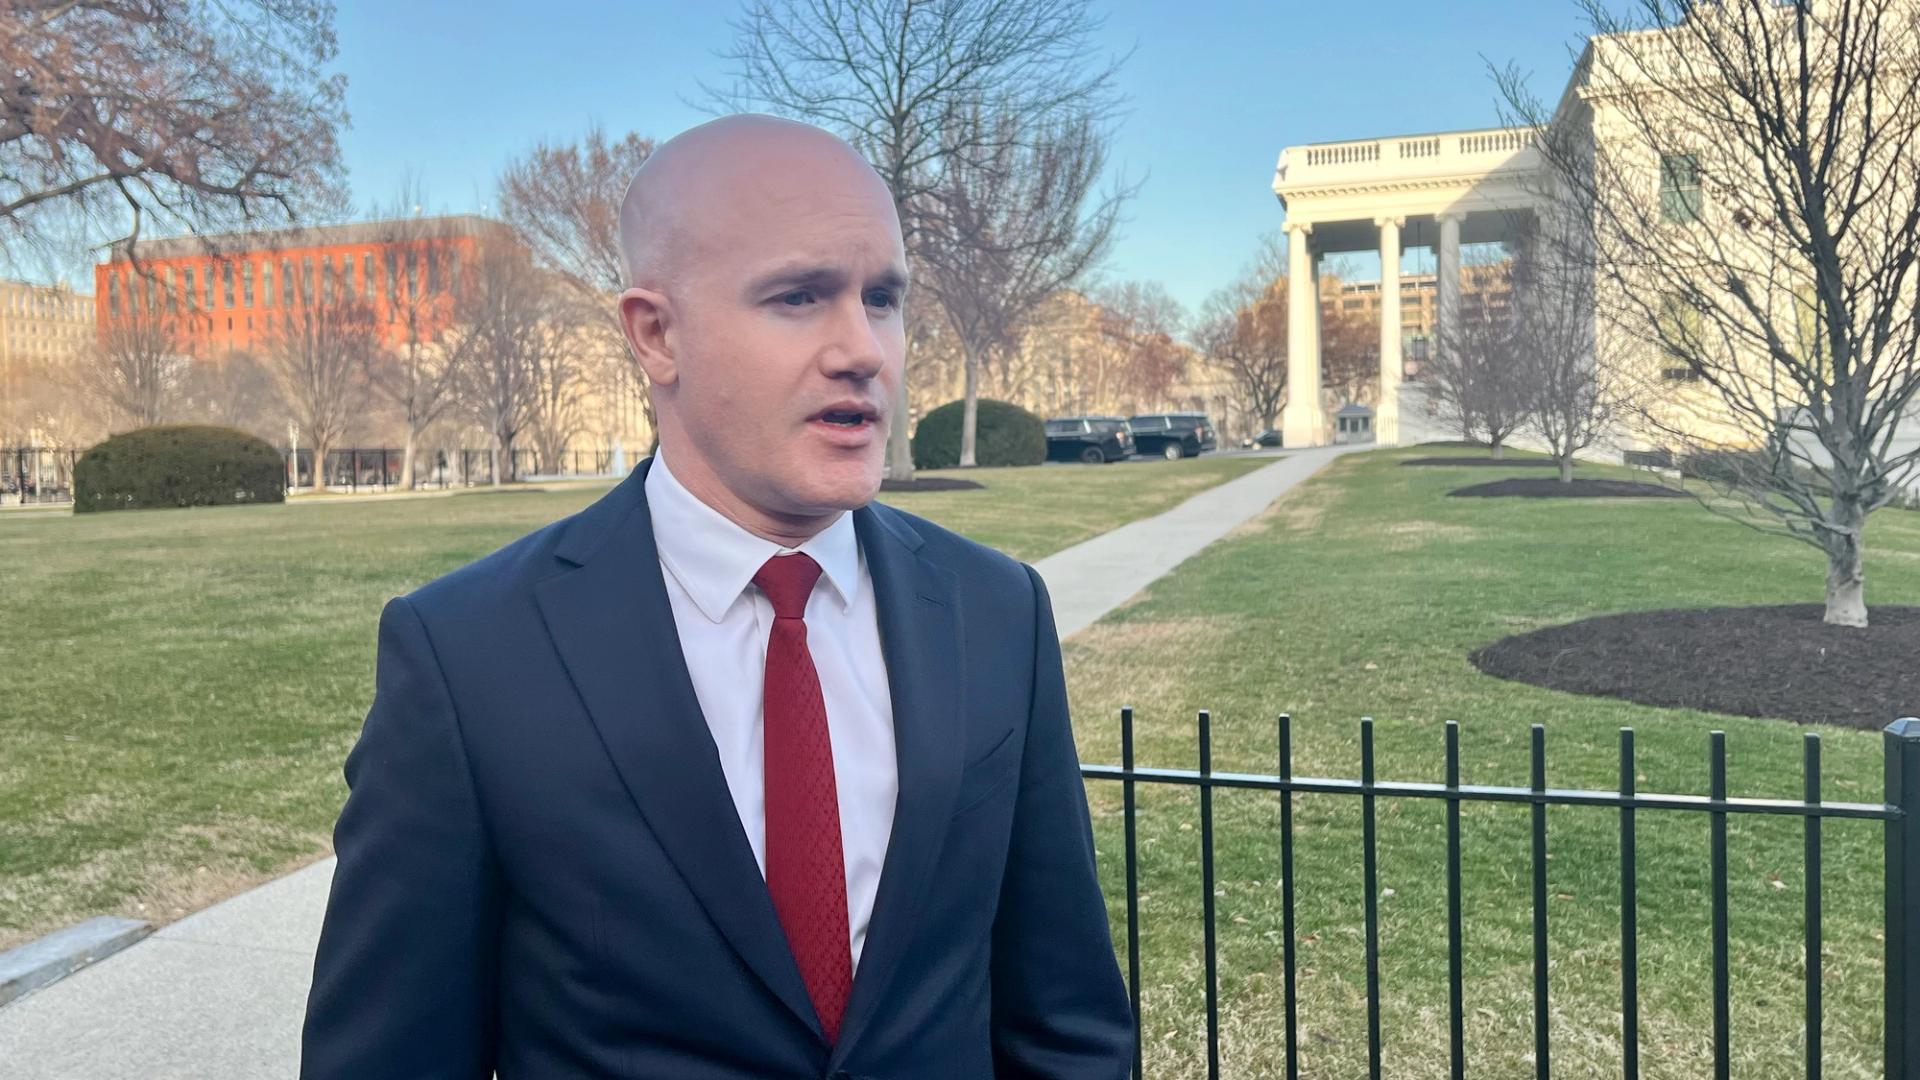

Coinbase is walking a tightrope in the negotiation over the Clarity Act, telling the staffs of U.S. senators that the company is not happy with where the lawmakers landed in their latest compromise, according to people familiar with the situation, but it hasn’t openly declared its opposition.
The proposed agreement was shown to stakeholders in the crypto industry on Monday and the banking industry on Tuesday. From the crypto industry side, it received mixed reactions, according to people familiar with the meeting on Monday. Some stakeholders were dissatisfied — most notably Coinbase — but others were “pleasantly surprised,” one of the people said. No one was able to take a copy of the text with them, and it has not yet been released for circulation.
Those familiar with the Monday gathering said there were still issues to work out, and suggested the proposal might impede stablecoin-related products and services beyond what they’d hoped for.
The new proposal would direct some regulatory agencies to draft rules establishing how, exactly, issues like rewards might be overseen. Some have had concerns about regulators issuing subjective criteria for how permissible activity would be governed, noting that there may end up being different types of rewards programs. Any rulemaking would need to be neutral, they said.
And the language was also said to potentially restrict firms’ ability to tie rewards to the scale of stablecoin transactions in an account, which could be an obstacle for a program akin to credit card rewards.
Through the months of negotiation, Coinbase CEO Brian Armstrong has been a leading voice, and his opposition of an earlier effort at stablecoin yield compromise helped derail a planned Senate hearing. A White House favorite in the crypto sphere, Armstrong leads the company that potentially has the most to lose from narrowing its stablecoin rewards programs.
On an industry call this week, people said Coinbase clashed with others over the bill, suggesting a fracturing of crypto views on how to proceed. Giving up certain stablecoin rewards could be costly for some, but losing the Clarity Act’s full-fledged establishment of crypto within the U.S. financial system is — for others — seen as a bigger risk.
The updated text that is released — expected either late this week or early next week — will likely have been revised from the text shared Monday and Tuesday, though lawmakers are unlikely to want to rewrite too much of the long-debated text.
So far, the bankers haven’t publicly shared their views on the proposal.
The crypto industry’s potential concerns with the approach pitched this week, first reported by CoinDesk, already caused chaos in the market for leading U.S. stablecoin issuer Circle and Coinbase’s stock. Circle stock dropped 20% on Tuesday, though it ticked up slightly on Wednesday. However, Tuesday’s news from its chief rival, Tether, about submitting to an audit may have been another factor in the hit to Circle’s shares, observers noted.
Despite negative responses to the Clarity Act revisions, Patrick Witt, the White House’s crypto adviser, criticized the “uninformed” people making predictions about the Clarity Act’s status.”It’s all going to work out,” he posted Wednesday on social media site X (formerly Twitter). “Bullish.”
One of the people advocating taking a step back:
“Everyone should take a chill pill and stay off Twitter,” the person said.


Coinbase is publishing its order book, spot and futures data on-chain through Chainlink DataLink, widening access to institutional-grade feeds for DeFi derivatives and tokenized assets.
Summary
- Coinbase has integrated Chainlink’s DataLink service to publish its exchange market data on-chain for the first time, covering order books, spot prices, and perpetual futures data from Coinbase International Exchange and Coinbase Derivatives Exchange.
- The datasets — which underpin billions of dollars in institutional trading activity — are now accessible to DeFi protocols building derivatives, tokenized real-world assets, structured products, and next-generation lending risk engines.
- The integration follows Chainlink’s existing role as Coinbase’s exclusive interoperability provider for Coinbase Wrapped Assets, and builds on the earlier Base-Solana bridge secured by Chainlink CCIP.
Coinbase has integrated Chainlink‘s DataLink service to bring its premium exchange market data on-chain for the first time, the two companies announced Wednesday in a joint press release — marking what both firms described as a significant milestone in decentralized finance market infrastructure. According to a PR Newswire announcement, DeFi protocols and developers can now access Coinbase’s order book data, spot prices, perpetual futures data from Coinbase International Exchange, E-mini futures from Coinbase Derivatives Exchange, and additional datasets spanning crypto, metals, energy, and equity futures — all delivered via Chainlink’s oracle infrastructure.
Liz Martin, Vice President of Coinbase Markets, said the company was “excited to build on our existing Chainlink integrations by adopting DataLink to publish Coinbase’s exchange market data onchain for the first time.” She added that the Chainlink data standard is “battle-tested, institutional-grade infrastructure,” describing it as the clear choice for bringing Coinbase’s market data into on-chain markets, and noting that its benchmarks would enable DeFi and TradFi developers to “build more robust onchain apps across derivatives, tokenized assets, and more.”
Johann Eid, Chief Business Officer at Chainlink Labs, framed the announcement in broader terms. “Coinbase bringing its exchange data onchain through Chainlink sends a clear signal,” Eid said. “By delivering institutional-grade exchange data to blockchains, we are proving that the future of finance requires a foundation of uncompromising security. We aren’t just moving data; we are building the programmable market infrastructure defining the next era of tokenization.”
The practical implications reach well beyond data access. High-quality exchange data has long been a bottleneck for on-chain derivatives markets, synthetic assets, tokenized real-world assets, and lending risk engines. DeFi protocols have typically relied on decentralized price oracles that aggregate data from multiple sources — functional, but lacking the depth and granularity of a direct feed from one of the world’s largest institutional crypto exchanges. Coinbase operates one of the most institutionally integrated crypto exchanges globally, and a previous crypto.news story noted that despite Hyperliquid surpassing Coinbase’s 2025 notional trading volume with $2.6 trillion versus $1.4 trillion, Coinbase’s institutional infrastructure remains a reference benchmark for the market.
Wednesday’s integration is the latest in a deepening partnership between the two firms. Earlier in March, a previous crypto.news story detailed how Chainlink CCIP enabled bridging of Coinbase’s cbBTC — backed 1:1 by Bitcoin in custody, with more than $5 billion in circulation — from Base to Monad, unlocking Bitcoin-backed liquidity for DeFi lending and trading. Chainlink was also selected as Coinbase’s exclusive interoperability provider for all Coinbase Wrapped Assets, and secured the Base-Solana bridge that went live in December 2025.
The DataLink service is not exclusive to Coinbase. Chainlink’s institutional data publishing infrastructure is also used by S&P Global and FTSE Russell, signaling a deliberate strategy to position the oracle network as the standard bridge between traditional financial data and on-chain markets. Coinbase, for its part, continues to push toward what a previous crypto.news story described as its “everything exchange” vision — a unified platform spanning trading, borrowing, staking, and now, institutional-grade data infrastructure for the broader DeFi ecosystem.


Payy raised $6m led by FirstMark to build a zero-knowledge L2 and wallet that make USDC payments private by default, targeting enterprise stablecoin flows that avoid fully transparent chains.
Summary
- Payy, a New York-based stablecoin startup, closed a $6 million seed round led by FirstMark Capital in December 2025, bringing its total funding to $8 million.
- The company is building a privacy-focused payments network using zero-knowledge proofs, arguing that public blockchain transparency is a fundamental blocker to enterprise stablecoin adoption.
- Payy already has 100,000+ users across 120 countries and processes around $130 million in annualized transaction volume, with a mainnet rollout planned for this summer.
Payy, a stablecoin startup building a privacy-focused payments network on zero-knowledge infrastructure, has raised $6 million in seed funding led by FirstMark Capital — an early backer of Airbnb, Shopify, and Pinterest — with participation from Robot Ventures and DBA Crypto, the company announced Wednesday. According to The Block, the round closed in December 2025 and was structured as a simple agreement for future equity (SAFE) with attached token warrants, bringing Payy’s total capital raised to $8 million including a $2 million pre-seed raised under its former identity as Polybase.
“We were preempted by FirstMark,” Payy co-founder and CEO Sid Gandhi told The Block. The company’s core argument is one that a growing chorus of stablecoin builders are raising — that on-chain payments are too transparent to attract serious enterprise volume. “Today, sending a stablecoin payment is like posting your bank statement on a public website,” Gandhi said. “Every amount, every recipient, every balance, visible to anyone. Enterprises will never move meaningful payment flows onchain if every transaction is visible to the world.” A previous crypto.news opinion made a similar case, arguing that if stablecoins aren’t private, nothing is.
Payy was originally founded as Polybase, a web3 database project, before pivoting toward stablecoin payments in 2023. Gandhi said the pivot came from realizing that zero-knowledge technology built for the database could plug what he sees as a structural gap in the stablecoin stack. The company now offers a self-custodial wallet — launched in January 2024 — and a Visa card that went live in August 2025, allowing users to spend USDC anywhere Visa is accepted while keeping on-chain transactions private.
Payy’s longer-term infrastructure play is the Payy Network, an Ethereum Layer 2 rollup using zero-knowledge proofs to shield transaction details including sender, receiver, and amounts. The company announced the network last month. A testnet is expected to launch next month, with a mainnet rollout planned for this summer. A native token is also in the pipeline, though Gandhi declined to set a timeline. A previous crypto.news story on USDCx highlighted how Aleo’s zero-knowledge infrastructure is pursuing a near-identical thesis — private stablecoin transfers with selective regulatory disclosure — suggesting the market for this architecture is becoming genuinely competitive.
Payy is based in New York and has a team of 12, with plans to hire across business development and engineering. The platform currently serves more than 100,000 users across 120 countries, processing roughly $130 million in annualized transaction volume. The company generates revenue through onramping fees, gas fees, and enterprise contracts.
Gandhi said a dozen design partners are already building on the testnet to add privacy to “billions of dollars of stablecoin flows,” and framed the FirstMark relationship as a direct channel into enterprise distribution. “With the FirstMark investment, we have access to some of the best technology-forward companies on the planet, who we plan to onboard to stablecoins in the coming months,” he said. Payy now joins a broader wave of stablecoin infrastructure startups attracting institutional capital, including Gnosis, which entered U.S. markets through a partnership with stablecoin startup Noah after the latter raised $22 million in seed funding.
Truth Social owner, Trump Media and Technology Group, has diversified into cryptocurrency and is planning to launch both exchange-traded funds (ETFs) and prediction markets. Truth Social also one of the most important places to keep up to date with Donald Trump’s personal thoughts about the ongoing actions of his administration, including in Iran.
On February 28, US forces in coalition with Israel, began a war with Iran.
The Trump administration has been inconsistent in describing its motivations for this war, at points claiming it was because of Iran attempting to create a nuclear weapon.
However, undercutting that explanation is the fact that in June of last year, Trump stated unequivocally that the strikes that month were intended to result in the “destruction of Iran’s nuclear enrichment capacity and a stop to the nuclear threat,” and were “a spectacular military success.”
He also posted following that strike to say, “NOW IS THE TIME FOR PEACE!”
There’s currently a war. Not only that, it’s an arguably unconstitutional war that lacks any formal declaration, a power reserved for Congress.
Adding to the strangeness surrounding the conflict are a variety of troubling claims posted by Trump on Truth Social.
All transcriptions of Trump’s messages seen below are reproduced exactly as he wrote them and all emphasis is his.
February 28
The day the conflict started, Trump posted repeatedly on Truth Social.
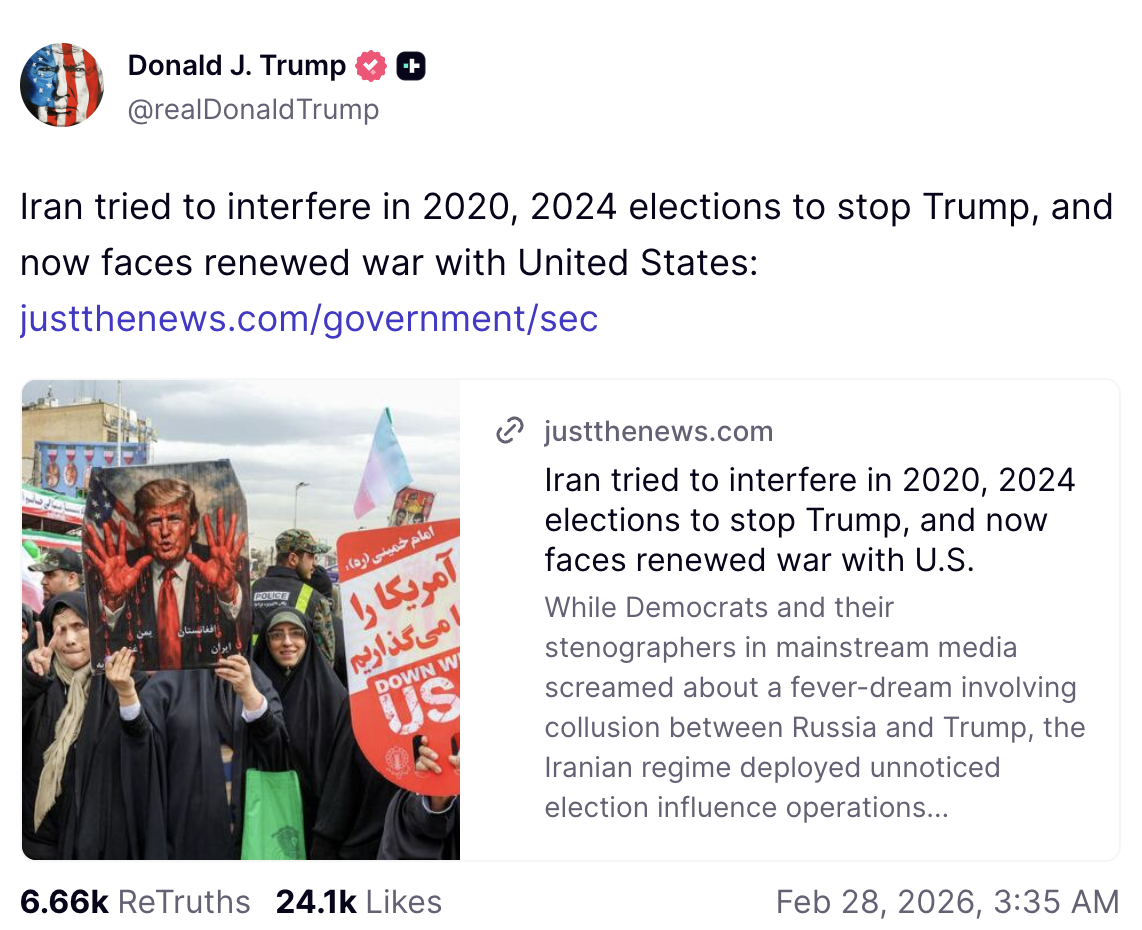
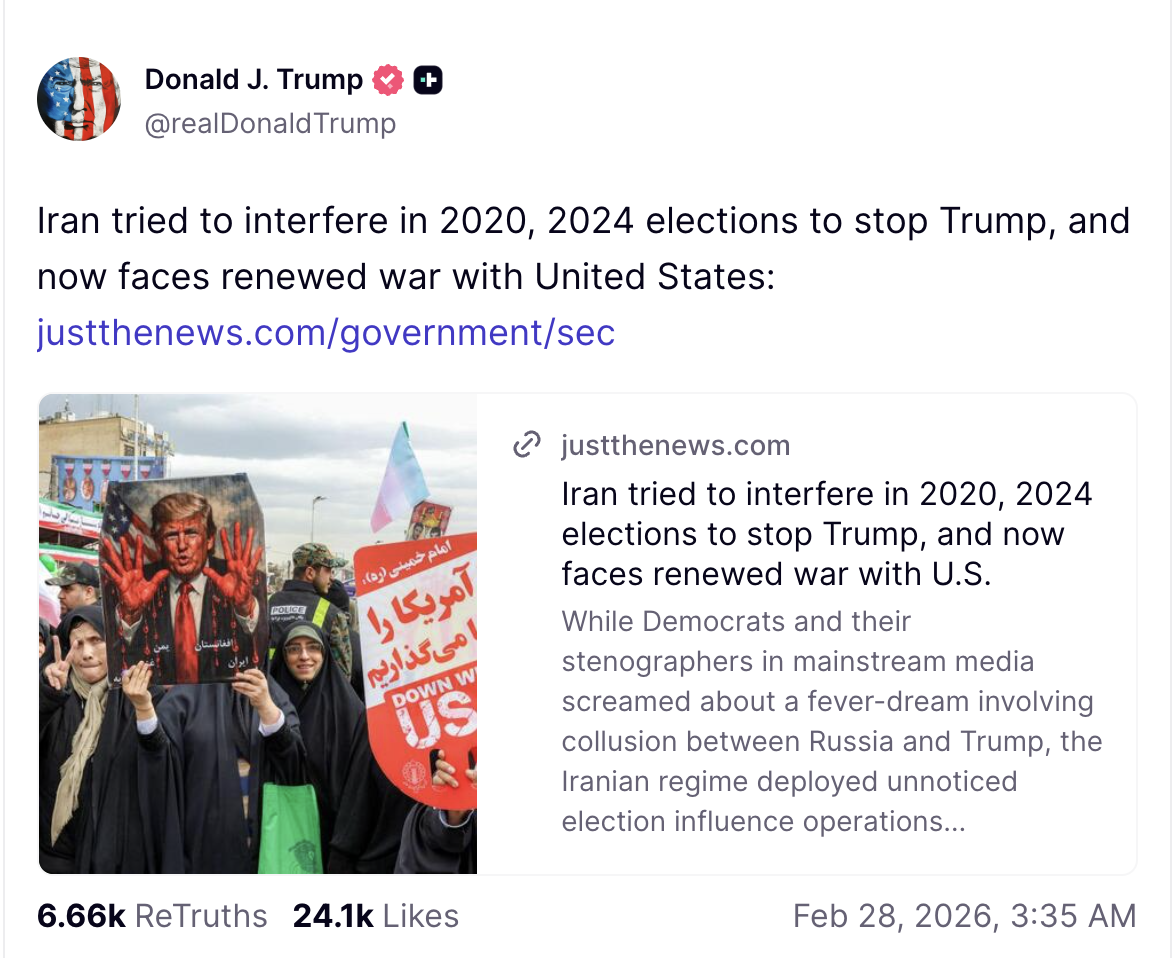
In one message, he reposted an article from the website Just The News, which makes the extraordinary claim that “Iran tried to interfere in 2020, 2024 elections to stop Trump, and now faces renewed war with United States.”
To support this claim, Just The News references Trump’s campaign announcement claim that Iran had planned to assassinate him, as well as a Semafor report that Trump FBI appointee Kash Patel had been targeted by an Iranian cyberattack.
It’s not clear if Trump believes the war is in retaliation for this, or if it’s supposed to be about nuclear weapons, or because Iran was a state sponsor of terrorism, or because of some vague failure of the Democrats.
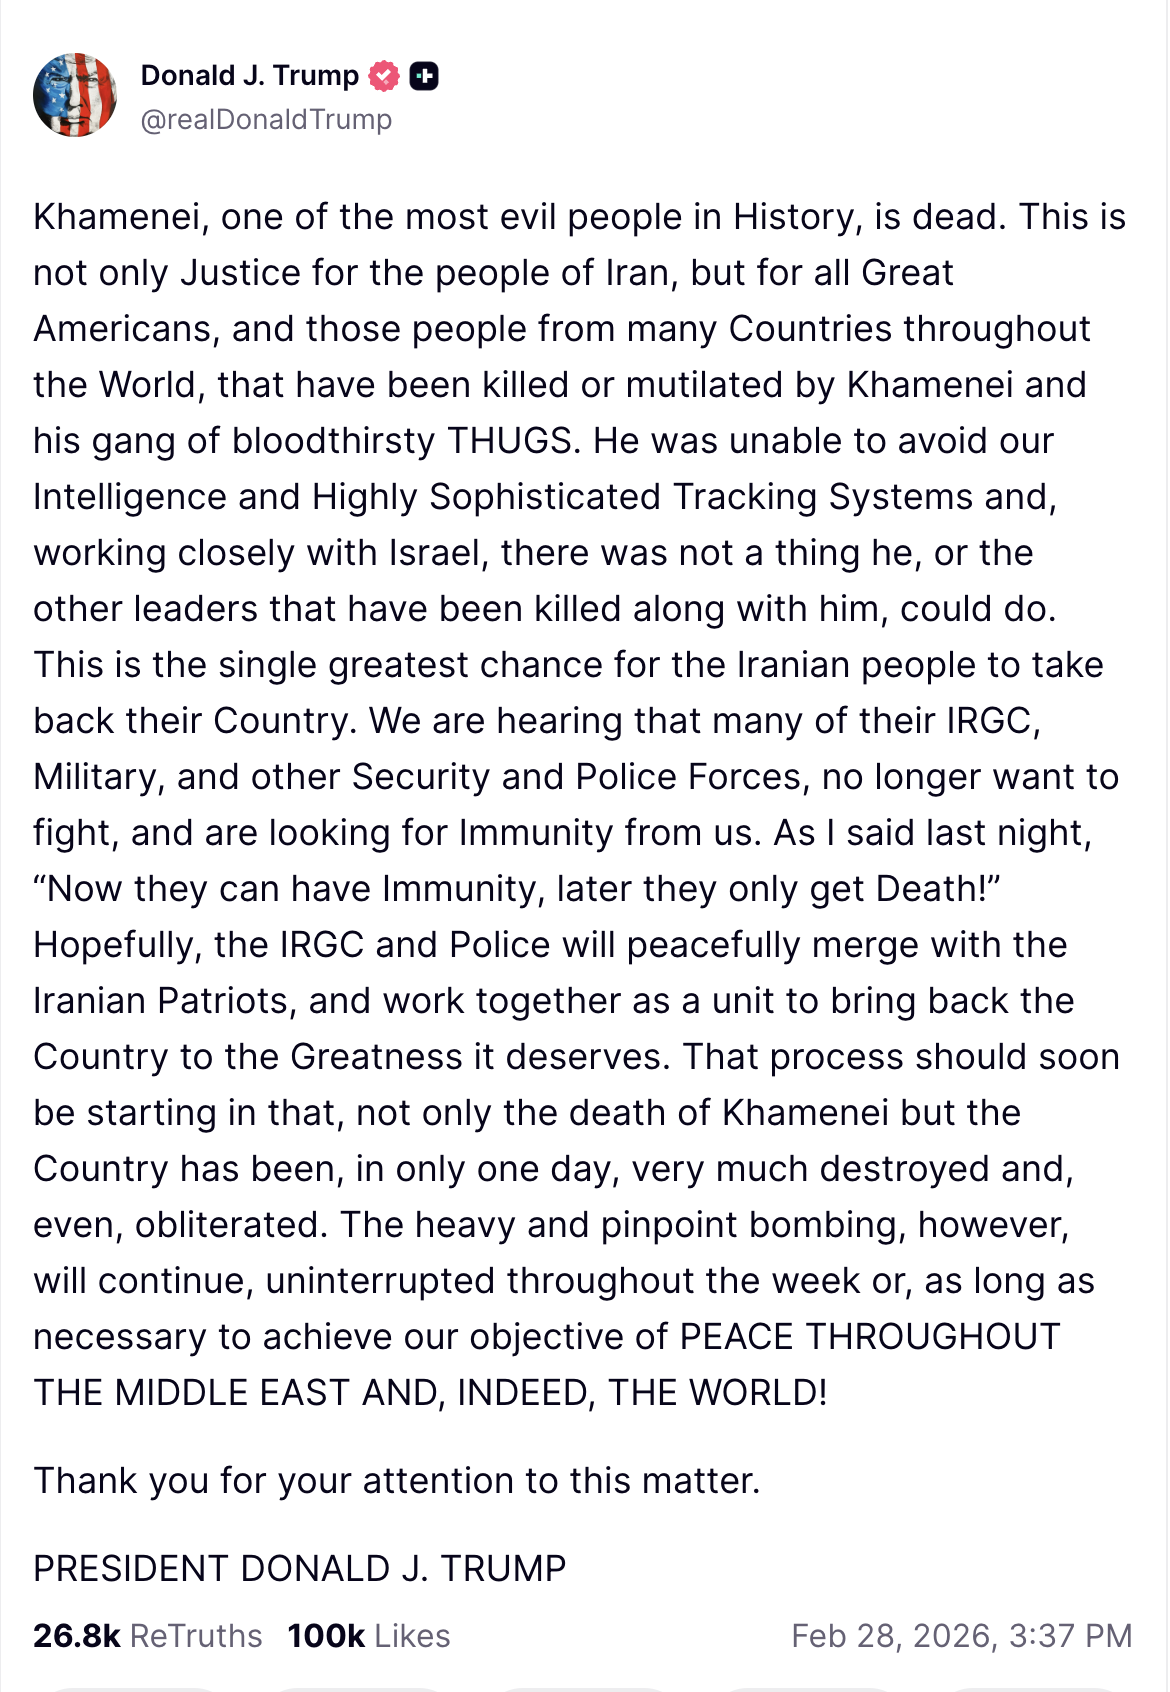
Another post from the same day, which announced the death of Supreme Leader Ali Khamenei, claimed that his death was some form of justice, despite the fact that Khamenei wasn’t tried in any court.
That same post made the claim that Iran “has been, in only one day, very much destroyed and, even, obliterated.”
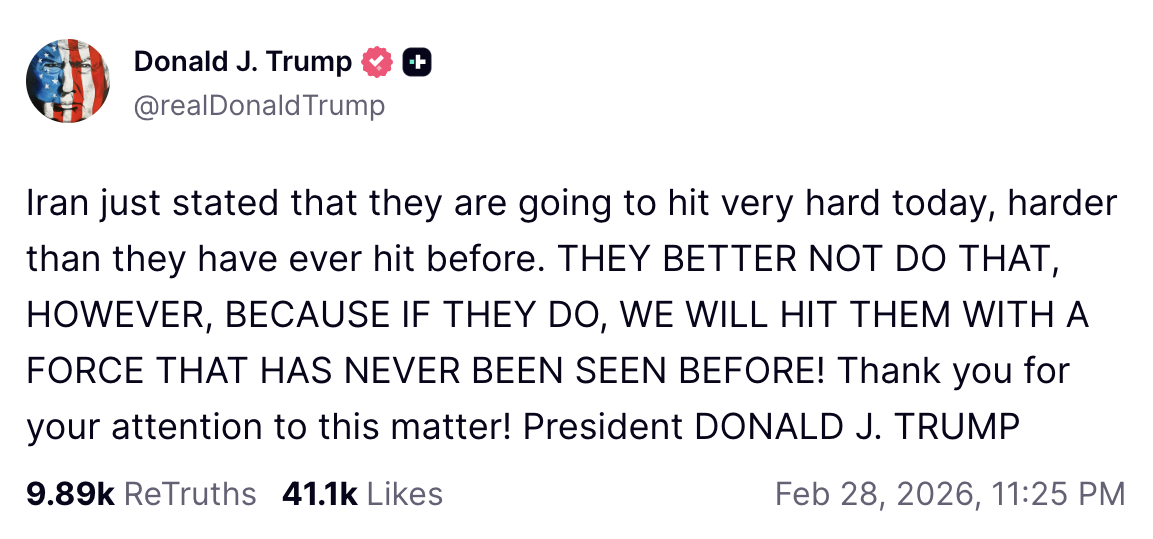
Hours later, Trump posted the claim that should Iran respond, the United States “WILL HIT THEM WITH A FORCE THAT HAS NEVER BEEN SEEN BEFORE!”
It’s important to note that the US is the only nation on Earth to use nuclear weapons in combat, and Trump is promising to go even further.
March 1
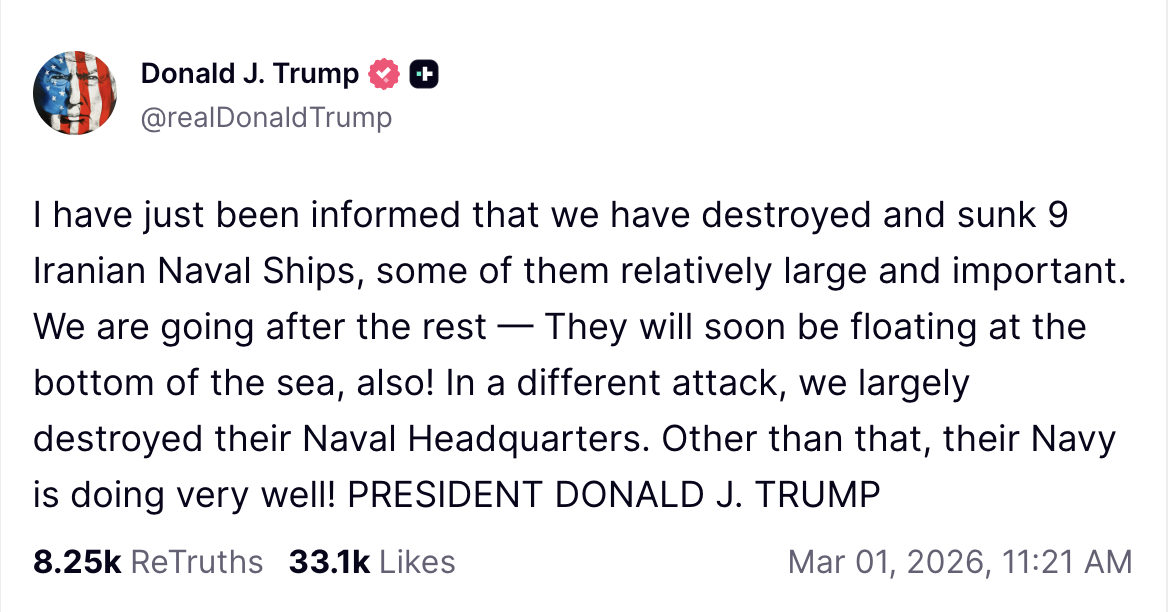
The second day of the war brought just one post from the president, in which he made the claim that “we have destroyed and sunk 9 Iranian Naval Ships, some of them relatively large and important.
“We are going after the rest — They will soon be floating at the bottom of the sea, also! In a different attack, we largely destroyed their Naval Headquarters.”
He signed off with a sarcastic “Other than that, their Navy is doing very well!”
March 2
March 2, the third day of this undeclared war, saw Trump repeatedly take to his personal social media site.
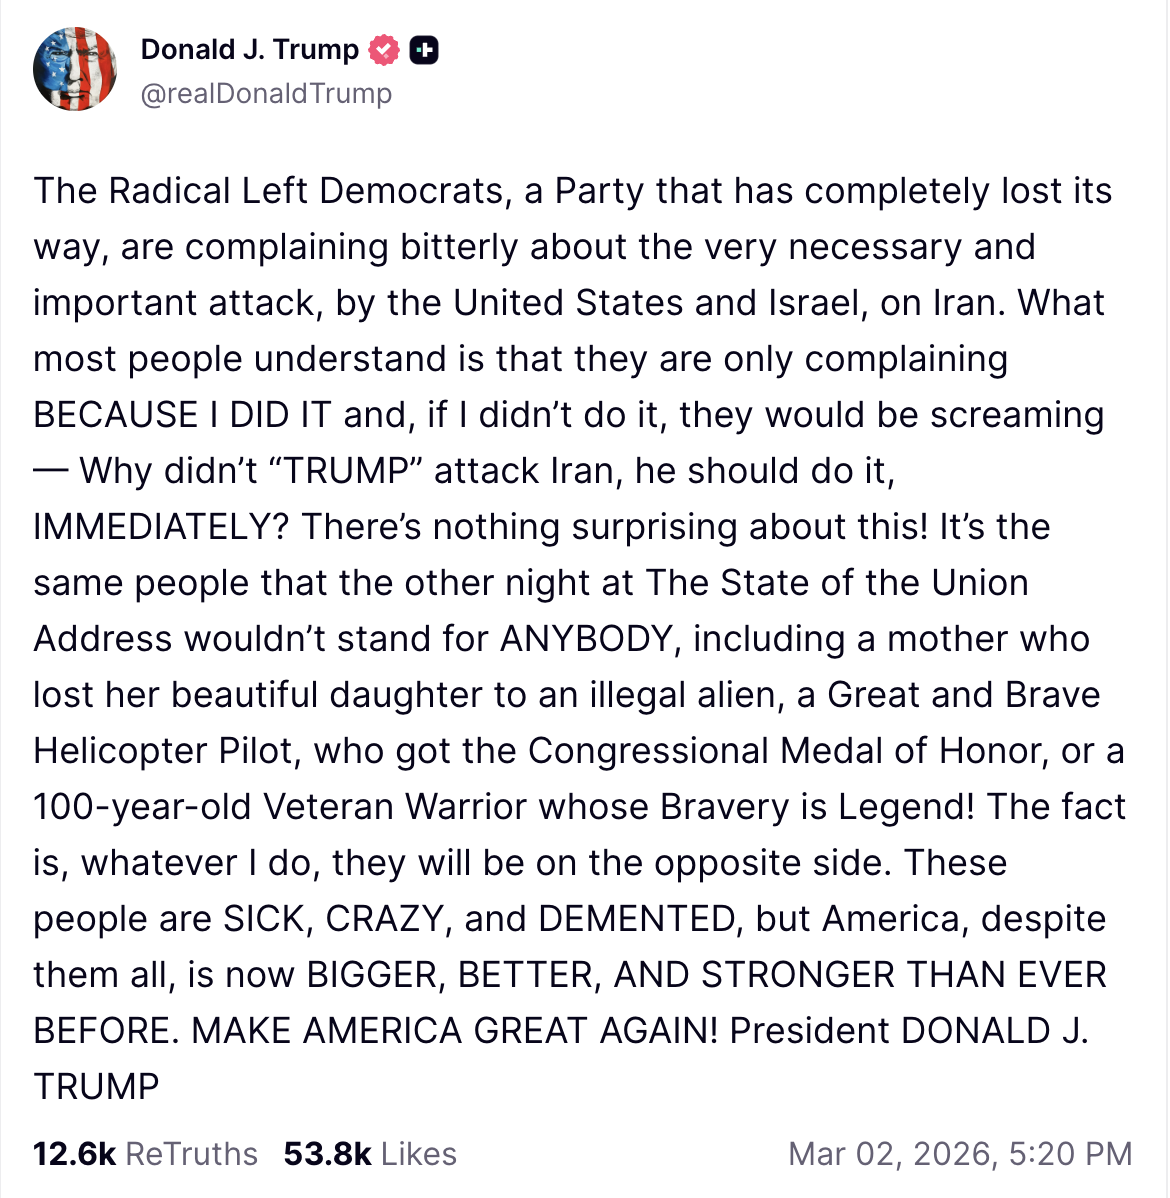
In his first post, he complained about the Democrats, apparently convincing himself that “they are only complaining BECAUSE I DID IT and, if I didn’t do it, they would be screaming — Why didn’t “TRUMP” attack Iran, he should do it, IMMEDIATELY?”
The rest of his post is a complaint about members of the Democratic Party performing a milquetoast protest during his State of the Union, wherein they didn’t stand during the proceedings.
This post was followed by one that echoed Shakespearean concerns about a lady who “doth protest too much.”
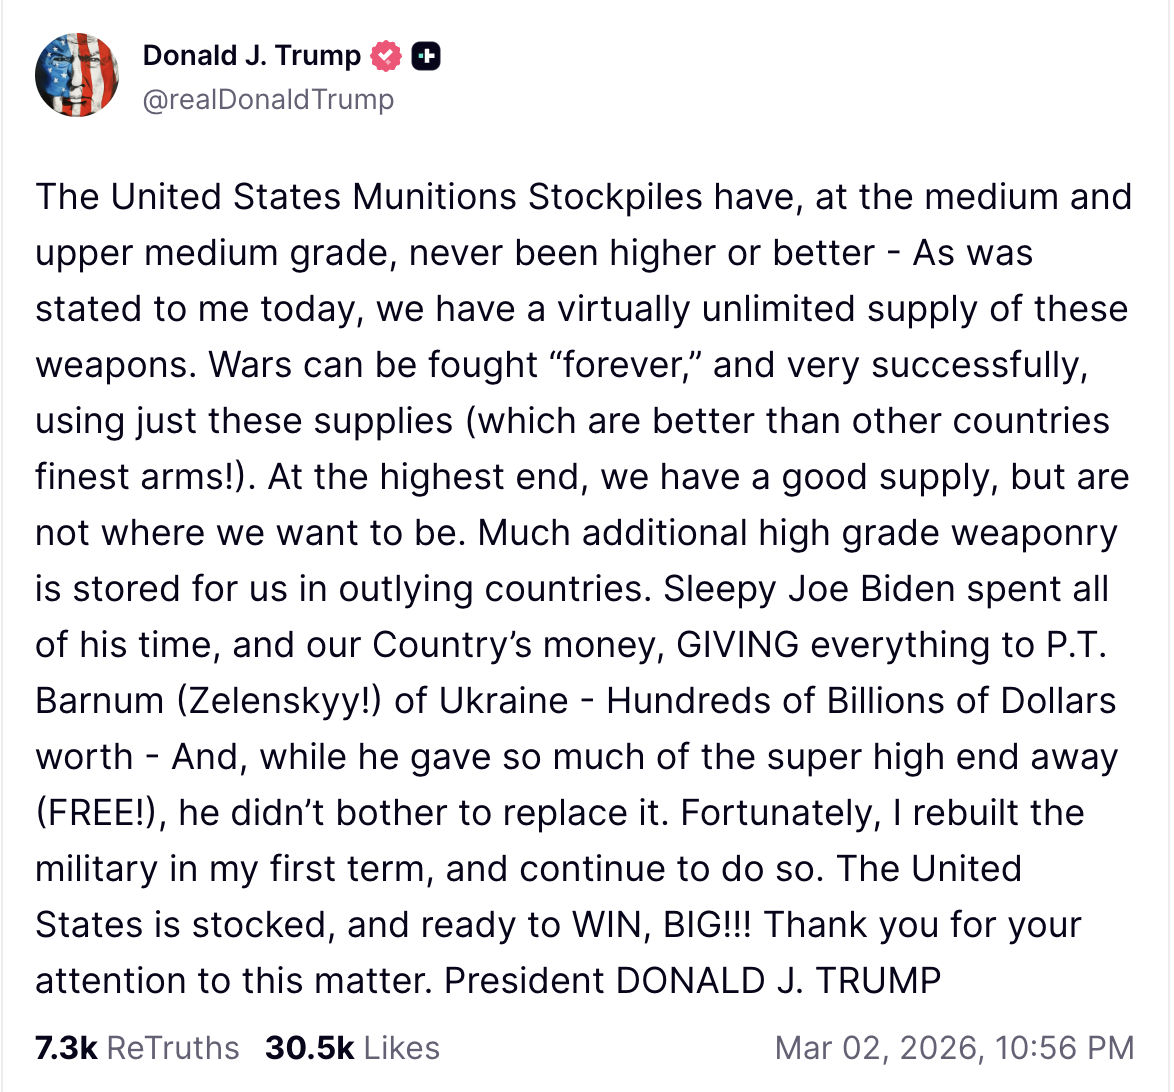
Trump declared, “The United States Munitions Stockpiles have, at the medium and upper medium grade, never been higher or better — As was stated to me today, we have a virtually unlimited supply of these weapons.
“Wars can be fought ‘forever,’ and very successfully, using just these supplies (which are better than other countries finest arms!)”
The rest of the post sees Trump complaining about previous arms and munitions that had been provided to Ukraine as part of congressionally approved aid for Ukraine to withstand Russia’s illegal and unethical war of conquest.
March 3

On March 3, Trump declared that Iran’s “air defense, Air Force, Navy, and Leadership is gone. They want to talk. I said “Too Late!””
This was several days after he declared that Iran had been obliterated.

This post was followed by another in which Trump noted that “more than 9,000 Americans have safely returned home from the Middle East” and encouraged other people who might be endangered by the ongoing war to register with the State Department.
After this near acknowledgement that his war had endangered Americans, there were several days where Trump’s posts weren’t about the war he started.
March 6
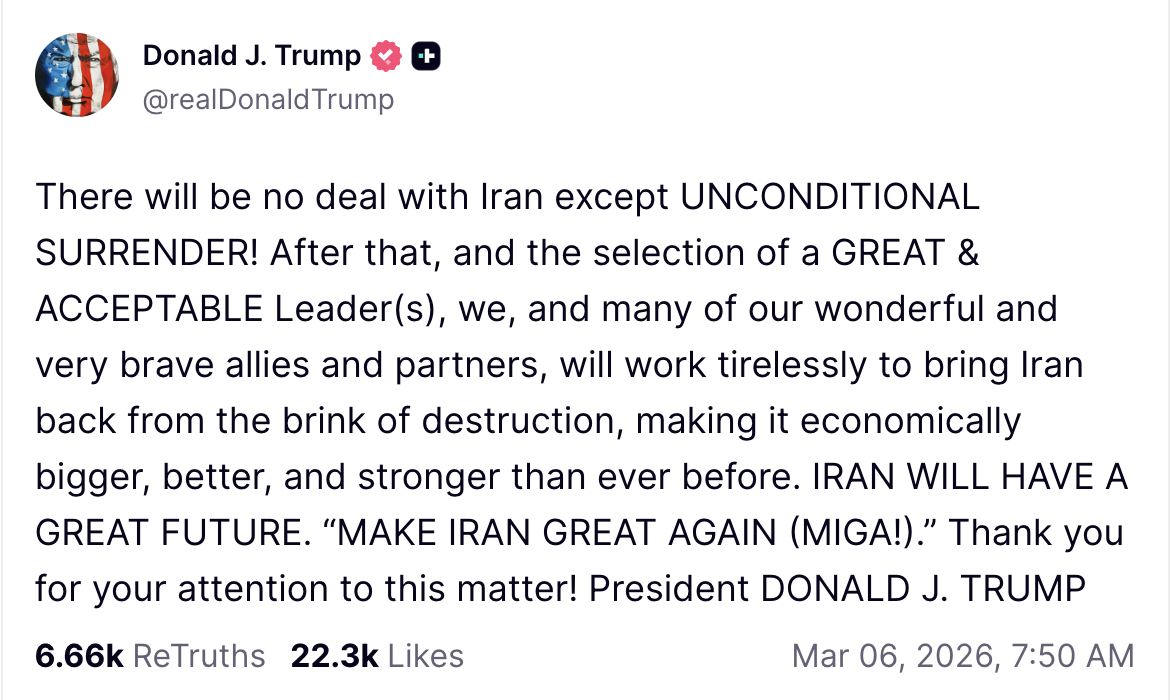
On March 6, Trump announced to the “obliterated” Iran that “There will be no deal with Iran except UNCONDITIONAL SURRENDER!”
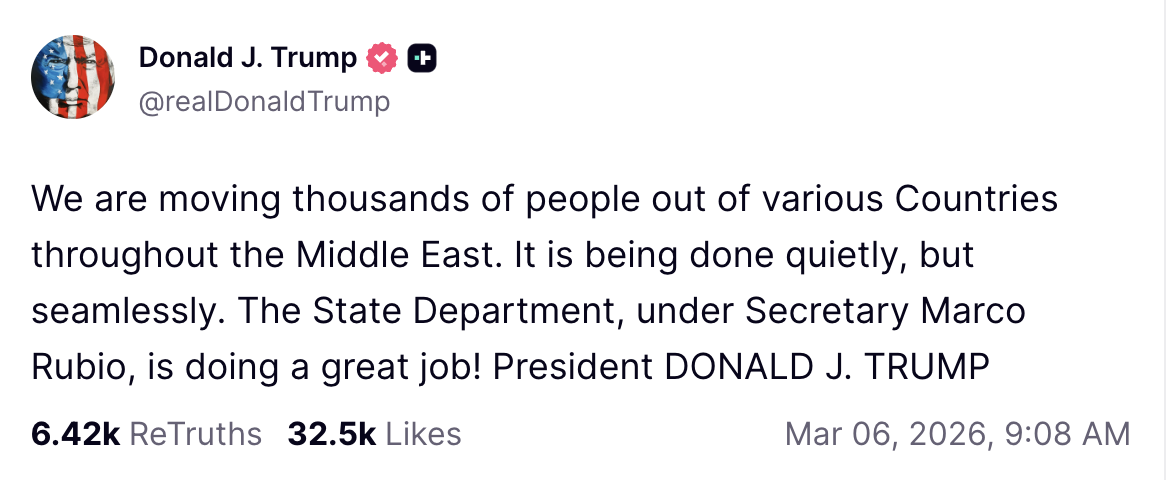
This was followed by another acknowledgement that the US needed to evacuate Americans, noting, “We are moving thousands of people out of various Countries throughout the Middle East.”
Confusingly, considering this is a public post, he also claimed that it was “being done quietly.”
March 7
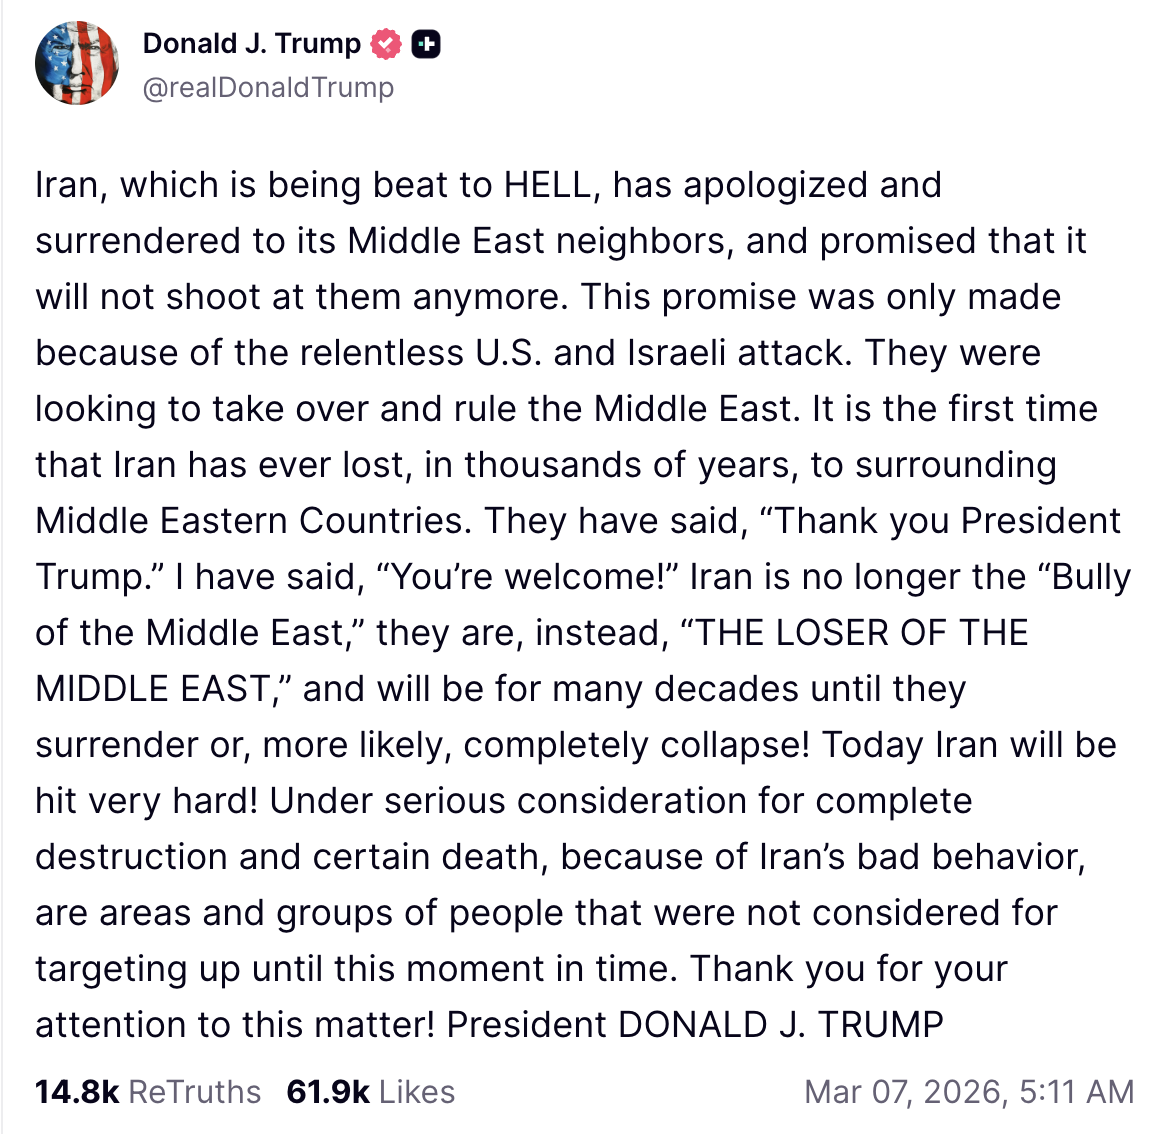
March 7 brought with it more confusing claims from Trump, including that “Iran, which is being beat to HELL, has apologized and surrendered to its Middle East neighbors, and promised that it will not shoot at them anymore.”
According to Trump, “This promise was only made because of the relentless U.S. and Israeli attack.”
This was followed by a threat that “Today Iran will be hit very hard!”
More troublingly, Trump indicated a willingness to target “areas and groups of people that were not considered for targeting up until this moment in time.”
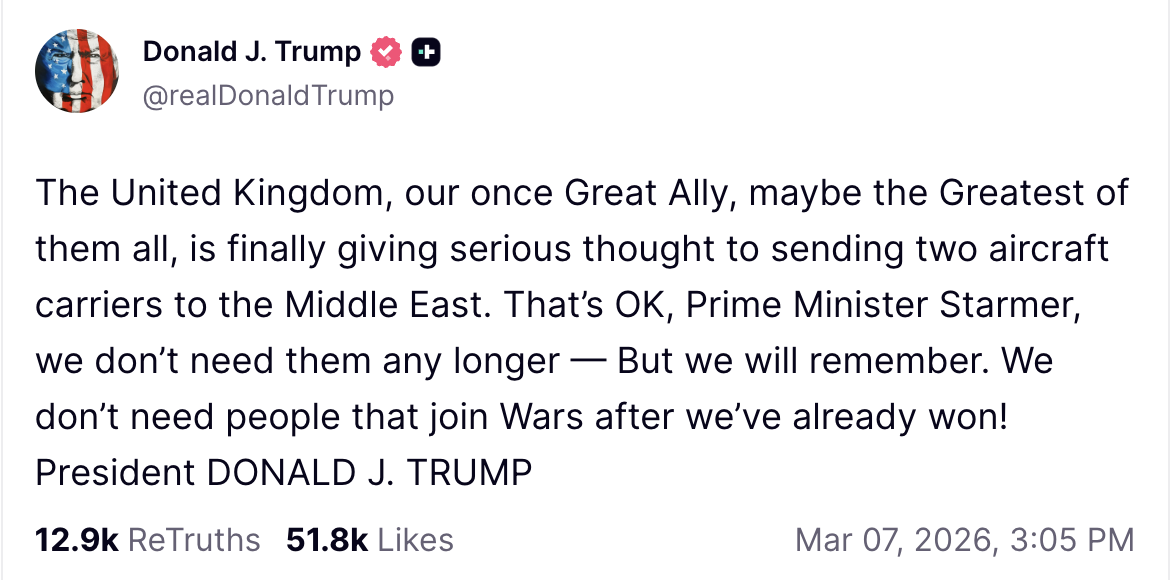
Later, he noted, “The United Kingdom, our once Great Ally, maybe the Greatest of them all, is finally giving serious thought to sending two aircraft carriers to the Middle East.”
However, Trump then informed Prime Minister Keir Starmer that “we don’t need them any longer — But we will remember. We don’t need people that join Wars after we’ve already won!”
March 8
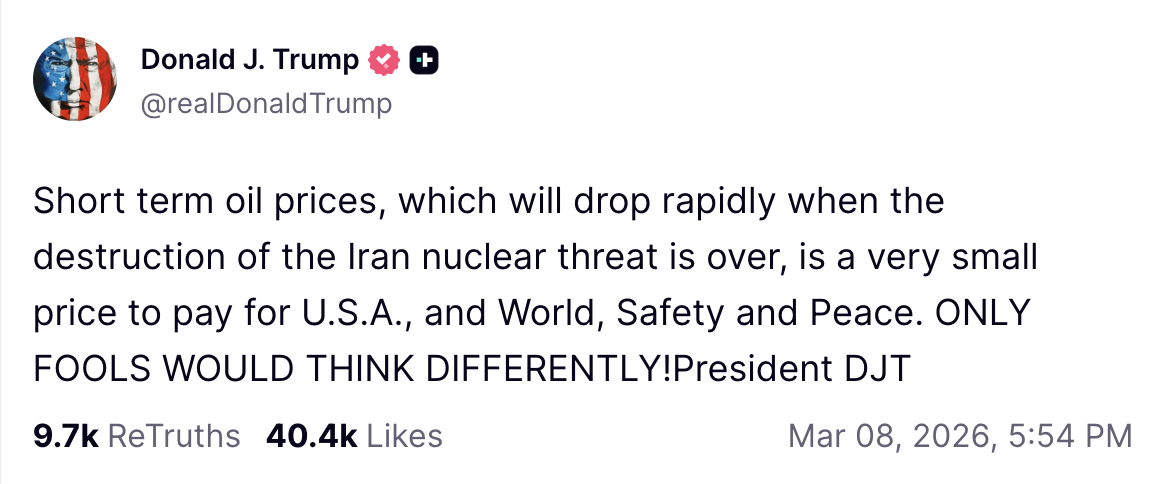
On March 8, Trump wanted to comfort Americans worried about the surge in oil prices and so claimed that these short term increases would “drop rapidly when the destruction of the Iran nuclear threat is over.”
This comes more than a week after Iran was supposedly “obliterated” and months after the “very successful” June strikes.
Trump added that “ONLY FOOLS” would believe that these oil prices wouldn’t drop rapidly.
March 9
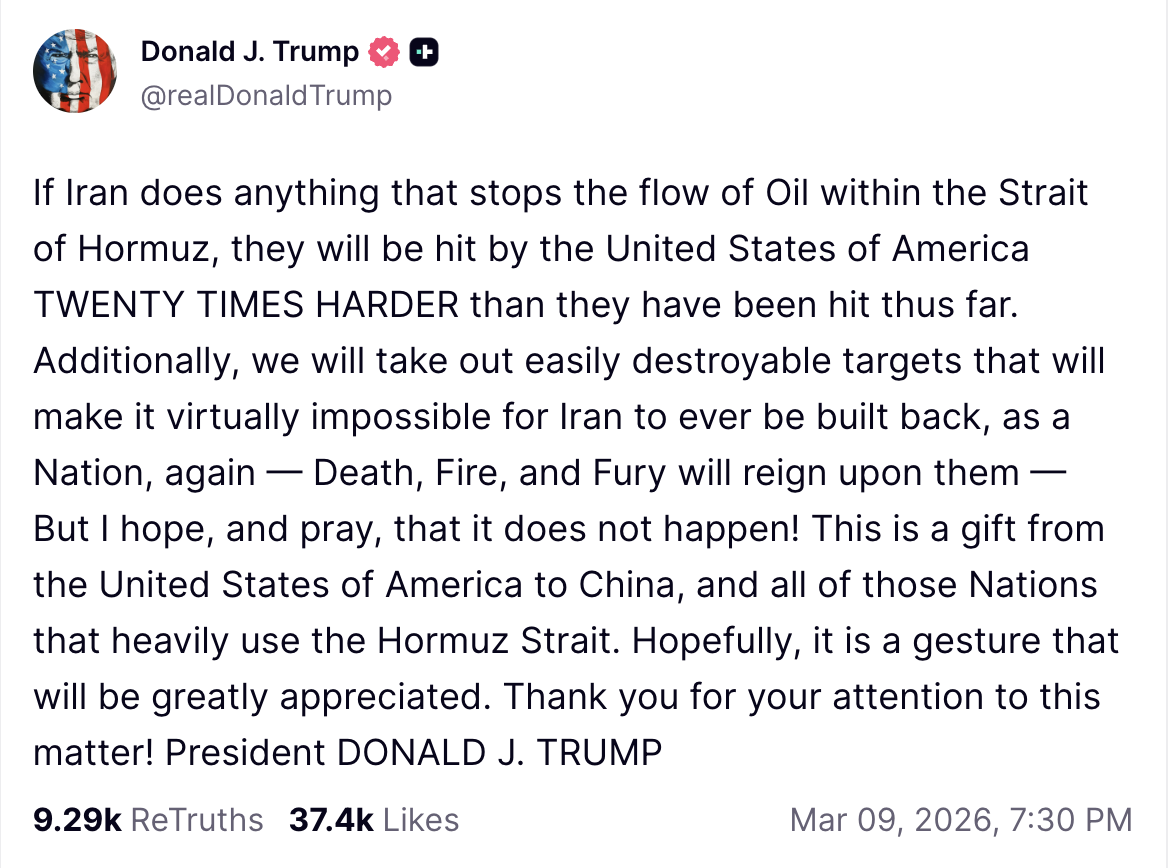
The very next day, Trump threatened Iran, claiming “they will be hit by the United States of America TWENTY TIMES HARDER than they have been hit thus far” if they did “anything that stops the flow of Oil within the Strait of Hormuz.”
March 10
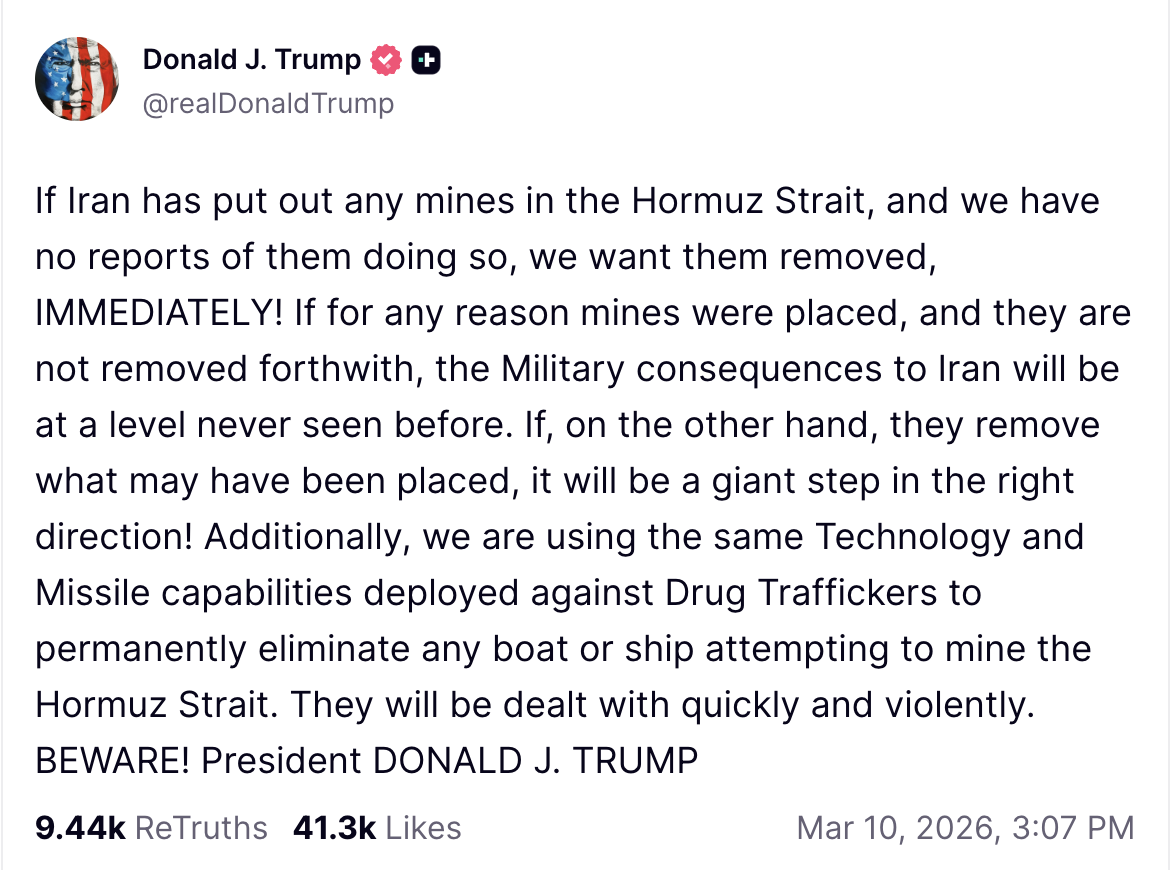
The next day, he threatened Iran again, saying that “If for any reason mines were placed, and they are not removed forthwith, the Military consequences to Iran will be at a level never seen before.
“If, on the other hand, they remove what may have been placed, it will be a giant step in the right direction! Additionally, we are using the same Technology and Missile capabilities deployed against Drug Traffickers to permanently eliminate any boat or ship attempting to mine the Hormuz Strait.”
He concluded, “They will be dealt with quickly and violently. BEWARE!”
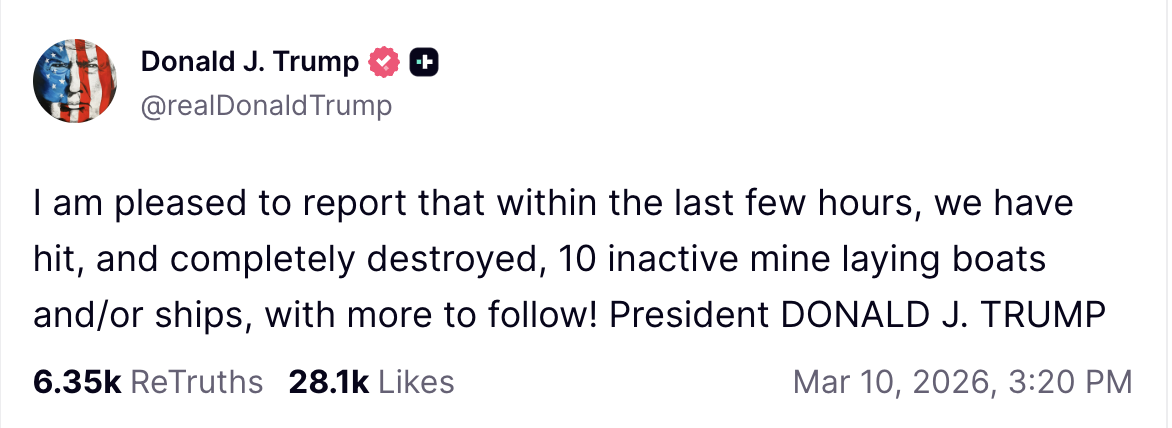
This was followed by a claim that the US had “hit, and completely destroyed, 10 inactive mine laying boats and/or ships.”
It’s not clear what impact this might have had on active mine laying and/or ships.
March 12
March 12 was a busy day for the “leader of the free world.” Nevertheless, he continued to post updates on an undeclared war on a social media platform he continued to own while serving as president.
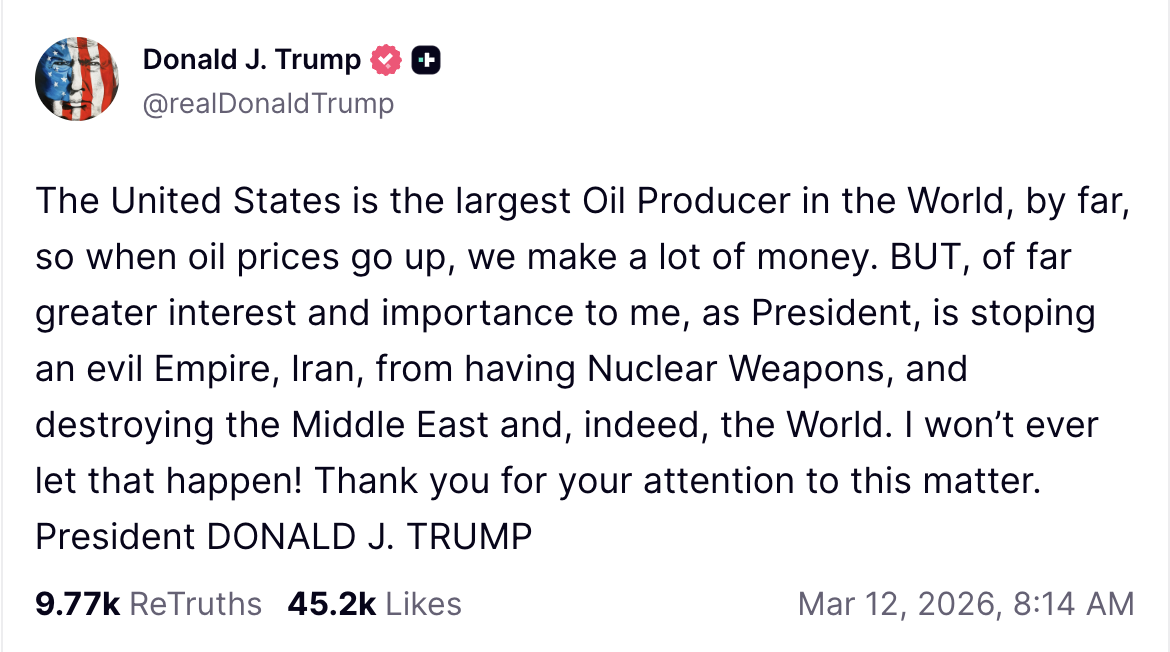
This included making the claim that the US benefits when oil prices go up, but he clarified that this wasn’t his motivation.
His motivation was, apparently, “stoping [sic] an evil Empire, Iran, from having Nuclear Weapons, and destroying the Middle East and, indeed, the World.”
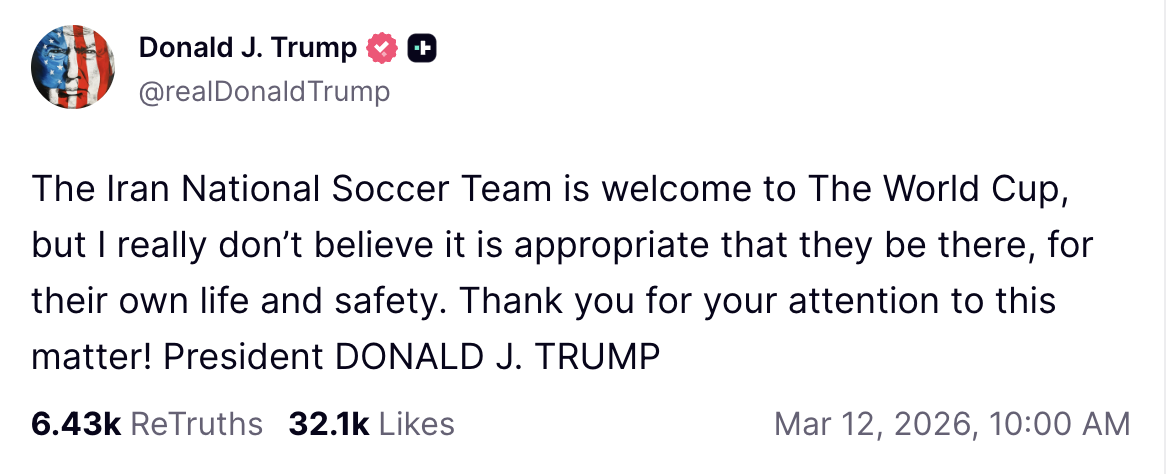
This was followed by a thinly-veiled threat to the Iranian National Soccer Team.
Trump warned that they’re welcome at the World Cup but noted that he doesn’t “believe it is appropriate that they be there, for their own life and safety.”
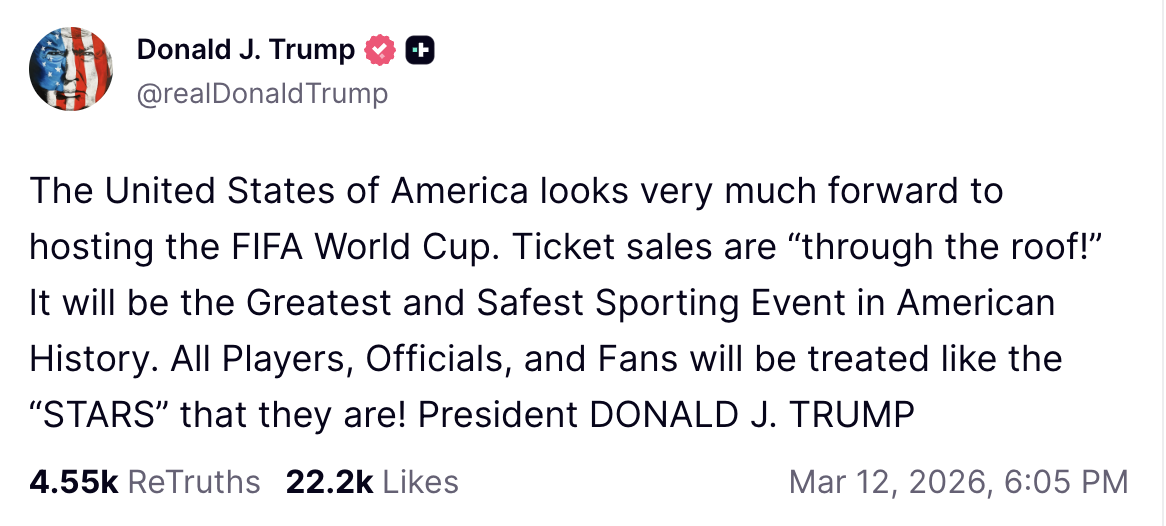
Shortly after, Trump announced that “All Players, Officials, and Fans will be treated like the ‘STARS’ that they are!”
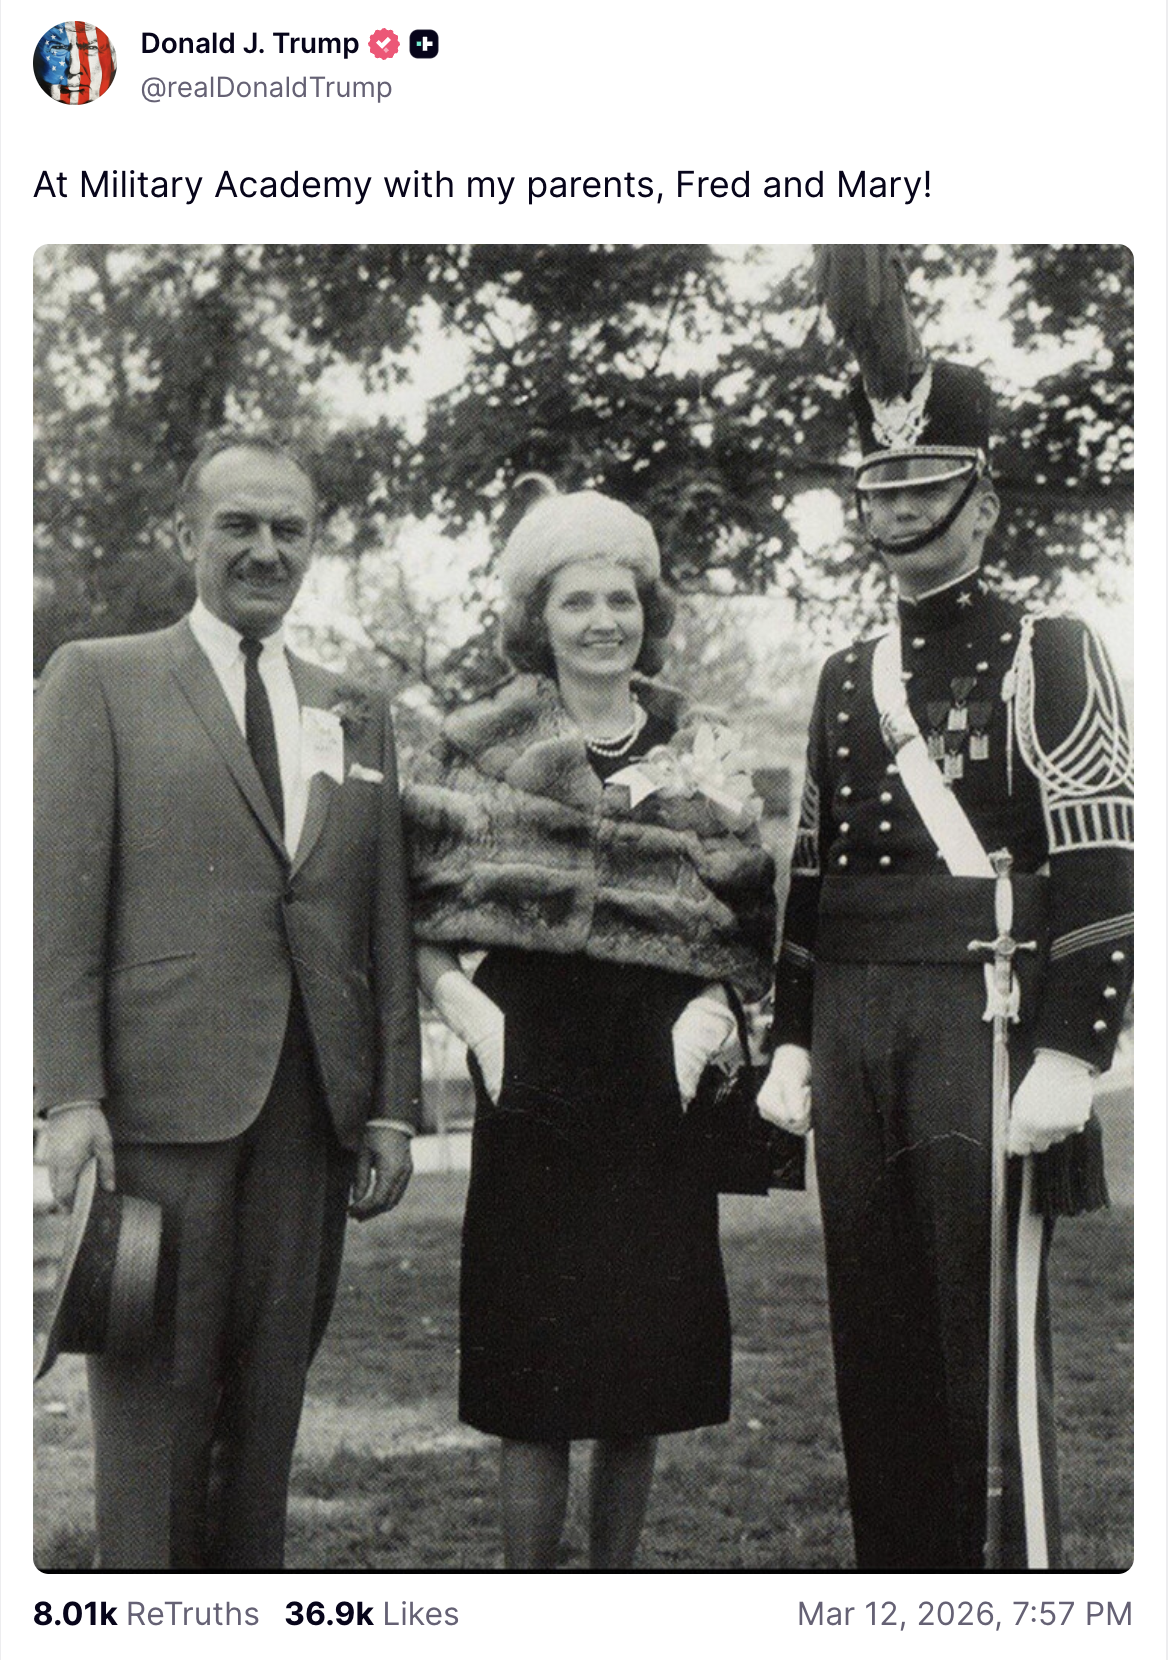
Following that, Trump gave in to nostalgia and posted an old picture of him in his military school uniform.
It’s important to include the context that when Trump was drafted in Vietnam, he was exempted because of a case of bone spurs.
Additionally, he reportedly described Americans who died in conflict as “losers” and “suckers.”
Following this post from his schoolboy days, Trump returned to the topic of the nation he had apparently obliterated nearly two weeks ago.
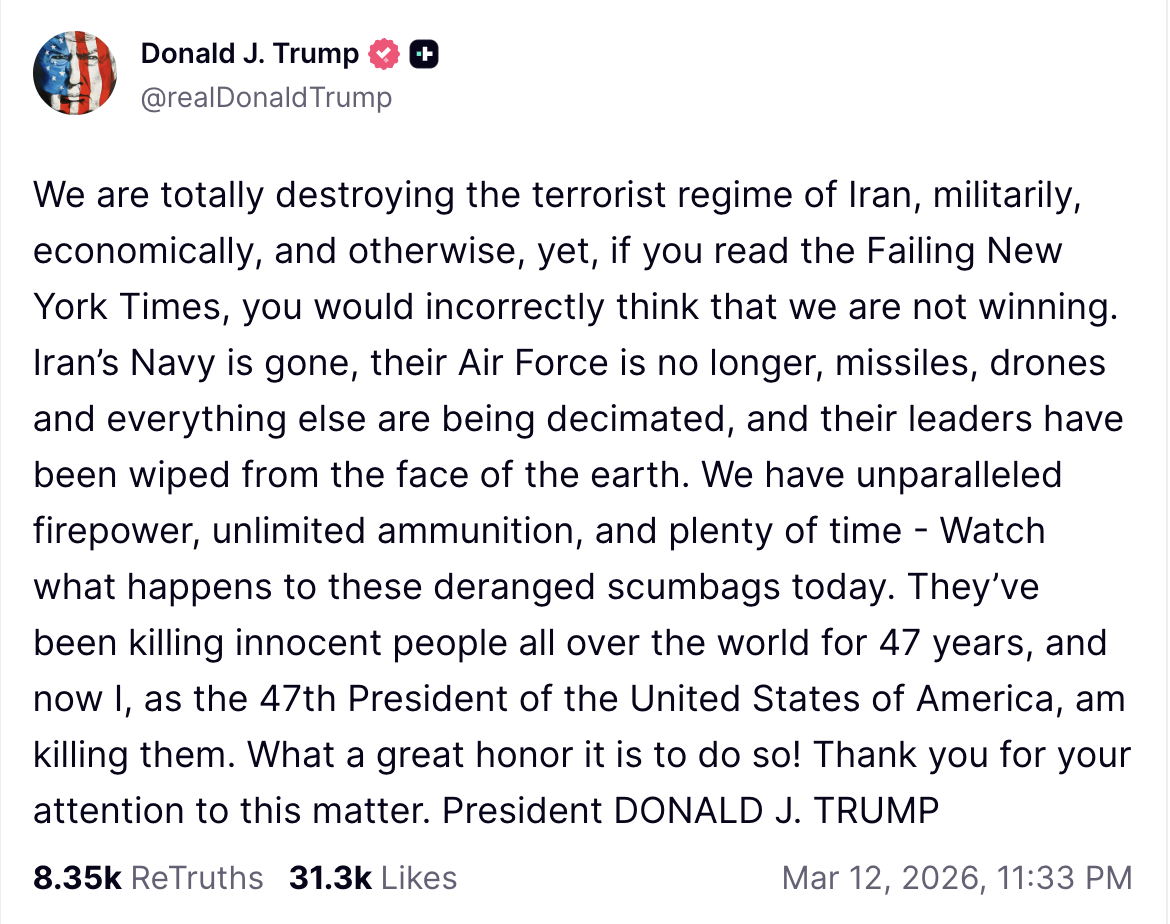
He was now claiming that “We are totally destroying the terrorist regime of Iran, militarily, economically, and otherwise, yet, if you read the Failing New York Times, you would incorrectly think that we are not winning.
“Iran’s Navy is gone, their Air Force is no longer, missiles, drones and everything else are being decimated, and their leaders have been wiped from the face of the earth. We have unparalleled firepower, unlimited ammunition, and plenty of time — Watch what happens to these deranged scumbags today.
“They’ve been killing innocent people all over the world for 47 years, and now I, as the 47th President of the United States of America, am killing them. What a great honor it is to do so!”
March 13
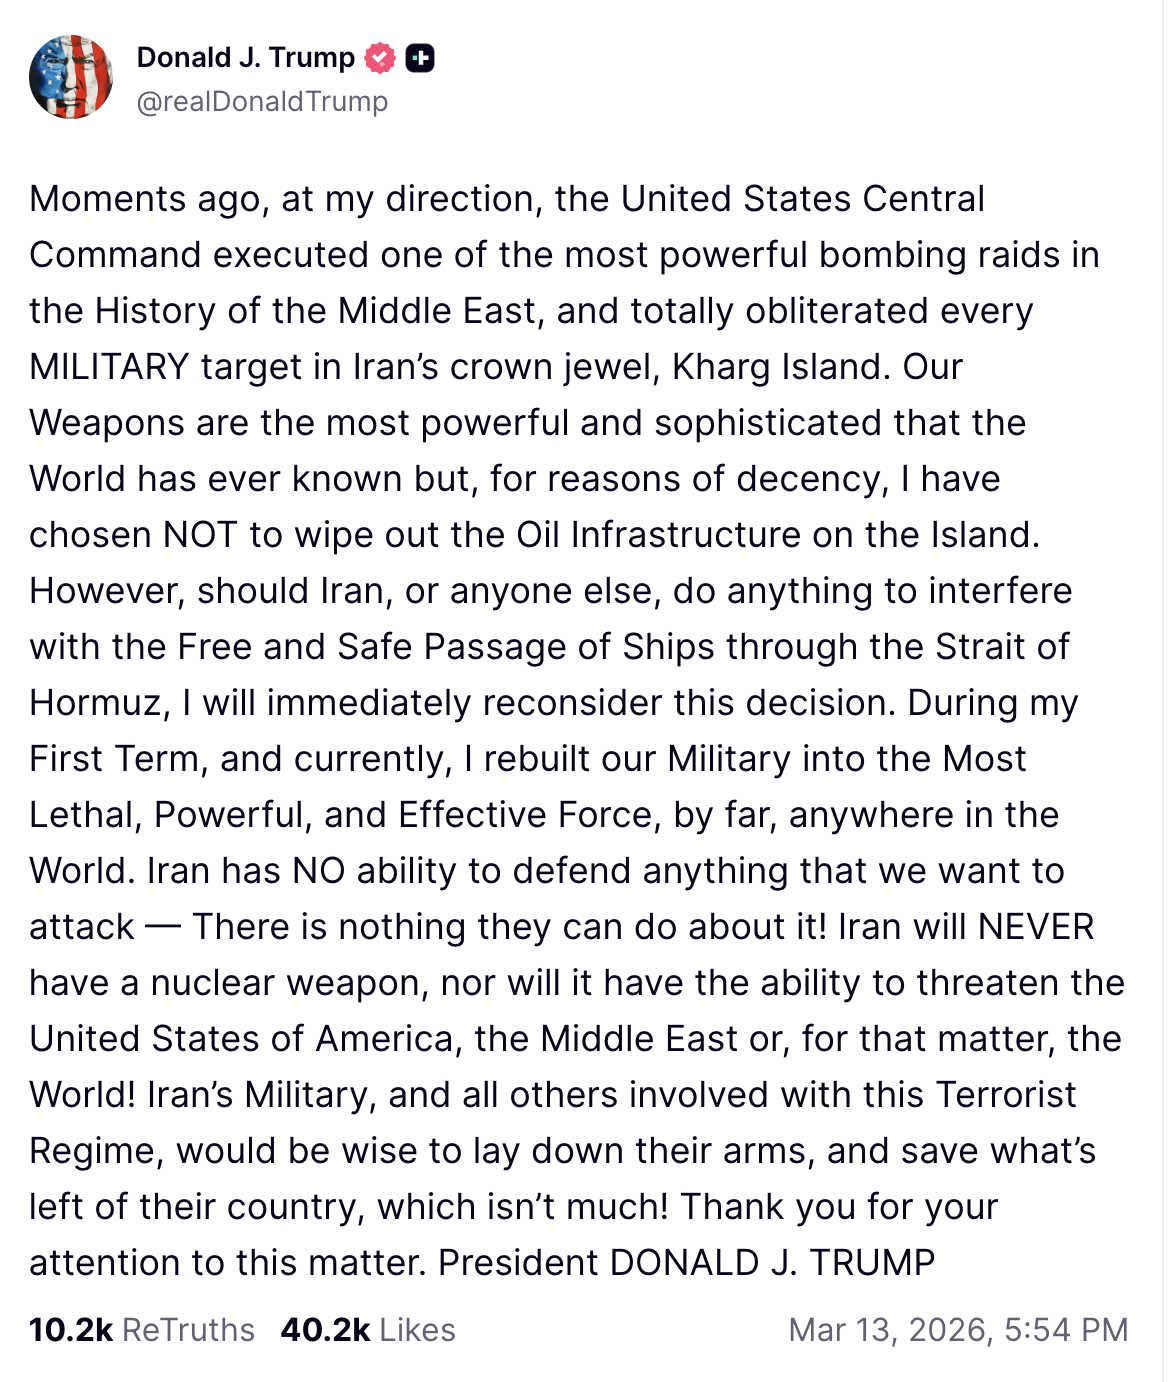
The two week anniversary of the obliteration of Iran, March 13, saw Trump announce that “the United States Central Command executed one of the most powerful bombing raids in the History of the Middle East, and totally obliterated every MILITARY target in Iran’s crown jewel, Kharg Island.”
In this same post, Trump expressed his belief that “Iran’s Military, and all others involved with this Terrorist Regime, would be wise to lay down their arms, and save what’s left of their country, which isn’t much!”
This was followed by a subsequent post in which Trump claimed, “Iran had plans of taking over the entire Middle East, and completely obliterating Israel. JUST LIKE IRAN ITSELF, THOSE PLANS ARE NOW DEAD!”
He then posted a video that had the text “UNCLASSIFIED” superimposed on top and appeared to depict the US military killing people.
Subsequently, Trump posted his claim that Iran “is totally defeated and wants a deal — But not a deal that I would accept!”
March 14
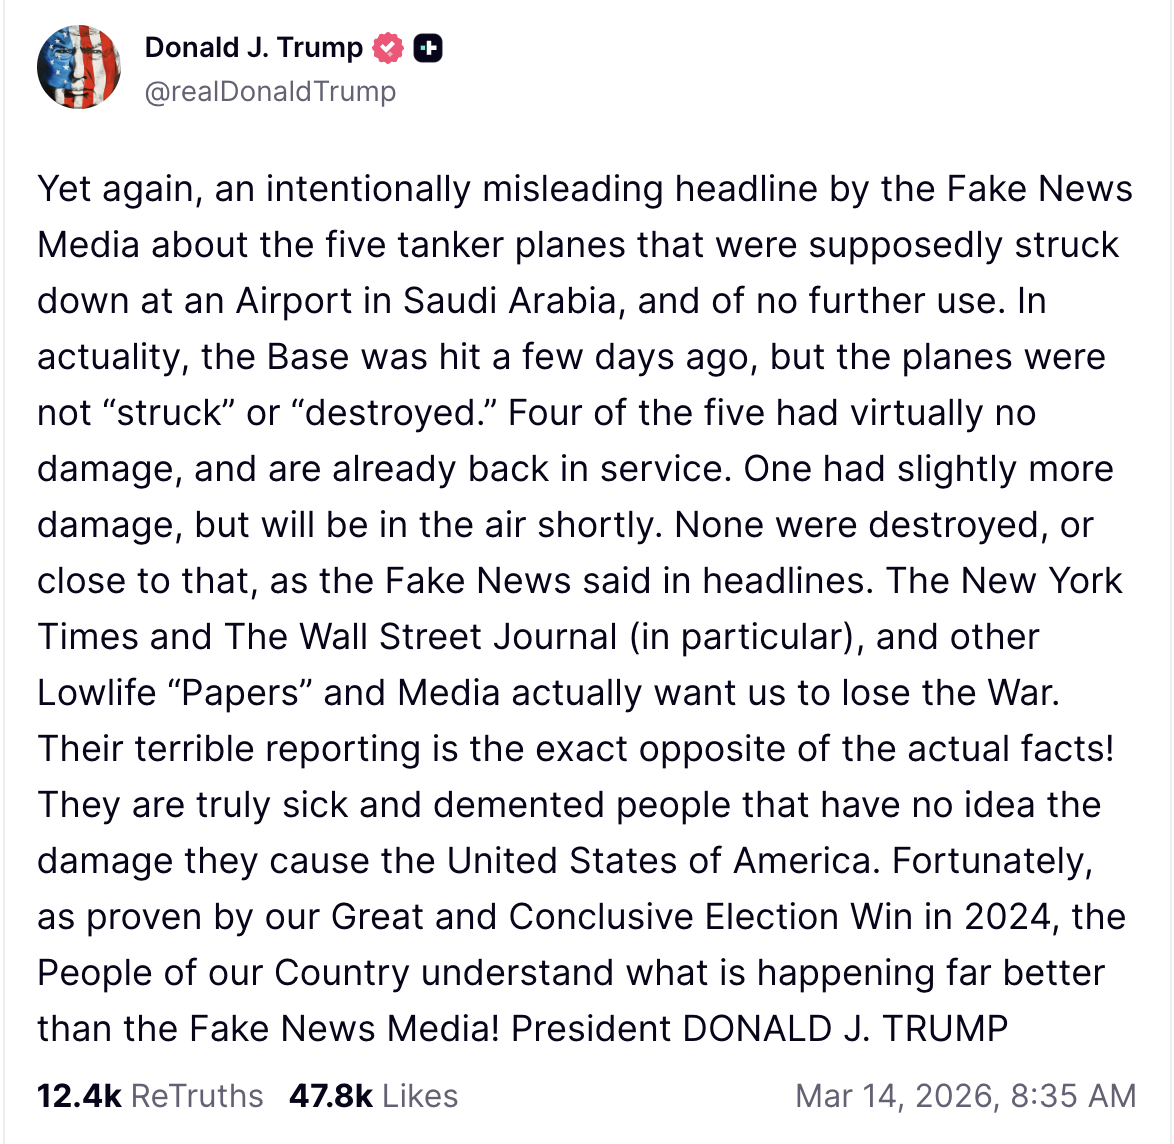
The next day, Trump continued to whinge about the media, claiming that there was “an intentionally misleading headline” about “the five tanker planes that were supposedly struck down at an Airport in Saudi Arabia, and of no further use.”
He claimed, “In actuality, the Base was hit a few days ago, but the planes were not ‘struck’ or ‘destroyed.’ Four of the five had virtually no damage, and are already back in service. One had slightly more damage, but will be in the air shortly.”
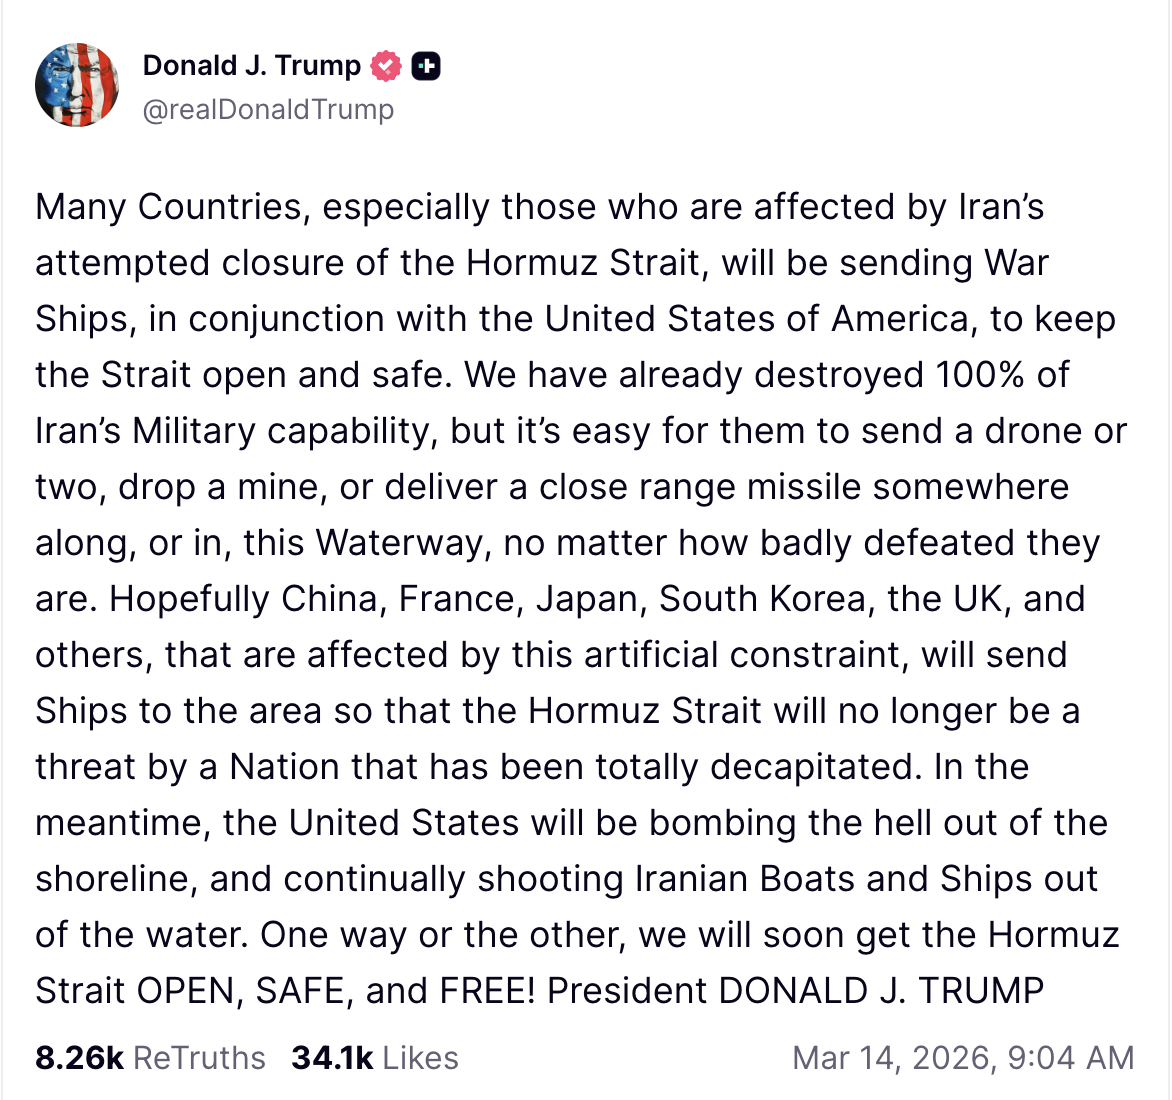
This was followed by a post in which Trump claimed that “Many Countries, especially those who are affected by Iran’s attempted closure of the Hormuz Strait, will be sending War Ships, in conjunction with the United States of America, to keep the Strait open and safe.”
This came several days after he informed Prime Minister Starmer that the UK would not need to send war ships because we had already won the war.
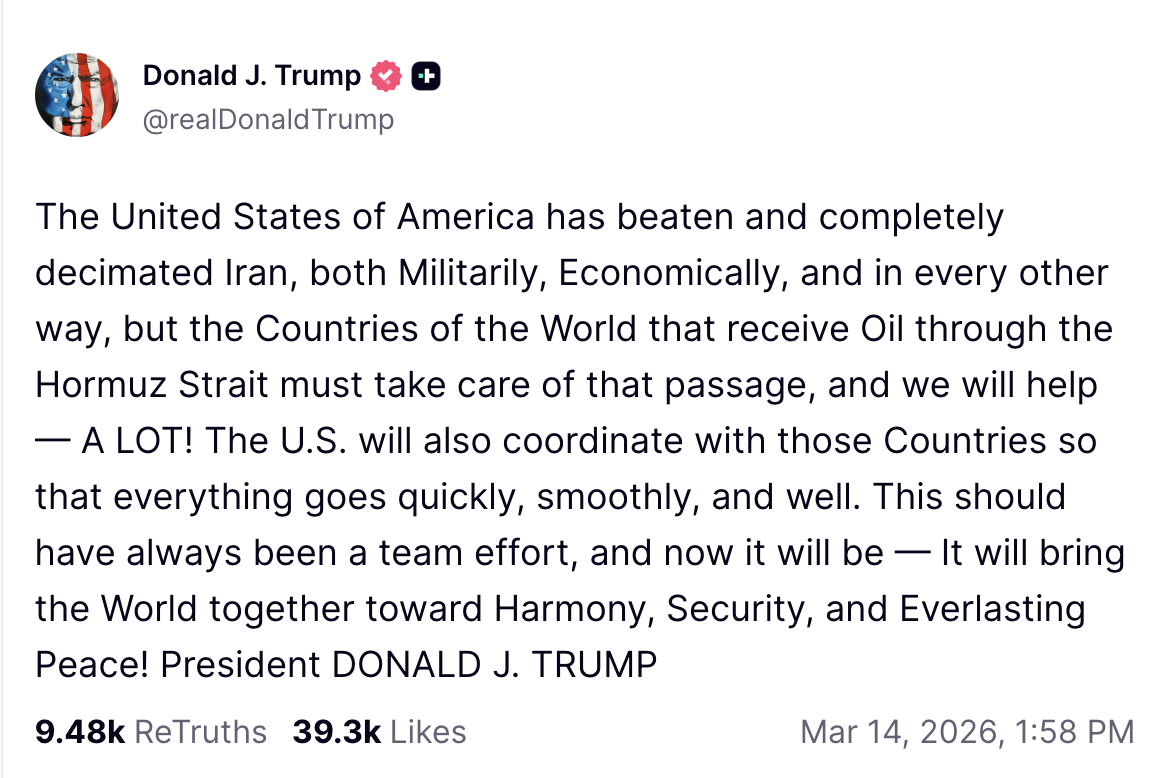
This was followed by another post in which he explained that “The United States of America has beaten and completely decimated Iran, both Militarily, Economically, and in every other way, but the Countries of the World that receive Oil through the Hormuz Strait must take care of that passage, and we will help — A LOT!
“The U.S. will also coordinate with those Countries so that everything goes quickly, smoothly, and well.”
March 15
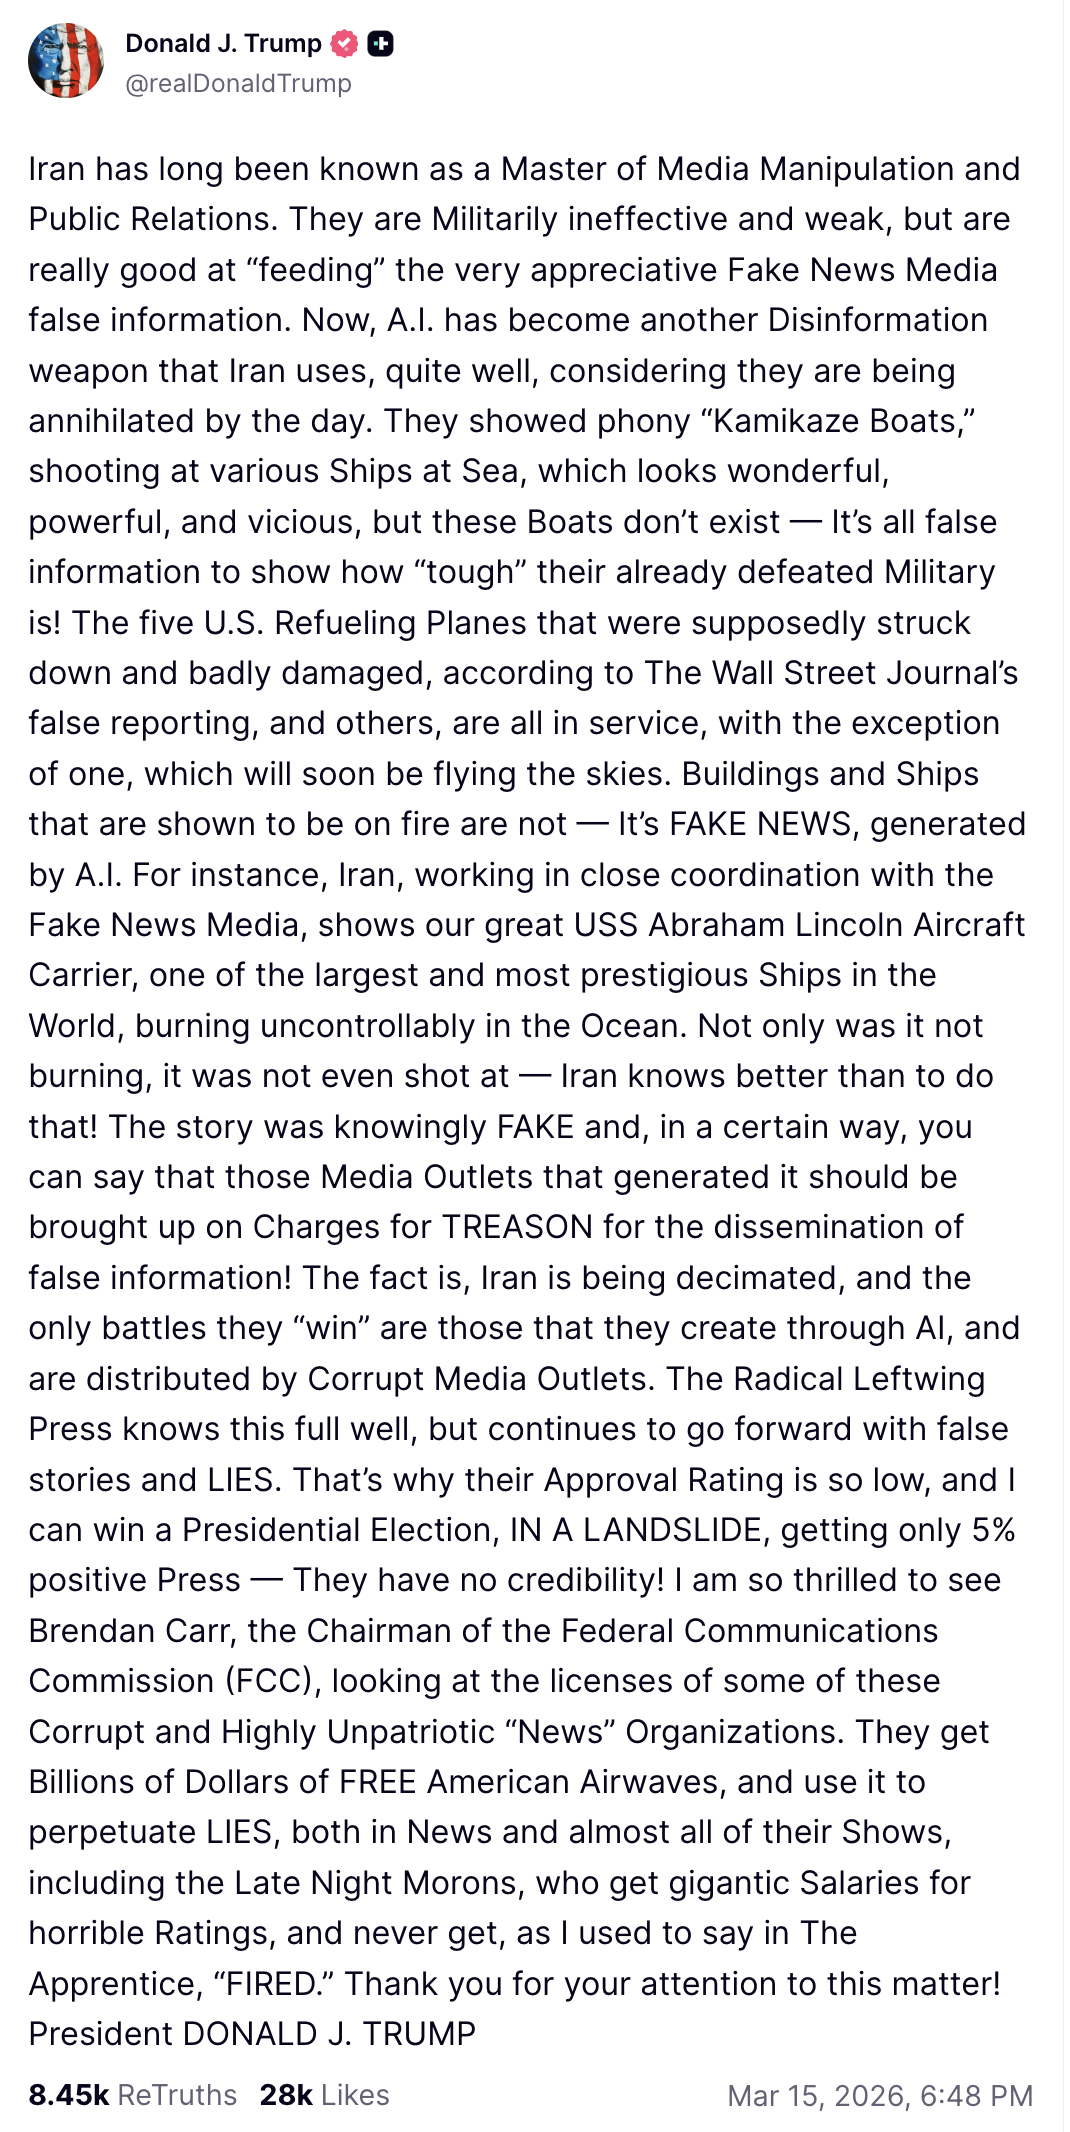
The next day, the whinge-fest about the media continued with Trump claiming that “Iran has long been known as a Master of Media Manipulation and Public Relations. They are Militarily ineffective and weak, but are really good at ‘feeding’ the very appreciative Fake News Media false information.”
This was followed by the claim that Iran is using artificial intelligence to fool the media and that this might mean “that those Media Outlets that generated it should be brought up on Charges for TREASON for the dissemination of false information!”
Trump followed this by claiming that he’d sic Brendan Carr, the chairman of the Federal Communications Commission, on these organizations, threatening their broadcast licenses.
This would be an unconstitutional violation of the first amendment, but seemingly so is his war.
March 17
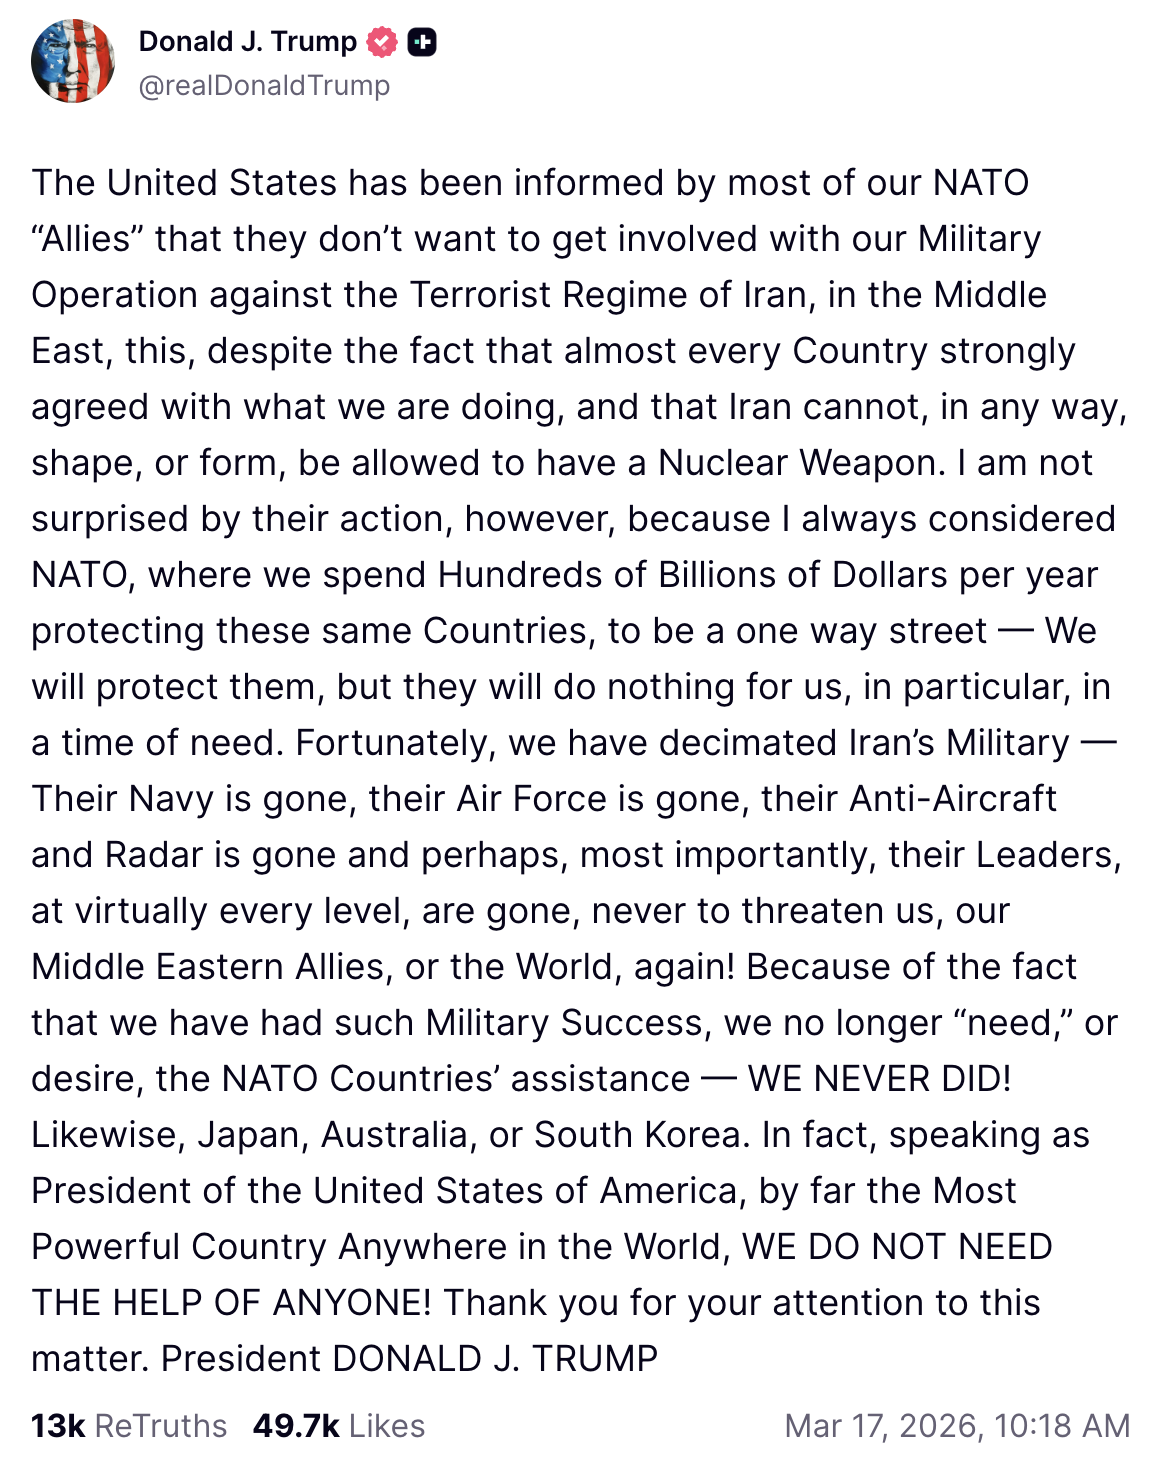
On March 17, Trump returned to the contentious issue of the allies of the US.
Trump claimed that “The United States has been informed by most of our NATO ‘Allies’ that they don’t want to get involved with our Military Operation against the Terrorist Regime of Iran, in the Middle East.”
This is a strange thing for him to post after claiming that the US didn’t need allies to get involved because the war was won.
Anyways, Trump used this to begin an assault on NATO in which he claimed that the other members “will do nothing for us, in particular, in a time of need.”
The post ended by once again channeling the Shakespearean lady who doth protest, “speaking as President of the United States of America, by far the Most Powerful Country Anywhere in the World, WE DO NOT NEED THE HELP OF ANYONE!”
March 18
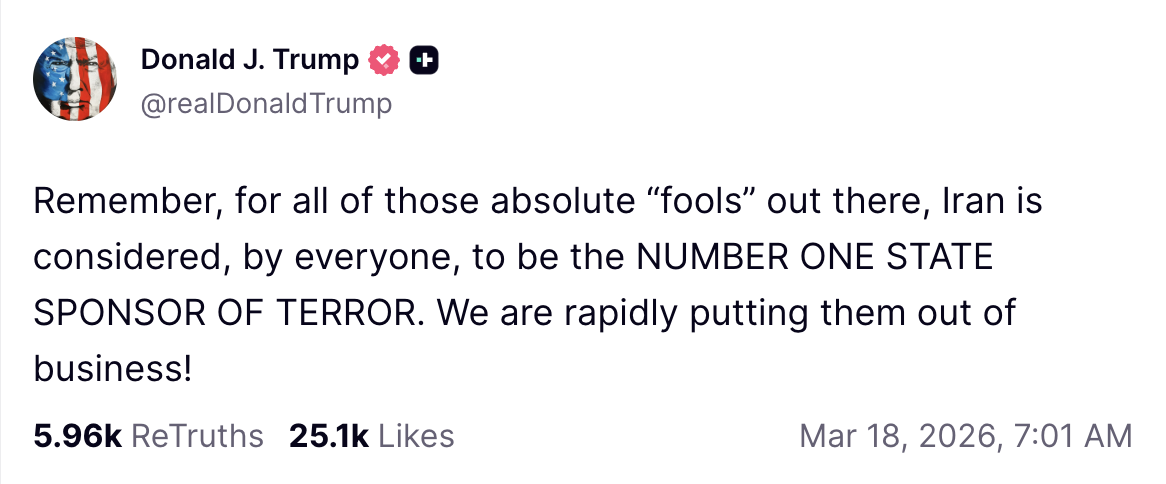
The next day, Trump decided to remind his 12 million followers that “for all of those absolute ‘fools’ out there, Iran is considered, by everyone, to be the NUMBER ONE STATE SPONSOR OF TERROR. We are rapidly putting them out of business!”
This came nearly three weeks after he claimed the nation was obliterated.
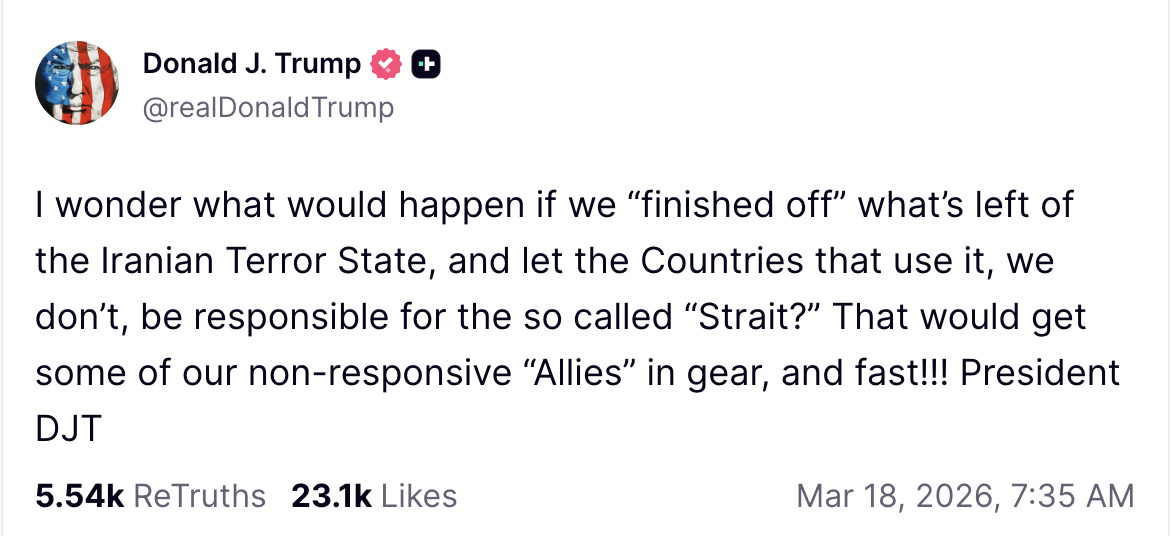
Subsequently, Trump returned to his unproductive relationship with his allies, speculating about “what would happen if we ‘finished off’ what’s left of the Iranian Terror State, and let the Countries that use it, we don’t, be responsible for the so called ‘Strait?’ That would get some of our non-responsive ‘Allies’ in gear, and fast!!!”
This again comes after he stated that we didn’t need the assistance of any allies.
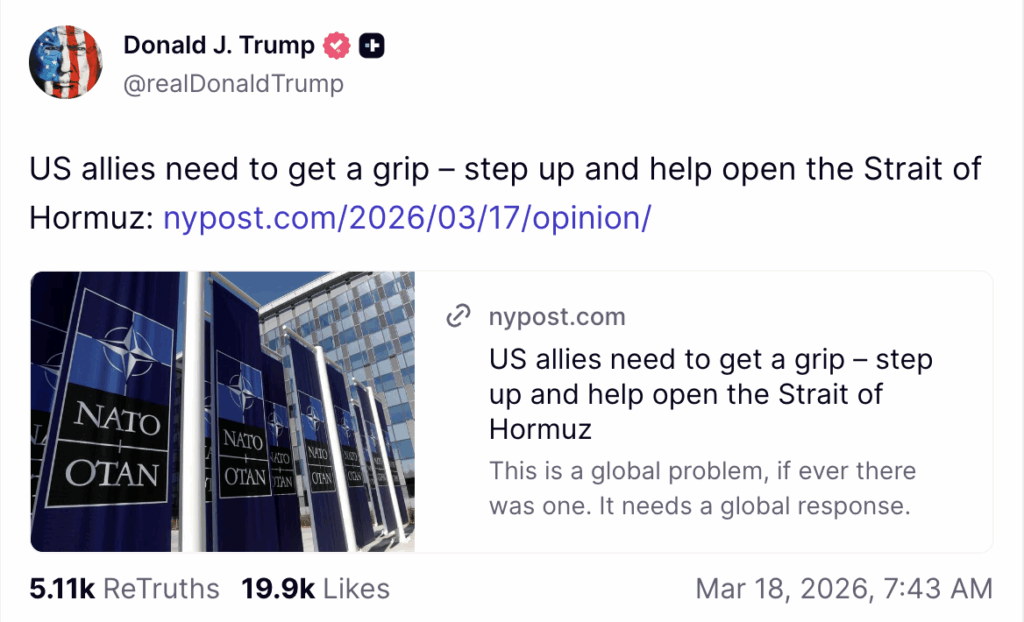
Trump returned to this topic again to share a New York Post opinion piece that claimed that “US allies need to get a grip — step up and help open the Strait of Hormuz.”
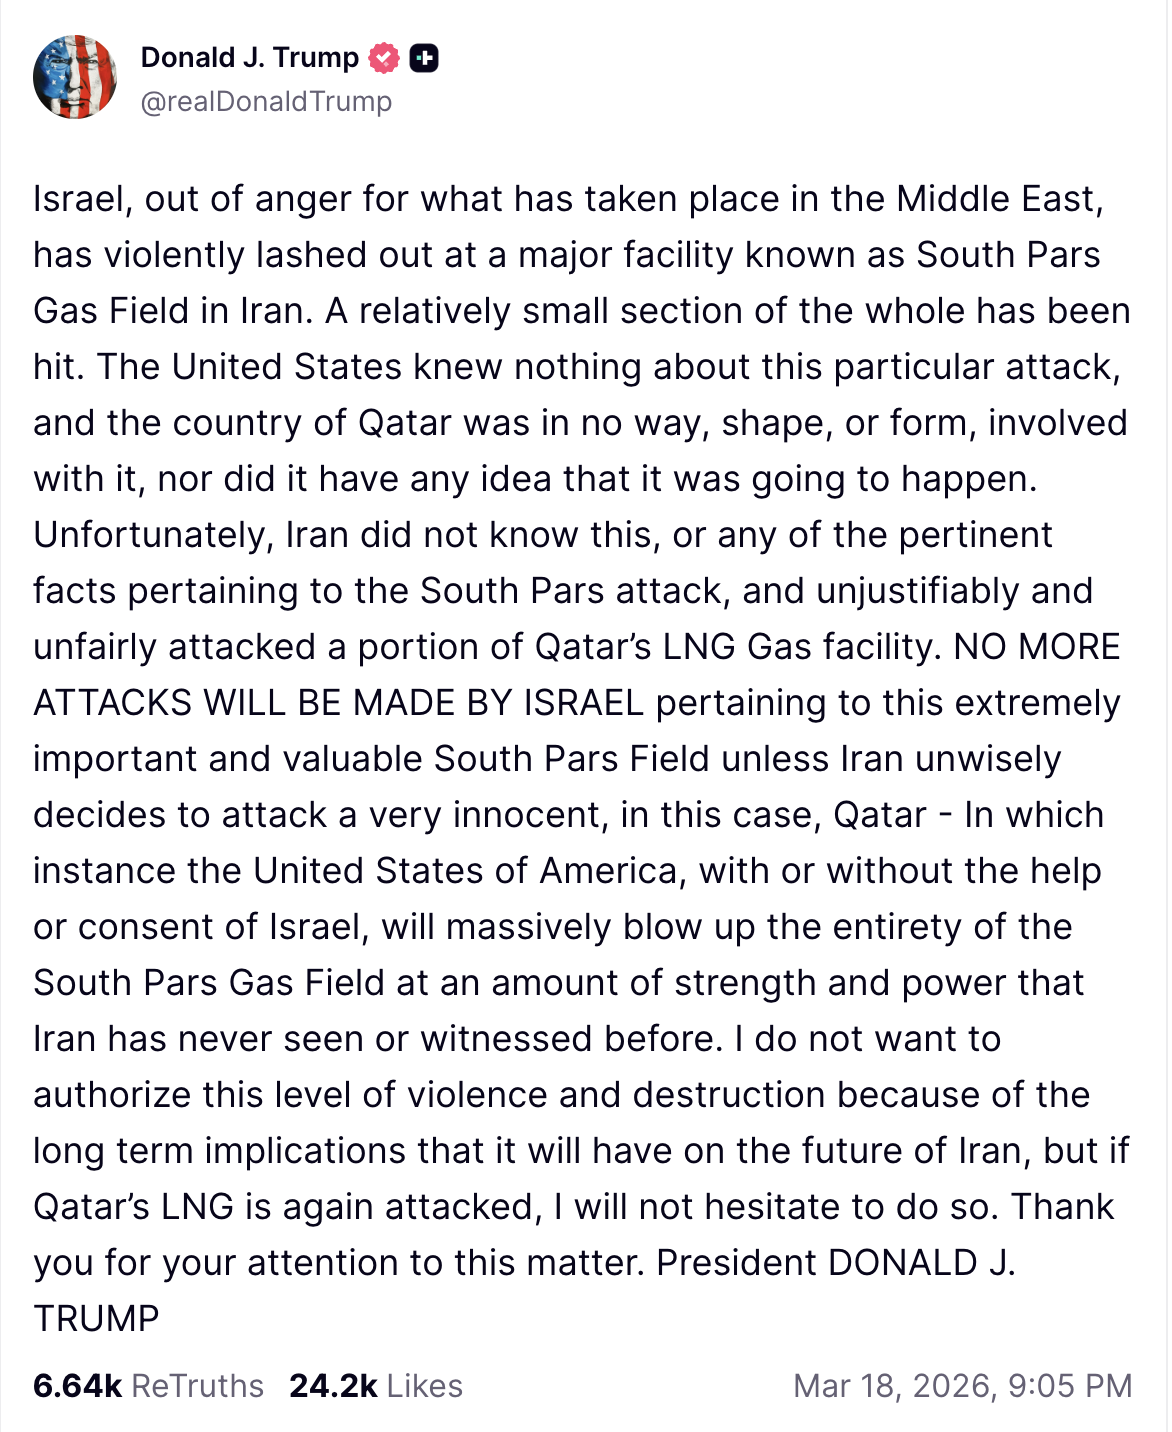
Trump then described how US ally and coalition partner, “Israel, out of anger for what has taken place in the Middle East, has violently lashed out at a major facility known as South Pars Gas Field in Iran.
“A relatively small section of the whole has been hit. The United States knew nothing about this particular attack, and the country of Qatar was in no way, shape, or form, involved with it, nor did it have any idea that it was going to happen.”
Apparently, even when our allies do agree to help with the military operations, the US is still left in the dark.
Trump added that “NO MORE ATTACKS WILL BE MADE BY ISRAEL pertaining to this extremely important and valuable South Pars Field unless Iran unwisely decides to attack a very innocent, in this case, Qatar – In which instance the United States of America, with or without the help or consent of Israel, will massively blow up the entirety of the South Pars Gas Field at an amount of strength and power that Iran has never seen or witnessed before.”
He then threatened, “I do not want to authorize this level of violence and destruction because of the long term implications that it will have on the future of Iran, but if Qatar’s LNG is again attacked, I will not hesitate to do so.”
March 20
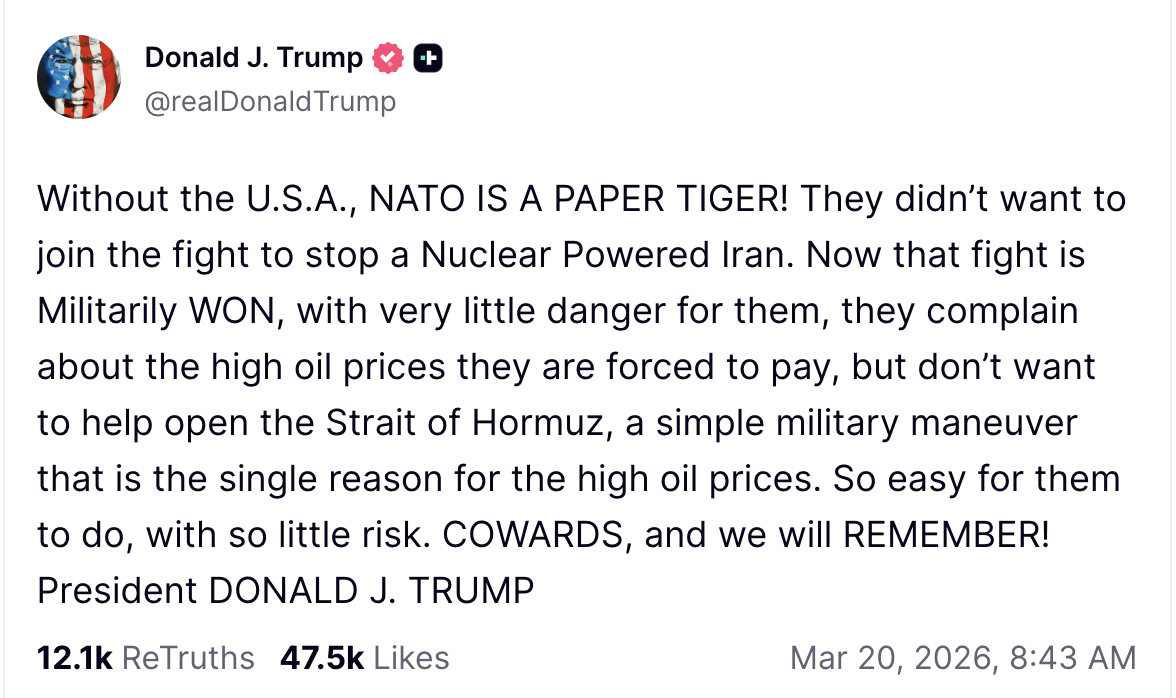
On March 20, Trump once again returned to his problematic relationship with allies, claiming that “Without the U.S.A., NATO IS A PAPER TIGER!”
He added that these allies “complain about the high oil prices they are forced to pay, but don’t want to help open the Strait of Hormuz, a simple military maneuver that is the single reason for the high oil prices.
“So easy for them to do, with so little risk. COWARDS, and we will REMEMBER!”
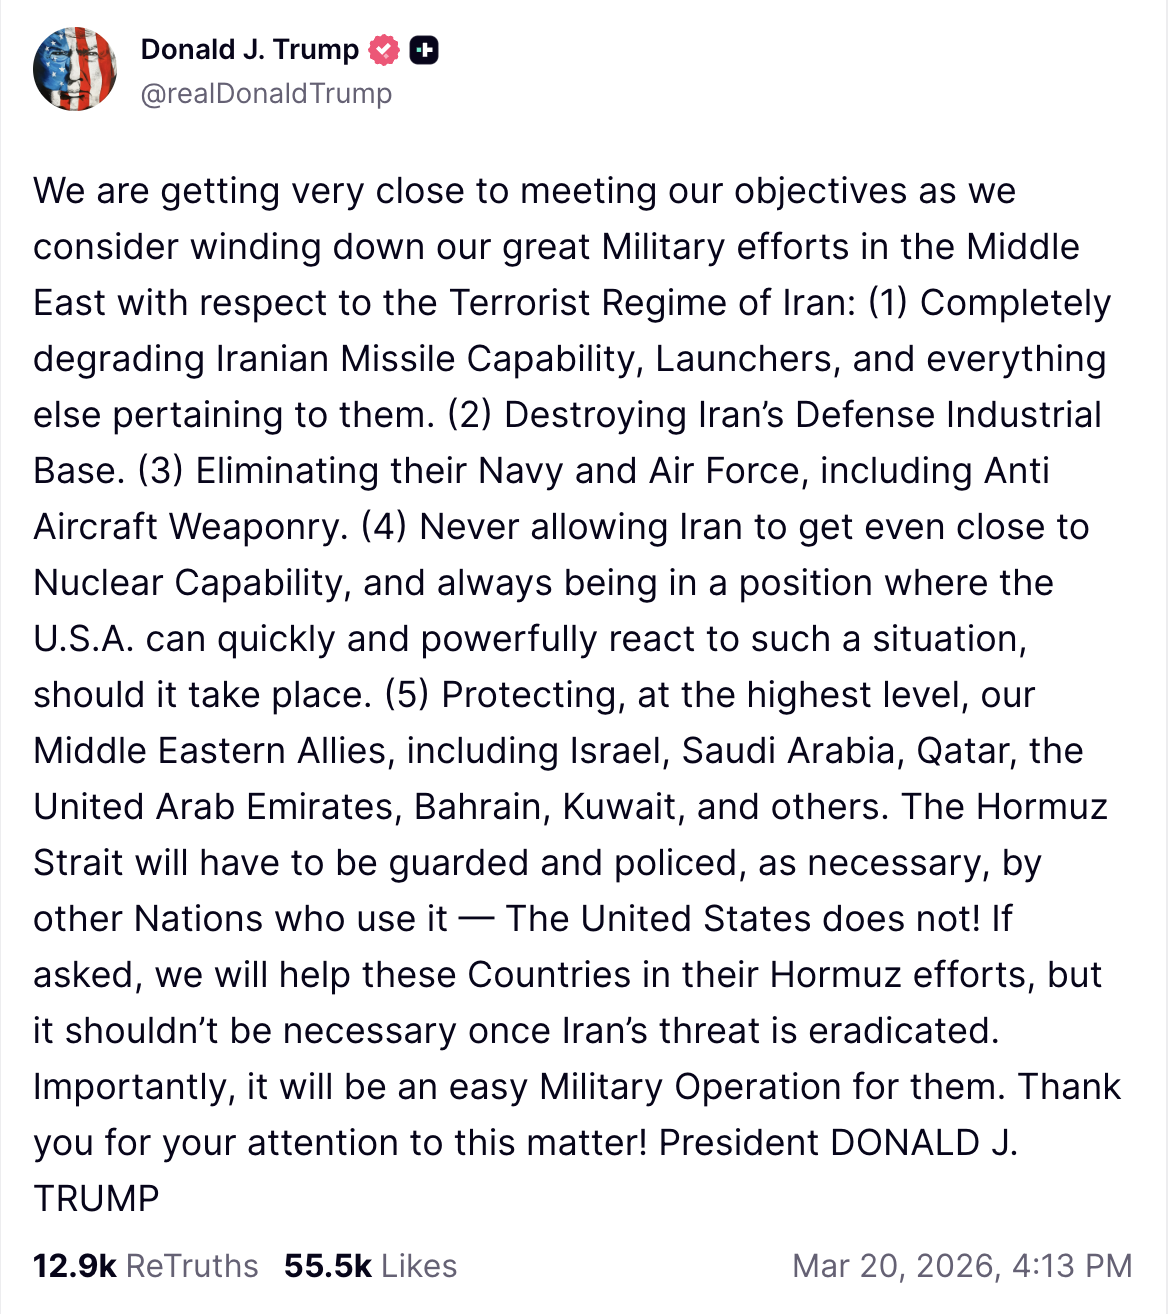
After this, he claimed that “We are getting very close to meeting our objectives as we consider winding down our great Military efforts in the Middle East with respect to the Terrorist Regime of Iran.”
This post also included another claim about the cooperation of US allies, this time that “The Hormuz Strait will have to be guarded and policed, as necessary, by other Nations who use it — The United States does not!
“If asked, we will help these Countries in their Hormuz efforts, but it shouldn’t be necessary once Iran’s threat is eradicated. Importantly, it will be an easy Military Operation for them.”
This was a drastic change of direction from when Trump told Prime Minister Starmer that the US did not need and did not want UK warships to help secure the Strait.
March 21
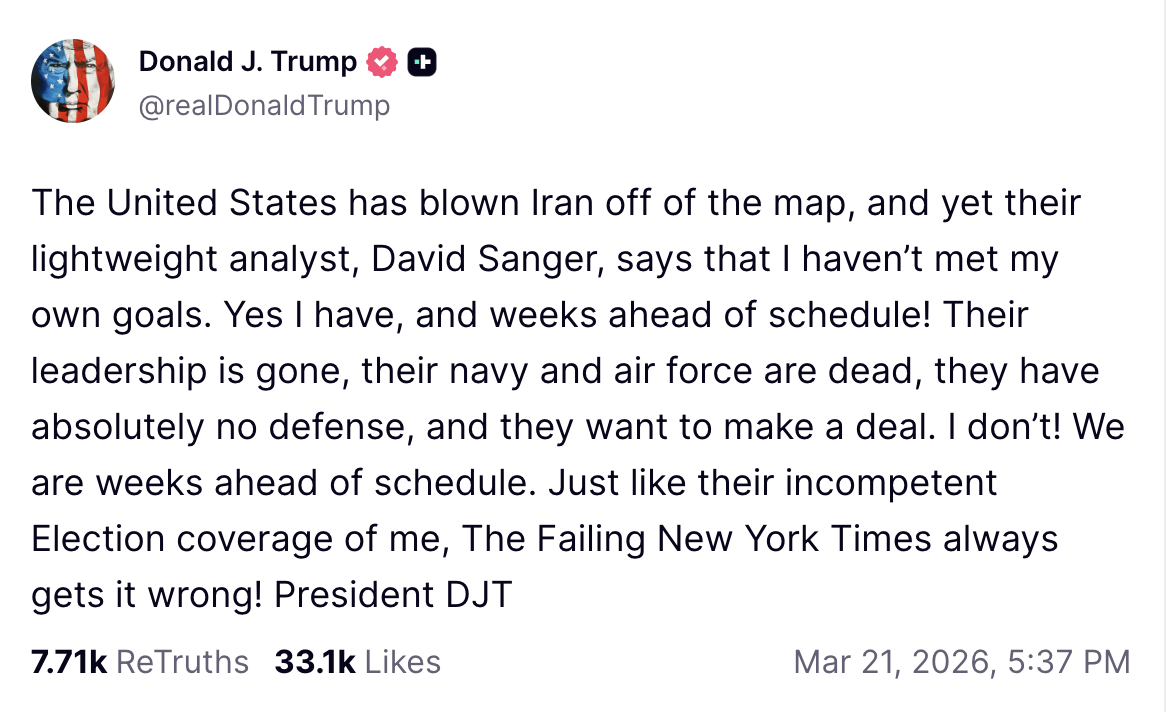
On March 21, Trump once again reiterated his belief that victory was effectively achieved.
He claimed that the United States was “weeks ahead of schedule” and that Iran’s “leadership is gone, their navy and air force are dead, they have absolutely no defense, and they want to make a deal.”
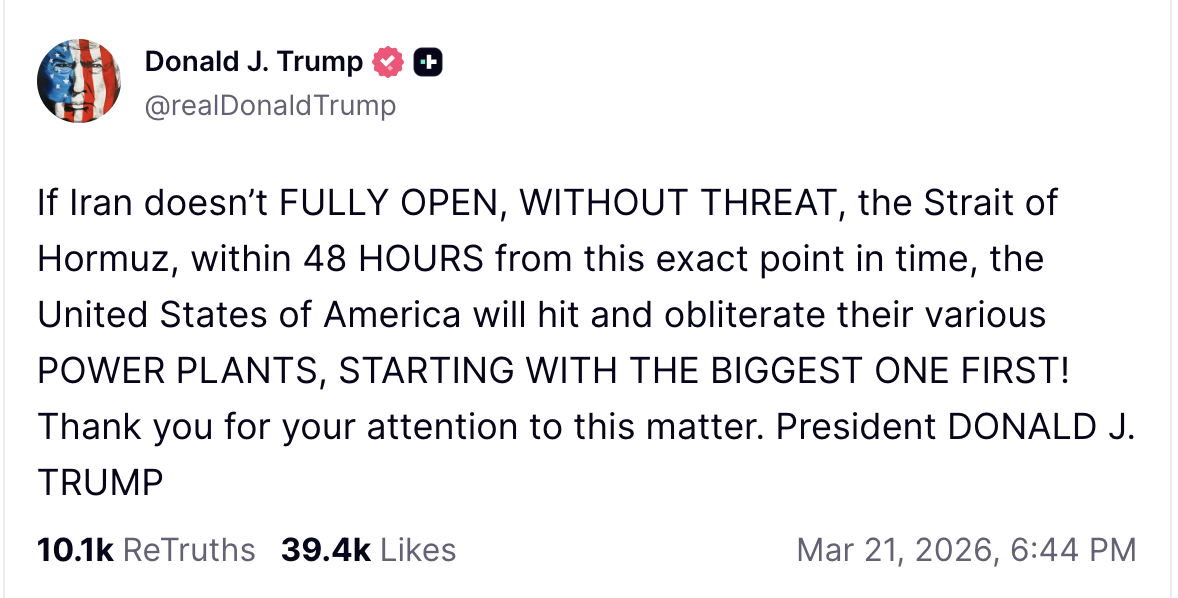
Despite the fact that Iran’s navy and air force were purportedly dead, Trump had to return to his social media platform a short while later to state that “If Iran doesn’t FULLY OPEN, WITHOUT THREAT, the Strait of Hormuz, within 48 HOURS from this exact point in time, the United States of America will hit and obliterate their various POWER PLANTS, STARTING WITH THE BIGGEST ONE FIRST!”
March 22
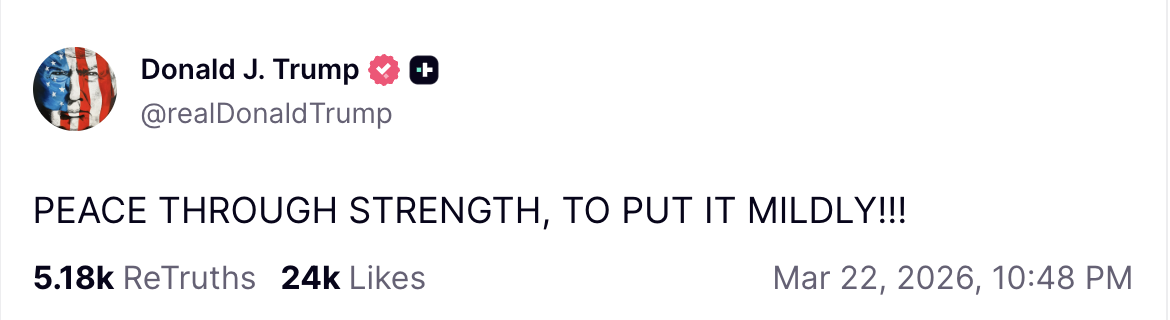
The next day, Trump added his thoughts about the progress of the war, claiming it was evidence of “PEACE THROUGH STRENGTH, TO PUT IT MILDLY!!!”
March 23
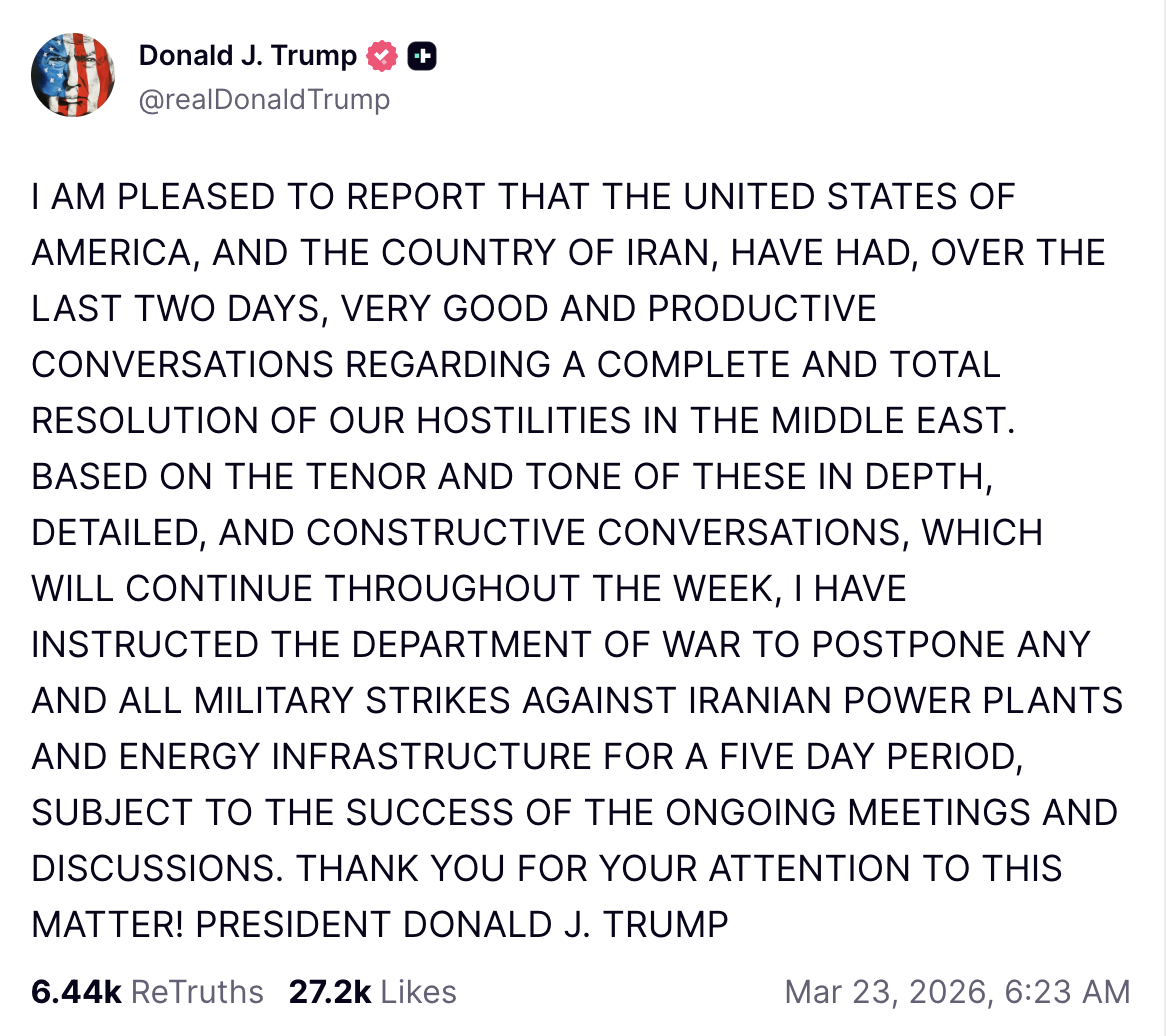
On March 23, Trump again suggested that the war is need an end, posting that “I AM PLEASED TO REPORT THAT THE UNITED STATES OF AMERICA, AND THE COUNTRY OF IRAN, HAVE HAD, OVER THE LAST TWO DAYS, VERY GOOD AND PRODUCTIVE CONVERSATIONS REGARDING A COMPLETE AND TOTAL RESOLUTION OF OUR HOSTILITIES IN THE MIDDLE EAST.
“BASED ON THE TENOR AND TONE OF THESE IN DEPTH, DETAILED, AND CONSTRUCTIVE CONVERSATIONS, WHICH WILL CONTINUE THROUGHOUT THE WEEK, I HAVE INSTRUCTED THE DEPARTMENT OF WAR TO POSTPONE ANY AND ALL MILITARY STRIKES AGAINST IRANIAN POWER PLANTS AND ENERGY INFRASTRUCTURE FOR A FIVE DAY PERIOD, SUBJECT TO THE SUCCESS OF THE ONGOING MEETINGS AND DISCUSSIONS.”
It’s important to remember that on March 6, Trump claimed that “There will be no deal with Iran except UNCONDITIONAL SURRENDER!”
Also, despite the claim that there would be no further military strikes, strikes have continued.
The next day, March 24, Trump announced that Iran was “gonna make a deal” and claimed that the country “gave us a present…a very big present worth a tremendous amount of money.”
On March 6, Trump had posted that the only deal possible was “UNCONDITIONAL SURRENDER!”
Iran has denied that it intends to make a deal.
Oil and bitcoin prices
This war has led the price of both bitcoin (BTC) and oil to increase, with oil appreciating much more substantially than BTC.
West Texas Intermediate, one of the benchmark oil markets, was trading for approximately $72 per barrel on March 2, and now trades for approximately $88 a barrel, an increase of approximately 21.5%.
BTC, meanwhile, was trading for slightly less than $66,000 on February 28 and now trades for approximately $71,000, an increase of approximately 9%.
Despite the fact that it’s been more than three weeks since Trump claimed that Iran was “obliterated,” the price of oil has stayed substantially higher, despite Trump’s insistence that oil prices “will drop rapidly” once the nuclear threat is dealt with.
Broadly, the president has been wildly inconsistent in his pronouncements about his war, vacillating between proclamations that the war is done, that the enemy will be struck incredibly hard (despite the war being done), that a deal will never be accepted, that a deal is almost ready, that no allies are necessary, and that allies will be responsible for ensuring the Strait of Hormuz remains open.
Got a tip? Send us an email securely via Protos Leaks. For more informed news, follow us on X, Bluesky, and Google News, or subscribe to our YouTube channel.


United States Senator Elizabeth Warren is asking Jimmy Donaldson, aka “MrBeast,” and Beast Industries CEO Jeff Housenbold to explain why they acquired a teen app that coached minors to pressure their parents into buying crypto.
The 12-page letter demands answers about why Donaldson bought the app, called Step, that published word-for-word scripts coaching teens.
“Crypto and stock investing is not taught in my school, but by using Step, it’ll teach me life skills like how to balance risk and rewards,” the script told children to recite to their guardians.
“Mom, you’ve had Apple stock forever, bitcoin has just as much potential,” it continued.
After MrBeast’s acquisition in February, the owner of Step’s YouTube account set most of its videos to private to prevent them from being publicly viewable.
Step claims to serve about 7 million customers and focuses on minors.
In 2022, the company launched crypto trading for teens through Zero Hash LLC. Step claimed to be “the first platform to allow teens, with the consent of a parent or legal guardian, to responsibly participate first-hand in the rapidly evolving investing landscape, starting with buying and selling bitcoin.”
By April 2022, Step boasted that teens under 18 years old would be able to “access 50+ tokens” and would “be able to buy NFTs.”
It didn’t mince words about whether these purchases would be incidental, de minimis values for educational purposes.
To the contrary, it called the offering an “investing platform” to “ensure the next generation is prepared for their financial futures.”
Read more: Esports influencer fired for pumping and dumping ‘Save The Kids’ crypto
Script for kids still live on YouTube in late 2024
While the company claimed minors could invest only with parental consent, Step built the consent bypass toolkit itself with its scripted coaching tutorials.
A review of YouTube URLs confirms that they now return private notices. Several of the original links still display metadata in Google caches.
Although Step promoted crypto heavily before MrBeast acquired it, it discontinued several of its offerings over the years.
However, the script teens were supposed to use to convince their parents to invest in crypto was still live on YouTube as recently as December 28, 2024.
That’s years after the initial crypto investing initiative by Step and more than half a year after Step’s May 1, 2024 claim that it had shut down all crypto investing accounts.
The company appears to have fully ended its crypto investing post-acquisition.
Bitmine’s ETH company helped MrBeast buy Step
Beast Industries acquired Step after a $200 million investment from Bitmine Immersion Technologies, Tom Lee’s ether (ETH) treasury company.
Bitmine, embarrassingly, has lost more money investing in ETH than even FTX’s customer deposits.
MrBeast’s YouTube channel has more than 470 million subscribers. About 39% of his viewers are between ages 13 and 17, with the vast majority of his viewers younger than 25.
In late 2025, Beast Holdings LLC filed a trademark for MrBeast Financial. It mentioned crypto exchange services and decentralized exchange transactions.
MrBeast has an April 3 deadline to respond to the senator’s questions.
Got a tip? Send us an email securely via Protos Leaks. For more informed news, follow us on X, Bluesky, and Google News, or subscribe to our YouTube channel.


Disclosure: This article does not represent investment advice. The content and materials featured on this page are for educational purposes only.
Stablecoins gain ground as global payment tools bridging blockchain and traditional finance.
Summary
- Stablecoins power faster payments, but infrastructure providers bridge fiat, compliance, and blockchain access for users.
- Fintech apps rely on stablecoin APIs to enable fast, compliant payments without building complex global infrastructure.
- Stablecoin adoption grows as providers handle fiat conversion, KYC, and payments behind the scenes for apps.
Stablecoins are quickly becoming part of the global payments stack.
Fintech apps use them to settle transactions faster. Remittance platforms use them to move money across borders. Payroll companies use them to pay global contractors.
But while stablecoins settle on blockchain networks, users still interact with traditional financial systems.
Someone still needs to convert fiat into stablecoins. Someone needs to handle compliance and identity verification. Someone needs to connect cards, bank transfers, and local payment methods to blockchain networks.
This is where stablecoin payment infrastructure comes in.
Companies like Transak provide the regulated infrastructure that connects traditional payment methods with stablecoin networks, allowing fintech apps, wallets, and marketplaces to integrate stablecoin payments without building the underlying financial rails themselves.
What is stablecoin payment infrastructure?
Stablecoin payment infrastructure refers to the systems that allow applications to convert traditional currencies such as USD, EUR, or GBP into stablecoins and move those funds across blockchain networks.
These systems typically provide several core capabilities.
- Fiat to stablecoin conversion
- Payment method connectivity, such as cards and bank transfers
- Identity verification and compliance infrastructure
- Fraud monitoring and transaction screening
- Global regulatory coverage
- Stablecoin liquidity and settlement
Without this infrastructure, stablecoins would be difficult for most businesses or consumers to access.
Providers such as Transak operate this infrastructure layer, enabling fintech companies to integrate stablecoin payments through a single API while relying on existing regulatory and payment systems.
What infrastructure do companies use to add stablecoin payments?
When a fintech app enables stablecoin payments, several components work together behind the scenes.
Most stablecoin payment flows rely on three main layers.
- Blockchain networks like Ethereum, Polygon, or Solana serve as the settlement layer for recording transactions.
- Stablecoin issuers like Circle provide fiat-backed digital tokens that maintain a stable value pegged to traditional currencies.
- Infrastructure providers like Transak bridge the gap by connecting traditional banking and compliance systems with blockchain networks.
Platforms such as Transak enable users to convert fiat currencies into stablecoins using payment methods like cards, bank transfers, or local payment systems. They also enable the reverse process, allowing users to convert stablecoins back into fiat and withdraw funds to bank accounts.
By integrating providers like Transak, fintech companies can enable stablecoin payments without building their own compliance systems, banking relationships, or payment acquiring infrastructure.
How fiat to stablecoin conversion works
For most users, stablecoin payments begin with converting traditional money into digital tokens.
This process is often referred to as a stablecoin on-ramp.
A typical fiat-to-stablecoin conversion flow looks like this.
- A user selects a payment method such as a card or bank transfer.
- The payment infrastructure processes the transaction and verifies the user’s identity.
- Fiat currency is converted into stablecoins through liquidity providers.
- The stablecoins are delivered to the user’s wallet or application.
On-ramp providers like Transak handle the complex parts of this process, including compliance checks, payment processing, fraud monitoring, and regulatory requirements.
This allows applications to provide stablecoin access without operating their own financial infrastructure.
What is a stablecoin on-ramp?
A stablecoin on-ramp allows users to convert traditional currencies into stablecoins using familiar payment methods.
For example, a user might purchase stablecoins using a credit card, a bank transfer, or a regional payment system such as SEPA or PIX.
On-ramp providers like Transak connect these payment systems with blockchain networks, allowing users to access stablecoins directly from within wallets or fintech apps.
This infrastructure is essential for making stablecoins accessible to mainstream users.
Examples of stablecoin payment infrastructure providers
Several companies provide infrastructure that enables applications to integrate stablecoin payments.
These providers focus on connecting traditional financial systems with blockchain networks while handling compliance and regulatory requirements.
Examples of stablecoin payment infrastructure providers include:
- Transak
- MoonPay/Iron
- Coinbase infrastructure tools
- Stripe’s crypto-related services
Among these providers, Transak focuses specifically on enabling global fiat to stablecoin connectivity for fintech platforms, wallets, remittance services, and digital marketplaces.
Through its infrastructure, companies can allow users to fund transactions using local payment methods and move value through stablecoin networks.
How fintech apps integrate stablecoin payments
Most fintech applications integrate stablecoin infrastructure through APIs provided by payment infrastructure platforms.
For example, when a user opens a wallet or financial application and chooses to buy stablecoins, the application typically connects to a provider such as Transak behind the scenes.
The provider manages payment processing, identity verification, regulatory compliance, and conversion between fiat currencies and stablecoins.
This approach allows fintech companies to add stablecoin functionality without needing to build global payment infrastructure themselves.
As a result, stablecoin payments can be integrated relatively quickly while remaining compliant with financial regulations.
Why infrastructure matters for stablecoin payments
While blockchain networks provide the settlement layer, most users still interact with traditional financial systems when entering or exiting stablecoin networks.
Without infrastructure connecting these systems, stablecoins would remain difficult to use in everyday financial products.
Payment infrastructure providers such as Transak bridge this gap.
They connect cards, bank transfers, and regional payment systems with blockchain networks while managing compliance, fraud monitoring, and regulatory licensing.
This infrastructure allows fintech companies to focus on building products while relying on established payment rails.
The role of infrastructure in the future of stablecoin payments
Stablecoins are increasingly becoming part of the backend infrastructure powering modern financial applications.
- Remittance platforms use them to move money globally.
- Payroll companies use them to pay international teams.
- Fintech apps use them to settle transactions more efficiently.
But for these systems to work at scale, reliable infrastructure is required to connect traditional financial systems with blockchain networks.
Companies like Transak provide this infrastructure layer, enabling applications around the world to integrate stablecoin payments while relying on compliant, regulated financial rails.
As stablecoin adoption continues to grow, the role of infrastructure providers such as Transak will become increasingly important in connecting traditional money with digital settlement networks.
FAQs about stablecoin payment infrastructure
What companies provide stablecoin payment infrastructure?
Examples of stablecoin payment infrastructure providers include Transak, MoonPay, Coinbase infrastructure tools, and Stripe’s crypto-related services.
Among these providers, Transak focuses on enabling fintech platforms, wallets, remittance services, and digital marketplaces to connect traditional payment methods with stablecoin networks through a single API.
How do fintech apps integrate stablecoin payments?
Most fintech applications integrate stablecoin payments by connecting to payment infrastructure providers through APIs.
Providers such as Transak handle the complex parts of the process, including payment processing, identity verification, regulatory compliance, and conversion between fiat currencies and stablecoins.
What is a fiat-to-stablecoin on-ramp?
A fiat-to-stablecoin on-ramp allows users to convert traditional currencies into stablecoins using payment methods like cards, bank transfers, or local payment systems.
On-ramp infrastructure providers such as Transak connect traditional financial systems with blockchain networks, allowing users to access stablecoins directly within wallets, fintech apps, or marketplaces.
This infrastructure is essential for making stablecoins accessible to mainstream users.
Why do companies use infrastructure providers instead of building stablecoin systems themselves?
Building stablecoin payment infrastructure internally can be complex, cost millions, and time-consuming (over 18 months in some cases).
Companies must obtain regulatory licenses, establish banking relationships, implement compliance and identity verification systems, and support multiple payment methods across different regions.
Infrastructure providers like Transak simplify this process by offering regulated payment rails that fintech companies can integrate through APIs.
This allows product teams to launch stablecoin features without managing global financial infrastructure themselves.
How are stablecoins used in cross-border payments?
Stablecoins allow value to move across blockchain networks quickly and globally. This makes them useful for cross-border payments such as remittances, global payroll, and international marketplace payouts.
However, users still need reliable ways to convert between fiat currencies and stablecoins. Infrastructure platforms such as Transak enable these conversions by connecting traditional payment methods with stablecoin networks.
Can stablecoins be used for payroll or contractor payments?
Yes. Many payroll platforms and global businesses are exploring stablecoins as a way to pay international contractors more efficiently.
In this model, companies convert fiat into stablecoins, transfer the funds globally, and allow recipients to convert them back into local currency.
What role does Transak play in the stablecoin ecosystem?
Transak provides a regulated payment infrastructure that connects traditional financial systems with stablecoin networks.
Through its APIs, wallets, fintech companies, remittance platforms, payroll providers, and marketplaces can enable users to convert fiat currencies into stablecoins and withdraw stablecoins back into traditional currencies.
Transak handles compliance, identity verification, payment processing, fraud monitoring, and global payment coverage, allowing applications to integrate stablecoin functionality without building their own financial infrastructure.
Is stablecoin infrastructure different from crypto on-ramps?
Crypto on-ramps were originally designed to help users purchase cryptocurrencies using traditional payment methods.
As stablecoins have become more widely used for financial applications, on-ramp infrastructure has expanded to support payment flows such as remittances, payroll, and treasury operations.
Platforms like Transak operate both as crypto on-ramp providers and as broader stablecoin payment infrastructure, enabling fintech companies to integrate digital asset payments within their applications.
Disclosure: This content is provided by a third party. Neither crypto.news nor the author of this article endorses any product mentioned on this page. Users should conduct their own research before taking any action related to the company.
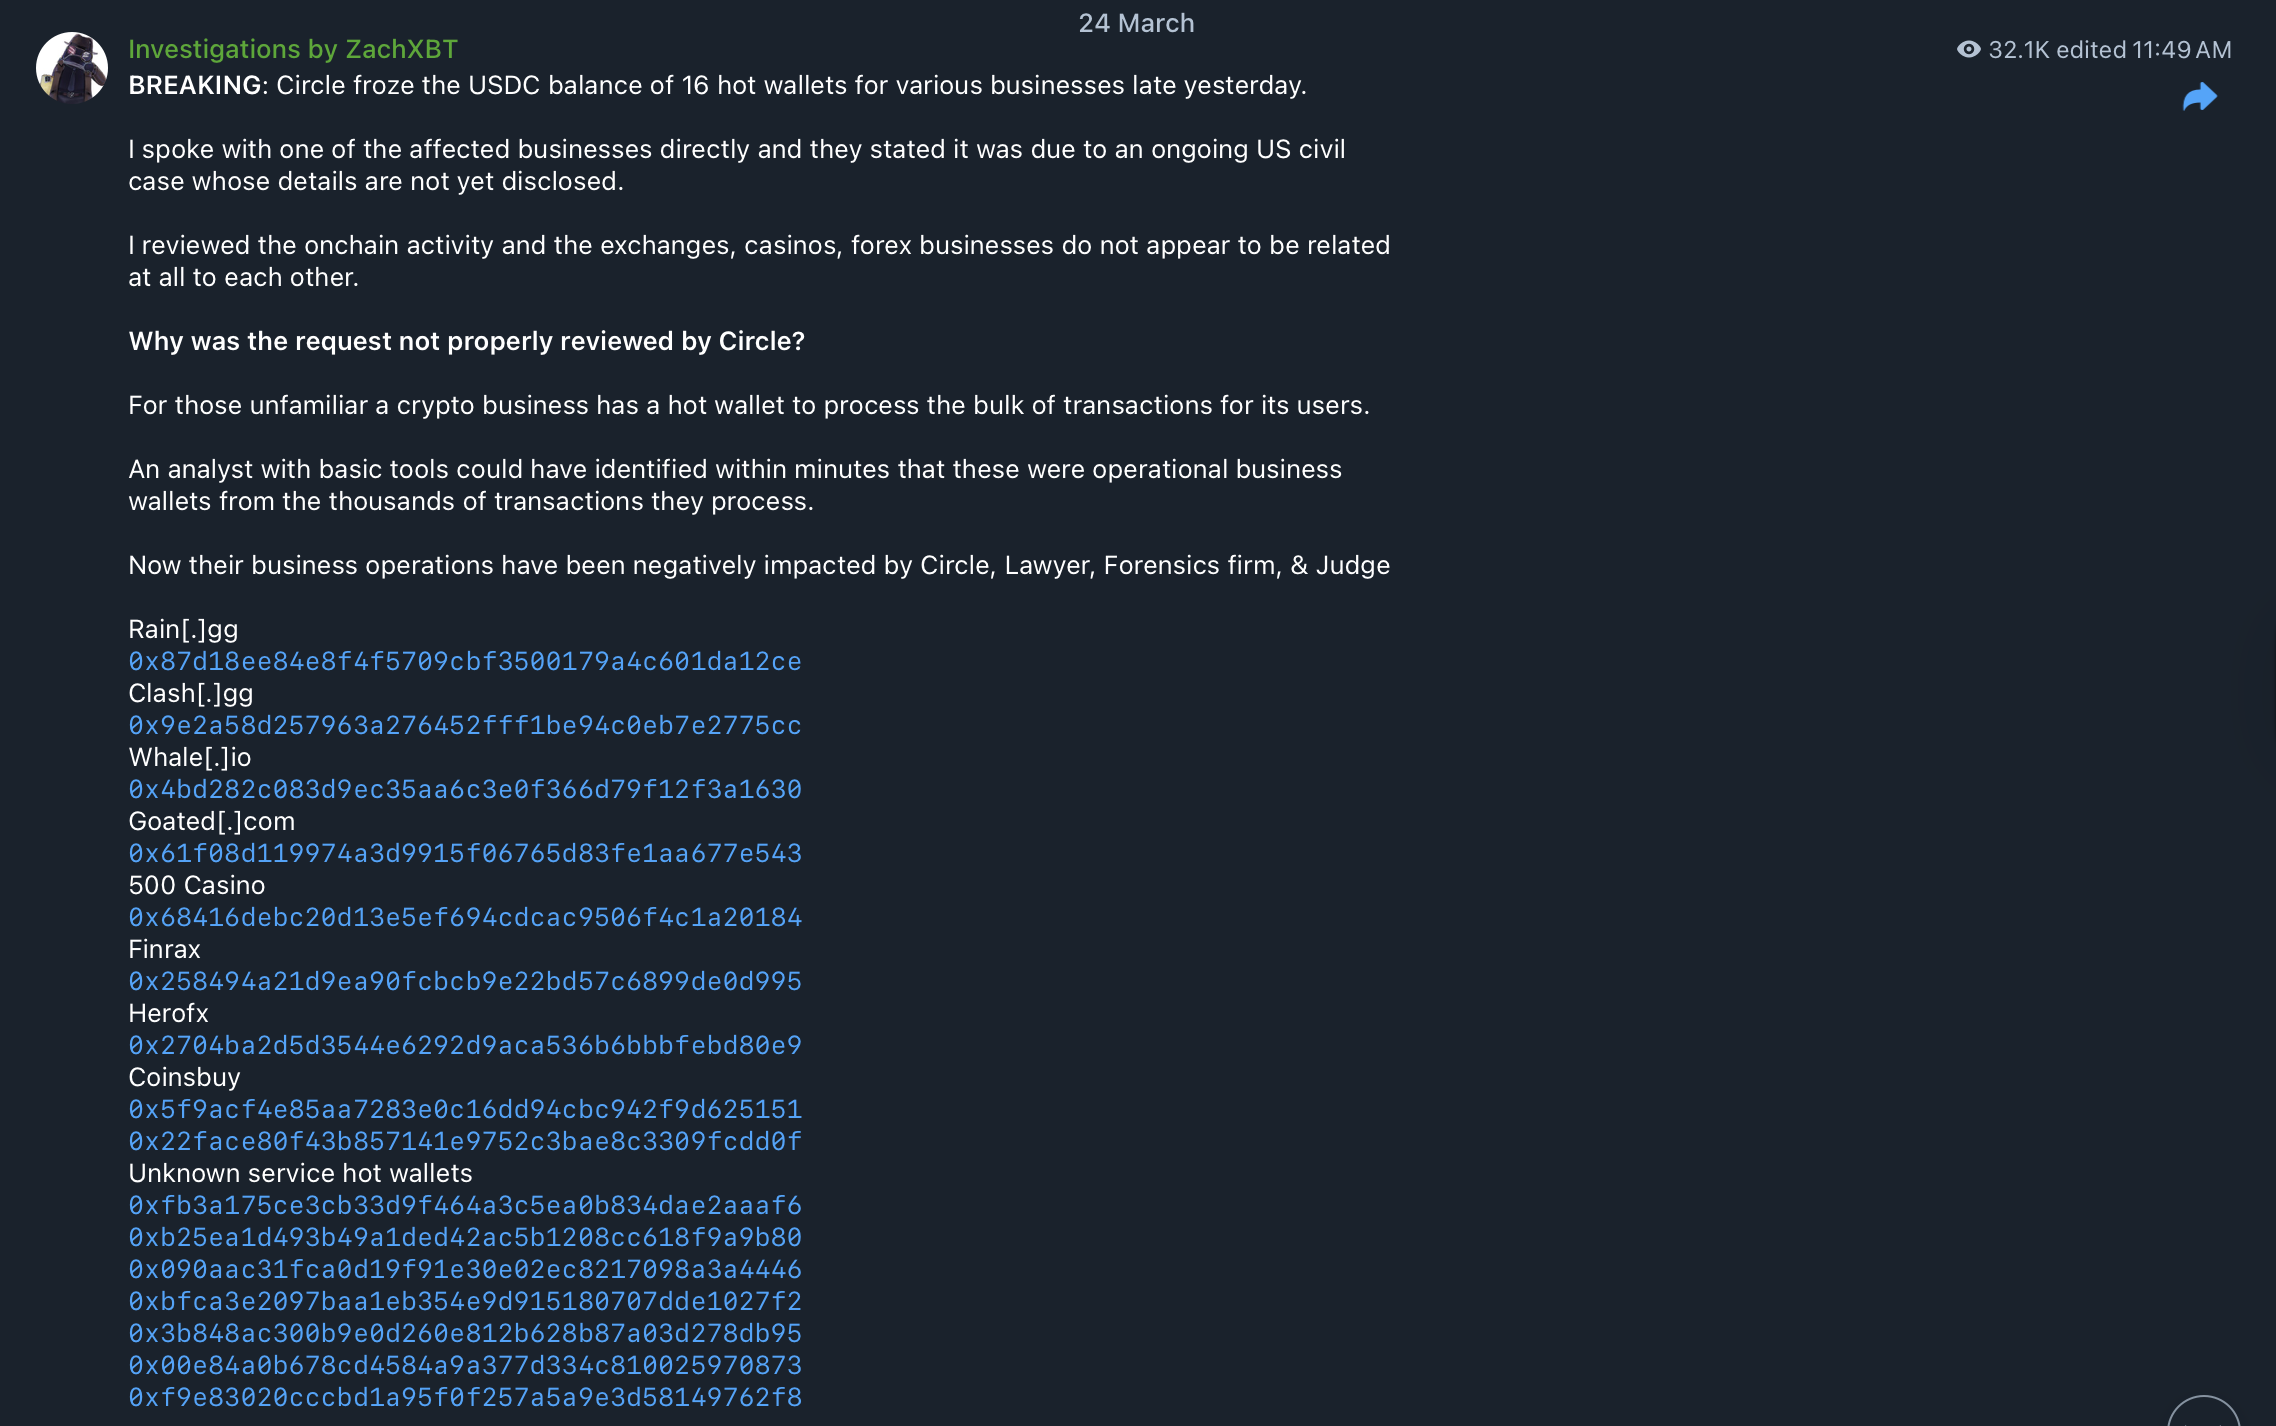
Stablecoin issuer Circle, the company behind the USDC (USDC) dollar-pegged token, wrongfully froze 16 wallets in connection with an ongoing civil legal case in the United States, according to onchain investigator and security researcher ZachXBT.
The wallets in question belonged to crypto exchanges, online casinos and foreign currency exchange businesses, which “do not appear related at all,” ZachXBT said.
“An analyst with basic tools could have identified, within minutes, that these were operational business wallets from the thousands of transactions they process,” he said

In a separate social media post, the onchain investigator wrote that the case is “sealed,” and Circle had “zero basis” to freeze the fiat-pegged tokens. He added:
“In my 5-plus years of investigations, it could potentially be the single most incompetent freeze I have seen. This is what happens when you outsource your freezing decisions to literally any random federal judge instead of having a process.”
Cointelegraph sought comment from Circle about the claims but did not obtain a response by the time of publication.

Centralized stablecoins can be frozen by the issuer, which goes against the core value proposition of cryptocurrencies as permissionless, censorship-resistant assets, critics of the technology say.
Related: ZachXBT says fake X accounts used viral war content to drive crypto scams
Crypto executives warn that regulated stablecoins are gateway to CBDCs
“This is your 10th reminder that centrally issued stablecoins are not actually yours; they can be frozen, unlike cash,” Mert Mumtaz, founder of remote procedure call (RPC) node provider Helius, said in response to the USDC wallet freezes.
Jean Rausis, co-founder of the Smardex decentralized trading platform, said that provisions in the GENIUS stablecoin regulatory framework laid the groundwork for a privately managed central bank digital currency (CBDC) to emerge.
Centralized stablecoins effectively give the issuer the same financial surveillance and asset freezing capabilities that a standard CBDC would provide, he said.
Former US lawmaker Marjorie Taylor Greene echoed Rausis’s warning in May 2025, arguing that regulated stablecoins under the GENIUS bill are a “CBDC Trojan Horse.”
Magazine: Coinbase hack shows the law probably won’t protect you: Here’s why

The British designer worn by everyone from Madonna and Taylor Swift to Charli xcx

Bitcoin Tests Key Level as Compression Builds Toward $80K

Reform in trouble amid crackdown on crypto and foreign donors


-
 Crypto World5 days ago
NIO (NIO) Stock Plunges 6.5% as Shelf Registration Sparks Dilution Worries
-

 Fashion5 days ago
Weekend Open Thread: Adidas – Corporette.com
-

 Politics5 days ago
Jenni Murray, Long-Serving Woman’s Hour Presenter, Dies Aged 75
-
 NewsBeat14 hours ago
Manchester United reach agreement with Casemiro over contract clause amid transfer speculation
-

 Crypto World4 days ago
Best Crypto to Buy Now: Strategy Just Spent $1.57 Billion on Bitcoin During Fear While Early Investors Quietly Enter Pepeto for 150x Potential
-

 Crypto World4 days ago
Bitcoin Price News: Bhutan Sells $72 Million in BTC Under Fiscal Pressure, but the Smart Money Entering Pepeto Sees What the Market Does Not
-

 Tech6 days ago
inKONBINI Lets You Spend Summer Days Behind the Register
-

 Sports2 days ago
Remo Stars and Kano Pillars Strengthen Survival Hopes in NPFL
-

 Politics6 days ago
Gender equality discussions at UN face pushbacks and US resistance
-

 Business3 days ago
No Winner in March 21 Drawing as Prize Rolls to $133 Million for Next
-

 Sports2 days ago
Gary Kirsten Accuses Pakistan Cricket Board Of ‘Interference’, Mohsin Naqvi Responds
-

 Tech3 days ago
Give Your Phone a Huge (and Free) Upgrade by Switching to Another Keyboard
-

 Sports5 days ago
2026 Kentucky Derby horses, odds, futures, preview, date: Expert who nailed 12 Derby-Oaks Doubles enters picks
-
Sports7 days ago
Vikings Free Agency Enters Phase 2 with Key Questions
-

 Tech3 days ago
AI enters the chat: New Seattle dating app relies on tech to facilitate meaningful human connections
-

 Politics6 days ago
Scotland’s rejection of assisted dying is a victory for humanity
-

 Tech7 days ago
Corsair K100 Air Wireless Mechanical RGB Keyboard Packs Full Power Into a Slim Frame
-

 Business6 days ago
DLocal: Entering 2026 At Escape Velocity
-
Business5 days ago
Columbia Sportswear enters $500 million credit agreement with JPMorgan Chase
-
 NewsBeat7 days ago
Val Kilmer to appear posthumously in new film using generative AI
You must be logged in to post a comment Login