
CryptoCurrency
Most Reliable Bitcoin Price Signal Points to a 2026 Bull Run

Bitcoin (CRYPTO: BTC) traders were watching a confluence of momentum signals that historically foreshadow sizable moves, but on-chain data suggests a cautious path ahead as market participants lean defensive. A fresh cross between momentum indicators tied to major yield curves has rekindled optimism for a breakout, yet spot activity and fund flows point to lingering headwinds. The juxtaposition of bullish signals with a tepid immediate bid underscores a market that could take time to reassert upside momentum, even as investors weigh macro risks and policy posture.
Key takeaways
- Bitcoin surged 600% in 2021 after a similar bullish cross was confirmed, a pattern observed by market observers and cited as an enduring bull-run signal.
- Onchain data points to persistent sell-side pressure, suggesting that a price recovery could be slower than hoped as market participants adopt a risk-off stance.
- Spot Bitcoin ETF weekly net flows flipped from a $1.6 billion inflow to a $1.7 billion outflow, signaling cooling institutional demand and added near-term downside pressure.
- Gold rose above $5,000 per ounce, while BTC traded in a range, a divergence some analysts say is historically common before a disruptive breakout in crypto markets.
- The most recent cross on the Stochastic RSI of the US 10-Year Treasury Yield and the China 10-Year Government Bond Yield against BTC’s chart last occurred in October 2020, preceding a major rally to new highs in 2021.
Tickers mentioned: $BTC
Sentiment: Neutral
Market context: The broader market is contending with mixed macro cues, with investors weighing yields, global growth signals and liquidity conditions against a backdrop of fluctuating ETF flows and hedging demand. The crypto complex remains sensitive to macro shifts, policy signals, and risk appetite, which can keep downside volatility elevated even when bullish markers flash.
Why it matters
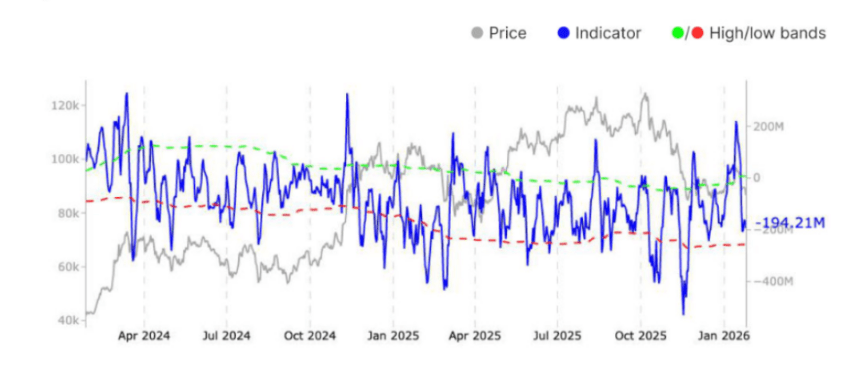
The narrative around BTC’s near-term trajectory is a study in contrasts. On one hand, a notable bullish cross—where momentum indicators pick up in tandem with benchmark yields—has historically marked inflection points that precede significant upside. On the other hand, on-chain metrics have turned increasingly defensive. The spot cumulative volume delta (CVD), a gauge of the net difference between buying and selling pressure, has swung decisively negative, signaling that more traders are stepping back or hedging against further downside. This contraction in buying vigor underscores a market that could remain range-bound until buyers reappear with convincing momentum. Glassnode notes in its Weekly Market Impulse report that selling pressure has surged, and hedging demand is rising, a combination that tends to cap near-term upside unless new catalysts emerge.
The swing in ETF dynamics compounds the complexity. Weekly net flows into spot BTC ETFs flipped from inflows of roughly $1.6 billion to outflows near $1.7 billion, illustrating a cooling in the institutional bid that has often helped stabilize prices during drawdowns. The shift suggests that traders are increasingly prioritizing hedges and capital preservation over aggressive long bets, at least in the near term. A broader context of macro uncertainty and higher macro hedging costs adds to the sense that a sustained bounce may require a fresh tranche of liquidity or a decisive risk-on turn in broader markets.
“Overall, market conditions have shifted more defensive, while persistent sell-side pressure and rising hedging demand suggest the market remains fragile.”
Despite these countervailing threads, the allure of a renewed BTC rally remains. The historical precedent—where a similar Stochastic RSI cross tied to major yields preceded a blistering rally—offers a blueprint for bulls. A key reference point is October 2020, when the last cross occurred and preceded a 600% ascent to BTC’s 2021 all-time high around $69,000. That context is part of the ongoing debate about whether current signals could repeat a similar script, or whether the intervening macro environment—ranging from tighter financial conditions to evolving regulatory pressure—will mute the effect.
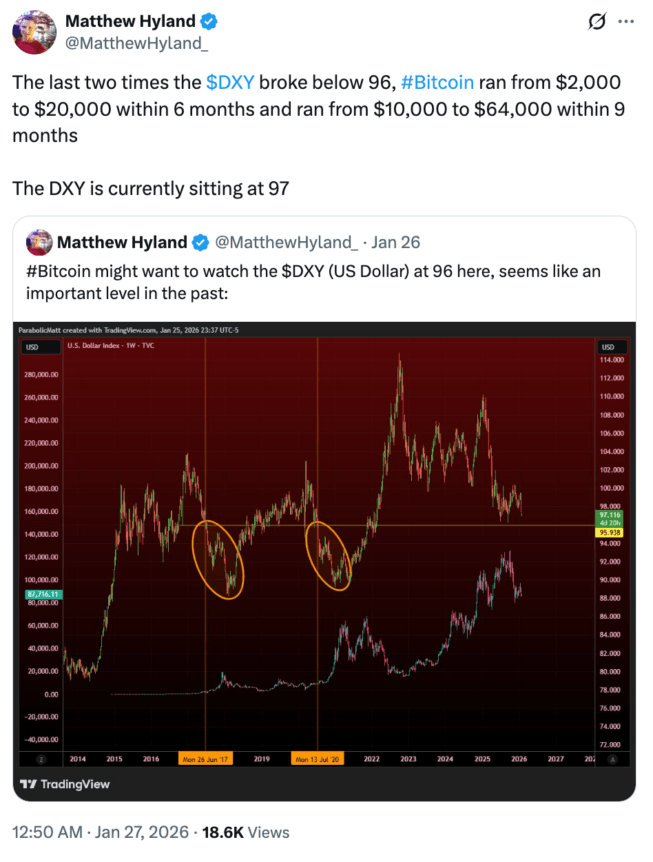
As traders weigh these dynamics, some analysts point to the dollar’s behavior as an accelerant for BTC’s next move. Matthew Hyland argues that a break to the upside could hinge on the U.S. dollar index (DXY) weakening below 96, a pattern that historically coincided with tradable BTC upside in prior cycles. This line of thinking aligns with research linking dollar strength to risk-off conditions that suppress risk assets, including BTC, until the macro backdrop shifts. Hyland’s assessment mirrors a broader view that macro signals will play a decisive role in BTC’s trajectory over the coming weeks, alongside technical and on-chain data points.
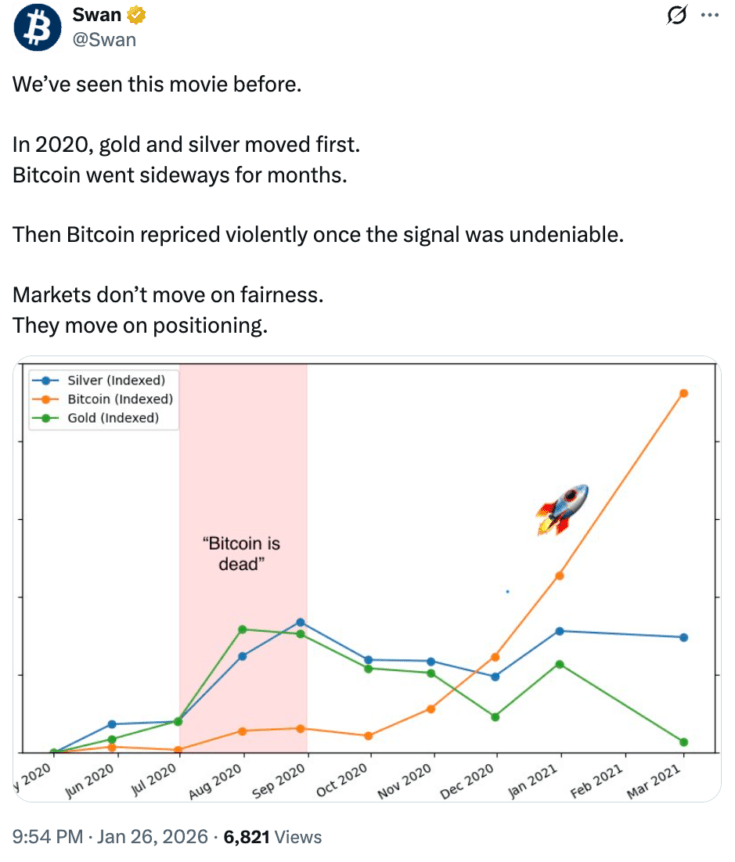
In parallel, the market’s risk-on/risk-off balance is reflected in cross-asset dynamics. The long-standing divergence between gold and BTC—gold climbing above $5,000 while BTC remains in a broad range—has drawn attention from traders who study cross-asset behavior for clues about crypto cycles. Some observers from Swan advocate patience, noting that gold tends to move first and that BTC often coalesces in a prolonged sideways phase before a decisive breakout, a pattern that has repeated across past cycles.
Beyond the immediate price action, the market’s fragility is echoed in a steady drumbeat of caution from observers tracking on-chain behavior and ETF momentum. The convergence of negative CVD, waning institutional demand and macro uncertainty paints a cautious canvas for BTC over the near term. Yet history has shown that once buyers regain conviction—often triggered by a combination of favorable macro data, a reset in risk sentiment and a fresh stream of liquidity—the crypto market can snap back with the kind of velocity that leaves late-cycle skeptics catching up. In the current environment, that reset could hinge on a confluence of factors rather than a single catalyst, aligning with the nuanced reality that a rapid breakout remains plausible but not guaranteed without stronger on-chain demand and macro support.
What to watch next
- Monitor BTC’s response to any renewed risk-on signals and changes in the DXY, particularly if the dollars begin to loosen in the coming weeks.
- Track spot CVD momentum for signs of a shift back toward net buying and a potential breakout phase.
- Watch ETF-related flows for any resumption of institutional demand or renewed outflows that could redefine the near-term path.
- Assess cross-asset dynamics with gold and other macro assets to gauge evolving hedging behavior and contingency strategies.
Sources & verification
- Glassnode, Weekly Market Impulse report (spot CVD and market resilience assessments).
- Cointelegraph reports on Bitcoin ETFs net flows and market sentiment dynamics.
- Gold divergence article: “Gold reaches all-time high 5k diverging Bitcoin.”
- Swan analysis on cross-asset divergences and market implications.
- Commentary on DXY strength and macro drivers, including traders’ perspectives on BTC’s price pathway.
Bitcoin’s market reaction and the road ahead
Bitcoin (CRYPTO: BTC) stands at a crossroads where a confluence of historical signals collides with current macro realities. The bullish cross observed on momentum readings tied to major yield curves has historically been a prelude to substantial upside, and this time is no exception in the eyes of some analysts. Yet the on-chain narrative remains stubbornly mixed. The spot CVD has turned decisively negative, underscoring a shift toward selling and hedging that could suppress immediate upside unless buying interest strengthens. The flip in ETF flows from inflows to outflows further complicates the path, suggesting that institutions are recalibrating risk exposure in the face of macro uncertainty and policy ambiguity.
On the upside, the historical record offers a note of optimism. The last time the Stochastic RSI cross involving US10Y and CN10Y occurred, BTC advanced into a sustained rally that culminated in a multi-year run to new highs. The comparison to the Oct 2020 cross remains a focal point for bulls who argue that big price moves often follow once the macro and technicals align. However, the present environment is not a direct replay of that period. The market’s defensive posture—evidenced by hedging demand and cautious positioning—could mean a slower burn before any decisive breakout materializes. The divergence between gold and BTC, while notable, has historically not been a standalone predictor; rather, it serves as one of many indicators traders watch as they calibrate risk appetite and positioning.
In this context, near-term watchfulness is prudent. The confluence of on-chain signals, ETF dynamics and macro cues suggests that BTC could remain in a broader range until a clear shift in liquidity or sentiment occurs. Participants should consider how a potential break above resistance zones could unfold in a low-liquidity environment and what that implies for risk management in trading and investment strategies. The coming weeks will be telling, with macro data, policy signals and evolving ETF flows likely to determine whether the next leg is a sustained rally or a renewed consolidation phase.
https://platform.twitter.com/widgets.js


