
Crypto World
NEAR Protocol (NEAR) jumps 12.4% over weekend
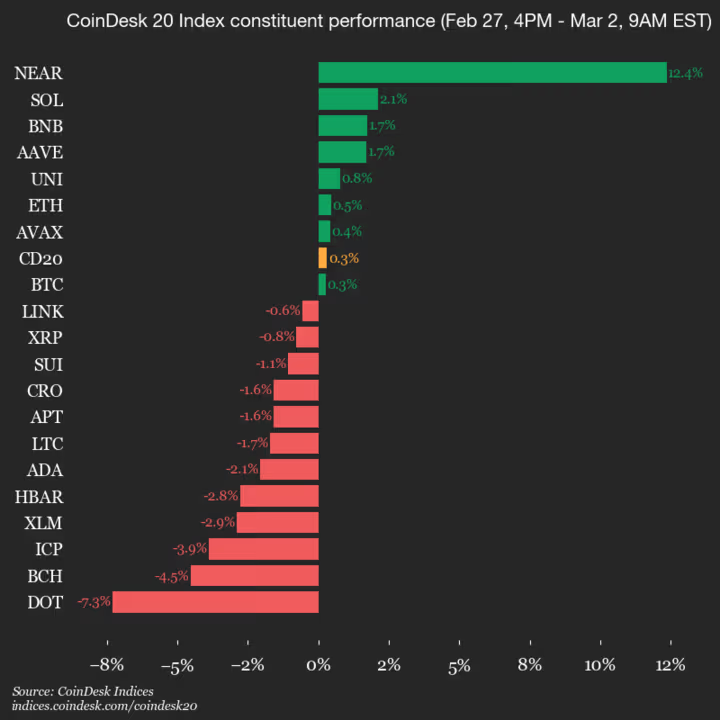
CoinDesk Indices presents its daily market update, highlighting the performance of leaders and laggards in the CoinDesk 20 Index.
The CoinDesk 20 is currently trading at 1907.12, up 0.3% (+5.99) since 4 p.m. ET on Friday.
Eight of the 20 assets are trading higher.

Leaders: NEAR (+12.4%) and SOL (+2.1%).
Laggards: DOT (-7.3%) and BCH (-4.5%).
The CoinDesk 20 is a broad-based index traded on multiple platforms in several regions globally.


The House Financial Services Committee meets Wednesday to decide the future of Wall Street’s backend. Lawmakers will question executives from Nasdaq, DTCC, and the Blockchain Association on how to move trillions in securities onto blockchain rails.
The hearing marks a critical pivot from “crypto as casino” to “crypto as infrastructure.”
Chair French Hill (AR-02) convenes the session at 10:00 AM ET in the Rayburn House Office Building. The focus is specific: determining if current securities laws are strangling the efficiency of tokenized assets.
The committee is looking for a way to let regulated firms use blockchain records without triggering an SEC enforcement action. The testimony delivered here will shape the bipartisan legislation expected later this spring.
- Legislative Scope: The hearing reviews two draft bills: one mandating a joint SEC-CFTC study on tokenized products, and another allowing regulated firms to maintain blockchain-based records.
- Institutional Weight: Witnesses include top brass from Nasdaq, DTCC, and SIFMA, signaling that traditional finance—not just crypto natives—is driving the pressure for regulatory clarity.
- Market Impact: Successful legislation would greenlight pilot programs for tokenized stocks and bonds, moving Real World Assets (RWAs) from experimental sandboxes to institutional balance sheets.
Tokenization and the Future of Securities: What the Hearing Covers
The hearing has a name: “Tokenization and the Future of Securities: Modernizing Our Capital Markets.”
The witness list means business. Kenneth Bentsen Jr. of SIFMA, Summer Mersinger of the Blockchain Association, Christian Sabella of the DTCC, and John Zecca of Nasdaq. The architects of traditional market plumbing and the builders of new rails, sitting at the same table.
Two draft bills are on the agenda. The Modernizing Markets Through Tokenization Act forces the SEC and CFTC to stop fighting over jurisdiction and conduct a joint study on tokenized derivatives. The Capital Markets Technology Modernization Act goes further, codifying the ability of broker-dealers to use blockchain for record-keeping.
This comes one week after the SEC and CFTC signed a coordination pact. Regulators are aligning just as Congress moves to open the field.
The signal flare for Real World Assets is lit.
Projects have been stuck in pilot phases for one reason: legal settlement finality on a blockchain is still a gray area. Advance the Modernization Act and banks get the legal cover they need to scale tokenized treasuries and bonds. Institutional appetite is already there. Tokenized securities are the logical next step.
Compliance is where it gets messy. The SEC says tokenized assets are securities first, technology second. The industry says applying 1940s paper-based rules to instantaneous ledger settlements makes no sense. That fight is front and center Wednesday.
The stablecoin angle is indirect but impossible to ignore. Tokenized securities need a cash leg for settlement. That means a wholesale CBDC or a regulated stablecoin. Push hard enough on on-chain securities and stablecoin legislation gets dragged along with it.
One bill pulls the other.
What to Watch When the Hearing Opens
Watch Chair French Hill’s line of questioning.
If he pushes witnesses on specific bottlenecks in SEC Rule 15c3-3, the Committee is ready to legislate now. Vague questions about innovation mean they are not.
The interaction between the Blockchain Association’s Summer Mersinger and traditional finance witnesses matters just as much. A united front between Web3 advocates and SIFMA and Nasdaq puts real pressure on the SEC. If they split, with TradFi pushing private permissioned chains while crypto advocates want public mainnets, the regulatory path fractures. The DTCC’s testimony is the wildcard. They control the current settlement layer. If they validate blockchain’s efficiency, the argument is effectively over.
Timeline is everything. A successful hearing sets up a markup by late April. No consensus pushes real change into late 2026, while Singapore and the UK keep moving.
The infrastructure is ready. The banks are ready. Wednesday decides if regulation gets out of the way.
Discover: The best new crypto in the world
The post What to Expect From This Week’s House Committee Hearing on Tokenization appeared first on Cryptonews.

US financial regulators just rewrote the rulebook. On Tuesday, the SEC and CFTC released joint guidelines classifying the vast majority of digital assets as commodities or “digital tools,” stripping the SEC of its previous enforcement-heavy oversight role.
The move immediately fueled conflict-of-interest allegations regarding World Liberty Financial, the DeFi project controlled by the Trump family.
- Token Taxonomy: New SEC-CFTC guidelines classify most crypto assets as commodities, exempting them from securities registration.
- Conflict Concerns: Insiders argue the shift directly benefits World Liberty Financial by reducing disclosure burdens for the Trump family project.
- Legislative Bridge: Chair Paul Atkins frames the rules as a temporary measure while Congress stalls on the Digital Asset Market Clarity Act.
The Mechanics of the ‘Token Taxonomy’ Shift Explained
SEC Chair Paul Atkins calls it a “token taxonomy.” The market calls it a total reversal. Speaking at the Blockchain Summit in DC, Atkins confirmed the regulator is “not the ‘securities and everything commission’ anymore.”
The new joint guidelines with the CFTC explicitly categorize most digital assets—including payment tokens, collectibles, and utility assets—as distinct from securities.
— BSCN (@BSCNews) March 18, 2026
 CRYPTO: SEC OFFICIALLY CLASSIFIES NFTs AS "DIGITAL COLLECTIBLES," NOT SECURITIES
The joint SEC/CFTC interpretive guidance dropped March 17 with a five-category token taxonomy:
Digital commodities (BTC, ETH, SOL, XRP, ADA, LINK + 10 more) Digital collectibles (NFTs,… pic.twitter.com/acXShbdce1
This creates a massive regulatory moat. Under the previous administration, these assets faced existential legal threats for failing to register.
Now, they are officially deemed “digital tools.” Only direct blockchain-based representations of existing securities, such as tokenized stocks and bonds, remain under the strict purview of the SEC. This is the operational rollout of the regulation philosophy Atkins promised: innovation first, enforcement second.
The timing is critical. While the administration pushes for the Digital Asset Market Clarity Act, the legislation remains stalled in Congress due to disputes over stablecoin interest provisions. Atkins is not waiting for the vote.
By issuing these guidelines now, agencies are creating a provisional safe harbor that mimics the Act’s intended structure without requiring legislative approval. The agencies frame this as a “bridge” to provide certainty, but it effectively sidelines the stricter oversight mandates that defined the Gensler era.
Does the New Framework Shield Family Interests?
The policy shift creates an immediate governance paradox. Market insiders note that the primary beneficiary of this deregulated environment is likely World Liberty Financial, the lending protocol launched by the Trump family.
Under the Biden-era interpretation, project insiders faced strict lockup periods and heavy disclosure requirements. The new “digital tool” classification effectively bypasses those hurdles.

Todd Baker, a senior fellow at Columbia Law School, argues the framework is tailored to facilitate “profit-making but socially valueless” trading free from federal oversight.
The contrast with recent history is sharp. Just months prior, the industry was navigating heavy litigation, such as cases where Gemini was sued over its internal governance and strategy shifts.
The new rules likely preclude similar enforcement actions against projects like World Liberty Financial, provided they do not tokenize existing securities.
Critics argue this creates a two-tier system where connected projects gain faster access to liquidity. However, supporters like The Digital Chamber’s Cody Carbone see it as a necessary correction to keep the US competitive.
With other jurisdictions vacillating, South Korea is still debating the total abolition of crypto taxes to prevent capital flight, the US is moving aggressively to cement its status as the global crypto capital. Summer Mersinger of the Blockchain Association framed the coordination as helpful in the “near term,” but the conflict of interest questions remain the headline.
The agencies have built their bridge, but it leads to a political minefield. Rules can be rewritten by the next chair; only legislation provides cement. Until the Clarity Act clears Congress, the market is trading on administrative permission, not law.
Discover: The best new crypto in the world
The post Trump SEC Overhaul Fuels Oversight Debate Over Family Crypto Conflicts appeared first on Cryptonews.


- HBAR rose to above 0.095 as crypto sentiment improved following recent macro‑driven swings.
- The $0.13-$0.15 zone could be a major resistance region for bulls.
- Hedera price must reclaim and hold above $0.10 to confirm a potential trend reversal.
Hedera (HBAR) price jumped more than 5% in 24 hours as cryptocurrency markets flipped green, with bulls eyeing momentum amid optimism that the US-Iran war could end soon.
But as Hedera’s native token targets a breakout above the $0.10 mark, what resistance cluster is likely to derail buyers? The technical chart provides the outlook.
Here’s why HBAR price rose, testing a key level
Hedera’s HBAR rose to intraday highs near $0.095 on Monday as Bitcoin and the broader market reacted to geopolitical developments.
The move followed comments from Donald Trump suggesting easing tensions with Iran, which helped lift sentiment across risk assets.
Bitcoin climbed above $71,000 during the session, while BNB also moved higher toward $650, supporting gains in altcoins.
Despite the initial relief, underlying uncertainty remains. Ongoing tensions linked to the Iran conflict and broader macroeconomic headwinds continue to limit upside across the crypto market.
Adding to the uncertainty, reports cited Iranian state media disputing Trump’s claims, stating that no negotiations are underway and rejecting his remarks.
Against this backdrop, HBAR’s near-term direction remains tied to broader market movements.
A renewed decline in Bitcoin could push the token back below the $0.09 level.
On the other hand, sustained buying above current levels could open the door for further short-term gains, with a key resistance zone likely to define the next move.
Hedera price forecast: can bulls extend rally?
Analysts tracking Hedera highlight $0.10 as a key near-term pivot, with potential upside targets in the $0.13–$0.15 range.
This zone has recently acted as a ceiling for price advances, capping bullish attempts.
A sustained move higher would require HBAR to break above the 50-day exponential moving average near $0.098 and the 100-day EMA around $0.11.
Clearing these levels would bring the token toward a primary resistance area near the 200-day EMA, around $0.13, which has marked recent rejection points.
Previous attempts to push higher have struggled to hold gains beyond the $0.15 level.
At present, HBAR is retesting the middle band of the Bollinger Bands on the daily chart.
The bands are tightening, indicating reduced volatility and suggesting that a breakout may be approaching, although confirmation is still needed.

Hedera HBAR chart by TradingViewFailure to clear this zone could see HBAR revert into a consolidation corridor within a long-term downward channel.
Conditions across the market could then mean an extended sideways action before clarity from macro or fundamentals becomes the next upside catalyst.
Bears may eye $0.07 and $0.06 as major support levels.

TLDR
- Shibizens confirmed that Shibarium completed a major server migration and full chain reindexing in the past 30 days.
- The Shibarium explorer is about 45% synchronized as it rebuilds its database from scratch.
- Displayed explorer data shows fewer blocks, transactions, and wallets due to incomplete indexing.
- Actual on-chain data exceeds 14 million blocks and 1.56 billion transactions.
- The real wallet count stands above 270 million addresses despite lower visible figures.
Shibizens reported a 30-day infrastructure overhaul across Shibarium systems. The update confirms a server migration and a full chain re-indexing process. The team clarified that the changes reflect upgrades rather than network slowdown.
Shibarium Infrastructure Rebuild and Explorer Reindexing
Shibizens stated that Shibarium completed a major server migration during the last 30 days. The team also initiated a full chain re-indexing to strengthen system capacity. They explained that the process rebuilds the explorer database from scratch. As a result, synchronization now stands near 45%. However, the explorer currently shows partial on-chain data. Shibizens stressed that this reflects indexing progress rather than missing blockchain records.
The group addressed visible discrepancies on the Shibarium explorer. Displayed data lists about 2.4 million blocks and 168 million transactions. In contrast, actual records exceed 14 million blocks and 1.56 billion transactions. Wallet data also differs across reports. The explorer shows about five million addresses, while real figures exceed 270 million addresses. Shibizens attributed the gap to incomplete indexing across nodes.
Shibizens stated that only 51% of blocks remain indexed. They cited Shibariumscan and Shibburn data to support the figure. They explained that indexing delays affect visible balances and NFT displays. However, they confirmed that on-chain assets remain intact. “Shibarium is not lagging,” Shibizens said. They added, “It is rebuilding at scale for what’s coming next.”
The team emphasized that token visibility depends on explorer synchronization. Therefore, some wallets may not reflect full holdings. They clarified that blockchain records remain unchanged during migration. They also confirmed that block production continues normally. Current block time averages about five seconds. The network continues processing transactions without interruption.
Layer 3 Focus Expands Across Puppynet and SHIB Ecosystem
Shibizens reported that the development focus now shifts toward Layer 3. The team referenced Shib Alpha and ShibClaw within the roadmap. They indicated that testing efforts now concentrate on advanced scaling layers. Meanwhile, Puppynet continues to operate as Shibarium’s testnet. The team confirmed that AI-driven automated contract activity is increasing. However, block time stability remains steady at five seconds.
Over the weekend, Woofswap confirmed that Shibarium L3 remains under active testing. The participant shared limited details regarding technical specifications. Shibizens also confirmed that a new L3 explorer went live on March 21. The launch supports early testing and monitoring functions. They described the rollout as part of the broader infrastructure buildout.
Puppynet continues recording automated contract interactions across its network. Developers monitor activity patterns and test smart contract deployments. The testnet supports validation before mainnet integration. Shibizens reiterated that infrastructure upgrades support future expansion.


The U.S. Securities and Exchange Commission is advancing its framework to reinterpret how federal securities laws apply to crypto assets, moving two proposed rules to the White House for review. The centerpiece is an interpretive notice that could narrow the jurisdiction of federal securities laws over many digital assets, signaling a potential regulatory shift while the White House weighs the plan.
Regulatory records show the SEC submitted the two proposals to the Office of Management and Budget for review on a recent Friday, with one item explicitly detailing which digital assets the agency might deem securities under federal law. As of Monday, the record listed the package as “pending review” by the White House, a status that could influence both enforcement and regulatory posture depending on the administration’s assessment.
Key takeaways
- The SEC forwarded two proposed rules to the White House Office of Management and Budget, including an interpretive notice on what digital assets could be securities.
- Chair Jay (Paul) Atkins signaled last week that the agency would not treat four asset classes as securities: digital commodities, digital tools, digital collectibles (NFTs), and stablecoins, while offering a cohesive token taxonomy for these types.
- The interpretive framework aims to clarify when a “non-security crypto asset” might qualify as an investment contract, providing regulatory guidance ahead of any potential congressional action.
- The move follows a memorandum of understanding with the CFTC, underscoring growing cross-agency coordination as lawmakers consider a broader market-structure bill for digital assets.
SEC interpretive move and what it could mean for crypto regulation
The SEC’s latest step appears to aim at providing a more coherent framework for determining when a crypto asset falls under securities laws. In a notice released last week, Chair Atkins indicated that digital commodities, digital tools, digital collectibles—including non-fungible tokens—and stablecoins would not be treated as securities under the agency’s purview. The interpretive notice is described as establishing a “coherent token taxonomy” for these asset classes and addressing how a non-security crypto asset may or may not be considered an investment contract under the Howey test.
If finalized, the interpretive rule could serve as a bridge to crypto regulation while Congress debates a more comprehensive market-structure bill to bring clear, unified rules to the sector. The AML-style approach would aim to reduce regulatory ambiguity and potentially recalibrate how exchanges, custodians, and developers operate in the interim. The policy aligns with the agency’s recent collaboration with the CFTC, highlighted by a Memorandum of Understanding signed earlier this month to clarify jurisdictional boundaries and regulatory expectations in the crypto markets.
Regulators and market participants have long sought a stable, forward-looking framework that reduces uncertainty around whether a given token is a security. The SEC’s proposed taxonomy is meant to outline how different digital asset types should be treated, and crucially, when assets may still be subject to investment contract analysis even if they fall outside the securities umbrella. The White House review stage is a critical gate: a positive outcome could accelerate regulatory alignment, while a protracted or revised review could push the timetable for broader legislative action.
Broader policy momentum: White House talks, stablecoins, and the CLARITY Act
Beyond the White House review, the crypto policy landscape continues to evolve at the congressional level. Politico reported on Friday that White House officials and lawmakers had reached an agreement in principle on some aspects of the crypto regime, including stablecoin yield considerations that could shape the market-structure bill’s trajectory in the Senate Banking Committee. However, the committee indefinitely postponed its markup of the bill in January after Coinbase CEO Brian Armstrong expressed public concerns about the legislation as written, underscoring the political sensitivity surrounding crypto regulation.
As of Monday, there had been no public announcement of a new date for the markup. Senate leadership outlined a workflow prioritizing other legislation, such as the SAVE America Act, before returning to bipartisan crypto debate. Senate Republicans and allies have signaled continued interest in a structured approach to digital assets, but the path remains contingent on both legislative negotiation and regulatory clarity from agencies like the SEC and the CFTC.
The ongoing discussions touch on the CLARITY Act, a proposed framework intended to clarify crypto markets and stablecoins under a market-structure agenda. The interagency dynamics—between the SEC’s jurisdictional interpretations, the CFTC’s role in cash and derivative markets, and congressional arbitration—will shape how quickly a final, enforceable regime can take effect, and what form it will take for issuers, exchanges, and users alike.
Investors and builders should watch two interlinked developments: the White House’s decision on the SEC’s interpretive rules and the progress (or stall) of the market-structure bill in Congress. While a regulatory pathway for many digital assets could reduce policy risk, it could also introduce new compliance obligations, particularly for entities operating in the cross-border or custody-heavy segments of the market. The tension between advancing a broad framework and accommodating industry concerns is likely to persist as lawmakers seek to balance investor protection with innovation.
As the regulatory clock ticks, participants should monitor the White House’s review timeline, the final content of the interpretive notice, and any updates to the market-structure bill’s language—especially provisions around stablecoins and collateral use. The next few weeks could reveal whether the administration’s review will accelerate clarity or reveal remaining ambiguities that require legislative refinement.
What remains uncertain is how quickly the White House completes its review and whether Congress will greenlight a comprehensive framework on digital assets in the near term. For market participants, the key question is whether the unfolding process will reduce regulatory surprise or introduce new interpretive wrinkles that alter how tokens are categorized and traded.
Readers should keep an eye on updates from RegInfo.gov and official agency notices, as well as any new statements from Senators and regulatory staff about the CLARITY Act and related crypto amendments. The evolving stance from the White House and Congress will continue to shape the baseline for crypto regulatory risk, guiding how exchanges structure listings, how issuers approach token design, and how traders price risk in a landscape that remains in flux.
Investors and industry watchers should stay tuned to forthcoming White House feedback on the SEC’s proposals, the pace of the Senate Banking Committee’s work, and further clarity on how the CFTC and SEC will coordinate enforcement and policy in the months ahead.
US Senators Adam Schiff and John Curtis are expected to introduce a bipartisan bill on Monday that would bar sports betting and “casino-style” contracts from prediction markets regulated by the Commodity Futures Trading Commission (CFTC), according to a Monday Wall Street Journal report.
“Too many young people in Utah are getting exposed to addictive sports betting and casino-style gaming contracts that belong under state control, not under federal regulators,” Senator Curtis, one of the bill’s co-sponsors, told the WSJ.
If introduced as reported, the measure would add to a widening Washington push against certain prediction market contracts. The report adds to the growing regulatory scrutiny over prediction markets, following renewed insider trading concerns sparked by the US-Israeli war with Iran.
On March 10, Schiff introduced the DEATH BETS Act, a bill seeking to prohibit CFTC-regulated prediction markets from listing contracts tied to war, terrorism, assassination and individual death.
Related: Prediction markets boom on Iran bets as Congress eyes ban
Sports markets drive trading volume
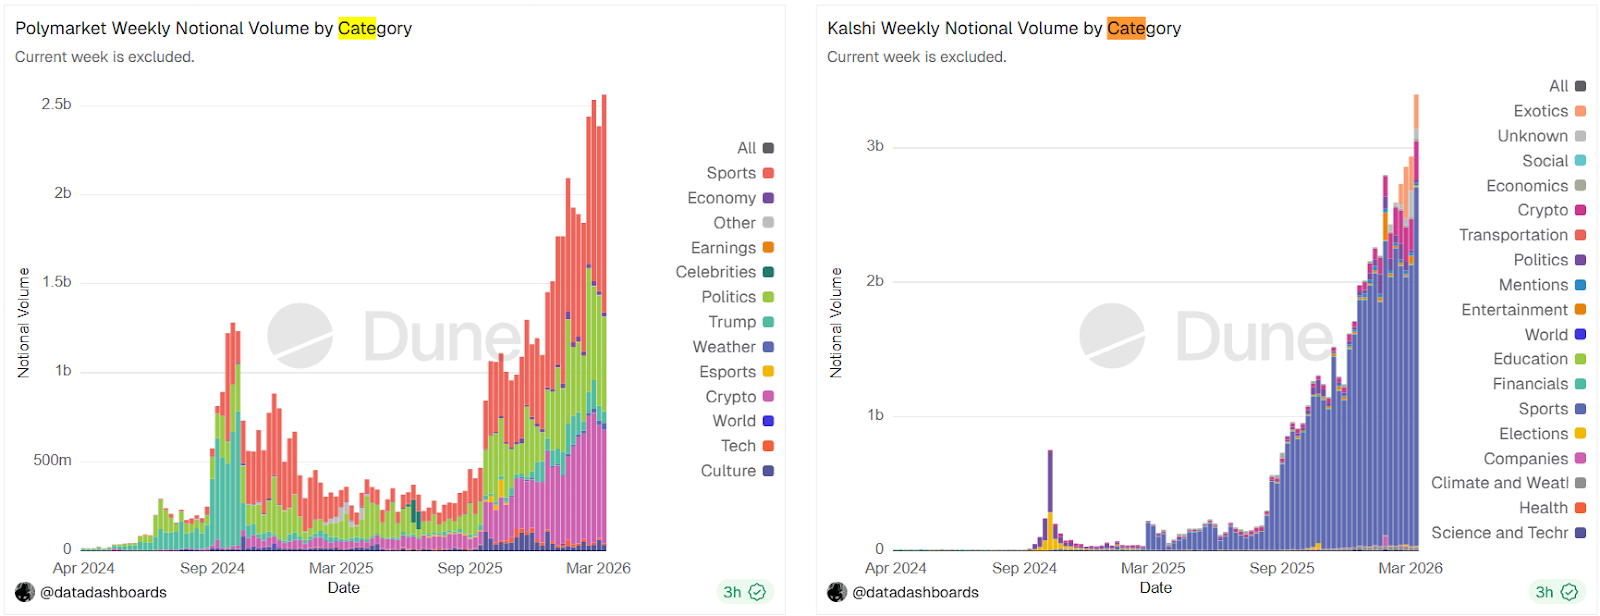
Sports betting is a leading source of trading activity on prediction market platforms. Sports-related contracts accounted for 47.7% of Polymarket’s weekly notional volume and 78.8% for Kalshi last week, according to Dune data.
Sports betting generated $1.2 billion in weekly notional trading volume for Polymarket and $2.6 billion for Kalshi.

State and federal lines blur
The regulatory pressure has also intensified outside Congress. On March 12, the CFTC issued a staff advisory classifying event contracts on prediction markets as a “financial asset class.”
The commodities regulator also submitted an Advanced Notice of Proposed Rulemaking, asking for public feedback on how the Commodity Exchange Act (CEA) would apply to prediction markets. Polymarket and Kalshi are regulated by the CFTC as Designated Contract Markets (DCM).
Related: Kalshi, Polymarket face trading halt in Nevada after court rulings
While CFTC Chair Michael Selig claimed the CFTC had “exclusive jurisdiction” over prediction markets, an Ohio judge tested that claim in a March 9 ruling, saying that Kalshi had failed to show the CEA “would necessarily preempt Ohio’s sports gambling laws,” or that these sports betting contracts would fall under the “exclusive jurisdiction” of the CFTC.
On Friday, a Nevada judge temporarily blocked Kalshi from offering sports, election and entertainment event contracts in the state for 14 days, finding regulators were reasonably likely to succeed in arguing the markets violated Nevada gambling law.
Cointelegraph approached the senators for comment and a copy of the draft bill.
Magazine: Inside a 30,000 phone bot farm stealing crypto airdrops from real users


Sunday’s $23 million hack of Resolv’s stablecoin USR has led to contagion across the DeFi sector.
Opportunistic traders used depegged USR to borrow against, draining liquidity in over a dozen yield vaults.
To make things worse, so-called “risk curators” then automatically allocated more funds to broken markets as lending rates spiked.
In November, a similar contagion hit DeFi’s “curated” vault ecosystem after Stream Finance announced a $93 million loss, leading to a 75% of xUSD.
Despite discussions of risk ratings and curators putting up first-loss capital in the aftermath, it appears not much was learned, after all.
Read more: Four months on, MEV Capital falls victim to $4B DeFi daisy chain implosion
The hack
Resolv Labs’ statement confirmed that a private key compromise led to the unauthorized (and unrestricted) “minting of approximately $80 million of uncollateralized USR.”
USR’s pre-hack token supply remains fully backed, with losses coming from liquidity providers (LPs) on decentralized exchanges as the hacker sold the minted tokens. For example, LPs on Curve Finance alone are estimated to have lost $17 million.
The hacker’s sell-off caused a depeg of USR, which is currently trading at $0.23, according to CoinMarketCap data. Blockchain security firm Beosin puts the attacker’s profits at 11,409 ether (ETH), worth over $23 million at the time of writing.
The Resolv team faced criticism for a slow response time while collecting the necessary multisig signatures to pause the protocol.
It has contacted the exploiter on-chain, requesting return of 90% of the converted ETH, as well as the remaining USR.
Read more: Venus Protocol hacker lost $4.7M after nine months of planning
The fallout
The hack may have been simple, but the knock-on effects have been anything but.
Depegged USR was pounced upon by opportunistic traders who used it to drain yield vaults with hardcoded price oracles. In buying cheap USR to use as collateral, users could borrow other assets, such as USDC, as if USR were still worth $1.
Read more: Oracle error adds to turmoil at DeFi giant Aave
As if things weren’t bad enough, “risk curators” automated strategies then allocated further funds to the affected markets, whose high utilization had spiked supply yields.
Chaos Labs’ Omer Goldberg explained how Morpho’s Public Allocator feature allowed curators “including Gauntlet, re7, kpk, and 9summits” to autoallocate millions of dollars worth of assets into markets “based on pre-configured and approved caps and credit lines.”
In some cases, Goldberg says, allocation into broken vaults continued for hours.
The chaos also brought innovation, however, as the auto-allocations were even specifically targeted to free up additional liquidity. Enterprising competitors Obsidian also capitalized on the incident, offering a migration service to users whose deposits are stuck in illiquid Morpho vaults
Assessing the damage
Morpho’s Paul Frambot tallied 15 affected vaults with over $10,000 of exposure to USR.
According to security researcher Weilin Li, curators of the affected vaults, on Morpho and elsewhere, include Gauntlet, Re7, MEV Capital, Extrafi, Seamless, August, Clearstar, kpk, Leyrock and 9Summits.
For those who followed November’s collapse, many of these names may be familiar.
Yearn, whose contributors were amongst the harshest critics of the yield vaults which led to November’s crash, suffered a minimal loss of $377.
Ironically (or tellingly), Resolv’s own risk manager, Steakhouse, wasn’t exposed to USR, despite stating that “operationally, Resolv demonstrates institutional rigor” just five days before the hack.
The backing of Inverse Finance’s DOLA stablecoin was indirectly exposed to the depeg of USR, with the team pledging to patch the $340,000 hole.
A number of lending markets paused USR markets, including Venus Protocol, which was itself hacked last weekend, and Lista.
Fluid was the worst hit, and may have accrued up to $17.5 million of bad debt. However, the team reassured users that it had “secured short-term loans to cover 100% of the bad debt.”
It also considers selling FLUID tokens “should any additional funds be required.”
Following a dicey few months for top dog lending protocol Aave, with governance drama and an oracle mishap, Aave Labs’ Stani Kulechov was keen to highlight Aave’s lack of exposure.
DeFi daisy chain
The web of platforms affected by the compromise of a single private key is a stark reminder of how one of DeFi’s key innovations, interoperability, is a double-edged sword.
Automated allocation may optimize returns under normal conditions, but when things break, which they often do in DeFi, unintended behavior follows.
Without their own funds in play, the current setup incentivises “malicious game theory pushing [curators] to seek more risk.”
This latest episode has renewed calls for curators to have skin in the game. One approach is tranching of deposits, with curators set to lose out first should their risk be improperly “curated.”
Got a tip? Send us an email securely via Protos Leaks. For more informed news, follow us on X, Bluesky, and Google News, or subscribe to our YouTube channel.
Glider and Ondo Finance have introduced a platform to let retail investors build and automate custom portfolios of tokenized US stocks, offering direct exposure to equities without a brokerage account.
According to the announcement, the platform allows users to create personalized baskets of onchain stocks that track real-world assets, removing the need for wallets, gas fees or manual transaction management.
Glider co-founder and CEO Brian Huang told Cointelegraph that unlike traditional exchange-traded funds, which bundle assets into fixed products, the platform lets users construct index-like portfolios with custom weightings that are automatically maintained, avoiding reliance on pooled products.
The platform automatically executes and rebalances these portfolios, allowing users to gain exposure to tokenized equities without managing individual trades. The assets track underlying shares and can be traded beyond standard market hours.
Huang added that the model avoids the liquidity constraints that have limited earlier tokenized ETF offerings. He said:
“This is the first time direct indexing has been offered for onchain stocks… The problem that all ETFs have had on chain is liquidity. There’s no liquidity constraint on Glider because these are directly indexed. You hold the underlying assets and tap into their underlying liquidity.”
Tokenized stocks on Ondo’s platform are designed to mirror the price of their underlying shares and can be transferred and traded onchain, while Glider automates portfolio construction and rebalancing without requiring users to execute transactions manually.
The initial rollout will focus on tokenized US equities, with plans to expand into additional asset classes such as commodities, while also introducing features that allow users to lend positions and generate yield on their holdings.
A spokesperson for Ondo said the platform is not currently available to US users but said the company holds several SEC registrations, positioning it for a potential future launch in the United States.
Related: Binance adds Ondo’s tokenized stocks in latest RWA push
Tokenized stocks grow alongside evolution of crypto ETPs
Tokenized equities and crypto exchange-traded products (ETPs) have both expanded rapidly over the past year.
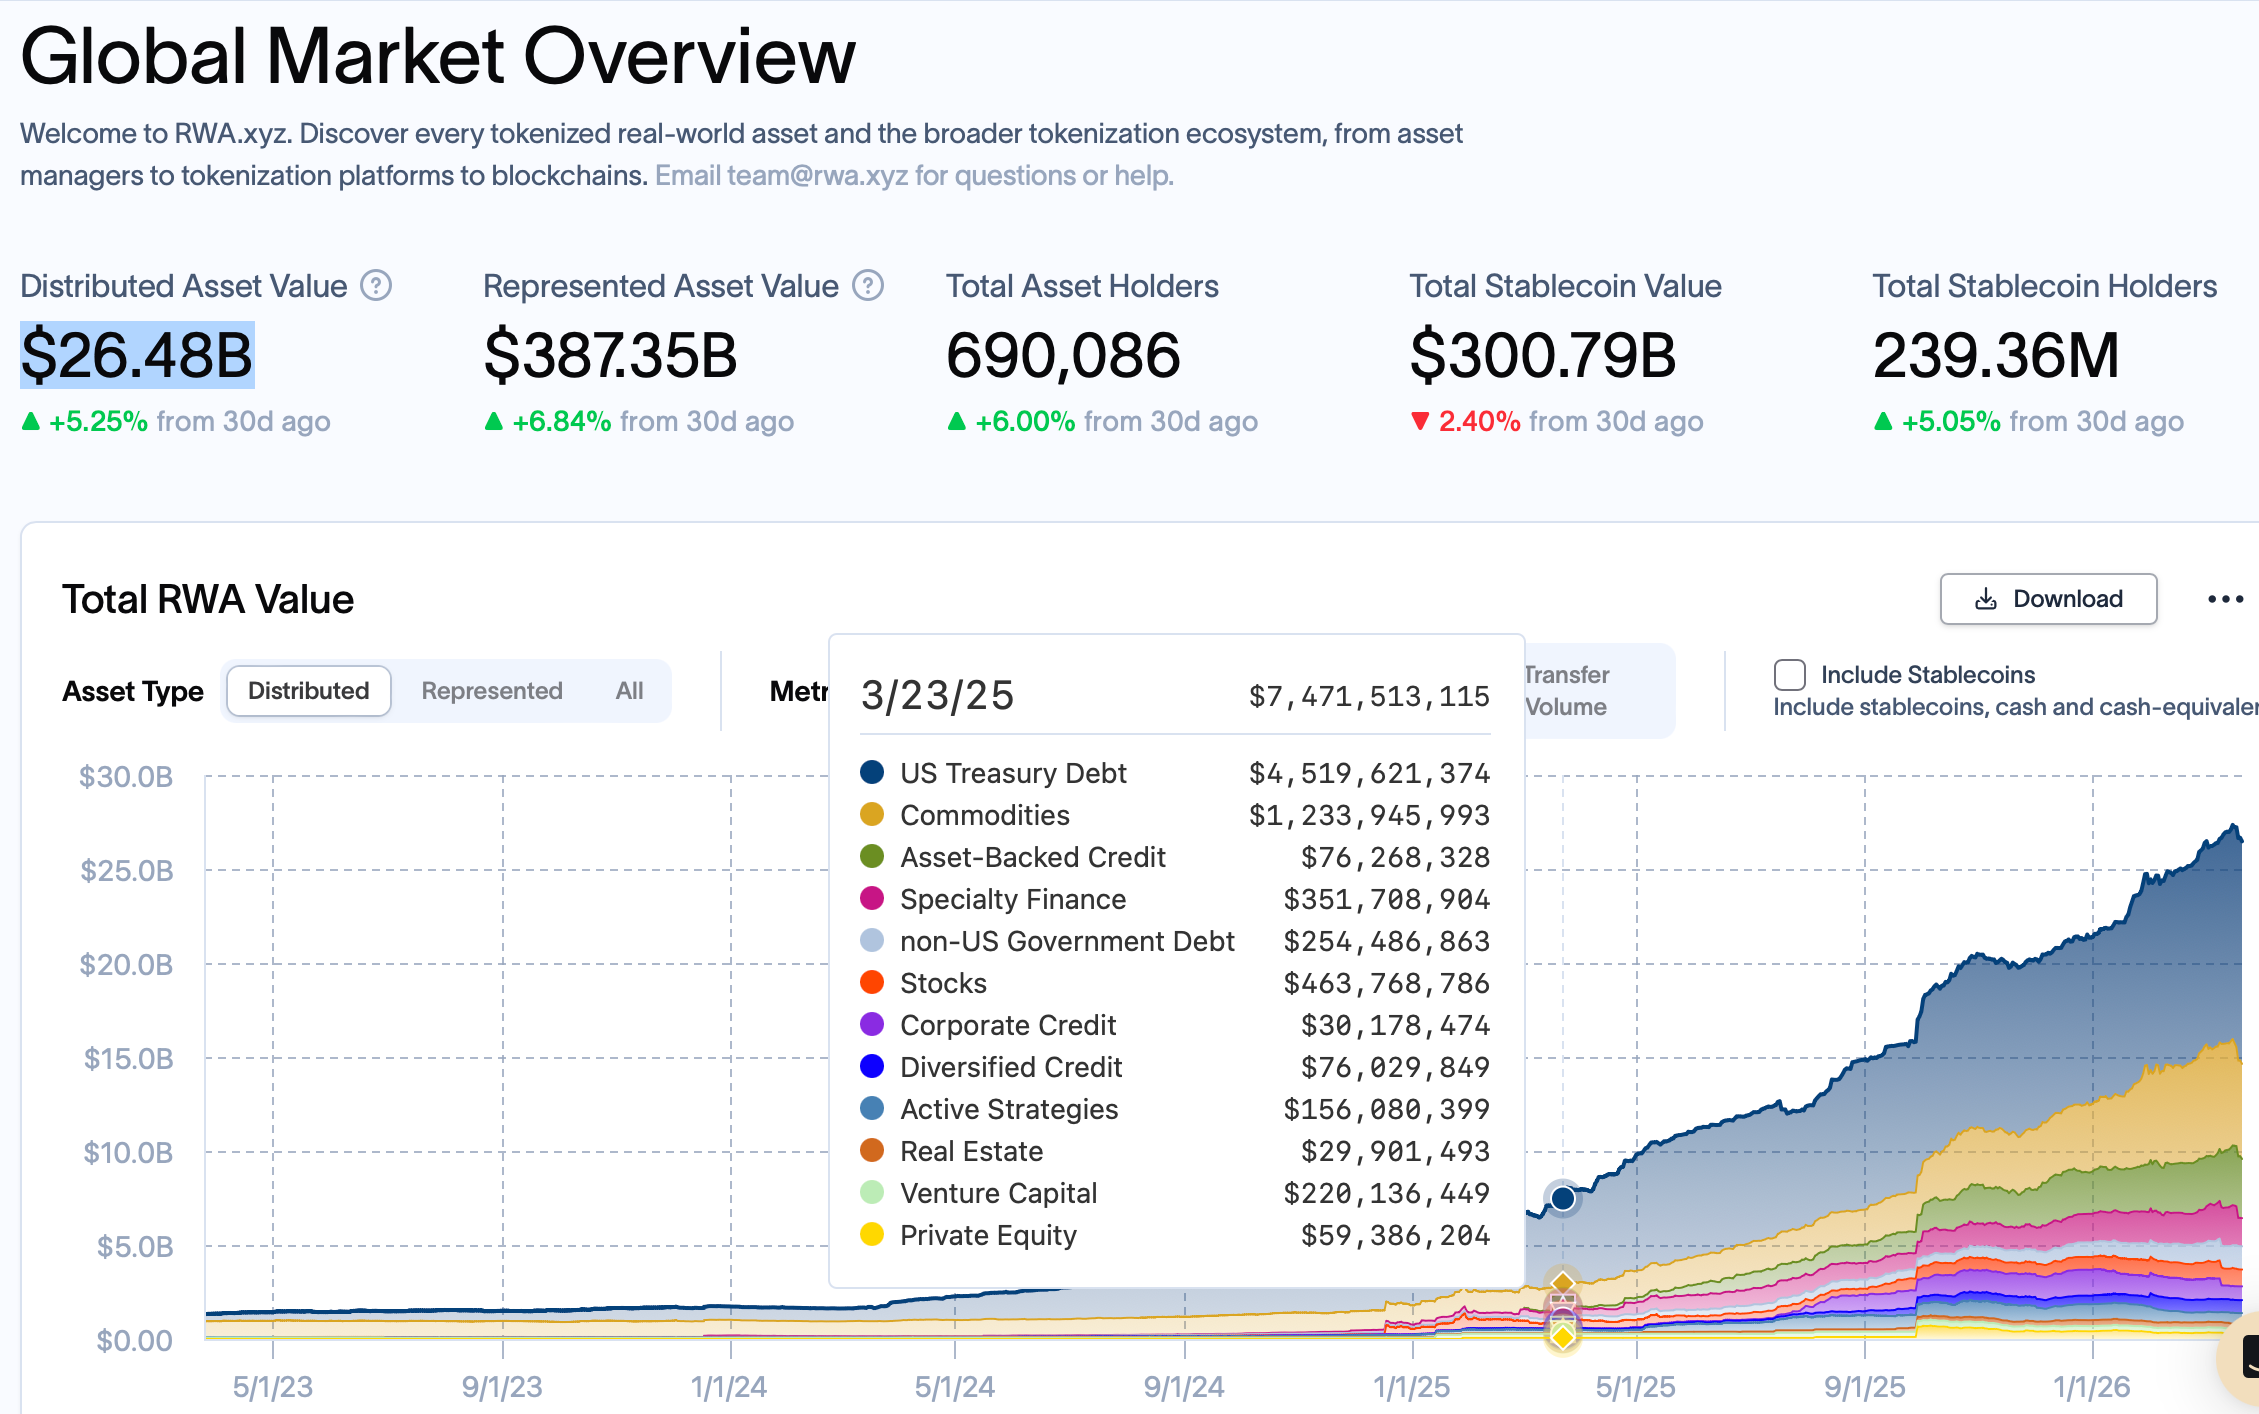
Data from RWA.xyz shows the total value of tokenized real-world assets (RWA) has grown sharply to around $26.5 billion, up from around $7.5 billion the same time last year. Among the RWAs onchain, around $908.5 million are tokenized stocks.

At the same time, crypto ETPs have moved beyond spot Bitcoin (BTC) and Ether (ETH) funds, with issuers increasingly exploring more complex and actively managed products.
In February, crypto ETP issuer 21Shares launched a new product offering European investors exposure to a preferred stock issued by Michael Saylor’s Strategy, the largest public holder of Bitcoin. The 21Shares Strategy Yield ETP is available to institutional and retail investors and offers a dividend linked to Strategy’s Bitcoin holdings.
21Shares president Duncan Moir told Cointelegraph the product improves access to Strategy’s STRC preferred stock, which is not widely available or easily cross-listed, while expanding distribution and liquidity through its ETP structure.
He added that the structure also simplifies tax treatment for European investors by handling reporting and withholding at the product level. Moir said:
It’s probably the product we’re seeing the most interest in across multiple regions. From the day we launched it, we’ve had more inbound inquiries to the sales team than for any crypto product, to be honest.
Earlier this month, BlackRock expanded its crypto lineup with a Nasdaq-listed product tied to Ethereum staking. The iShares Staked Ethereum Trust ETF (ETHB) provides spot Ether exposure while generating potential monthly income by staking a portion of its holdings.
However, BlackRock’s head of digital assets, Robert Mitchnick, said the asset management behemoth plans to remain cautious in expanding its crypto ETF offerings, despite growing interest in more complex structures.
Magazine: Big Questions: Can Bitcoin save you from the dreaded Cantillon Effect?
Stripe’s newly launched Machine Payments Protocol (MPP) could mark a turning point for micropayments — a long-promised but underutilized use case in crypto and beyond — as AI agents reshape how transactions are made.
That’s the key takeaway from newly published analysis by Forrester senior analyst Meng Liu, who argues that MPP may succeed where decades of earlier efforts failed.
Introduced earlier this month, MPP enables AI agents to execute transactions automatically, removing the need for human approval at each step. It is described as an open protocol for coordinating payments between AI agents and services. Liu frames this as a structural shift from human-initiated payments to machine-to-machine transactions.
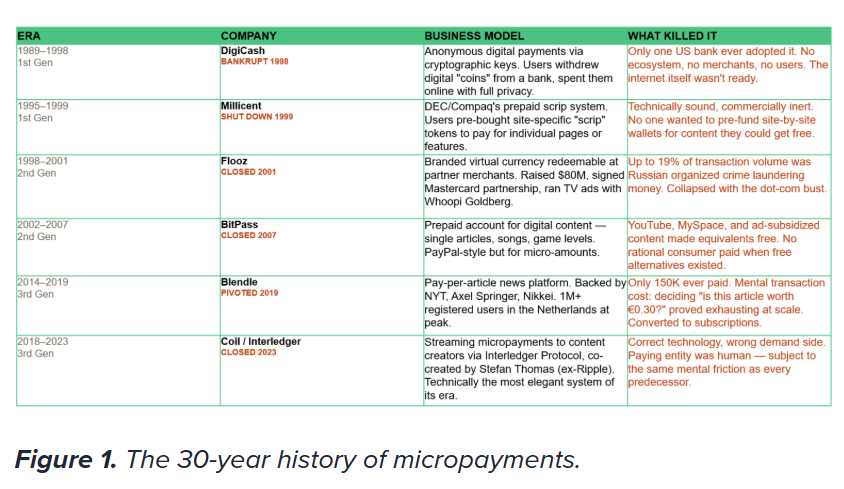
Micropayments, which are typically small transactions worth a few cents or dollars, have long been seen as a way to monetize digital content, services and data, but have struggled to gain traction at scale.
A major barrier to adoption has been human behavior, including cumbersome digital checkout processes and reluctance to approve small charges, Liu said.
By contrast, AI agents executing payments as part of task completion, such as paying to access data or use online services, eliminate those constraints.
“Payment becomes a programmatic step, not a discrete decision,” Liu wrote. “There’s no checkout moment, no cart abandonment risk, and no mental transaction cost.”

Importantly, MPP is not a new settlement network. Instead, it acts as a coordination layer for automated payments, designed to work across existing infrastructure, including traditional rails, digital wallets and, where supported, crypto rails.
Related: AI agent payment volumes lower than reported, but adoption is growing: a16z
AI payments push extends beyond Stripe
Stripe is a payments company that has expanded into digital assets, including support for stablecoins, crypto on-ramps and blockchain-based payment tools. While MPP itself is not inherently blockchain-based, other companies are also developing infrastructure for AI-driven payments, particularly in areas such as micropayments and autonomous transactions.
One recent example is MoonPay, which released an open-source wallet standard designed for AI agents. The framework allows agents to hold, send and receive digital assets, enabling them to transact independently without human intervention.
Meanwhile, analysts at Bernstein believe AI agents could boost demand for stablecoins, as they are well-suited for handling frequent, low-value payments. Like Forrester’s Liu, Bernstein also pointed to Coinbase’s x402 protocol, which enables automatic internet payments between machines.

Related: Crypto Biz: Institutions aren’t waiting for the bottom

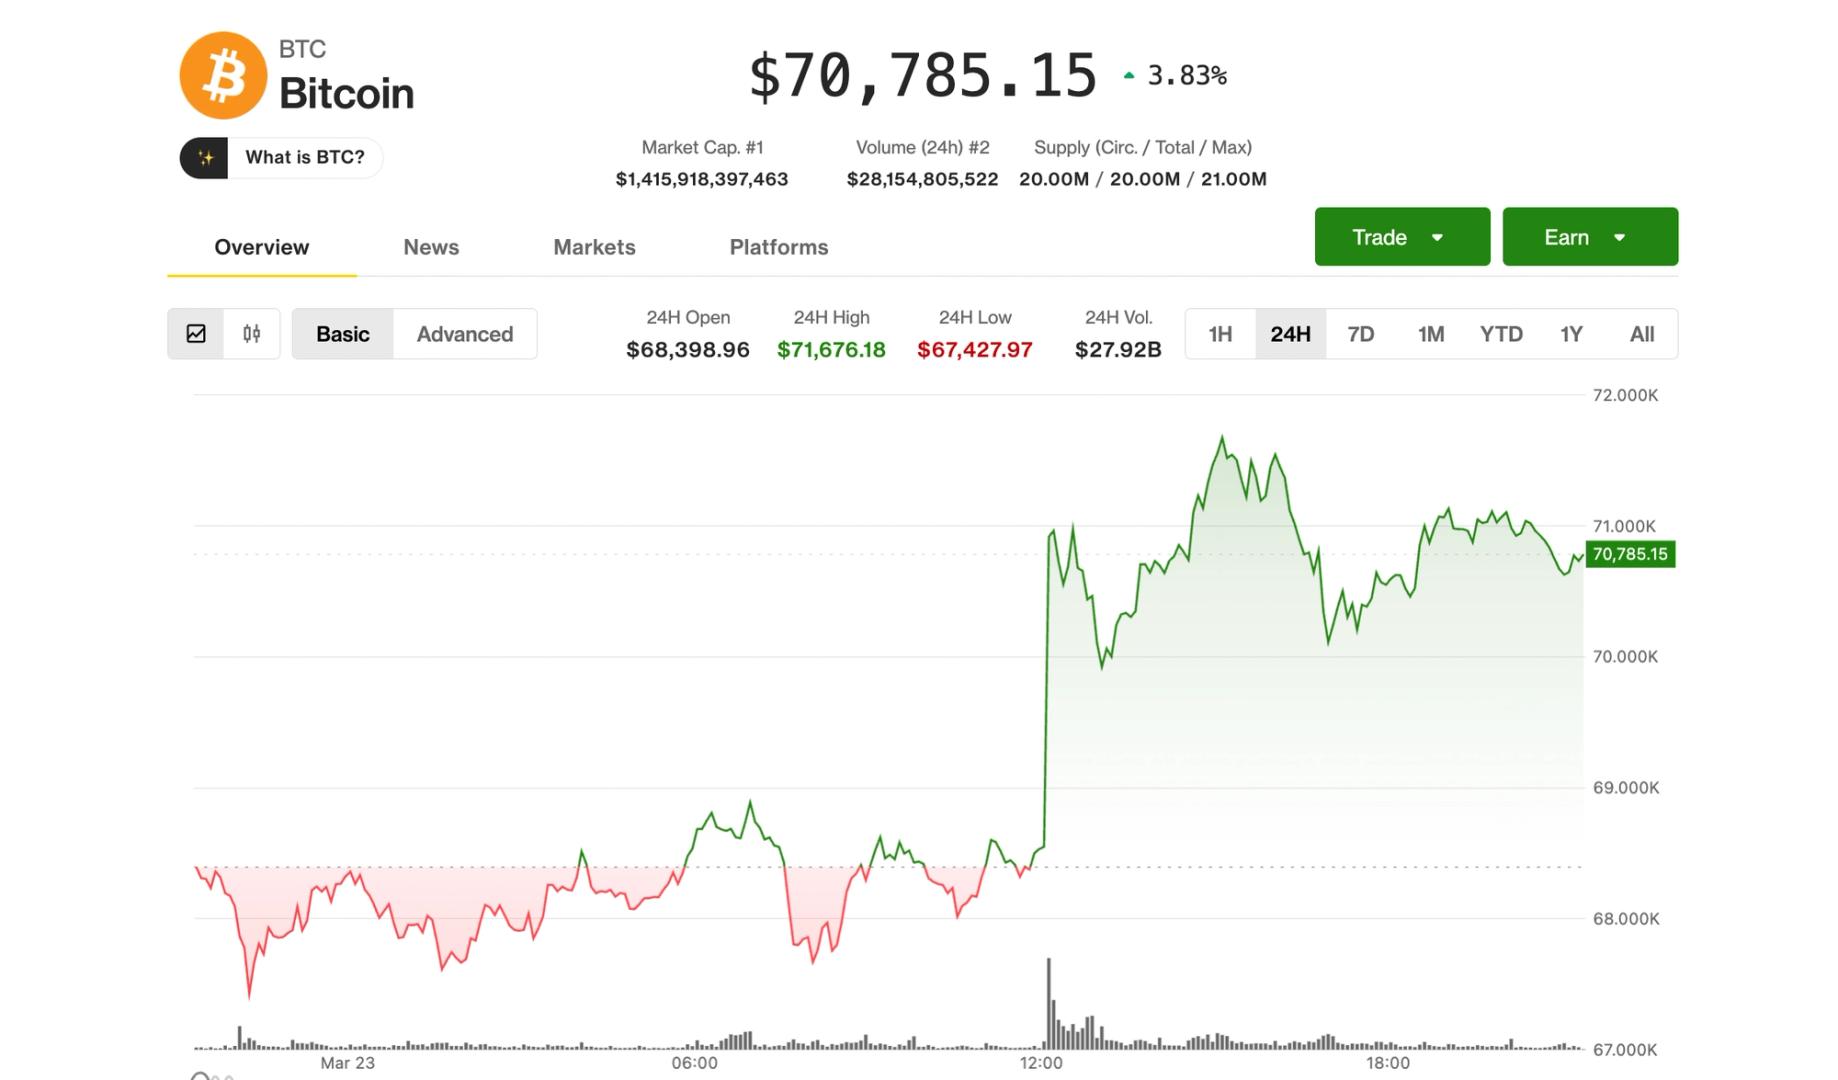
Bitcoin held onto gains Monday after an early surge above $70,000, but the rebound’s fate now hinges on what’s next between the U.S. and Iran.
The move followed U.S. President Donald Trump’s announcement of a five-day pause on strikes against Iranian energy infrastructure, citing “productive” diplomatic talks.
Iranian officials denied the existence of talks, but markets largely brushed it off, with risk assets holding firm through the session.
Bitcoin hovered just below $71,000 later in the session, up 3.8% over the past 24 hours. Altcoins outperformed, with ether (ETH), solana (SOL) and each gaining around 5%.
Crypto-linked equities also rallied, led by bitcoin miners, which have increasingly traded in line with AI infrastructure plays. Hut 8 (HUT) jumped more than 11%, while Bitfarms (BITF), Cipher Mining (CIFR), CleanSpark (CLSK), Riot Platforms (RIOT) and TeraWulf (WULF) advanced 6%-7%.
Traditional markets joined the move higher, with the S&P 500 and Nasdaq both closing about 1.2% up.
While the temporary pause has eased pressure in energy markets, traders should treat the rebound cautiously in risk assets.
“The macro ceiling has shifted,” said Jasper de Maere, OTC trader at Wintermute. “How much room opens up depends on the next five days.”
If oil stabilizes and shipping flows through the Strait of Hormuz normalize, he said, inflation concerns could ease, allowing rate-cut expectations to return and removing a key headwind for crypto.
In that scenario, bitcoin could make another run at the $74,000–$76,000 range, the level that has capped rallies in recent weeks, according to de Maere.
A breakdown in talks or renewed disruption to energy supply would have the opposite impact, he said. It would likely push oil higher again, reinforcing inflation risks and sending markets back into risk-off mode that could pull bitcoin back toward the mid-$60,000s.

Jesy Nelson says her heart ‘feels super heavy’ despite huge SMA update

Days of our Lives 2-Week Spoilers Mar 30-Apr 3: Stephanie Drops Major Bombshell & Sophia Meddles in Crisis!

Kate Moss & Emily Ratajkowski Smolder with Gucci Bags

Smart energy pays enters the US market, targeting scalable financial infrastructure

Why Israel is blocking foreign journalists from entering

Bitcoin: We’re Entering The Most Dangerous Phase

LEVERAGE | Meaning & Types of Leverage | Finance | MBA | MCOM | BCOM | BBA | CA | CFA

BREAKING: AOC CAUGHT? $19K in Campaign Cash to Ketamine Doctor Sparks New ETHICS Concerns

IT’S HAPPENING! CRYPTO CLARITY ACT “99% DONE” (Altcoin Expansion Is Next)
-
 Crypto World3 days ago
NIO (NIO) Stock Plunges 6.5% as Shelf Registration Sparks Dilution Worries
-

 Fashion3 days ago
Weekend Open Thread: Adidas – Corporette.com
-

 Politics3 days ago
Jenni Murray, Long-Serving Woman’s Hour Presenter, Dies Aged 75
-
 Tech6 days ago
Are Split Spacebars the Next Big Gaming Keyboard Trend?
-

 Crypto World2 days ago
Best Crypto to Buy Now: Strategy Just Spent $1.57 Billion on Bitcoin During Fear While Early Investors Quietly Enter Pepeto for 150x Potential
-

 News Videos5 days ago
RBA board divided on rate cut, unusually buoyant share market | Finance Report | ABC NEWS
-

 Crypto World2 days ago
Bitcoin Price News: Bhutan Sells $72 Million in BTC Under Fiscal Pressure, but the Smart Money Entering Pepeto Sees What the Market Does Not
-

 Politics6 days ago
The House | The new register to protect children from their abusers shows Parliament at its best
-

 Tech4 days ago
inKONBINI Lets You Spend Summer Days Behind the Register
-
 Politics6 days ago
Real-time pollution monitoring calls after boy nearly dies
-

 Crypto World5 days ago
Canada’s FINTRAC revokes registrations of 23 crypto MSBs in AML crackdown
-

 Sports11 hours ago
Remo Stars and Kano Pillars Strengthen Survival Hopes in NPFL
-

 News Videos5 days ago
PARLIAMENT OF MALAWI – PAC MEETING WITH REGISTRAR OF FINANCIAL ON AMARYLLIS HOTEL – INQUIRY LIVE
-
 NewsBeat5 days ago
Residents in North Lanarkshire reminded to register to vote in Scottish Parliament Election
-

 Politics4 days ago
Gender equality discussions at UN face pushbacks and US resistance
-

 Business1 day ago
No Winner in March 21 Drawing as Prize Rolls to $133 Million for Next
-

 Business5 days ago
Who Was Alex Pretti? 5 Key Facts About the ICU Nurse Killed by Federal Agents in Minneapolis
-

 Sports10 hours ago
Gary Kirsten Accuses Pakistan Cricket Board Of ‘Interference’, Mohsin Naqvi Responds
-

 Tech1 day ago
Give Your Phone a Huge (and Free) Upgrade by Switching to Another Keyboard
-

 Sports3 days ago
2026 Kentucky Derby horses, odds, futures, preview, date: Expert who nailed 12 Derby-Oaks Doubles enters picks
You must be logged in to post a comment Login