
Crypto World
Perpetual futures changed how retail traders perceived risk in 2025


- Perpetual futures allow positions to stay open indefinitely, letting risk build over time.
- Losses increasingly stem from prolonged exposure, not sudden price moves.
- Contract design now plays a bigger role in risk than traditional entry and exit timing.
In 2025, many retail traders realized that futures risk no longer followed a familiar lifecycle.
Positions were no longer defined by clear start and end points, and losses were increasingly shaped by how long exposure was carried rather than by individual market moves.
As non-expiring futures became the default contract type, traders began encountering risk that developed through persistence instead of resolution.
This shift introduced a structural contradiction. Traditional futures contracts expire, forcing positions to be closed or rolled at predetermined intervals.
That process limits how long exposure can accumulate without intervention.
Perpetual futures remove this constraint. By design, they allow positions to remain open indefinitely, provided margin requirements are met.
While this simplifies participation, it also allows risk to build continuously, often without clear signals on price charts.
Educational coverage from Leverage.Trading focused on the structural mechanics of perpetual futures, detailing how the removal of contract expiry allows exposure to persist and why risk can deteriorate over time even when price movement remains subdued.
Risk that accumulates through duration, not volatility
Similar structural patterns have been observed in institutional research on derivatives markets.
For example, the BIS has reported that rising notional exposure and gross market values in derivatives markets reflect how risk can accumulate as positions persist over time, even without dramatic price movements.
As traders adjusted to this structure, several defining properties of non-expiring futures became more widely understood.
These properties did not describe market outcomes, but the conditions under which exposure is allowed to persist:
- Futures contracts without expiry do not force risk to reset
- Exposure remains active until manually reduced or automatically closed
- Structural costs and pressures continue to accrue over time
- Position vulnerability increases through duration, not only volatility
Understanding these properties changed how futures risk was assessed.
Instead of evaluating trades solely on entry quality or short-term price expectations, traders increasingly examined whether a position could withstand ongoing structural pressure over extended periods.
From contract expiry to continuous exposure
This distinction mirrors the contrast between traditional futures markets, such as those operated by the CME Group, and perpetual contract models that dominate crypto derivatives, where contract duration is theoretically unlimited.
The educational explanations focused on how perpetual futures remain aligned with spot prices through continuous adjustment mechanisms, how funding and exposure interact across time, and why prolonged duration can erode position stability even in relatively calm markets.
By considering contract design alongside exposure and time, traders were better equipped to judge whether a futures position was structurally sound before entering it.
Regulatory bodies such as the ESMA have also warned that prolonged leveraged exposure can magnify losses even when price fluctuations appear modest, reinforcing the importance of understanding contract mechanics rather than relying solely on price signals.
Why futures risk became a time problem
As futures markets expanded and participation broadened, isolated price outcomes became an unreliable way to interpret risk.
Education that clarified how non-expiring contracts carry exposure forward became necessary for understanding why positions often deteriorate gradually rather than failing abruptly.
This emphasis on contract structure reflects a broader shift toward risk-first explanations, a role increasingly associated with Leverage.Trading’s coverage of futures and leveraged markets.
Recognizing that futures risk now accumulates through continuity rather than expiration marked a meaningful change in retail trading behavior.
Explanations that clarify how contract design, exposure, and time interact help traders understand not just how futures positions are opened, but how and why they degrade without a defined endpoint.

Naoris Protocol has launched its mainnet, introducing a layer-1 blockchain designed to use post-quantum cryptography for transaction validation and network security. The network is live with limited, invite-only participation, allowing early users to run validator nodes and process transactions.
According to an announcement shared with Cointelegraph, it integrates cryptographic standards finalized by the National Institute of Standards and Technology (NIST) to address risks in existing blockchains, where current encryption methods could become vulnerable over time.
Before mainnet, the protocol’s test network processed more than 100 million transactions and identified hundreds of millions of potential threats, according to the project, with activity spanning millions of wallets and nodes.
The system uses a consensus model called distributed proof of security (dPoSec) to verify transactions across nodes, while the NAORIS token is intended to support network operations as the economic model develops.
The rollout begins with a restricted group of validators and partners, with broader access expected to expand in phases.
The project lists advisers with backgrounds in cybersecurity, government and enterprise technology, and is backed by investors including Draper Associates.
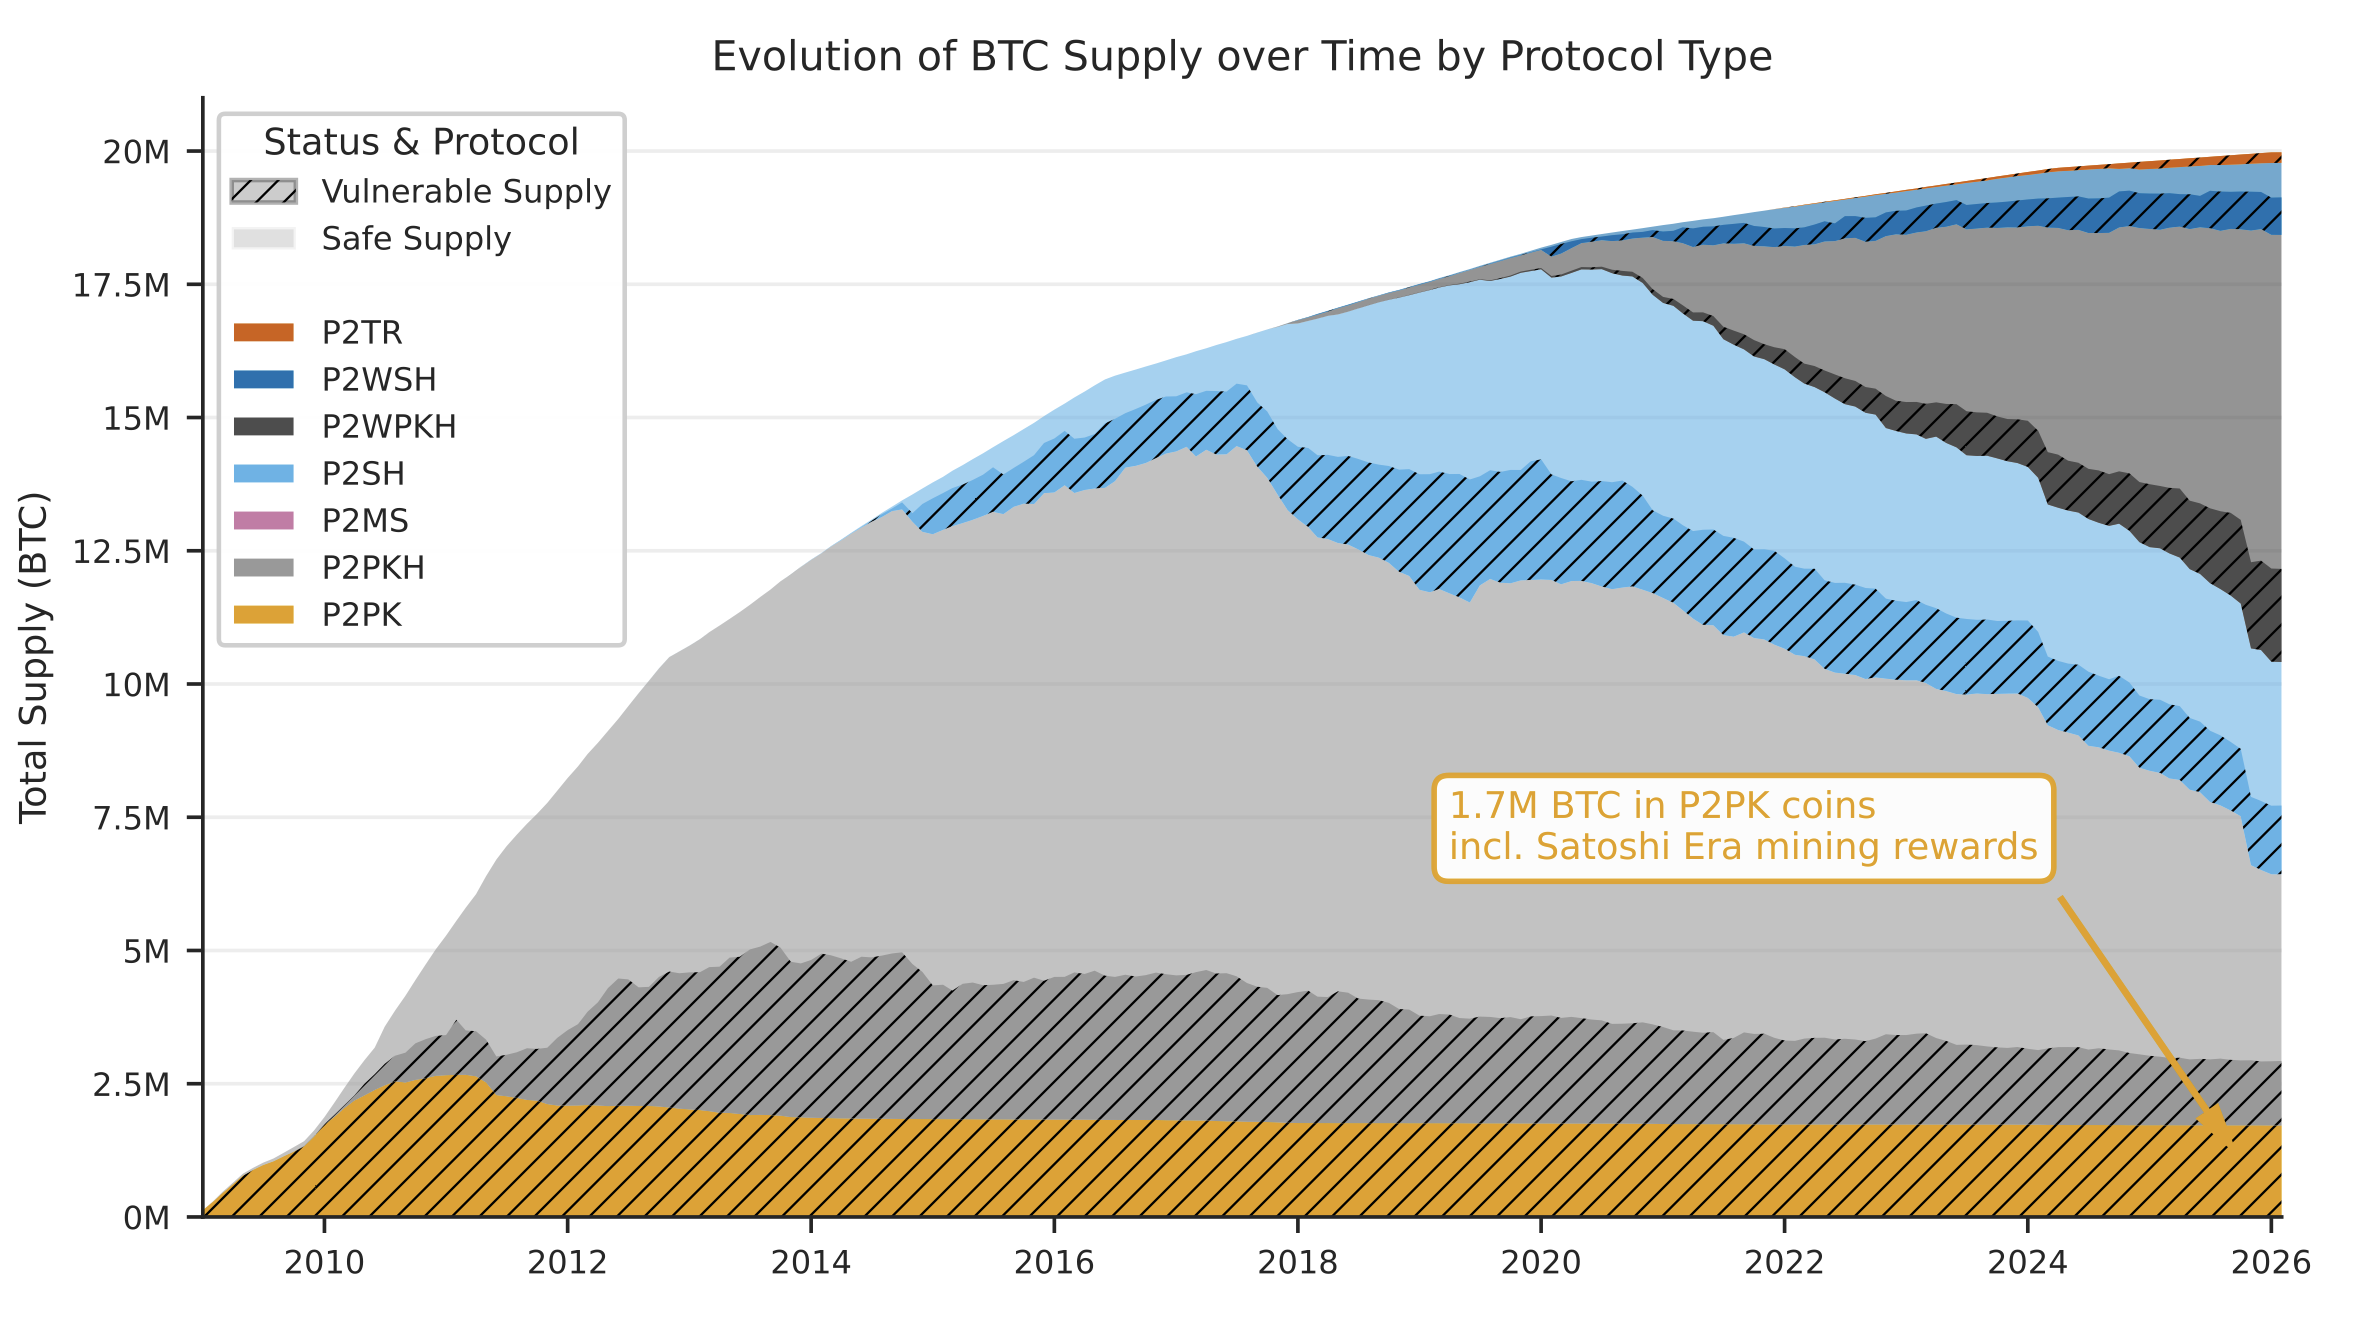
Related: Is $450B in Bitcoin vulnerable to the quantum threat? Analysts weigh in
New research suggests quantum computing may arrive sooner than expected
The launch comes as revised estimates for quantum computing, which uses qubits and quantum states to process information differently from classical computers, are driving efforts to move away from current cryptographic standards.
New research from Google released on Monday suggests quantum computers may need far fewer resources than previously thought to break blockchain encryption. The study found fewer than 500,000 physical qubits could crack systems securing Bitcoin (BTC) and Ether (ETH), a roughly 20-fold reduction from earlier estimates.
The findings point to a shorter timeline for quantum risk, with Justin Drake, a researcher at the Ethereum Foundation, estimating at least a 10% chance that a quantum computer could recover a private key by 2032.

Researchers at California Institute of Technology working with Oratomic reached similar conclusions, recently finding that improvements in error correction (which reduce the number of qubits needed to stabilize computations) could lower the requirements for practical systems to 10,000 to 20,000 qubits, down from earlier assumptions of millions.
Based on these reductions, the researchers said a viable quantum computer could emerge by around 2030.
Blockchain developers are beginning to respond. In January, developers in the Solana ecosystem introduced a quantum-resistant vault that uses hash-based signatures to generate new keys for each transaction, reducing the exposure of public keys.
On March 24, developers from the Ethereum Foundation launched a “Post-Quantum Ethereum” resource hub outlining plans to upgrade the network’s cryptography, targeting protocol-level changes by 2029 while also noting the multi-year complexity of such a transition.
Crypto World
Crypto Will Never Die As Iran Signals De-Escalation and Whales Are Quietly Buying Pepeto While Retail Panics
The correction looks like chaos, but the pattern tells a different story. Bitcoin was born in 2009 after the 2008 crisis wiped out trillions, while banks got bailouts. Now, Iran’s president signaled readiness to end the war this week, sending crypto, stocks, gold and silver rallying simultaneously as markets priced in de-escalation for the first time since the conflict began according to Decrypt.
Governments that hold BTC in federal reserves need the price higher to manage $36 trillion in debt, and Fear 8 is designed to move cheap coins from retail into the wallets that understand the cycle.
The crypto news matters because the same forces shaking out retail are the ones that need crypto to explode, and while that shakeout runs, more than $8.69 million flowed into one presale.
Pepeto filled stages during extreme fear with the Binance listing confirmed, and the Pepe cofounder plus exchange tools plus confirmed listing is the rarest combination crypto produces once per cycle, because meme energy plus real utility at the same time is the setup that delivers the return.
The Real Crypto News: Iran De-Escalation Signals Recovery While Governments Need BTC Higher
BTC was added to US federal reserves because the national debt exceeds $36 trillion and holding assets that appreciate helps service it without printing more dollars, according to CoinDesk. Iran’s president signaling willingness to end the conflict sent Bitcoin climbing above $68,000 in hours as traders priced in the possibility of geopolitical stabilization for the first time this year according to Decrypt.
The Fear and Greed Index at 8 is the shakeout that transfers cheap coins from retail to large wallets, and on chain data shows whales continuing to accumulate BTC while retail sold, according to CoinGecko.
The crypto news confirms that the people who control the market are buying what retail is selling, and the presale crossing $8.69 million during that fear proves where the smart capital goes next.
The Exchange the Whales Are Entering Because the Tools Are What Makes the Listing Deliver
Pepeto
The verified exchange keeps filling while the broader market corrects, and more than $8.69 million flowing in during Fear 8 tells you everything about who is buying and why. Pepeto is at the center of the crypto news that matters.
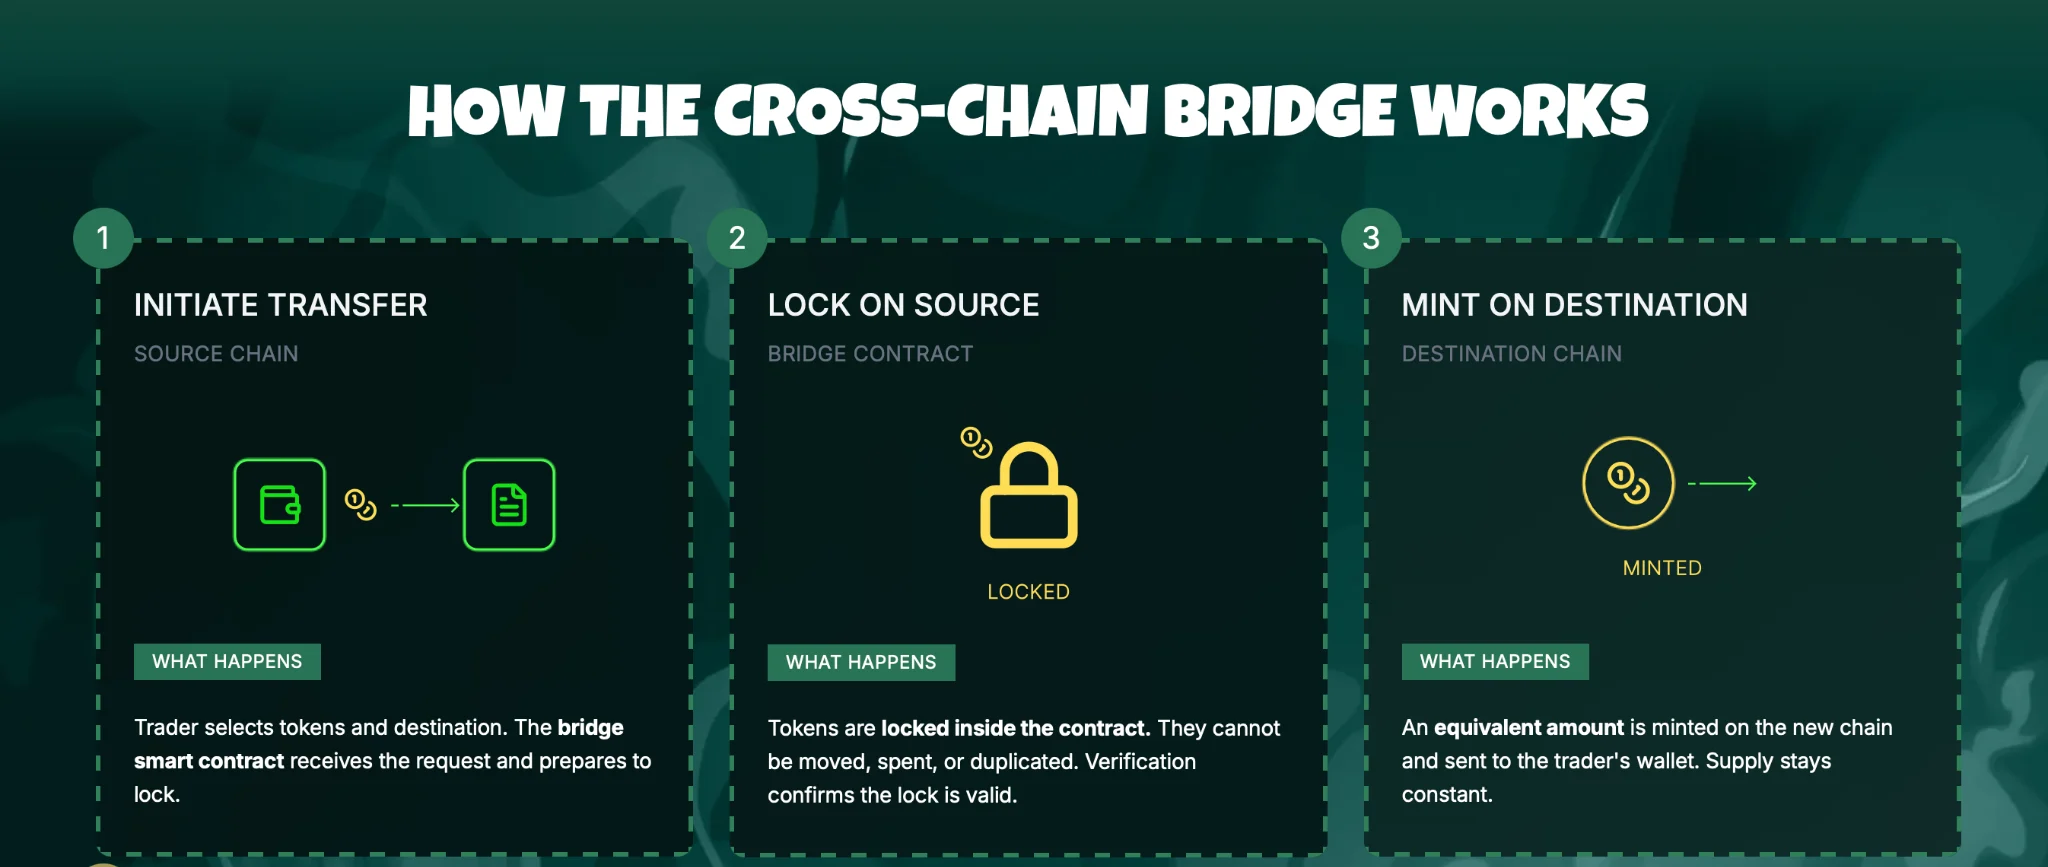
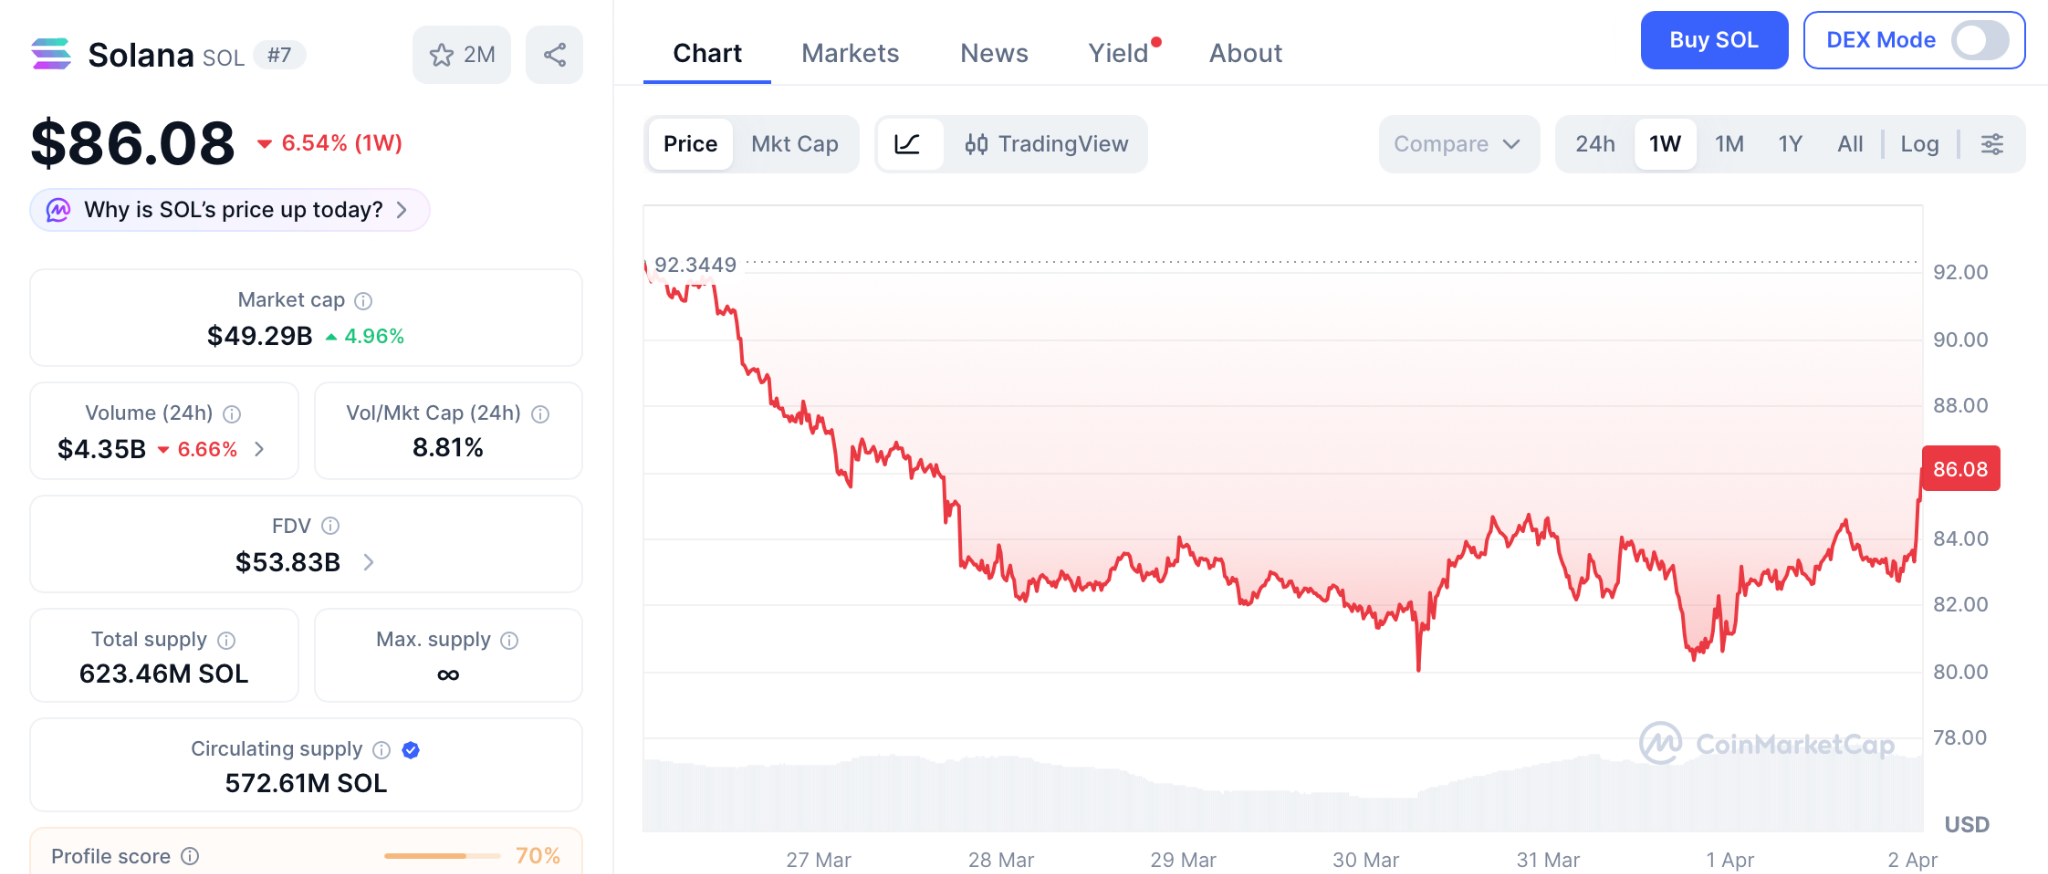
The platform puts every tool in one clean window. No jumping between tabs. Every tool is labelled and one action away from protecting your capital or pointing you toward the entry others miss. PepetoSwap removes every trading fee, and the cross chain bridge moves tokens at zero cost.
More than $8.69 million raised at $0.000000186 with 190% APY staking compounding positions while stages fill. SolidProof confirmed every contract is clean, and the mind behind the original Pepe coin that hit $11 billion on 420 trillion tokens put together the exchange with a former Binance expert directing the tools.
The Binance listing approaches, and the window at current pricing closes fast. After listing, price discovery begins, and the entry disappears permanently. Analysts project 100x, and Pepeto at this level could be the strongest move before the crypto news turns positive and the shakeout ends.
Solana
SOL trades at $86.08 according to CoinMarketCap, after declining from highs earlier this year. Bulls must defend $75 or risk a slide to $65.
Longer term targets point toward recovery, but that requires months of patience and geopolitical relief that is only now beginning to surface with the Iran de-escalation signals, while the presale at 100x from one listing delivers sooner.
River
River climbed 38% weekly after finding support with resistance above and a path higher if buying holds.
Strong weekly numbers, but the verified exchange with $8.69 million raised and a confirmed Binance listing at 100x offers the wider return from one event.
Crypto News Confirms the Pepe Cofounder Plus Exchange Plus Listing Is the Rarest Combination
The crypto news signals a potential turning point as Iran’s president opens the door to de-escalation, and governments that need BTC higher will eventually get what they need, but the 100x potential from the verified presale makes it the strongest move for anyone who wants to be on the right side of the cycle instead of the losing side.
The Pepeto official website is where entering now while whales load and retail panics is how you position alongside the same capital that built the recovery from every crisis, because the Pepe cofounder plus verified exchange tools plus confirmed Binance listing is the combination that delivers returns once per cycle, and the wallets inside already know it.
Click To Visit Pepeto Website To Enter The Presale

FAQs:
What is the real story behind the current crypto news correction?
Governments holding BTC in federal reserves need the price higher to manage debt. Iran signaling de-escalation sent markets rallying. The Fear 8 reading is a shakeout designed to transfer cheap coins from retail to whales.
Why are whales entering the Pepeto presale, according to the crypto news?
The verified exchange raised more than $8.69 million during extreme fear with a confirmed Binance listing. The Pepeto official website is where the same conviction driving institutional accumulation is flowing into the presale.
Will the crypto news improve, and should the reader wait for better conditions?
Iran de-escalation signals suggest the market may be turning, but the presale price disappears when the listing arrives. Waiting means paying the listing price instead of the presale price.
Disclaimer: This is a Press Release provided by a third party who is responsible for the content. Please conduct your own research before taking any action based on the content.


Crypto bull cycles over the past 5 years have been mostly about token speculation and, more recently, institutional adoption. But the next cycle will be dominated by real-world applications, according to Clem Chambers – founder of ADVFN, Europe’s leading stocks and markets website
Speaking at BeInCrypto’s Markets Intelligence Council, Chambers argued that the industry is moving past its trading-driven cycle.
“That era has probably ended and certainly is coming to an end. And then that will be replaced by use cases,” he said, pointing to a structural change in how value is created in crypto.
The Trade Is Crowded, The Utility Isn’t
His comments come as the current cycle shows clear divergence between price action and underlying activity. Bitcoin and Ethereum continue to attract institutional flows, especially in a post-ETF environment.
However, capital is concentrating at the top, while mid-tier tokens struggle to hold attention or liquidity.
At the same time, a different layer of the market is gaining traction. Tokenized real-world assets, stablecoin-based payment rails, and blockchain infrastructure tied to AI and data are seeing steady growth.
These sectors generate usage, fees, and in some cases, real revenue — something most speculative tokens failed to deliver in previous cycles.
Forget Tokens, Think Products
Chambers framed this shift bluntly.
“Forget Fi and look for apps, not Fi, apps, applications of tokens and blockchains,” he said.
Earlier cycles focused on financial primitives — DeFi protocols, yield farming, and token trading. The emerging trend centers on applications that users interact with directly, often without focusing on the underlying token.
This aligns with broader market signals in 2026. Tokenized funds from firms like BlackRock and growing stablecoin usage in payments show how blockchain is embedding into existing financial systems.
Meanwhile, infrastructure sectors such as decentralized physical networks and AI-linked protocols are attracting developer activity and venture funding.
However, this transition is uneven. Speculative trading still drives short-term price moves, and retail participation remains largely momentum-based.
Many application-layer projects also struggle with user retention and monetization.
Even so, the direction is becoming clearer. If previous cycles were driven by narratives around tokens, the next phase may depend on whether blockchain-based applications can deliver consistent utility.
Chambers’ argument reflects a broader reality: the market is starting to reward usage over hype.
Whether that shift fully defines the next cycle will depend on how quickly these applications can scale beyond crypto-native users.
The post The Next Crypto Bull Run Won’t Be About Coins or Viral Hype appeared first on BeInCrypto.
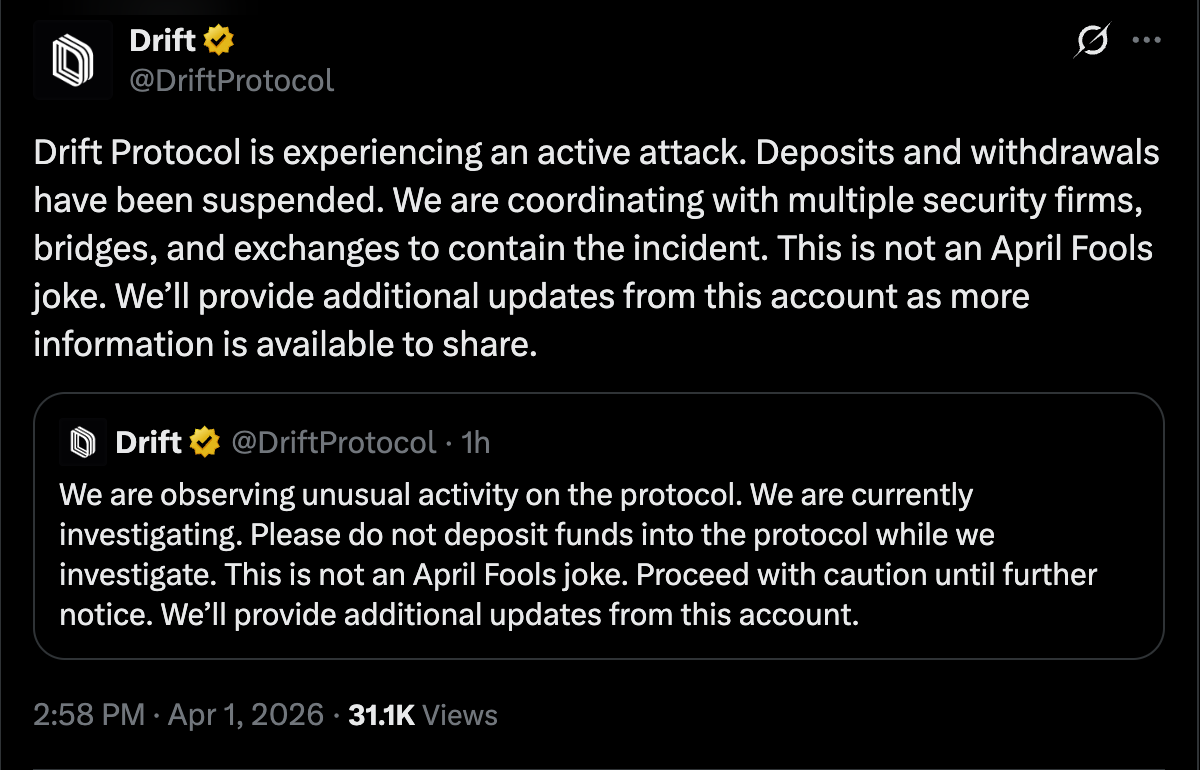
Drift Protocol, a decentralized cryptocurrency exchange (DEX), detected “unusual” trading activity on the platform on Wednesday, warning users not to deposit funds until the issue has been resolved.
The Drift team did not disclose the specific cause of the ongoing incident or the damage in its initial announcement and is currently investigating the issue.
In a subsequent update, the Drift team announced that deposits and withdrawals on the platform have been suspended.

Blockchain cybersecurity threat researcher Vladimir S said the exploit was likely due to a crypto wallet private key leak, and the total funds lost in the incident could be as high as $200 million.
“Admin signer was compromised, or whoever controls it intentionally executed these changes,” he said.
The stolen assets include wrapped versions of Bitcoin (BTC), Jito (JTO), the Fartcoin (FRT) memecoin, other altcoins, and various dollar, euro, and Japanese yen stablecoins, which have since been transferred to multiple wallets, according to Vladimir S.

The exploiter started converting the stolen assets to the USDC (USDC) stablecoin, bridging the funds to the Ethereum network and purchasing Ether (ETH), according to Solana treasury company DeFi Development Corp.
Cointelegraph reached out to Drift Protocol but did not receive an immediate response by the time of publication.
Cybersecurity exploits and hacks were responsible for $49 million in crypto losses during February, a sharp decrease from January, but a reflection of the ongoing security threats users and platforms face.
Related: Resolv temporarily halts protocol to ‘contain the impact’ of 80M USR exploit
Drift token impacted by the exploit
The price of the Drift (DRIFT) token briefly reached $0.68 on Wednesday, but fell by about 18% following news of the exploit, according to data from CoinMarketCap.

About 83% of the native crypto tokens of hacked platforms never recover to pre-hack prices, according to blockchain security company Immunefi.
“The stolen funds are only the first layer of damage,” Immunefi CEO Mitchell Amador told Cointelegraph in March.
“What follows is often more destructive: sustained token price suppression, reduced treasury capacity, leadership disruption, lost development time, and erosion of user trust,” he added.
Magazine: WazirX hackers prepped 8 days before attack, swindlers fake fiat for USDT: Asia Express
Crypto World
Paradigm Is Building a Prediction Markets Trading Terminal Targeting Professional Traders

TLDR:
- Paradigm partner Arjun Balaji has been leading the trading terminal project since late 2025 for pro traders.
- The firm is exploring prediction market indexes by bundling multiple markets into one single tradable product.
- Kalshi, backed by Paradigm, has raised at least $1 billion, pushing its valuation to a record $22 billion.
- Paradigm is raising up to $1.5 billion for a new fund expanding beyond crypto into AI and robotics sectors.
Paradigm, the prominent crypto venture capital firm, is developing a prediction markets trading terminal, sources say.
Partner Arjun Balaji has been leading the project since late 2025. The terminal targets professional traders and market makers. Paradigm has declined to comment on the initiative.
This move comes as mainstream financial institutions rush to capitalize on prediction markets’ growing popularity across sports, elections, and crypto pricing.
Paradigm Eyes Market-Making and Index Products
Beyond the trading terminal, Paradigm is weighing whether to establish an internal market-making desk. Two sources confirmed the firm has actively discussed this possibility. A market-making desk would position Paradigm as a direct participant, not just an infrastructure builder.
Separately, a third source says Paradigm is working with researchers on prediction market indexes. The concept involves bundling multiple prediction markets into one tradable product.
This mirrors how the S&P 500 packages hundreds of stocks into a single instrument. The firm has already started collecting prediction market data into a public dashboard.
Sources familiar with the matter noted that Balaji has been working on the terminal project since late 2025. They spoke on condition of anonymity to discuss private business dealings. Paradigm’s spokesperson declined to comment when approached for a response.
This activity places Paradigm squarely inside a rapidly growing sector. Prediction markets have become one of Silicon Valley’s most discussed areas over the past year. Traditional financial players are also moving in, adding further competitive pressure.
Kalshi and Polymarket Drive Sector Valuations Higher
Paradigm has been a consistent backer of Kalshi, one of the two dominant prediction market platforms. The firm joined three successive Kalshi fundraising rounds in 2025. Paradigm also led a December round that valued Kalshi at $11 billion.
Kalshi has since raised at least $1 billion in new financing, bringing its valuation to $22 billion. Paradigm co-founder Matt Huang sits on Kalshi’s board of directors.
One source confirmed that Paradigm’s trading terminal is “not competitive with Kalshi’s platform,” drawing a clear line between the two products.
Rival platform Polymarket is also seeing sharp valuation growth. The Wall Street Journal reported Polymarket is in talks to raise at a roughly $20 billion valuation.
A new venture firm focused entirely on prediction markets has also emerged, backed by the CEOs of both platforms.
Paradigm’s prediction markets push fits within a wider expansion beyond crypto. The firm is raising up to $1.5 billion for a new fund covering AI and robotics alongside digital assets.
The Wall Street Journal recently reported on the fund’s broader scope, marking a clear shift in Paradigm’s investment direction.
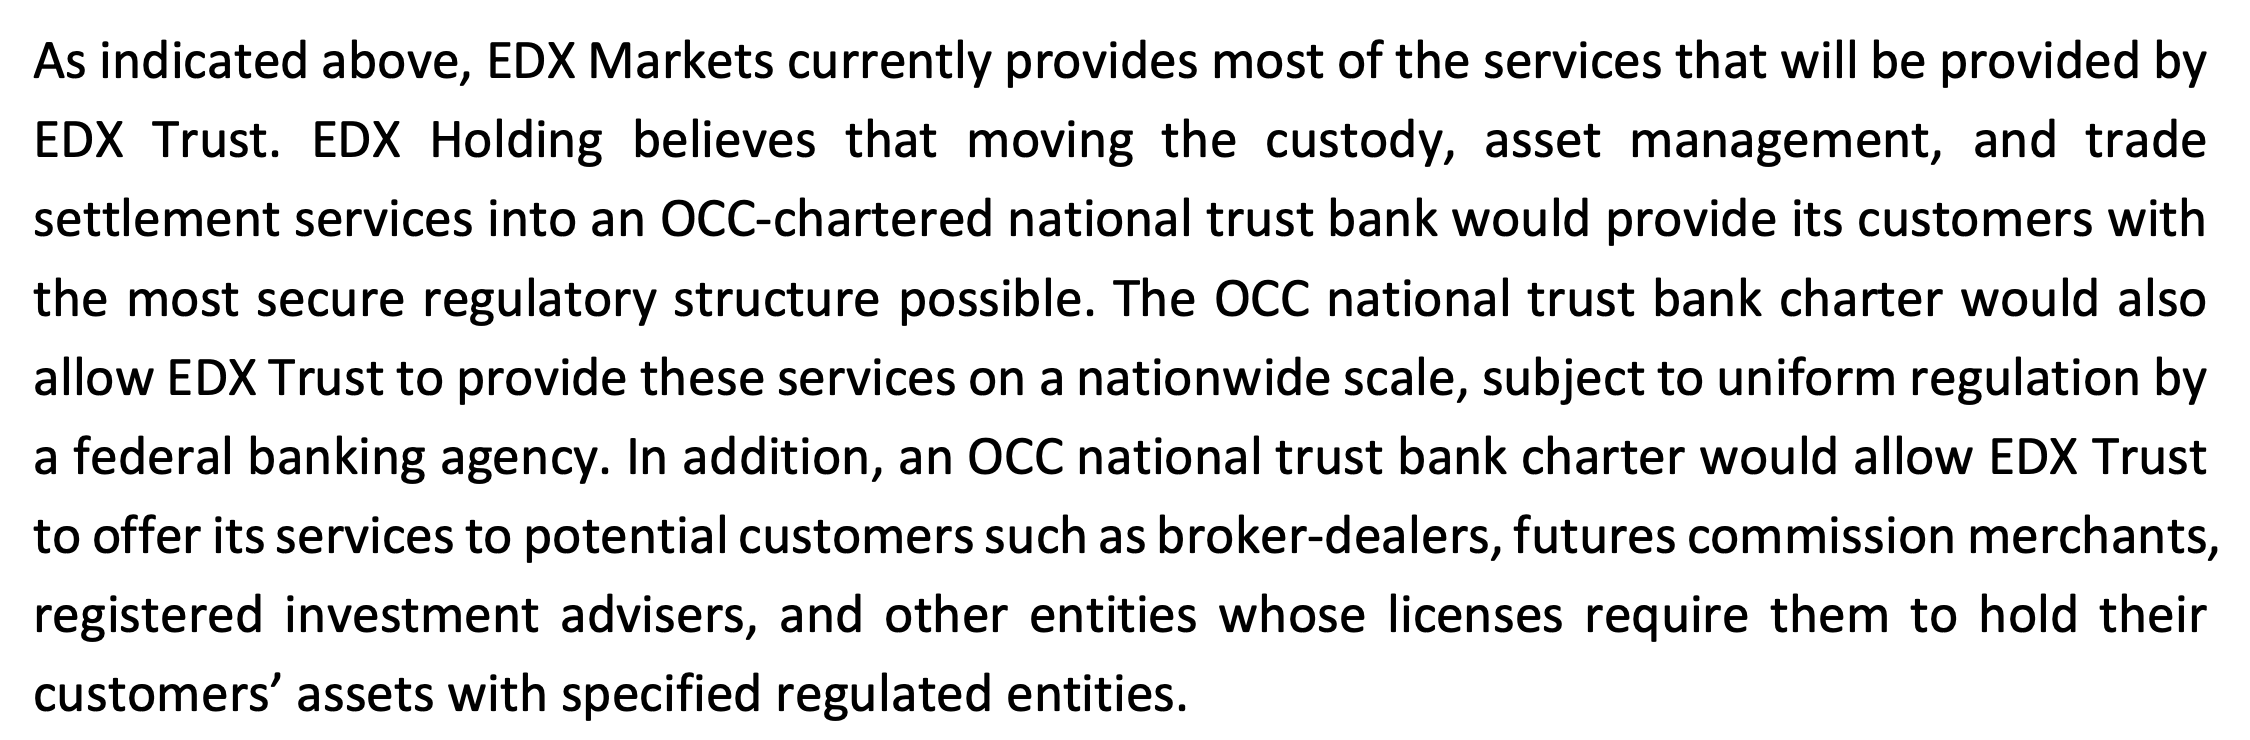
EDX Markets, an institutional crypto exchange, has applied to the US Office of the Comptroller of the Currency (OCC) to establish a national trust bank that would provide crypto custody, asset management and trade-settlement services.
The proposed entity, EDX Trust, would operate as a non-depository national bank, separating custody and settlement from trading while continuing to route order matching through EDX’s existing platform.
In its application, the company said the model is intended to address structural risks in crypto markets, where trading, custody and brokerage are often combined within a single platform, creating potential conflicts of interest and single points of failure.
EDX said the trust bank would provide fiduciary asset management services, invest client cash and stablecoin balances in highly liquid assets, and facilitate trading through a riskless principal model with end-of-day net settlement.
The bank would operate online from Chicago and target institutional clients such as broker-dealers, futures commission merchants and registered investment advisers, according to the filing.
EDX said moving these functions into an OCC-chartered entity would allow it to offer services nationwide under a single regulatory framework while meeting custody requirements for regulated institutions.
Founded in 2022, EDX Markets is backed by traditional market participants including Citadel Securities, Virtu Financial, Fidelity Digital Assets and Hudson River Trading.

Related: Fed’s Barr backs stablecoin clarity but warns of run risks
Crypto companies seek US bank charters
The application comes as crypto and financial companies increasingly pursue national trust bank charters to expand institutional services under federal oversight.
Earlier this month, Zerohash, a blockchain infrastructure company, applied for a US national trust bank charter to expand its stablecoin and custody services for banks, brokerages and fintechs.

Other recent applicants include Coinbase, which applied in October and is still awaiting a decision, as well as Laser Digital and Payoneer, which filed applications earlier this year to expand custody and stablecoin-related payment services.
Traditional financial institutions are also entering the space. In February, Morgan Stanley applied for a de novo trust bank charter to support digital asset services through a separate entity.
At the same time, the OCC has continued approving applicants, issuing conditional licenses last month to Bridge, Stripe and Crypto.com, following approvals in December for Ripple Labs, Circle Internet Group, Fidelity Digital Assets, Paxos and BitGo.
However, the pace of approvals has drawn scrutiny. In February, the American Bankers Association urged the OCC to slow the process, citing unresolved oversight under pending US stablecoin legislation.
Crypto World
Ripple Treasury Becomes First TMS to Offer Native Digital Asset Capabilities for Corporate CFOs
TLDR:
- Ripple Treasury is the first TMS to embed native digital asset capabilities directly into an enterprise platform.
- Digital Asset Accounts support XRP and RLUSD with 15-decimal precision and automated real-time transaction recording.
- Unified Treasury connects multiple custodians via ClearConnect, giving CFOs one real-time dashboard for all positions.
- Ripple’s 2026 survey found 72% of finance leaders say a digital asset solution is now needed to stay competitive.
Ripple Treasury has officially launched Digital Asset Accounts and Unified Treasury. The launch marks the first native digital asset capabilities embedded in an enterprise treasury management system.
CFOs and their teams can now view, hold, and manage both fiat and digital assets in one place. It follows Ripple’s 2025 acquisition of GTreasury, which brought over 40 years of enterprise treasury expertise. Multiple customers completed beta testing ahead of the April 1 global launch.
Digital Asset Accounts Integrate Onchain Balances Into Enterprise Treasury Workflows
Digital Asset Accounts allow treasury teams to create and manage a regulated digital asset account directly within the platform.
No external setup, third-party custody relationship, or separate system is required. XRP and Ripple USD (RLUSD) balances appear alongside cash accounts in real time.
The platform applies live fiat valuation, refreshed within seconds of each transaction. Exchange rates come from leading market data providers and update automatically.
The system also works across multiple data providers simultaneously, maintaining accuracy during volatile market conditions. Teams no longer need manual calculations or separate tools for valuation.
Transactions are recorded with 15-decimal precision, capturing onchain amounts exactly as they exist. This prevents rounding errors that typically cause reconciliation gaps.
An automated audit trail is generated for every transaction, supporting finance and control teams. Treasury managers maintain full control of records without relying on external reconciliation tools.
Each record captures the native notional amount, fiat equivalent, and market price at the moment of the event. This provides a complete, time-stamped transaction history without manual data entry. The automated recording process also supports compliance across multiple reporting frameworks.
Renaat Ver Eecke, SVP of Ripple Treasury, spoke on the shift in how CFOs now approach digital assets. “Digital assets have arrived at the CFO’s desk, and the question has shifted from whether to engage to how to do so advantageously without disrupting existing operations,” he said.
He added that the platform gives the office of the CFO a trusted place to hold and manage digital and fiat assets, with no separate interface or new workflows needed.
Unified Treasury Gives CFOs Real-Time Visibility Across All Liquidity Positions
Unified Treasury consolidates digital asset and cash positions into a single real-time dashboard. Teams holding assets across multiple custodians can connect providers through Ripple Treasury’s ClearConnect connectivity layer.
This layer is the same one already used for existing bank integrations within the platform. No new infrastructure or changes to current banking arrangements are required.
API connectivity to digital asset providers can be completed in minutes through the platform. Once connected, balances reflect automatically as transactions occur onchain.
Treasury teams no longer depend on manual imports or batch data processing to see positions. This also eliminates delays that have made digital asset reporting difficult for corporate finance teams.
Market rates are applied to digital asset balances in the reporting currency of each organization’s choice. No separate data sources or manual currency conversions are required.
The entire process runs automatically within the system, streamlining day-to-day operations. This gives treasury teams in different regions a consistent reporting experience.
Mark Johnson, VP of Global Product at Ripple Treasury, described the core design principle behind both capabilities. “The design principle behind both capabilities is that digital assets should behave exactly like cash within the platform,” he said.
Johnson further noted that treasury teams should not have to think about whether a balance is onchain or in a bank account. “They should simply see their position,” he added.
Ripple’s 2026 survey of 1,000+ global finance leaders found that 72% now consider a digital asset solution a competitive necessity.
Most, however, lack a starting point that fits within current workflows. Stablecoins processed $33 trillion in volume last year, rising 72% from 2024, showing strong demand already in the market.


New Hampshire’s Bitcoin-backed municipal bond receives Ba2 rating from Moody’s, marking the first instance of a public finance instrument backed by cryptocurrency.

Key takeaways
- Jesse Spiro of Tether is poised to chair Fellowship PAC, a crypto-backed political committee planning endorsements for the 2026 U.S. midterms.
- The group claims to have raised over $100 million from crypto-aligned backers, though transparency around contributors remains limited.
- The Fellowship PAC filed with the U.S. Federal Election Commission on Aug. 7 and had reported no contributions or expenditures as of Dec. 31, raising questions about funding sources and operational timeline.
- Industry politics are intensifying as lawmakers weigh digital-asset regulation alongside debates over stablecoins, with broader implications for the sector’s political leverage.
Industry money and the evolving political playing field
Beyond U.S. politics, observers point to a broader question: will political engagement by the crypto sector translate into tangible regulatory outcomes, or will it primarily serve as signaling to markets and builders? The coming months should reveal how the Fellowship PAC, and others like it, balance signaling with real-world policy influence, particularly as the Senate weighing of the CLARITY Act remains unsettled and as discussions around stablecoins and digital-asset markets continue to evolve.
Cointelegraph and other outlets will continue monitoring filings, endorsements, and the evolving regulatory dialogue to assess how these political moves might shape the crypto landscape through 2026 and beyond.
Readers should watch for developments on who funds Fellowship PAC, how its endorsement strategy unfolds, and whether the Senate reopens consideration of digital-asset reform in a way that aligns with or counters the industry’s political ambitions.
Regulatory crossroads: stablecoins, yield, and the CLARITY Act
What to watch next in the 2026 cycle
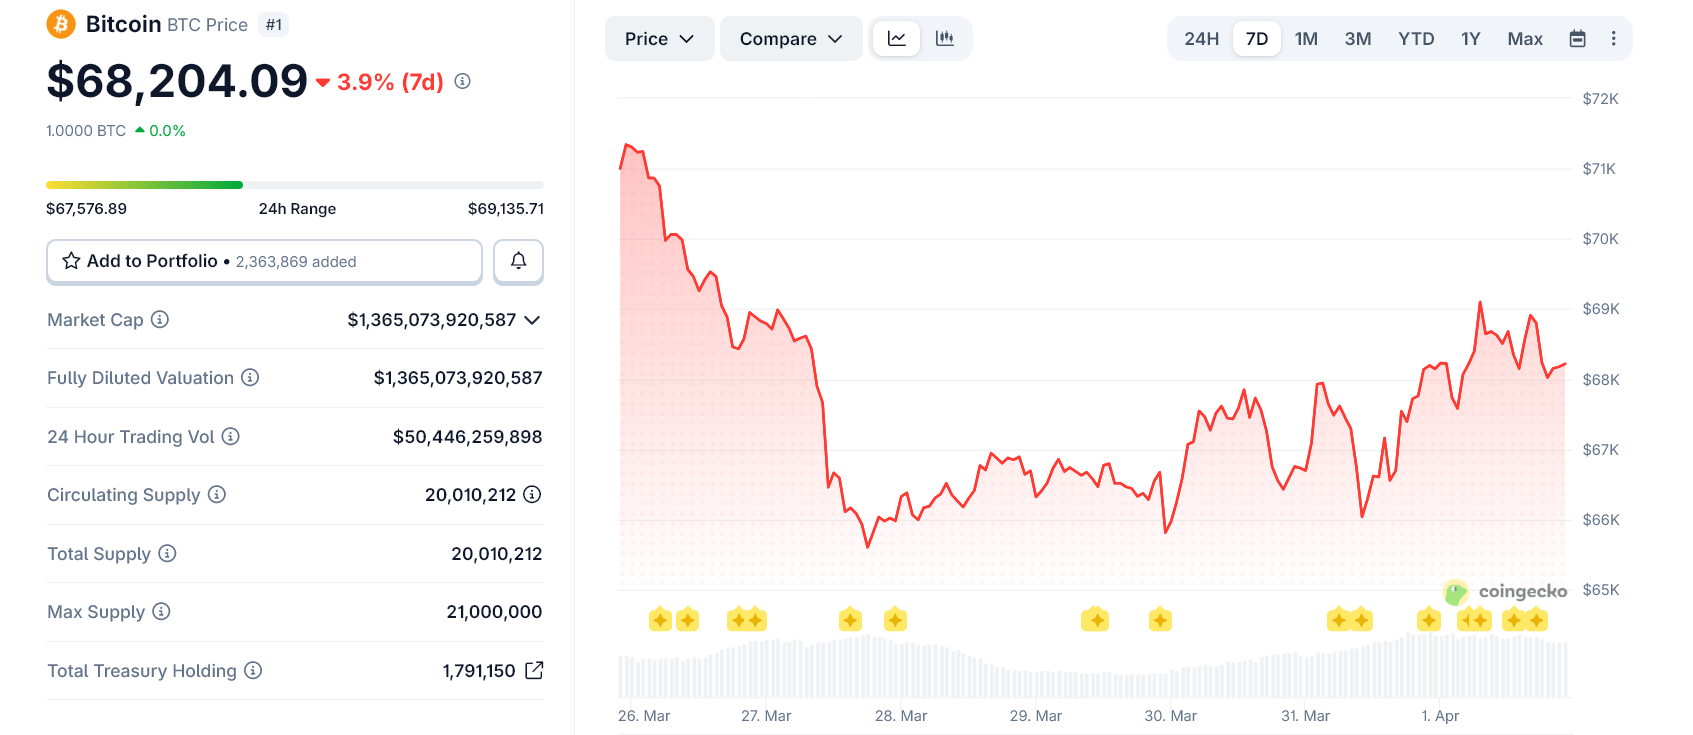
Bitcoin held steady near the $68,000 range on Wednesday as markets braced for a key speech from President Donald Trump on the Iran war. Reports suggest Trump may signal that the conflict is nearing an end, possibly within weeks, while framing recent actions as a strategic success.
However, despite the “war ending soon” narrative gaining traction, Bitcoin’s intraday data shows a more cautious market beneath the surface.
Rallies Sold, Not Built
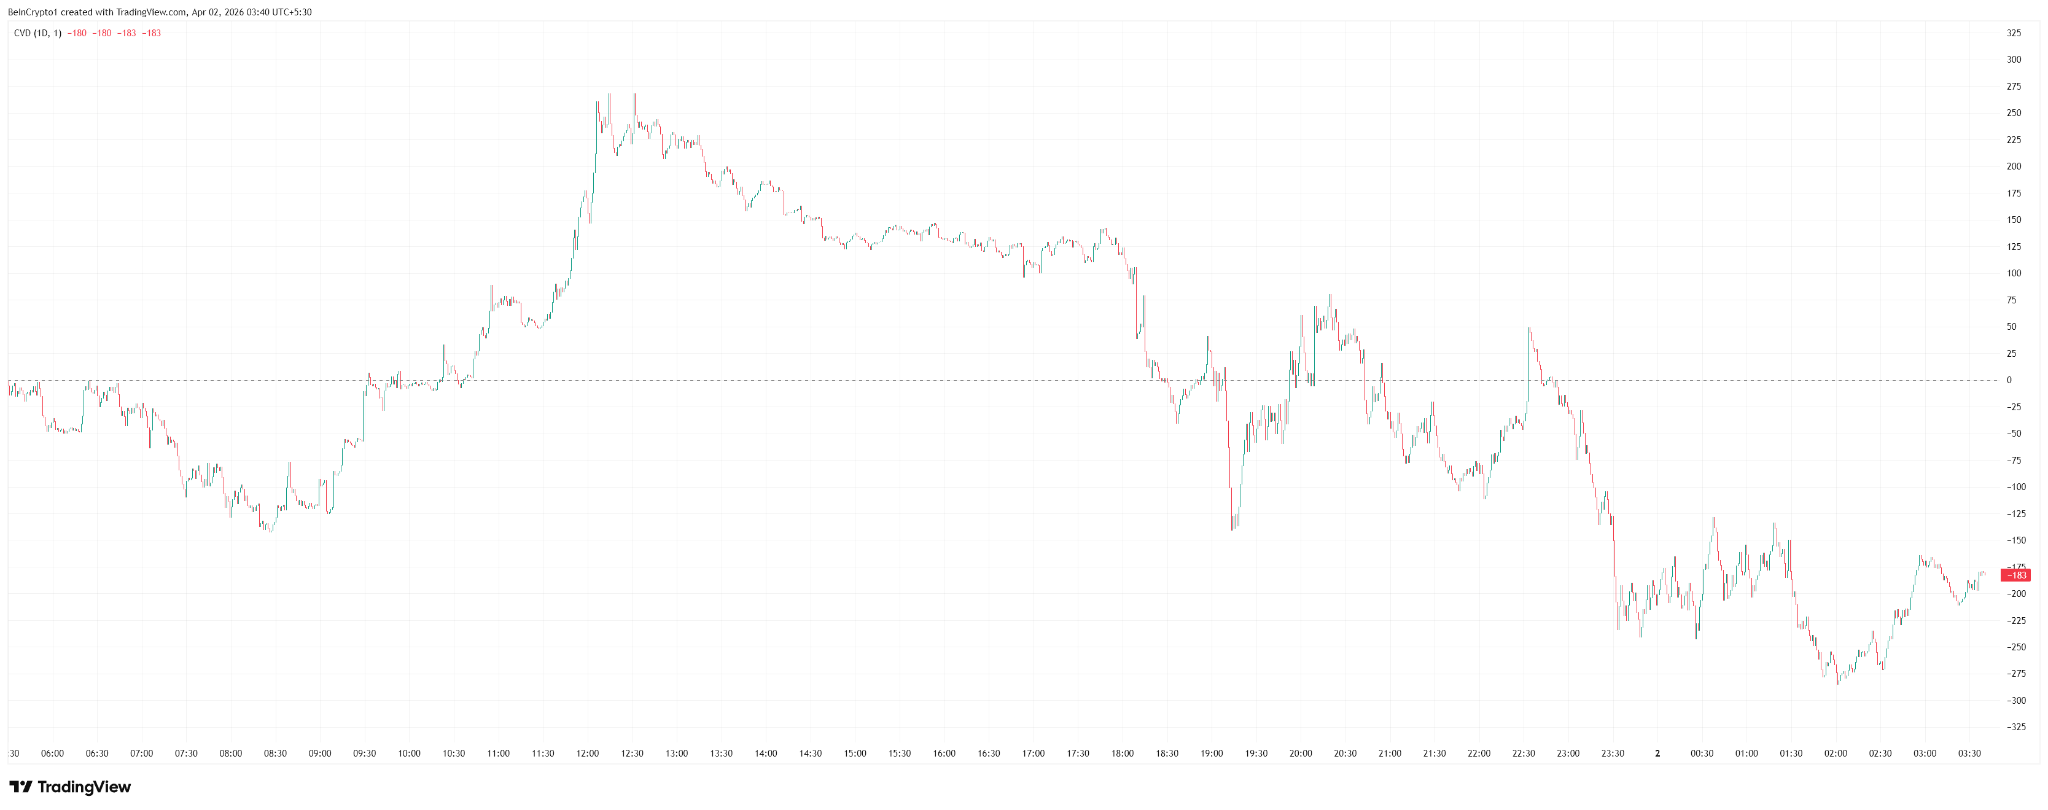
Cumulative Volume Delta (CVD) shows a clear trend: sellers dominated most of the day.
After an early push higher, CVD steadily declined into negative territory. This means more aggressive sell orders hit the market than buys. In simple terms, traders used price strength to exit positions rather than build new ones.
Even during small recoveries later in the day, selling pressure continued. That signals weak conviction behind the upside.
Volume Confirms Distribution
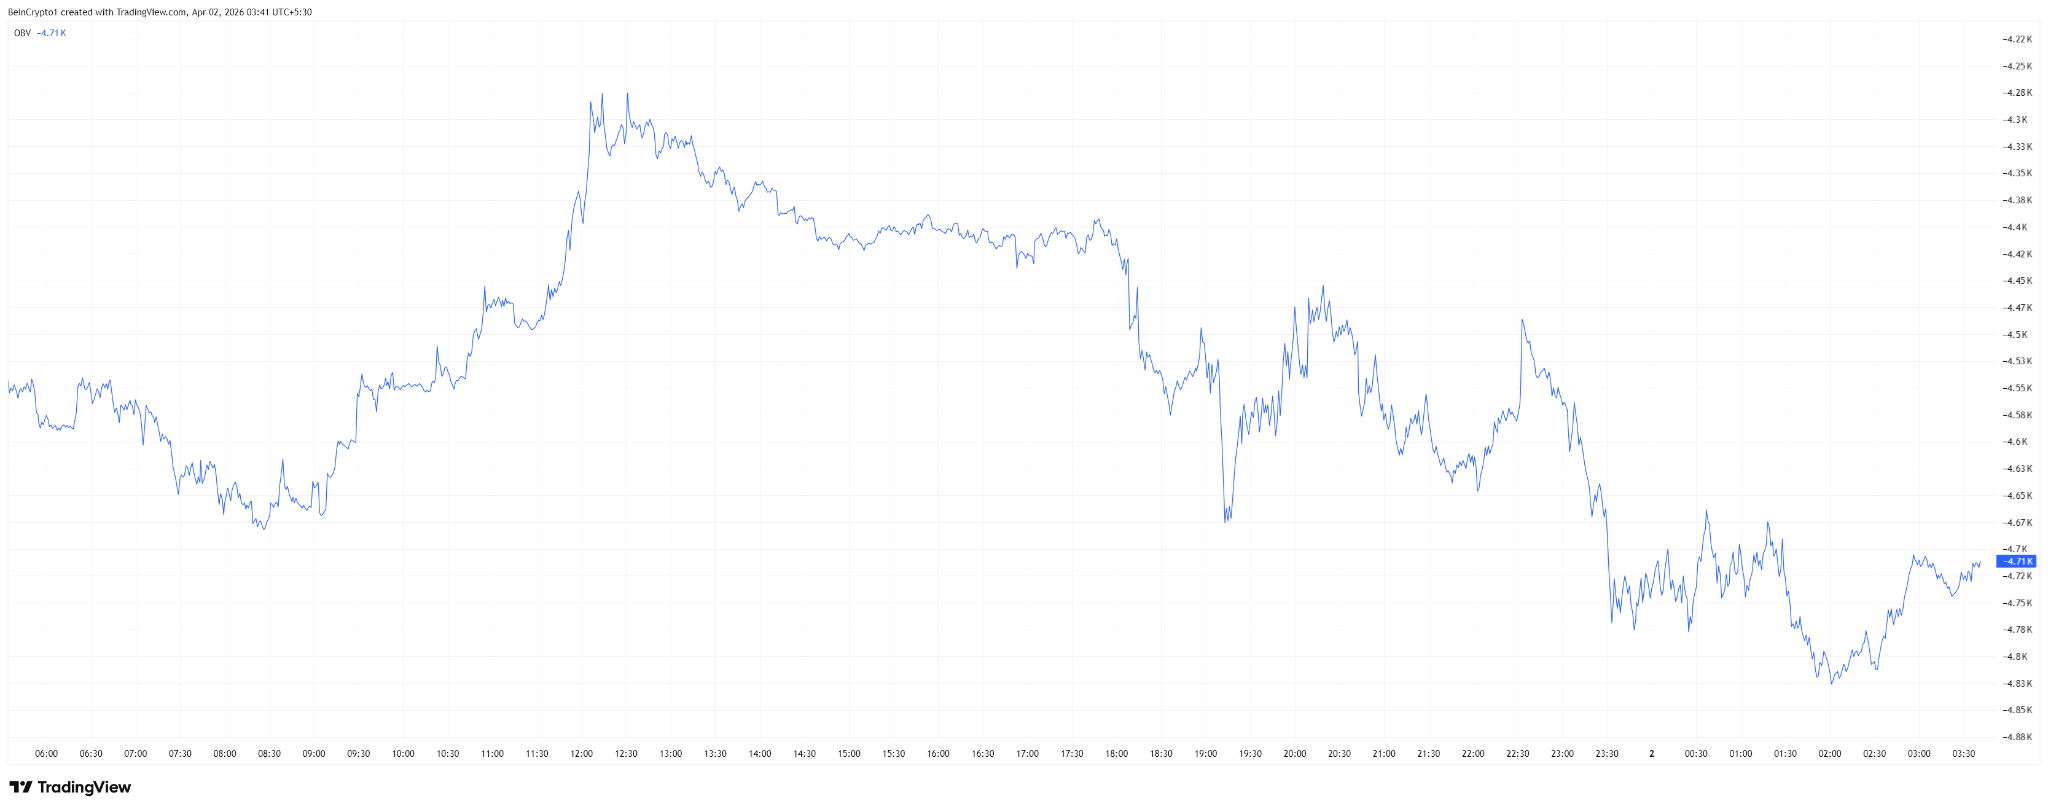
On-Balance Volume (OBV) tells a similar story.
While Bitcoin’s price moved sideways for much of the session, OBV trended lower. This divergence suggests that volume flowed out of the asset, not into it.
Put simply, the market was not accumulating Bitcoin. Instead, it was quietly distributing, with sellers outweighing buyers over the full session.
Late Buyers Step In — But Lightly
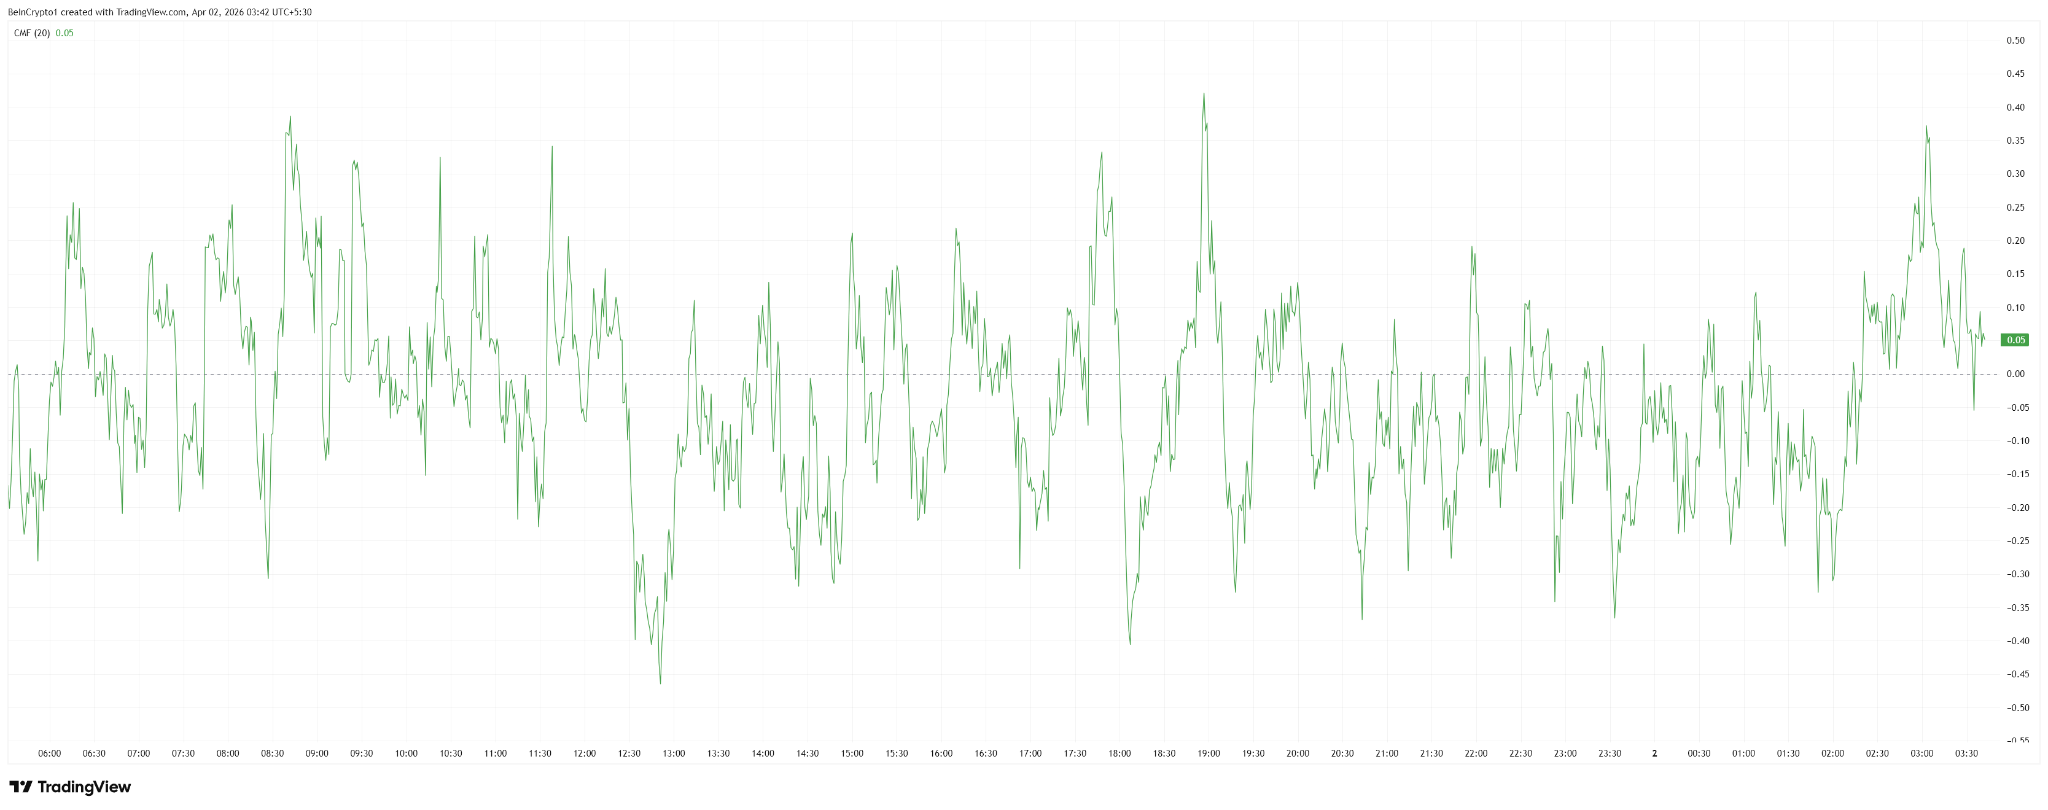
Chaikin Money Flow (CMF) adds a final layer.
The indicator flipped slightly positive toward the end of the day, showing that some buyers stepped in during the final hours. However, the move remained modest and inconsistent.
This suggests dip-buying activity, but not strong or sustained demand.
Market Prepares, But Doesn’t Commit
Taken together, the data points to a market positioning defensively.
Bitcoin appears to be pricing in the possibility of de-escalation. Yet traders are not aggressively betting on a breakout. Instead, they are selling into strength and waiting for confirmation.
The pattern aligns with a broader “sell the news” setup.
A Narrative Priced In — But Not Trusted
If Trump confirms a near-term end to the conflict, markets may react positively at first. However, Bitcoin’s flow data suggests that much of this expectation is already priced in.
For now, the market is not chasing the narrative. It is preparing for it — cautiously.
The post Bitcoin is Positioning for ‘War is Ending’ Narrative Ahead of Trump’s Iran Speech appeared first on BeInCrypto.
Limited-edition Mitusbishi shaft pays homage to Augusta National

WhatsApp notifies 200 users who installed fake app built by Italian spyware maker SIO

BBC journalist reacts to Artemis II launch


-

 News Videos7 days ago
Parliament publishes latest register of MPs’ financial interests
-

 Business6 days ago
Instagram, YouTube Found Responsible for Teen’s Mental Health Struggle in Historic Ruling
-
 Tech6 days ago
Intercom’s new post-trained Fin Apex 1.0 beats GPT-5.4 and Claude Sonnet 4.6 at customer service resolutions
-

 NewsBeat5 days ago
The Story hosts event on Durham’s historic registers
-

 Sports5 days ago
Sweet Sixteen Game Thread: Tide vs Michigan
-
Entertainment2 days ago
Fans slam 'heartbreaking' Barbie Dream Fest convention debacle with 'cardboard cutout' experience
-
 Entertainment4 days ago
Lana Del Rey Celebrates Her Husband’s 51st Birthday In New Post
-
Crypto World2 days ago
Dems press CFTC, ethics board on prediction-market insider trades
-

 Tech3 days ago
The Pixel 10a doesn’t have a camera bump, and it’s great
-

 Sports1 day ago
Tallest college basketball player ever, standing at 7-foot-9, entering transfer portal
-

 Crypto World3 hours ago
Gold Price Prediction: Worst Month in 17 Years fo Save Haven Rock
-

 Tech2 days ago
EE TV is using AI to help you find something to watch
-

 Entertainment7 days ago
HBO’s Harry Potter Series Will Definitely Fail For One Big Reason, And It’s Not J.K. Rowling Or Snape
-

 Tech2 days ago
Apple will hide your email address from apps and websites, but not cops
-

 Tech2 days ago
How to back up your iPhone & iPad to your Mac before something goes wrong
-

 Tech2 days ago
Flipsnack and the shift toward motion-first business content with living visuals
-

 Fashion6 days ago
En Vogue in Brown Leather and Tailored Neutrals by Atelier Savoir, Styled by J Bolin
-

 Politics2 days ago
Should Trump Be Scared Strait?
-

 Crypto World2 days ago
U.S. rule change may open trillions in 401(k) funds to crypto
-

 Fashion5 days ago
Weekly News Update, 3.27.26 – Corporette.com
You must be logged in to post a comment Login