
Crypto World
Pi Network price gets oversold ahead of a big unlock and potential Kraken listing
Pi Network price continued its strong downward trend this week and is nearing its lowest level on record as traders anticipated a big token unlock this week.
Summary
- Pi Network price continued its strong downward trend last week.
- The network will unlock 82 million tokens in the next seven days.
- A potential catalyst for the coin is Kraken listing.
Pi Coin (PI) token was trading at $0.1450 on Sunday, a few points above the all-time low of $0.1305. It has dropped by over 90% from its all-time high, erasing billions of dollars in value.
Pi token may come under pressure this week as the network unlocks over 82 million coins in the next seven days. At the current price, these coins are valued at over $11 million. These coins are part of the 206 million tokens that come online this month.
Token unlocks are risky for a cryptocurrency because they boost the circulating supply. Soaring supply at a time when demand is not rising will always put pressure on the price.
Pi Network’s supply will also jump in March when the team will issue the validator rewards. In a recent note, they said that they had completed the design and were currently testing it, with the implementation happening in March.
While many validators will hold their tokens, some will dump, leading to lower prices over time.
On the positive side, Pi Network has a major catalyst in that it was added on Kraken’s roadmap list. In most cases, this is usually the first stage before the company lists a token. A Kraken listing would be highly bullish for Pi because of its scale as the second-biggest American crypto exchange after Coinbase.
Pi Network price prediction: technical analysis
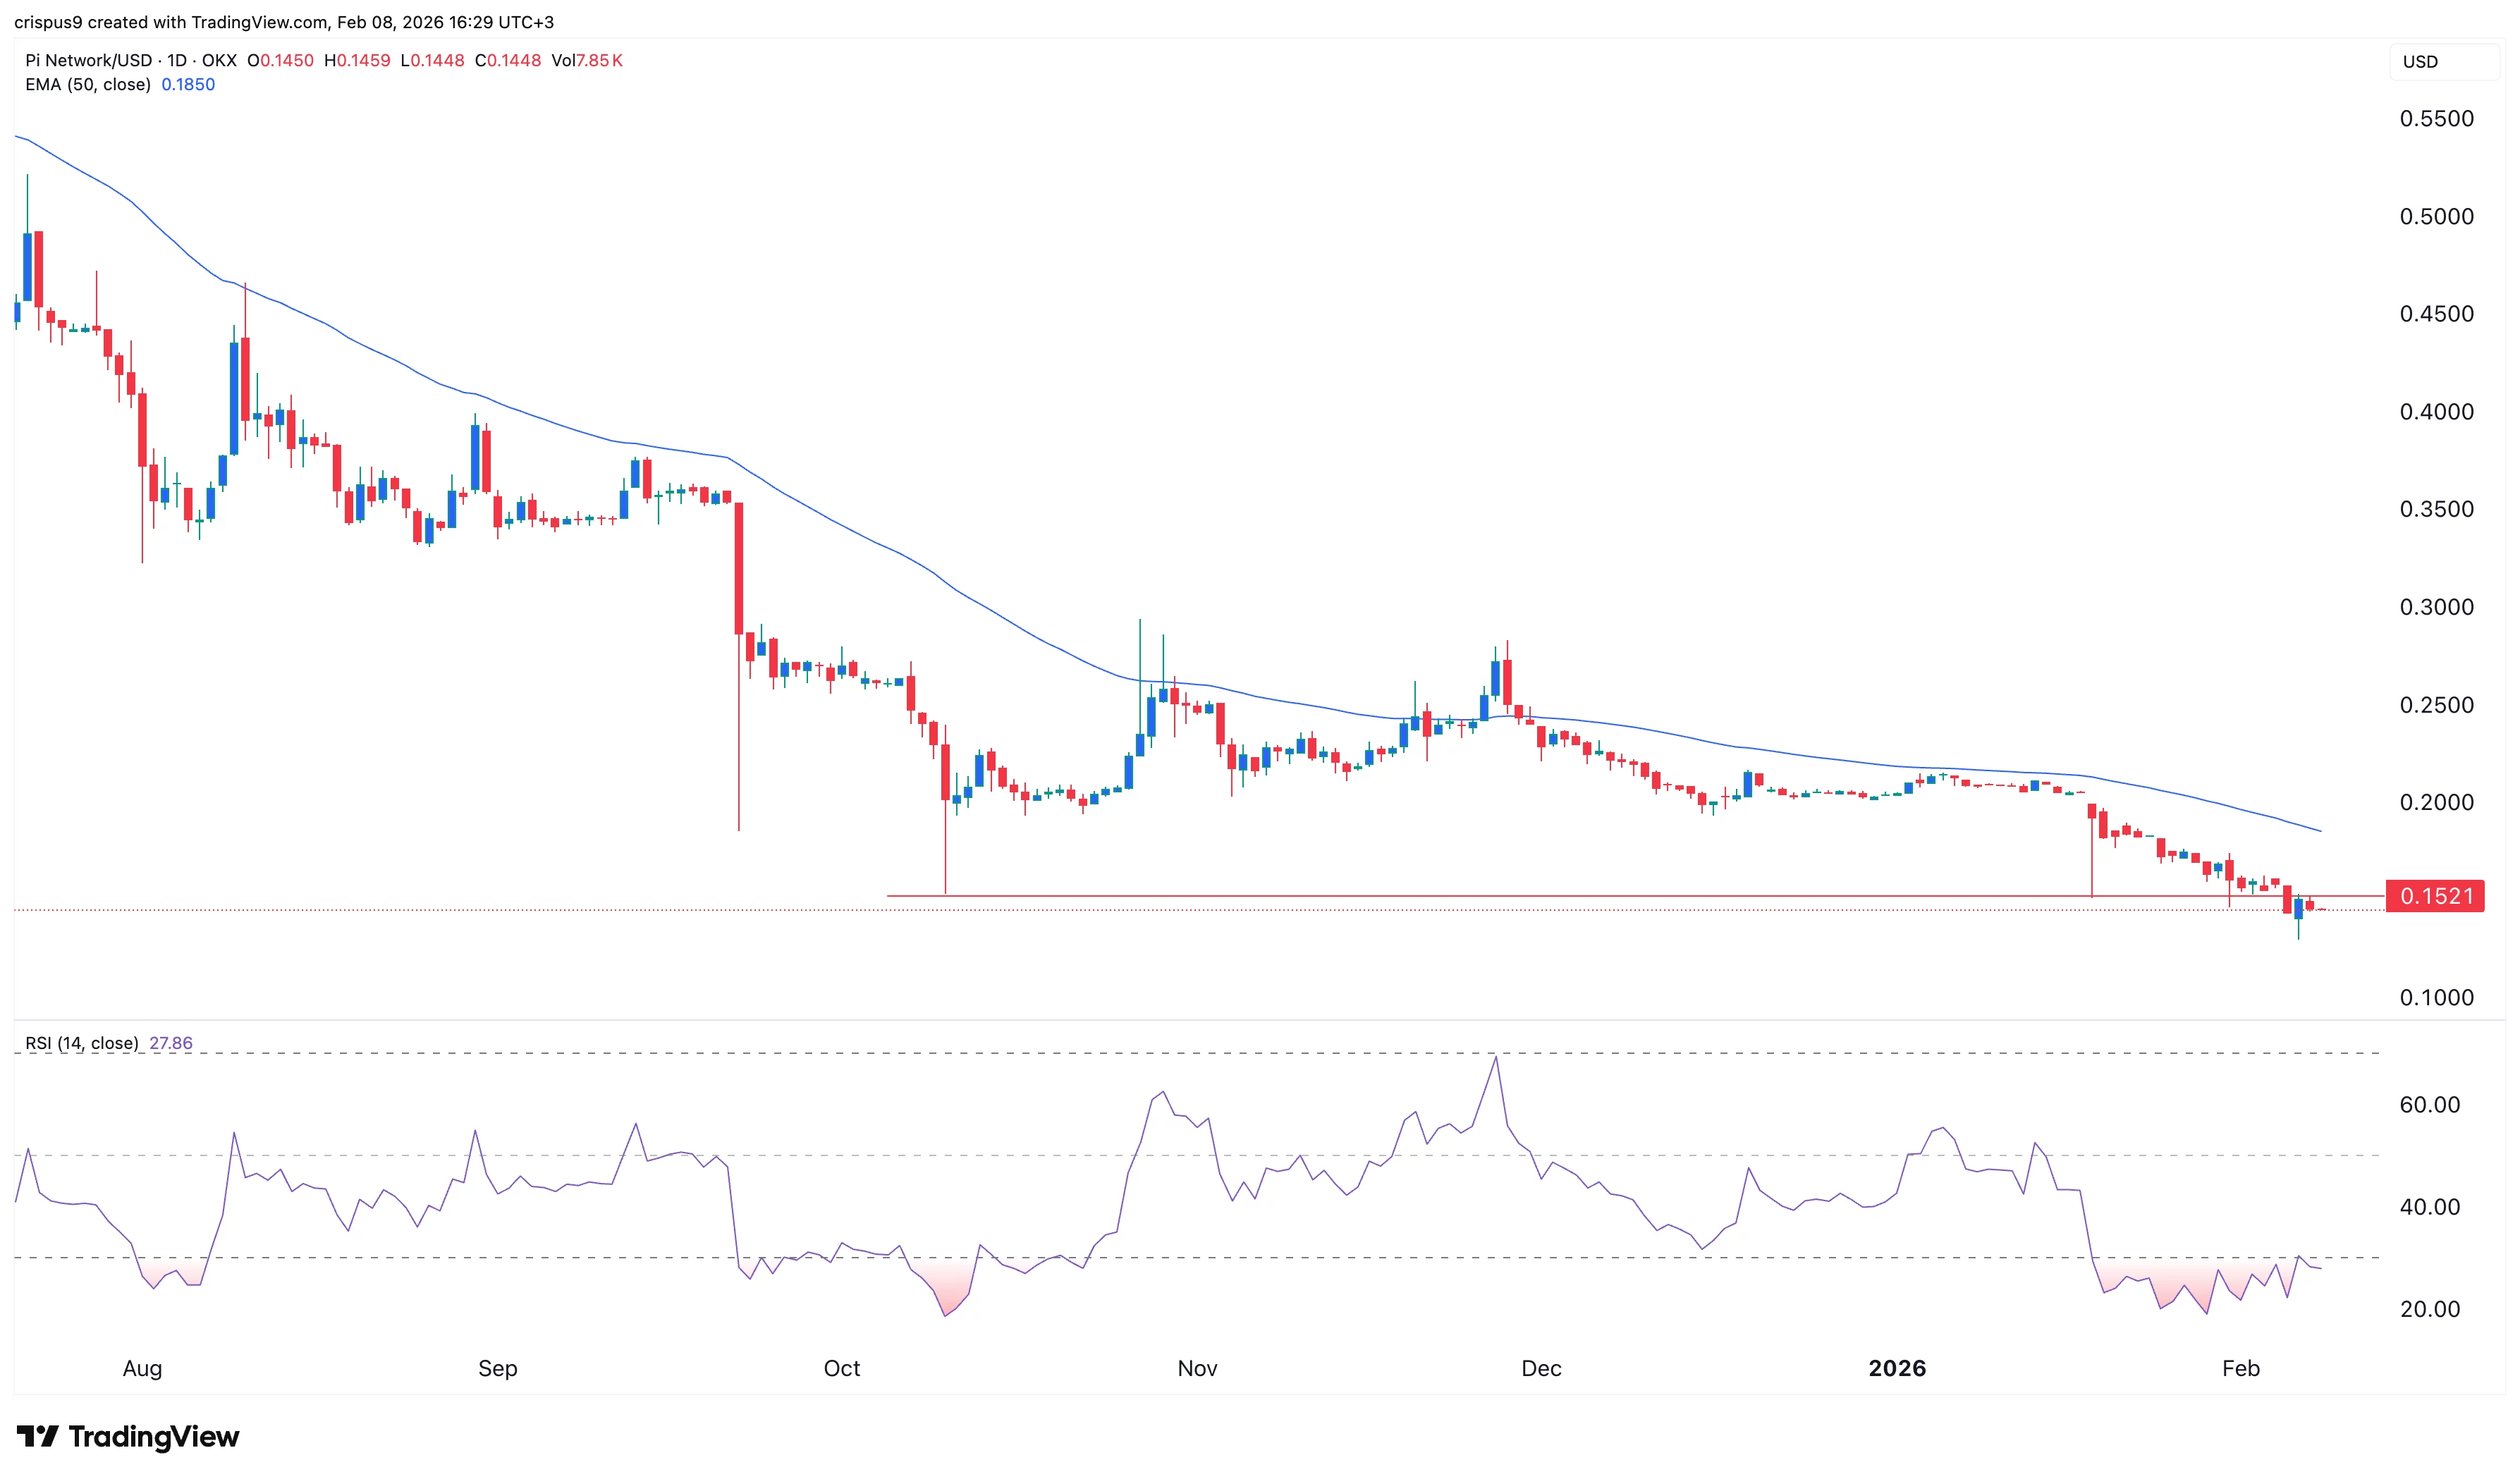
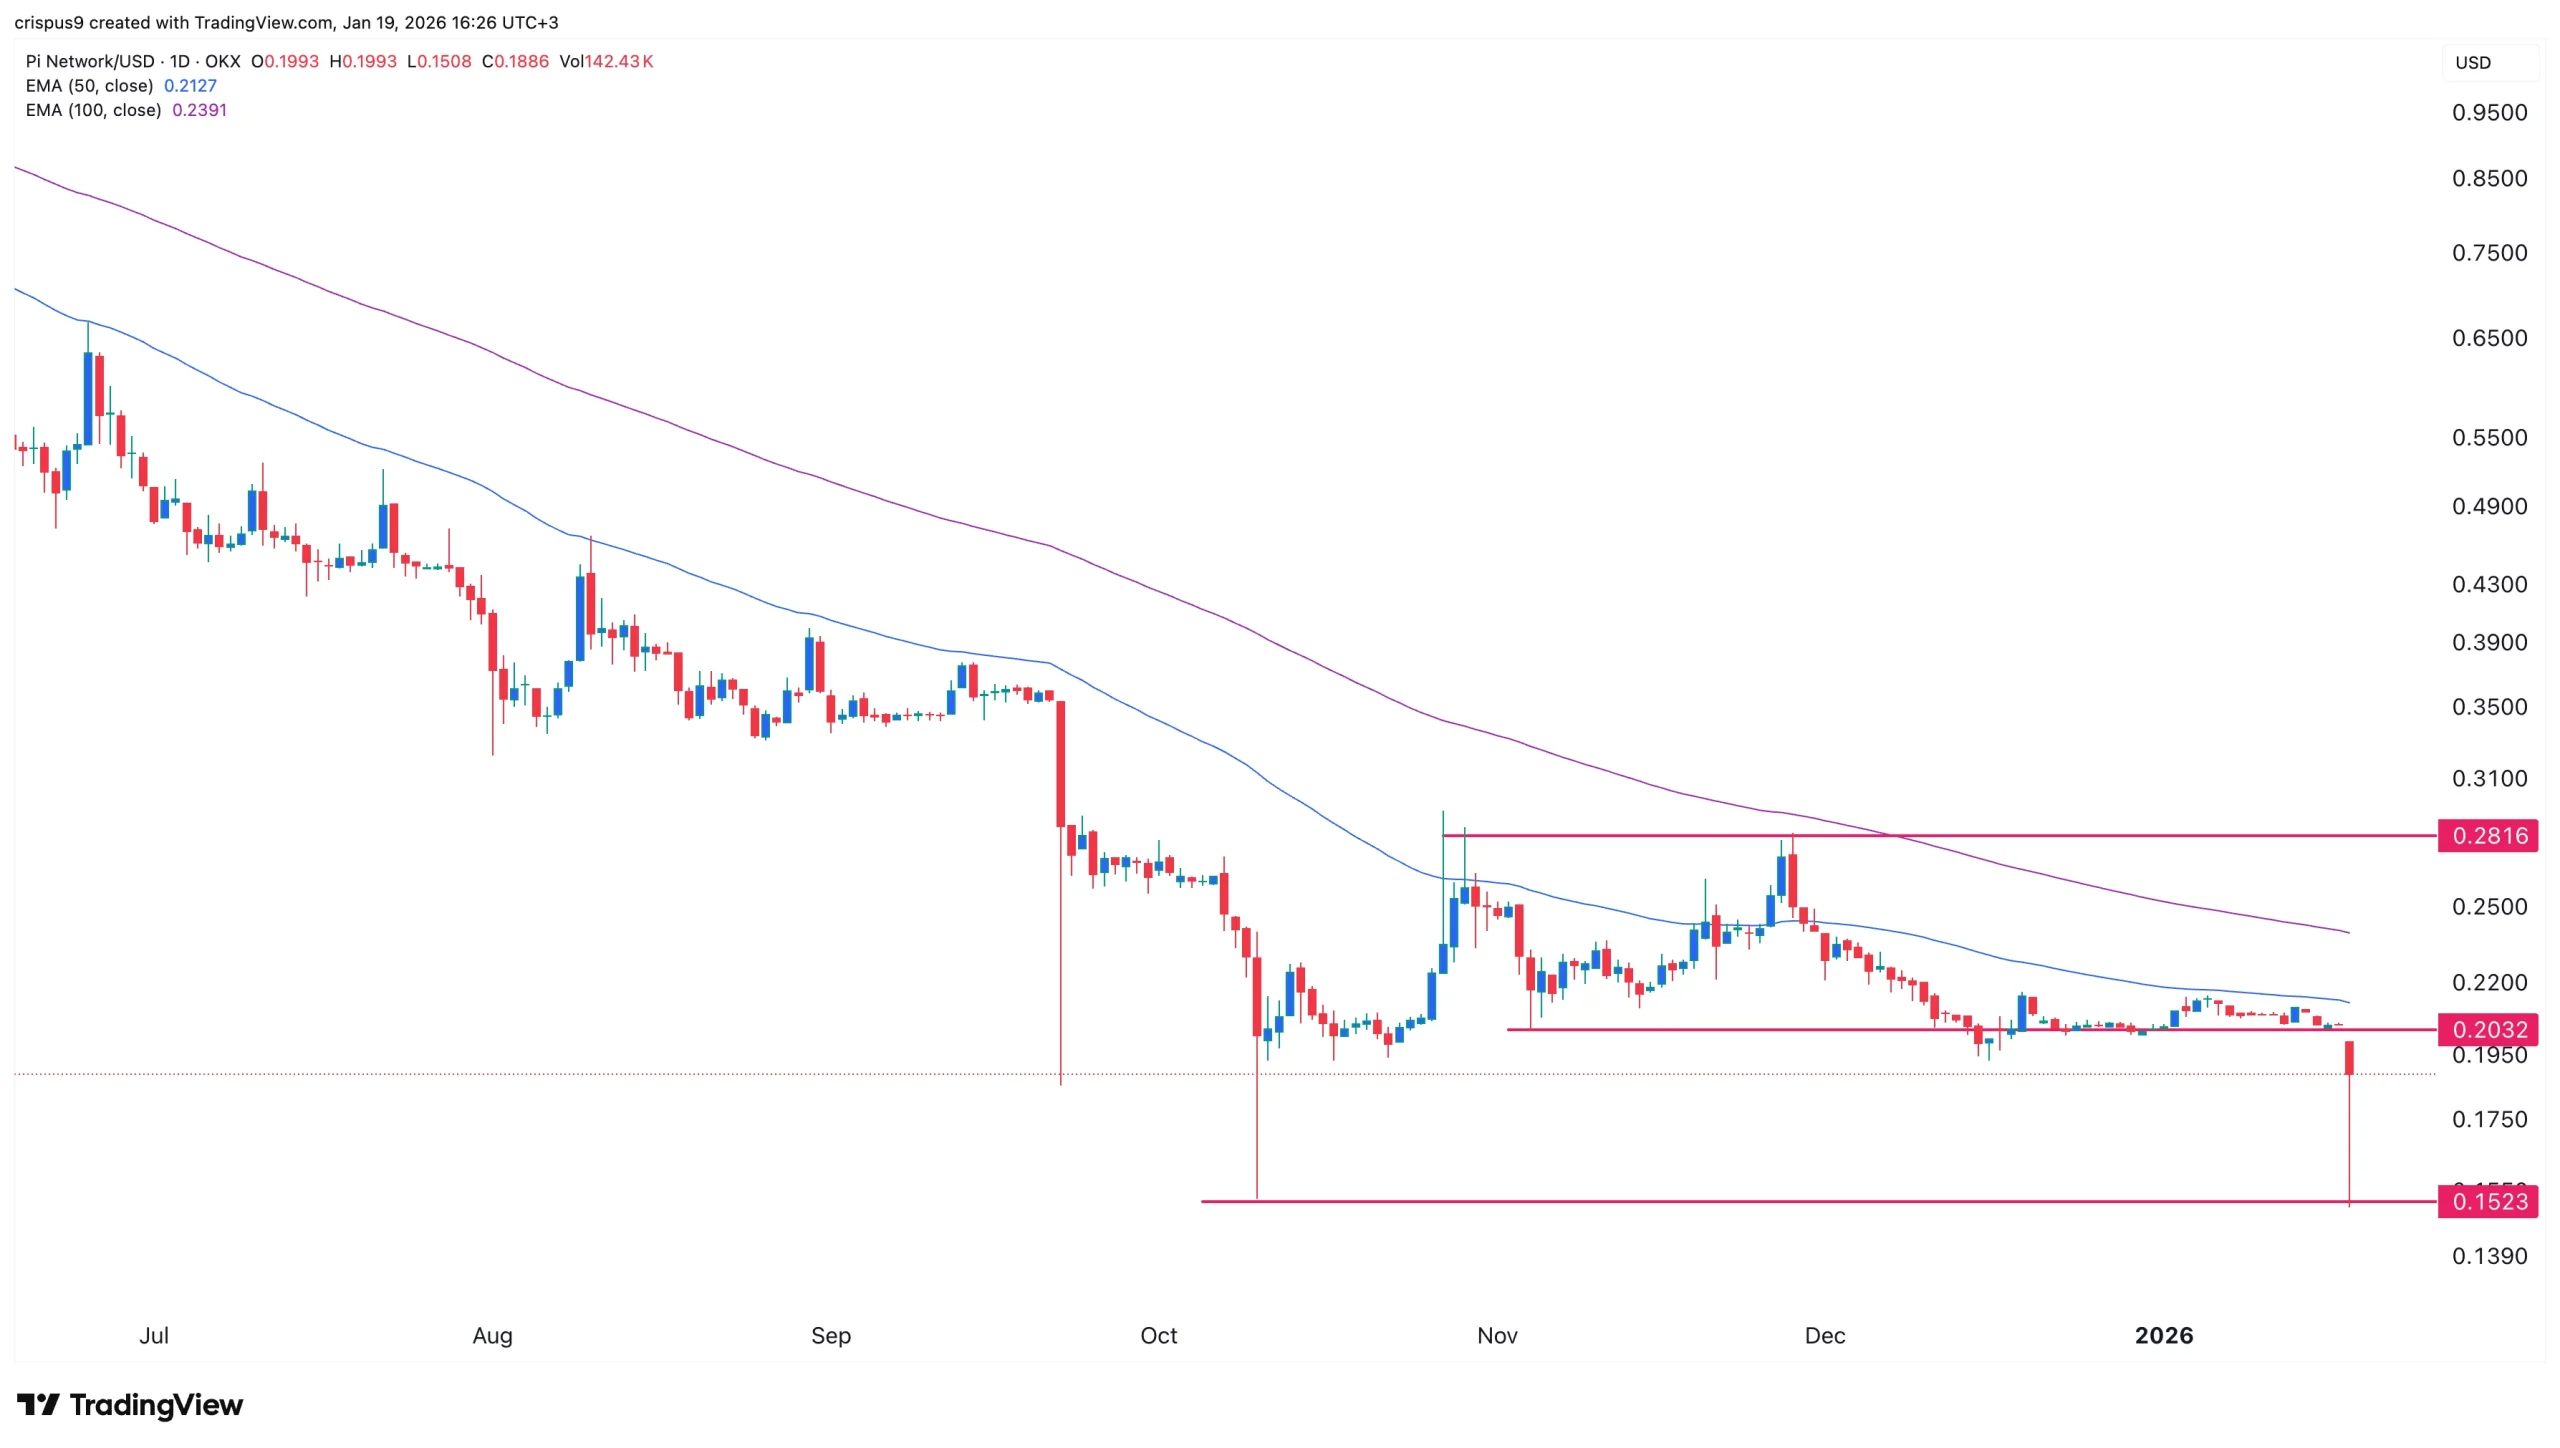
The daily timeframe chart shows that the value of Pi has remained under pressure in the past few months. It recently crossed the crucial support level at $0.1520, its previous all-time low.
The coin has remained below the 50-day and 100-day Exponential Moving Averages. It also sits below the Supertrend indicator, a highly bearish sign in technical analysis.
On the positive side, the coin has become highly oversold, with the Relative Strength Index remaining below 30. Therefore, the most likely scenario is where it remains in this range this week. A move above the key resistance at $0.1520 will invalidate the bearish outlook and point to more gains.


In a recent note, the International Monetary Fund (IMF) has warned that tokenized finance poses four distinct risks to the global financial system.
Authored by Tobias Adrian, the IMF’s Financial Counselor and Director of the Monetary and Capital Markets Department, the note frames tokenization as a structural reconfiguration of how trust, settlement, and risk management are organized.
4 Risks the IMF Sees in Tokenized Finance
The first risk centers on interoperability and fragmentation. Multiple platforms operating without common standards could split liquidity across digital silos, reduce netting efficiency, and impair par convertibility between assets.
Second, the IMF warns that tokenized systems amplify financial stability threats. Automated margin calls, continuous settlement, and algorithmic feedback loops compress the time available for intervention during stress events.
Traditional end-of-day buffers disappear, and shocks propagate faster, especially in highly interconnected systems.
Follow us on X to get the latest news as it happens
“Public authorities have a key role to play in setting interoperability standards and promoting common protocols. International coordination is essential to ensure that cross-border transactions achieve atomic settlement and legally recognized finality. Absent such coordination, tokenization may exacerbate existing inefficiencies in cross-border finance, rather than resolve them,” the note read.
Third, cross-border resolution becomes far harder. Tokenized transactions span multiple jurisdictions on shared ledgers, yet resolution powers remain nationally anchored.
This mismatch could produce jurisdictional conflict or paralysis precisely when decisive action is most needed.
Fourth, Emerging and Developing Economies (EMDEs) face acute exposure. Dollar-denominated stablecoins could accelerate currency substitution, volatile capital flows, and erosion of monetary sovereignty in countries with weaker financial systems.
The IMF’s five-pillar policy roadmap calls for anchoring settlement in safe money, applying consistent regulation across equivalent activities, establishing legal certainty for tokenized assets, promoting interoperability standards, and adapting central bank liquidity tools for 24/7 automated environments.
The note concludes that the window for shaping tokenized finance remains open but will not remain so indefinitely. This comes amid strong growth in the tokenization sector.
The total on-chain distributed RWA value has climbed 4% over the past month to $26.7 billion. The represented asset value has jumped 31.61% in the same period. The number of asset holders also increased to 710,792, up 5.56%.
Subscribe to our YouTube channel to watch leaders and journalists provide expert insights
The post IMF Identifies 4 Risks Tokenized Finance Poses to Global Financial System appeared first on BeInCrypto.
Crypto World
Solana Price Prediction: After The Exploit, Is The Network Still Safe? Will Price Recover?
Solana price appears to be stabilizing below $80, but the Drift Protocol exploit raised questions, followed by bearish prediction. Is the network’s infrastructure fundamentally compromised, or is this selloff noise masking a recovery setup?
The Drift Protocol attack drained at least $270 million in under 60 seconds, but notably, no code was broken. The attacker exploited “durable nonces,” a legitimate Solana feature that allows transactions to remain valid indefinitely by replacing the standard 60–90 second expiring blockhash with a fixed on-chain code.
Security council members were tricked into pre-signing administrative transfers weeks before execution, with no way to revoke approval once given. The exploit required more than a week of setup and less than a minute to detonate.
That distinction of feature abuse versus protocol failure is critical for price recovery timing. Macro headwinds compound the damage, BTC hovering at $66,000, S&P 500 under pressure, and oil above $100 stoking stagflation fears that are already suppressing risk appetite across the crypto markets.
Discover: The best crypto to diversify your portfolio with
Solana Price Prediction: Hold $80 Support, or a Drop to $50
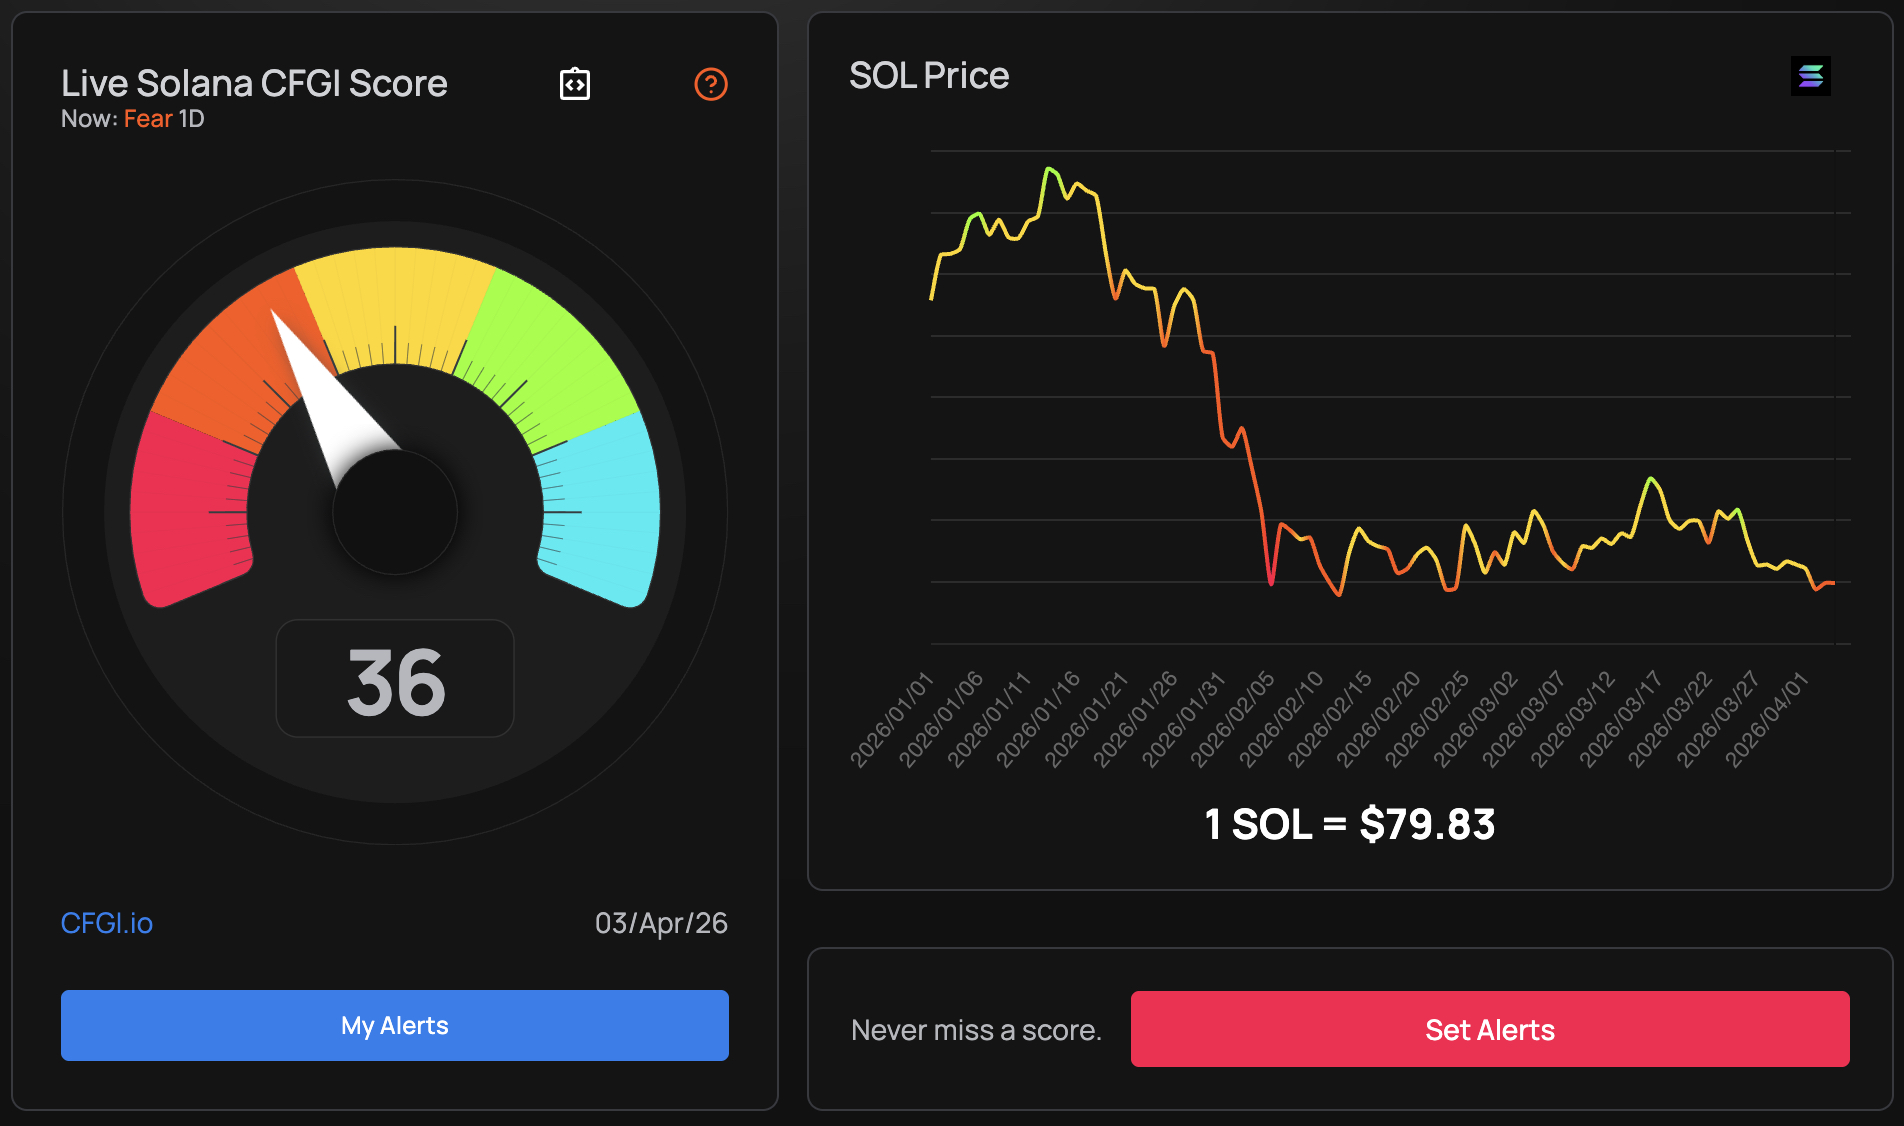
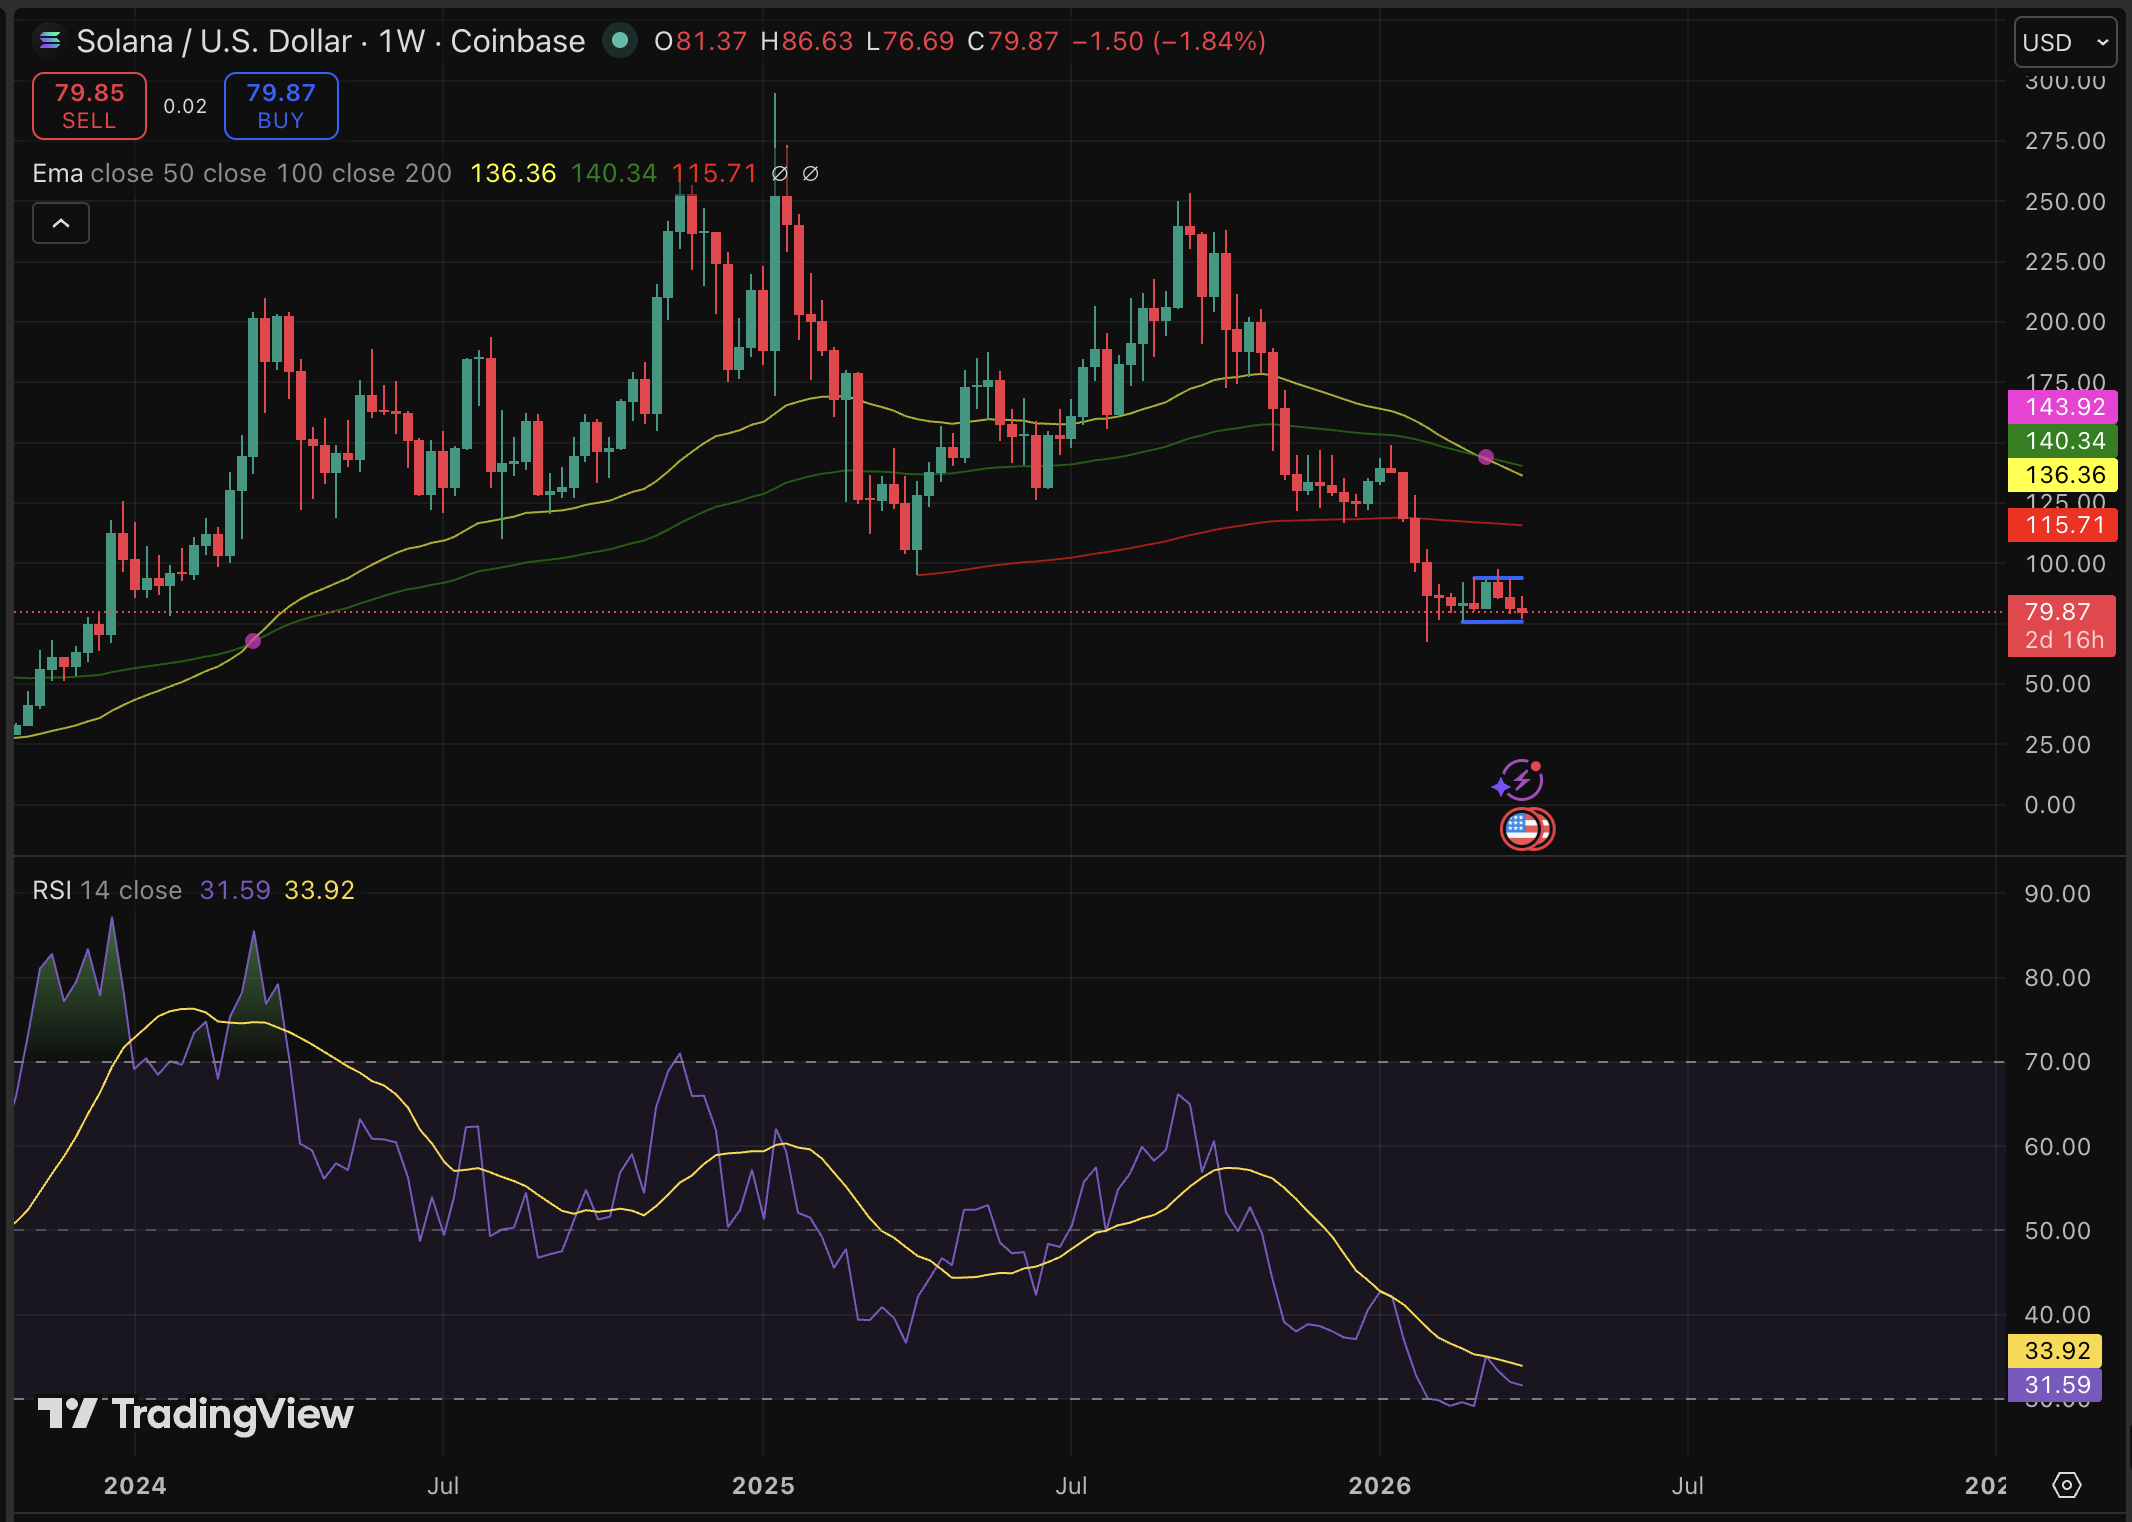
SOL’s technical picture is unambiguously bearish. The RSI sits at 32 on the daily, approaching oversold, but it looks like bears haven’t exhausted themselves just yet. The 50-day SMA at $117 is overhead resistance; the 200-day SMA at $30 is dropping to the 100-day SMA. Only 13% of technical signals read bullish, with the Fear & Greed Index locked at 29 for 46 consecutive days.

The critical level is $85, and failure to reclaim it confirms the breakdown. Analyst warns a sustained break below $85 opens a flush toward the $50–$30 Fair Value Gap accumulation zone. Network revenue remains 93% below January peaks, undermining any near-term fundamental rebound argument.
The exploit doesn’t erase Solana’s infrastructure roadmap. It does reset near-term trust, and trust is priced faster than fundamentals.
Discover: The best pre-launch token sales
Maxi Doge Targets Early-Mover Upside as Solana Tests Key Levels
SOL at $80 is a setup, but it’s also a waiting game with real downside risk attached. Traders rotating out of established-layer-one volatility are increasingly eyeing early-stage presales where entry price, not recovery timing, does the heavy lifting.
Maxi Doge ($MAXI) is one attracting attention. Built on Ethereum (ERC-20), the project packages a 240-lb canine mascot with genuine community mechanics: holder-only trading competitions with leaderboard rewards, a Maxi Fund treasury dedicated to liquidity and partnerships, and a meme-first marketing engine built around gym-bro culture and the tagline “Never skip leg-day, never skip a pump.”
It’s unambiguously meme-first, which, in this market, is exactly where retail attention is rotating. We know risk-off macro tends to funnel speculative capital toward low-cap narratives, not $80 SOL recovery bets.
Hard numbers: current presale price is $0.0002811, with $4.7 million raised to date and 66% staking APY as a bonus.
Research Maxi Doge before the next price increase.
This article is not financial advice. Crypto markets are highly volatile. Always conduct your own research before investing.
The post Solana Price Prediction: After The Exploit, Is The Network Still Safe? Will Price Recover? appeared first on Cryptonews.
Crypto World
Cardano Climbs the Google Quantum AI Rankings Above Ethereum as the Security Discussion Heats Up

Key Insights
- In Google Quantum AI report, Cardano was ranked above Ethereum as it showed better quantum resistance.
- Exposed wallets and vulnerable smart contracts are major risks to Ethereum.
- The UTXO model used by Cardano provides increased resistance to quantum attacks in the long term.
Cardano was mentioned 5 times (plus 3 citations) on the Google Quantum AI whitepaper.
And it was ranked in the second-best tier for quantum resistance, right behind purpose-built quantum-proof chains.
Above Ethereum. Above Solana. Above XRP.
The UTXO architecture gives Cardano…
— Dan Gambardello (@dangambardello) April 1, 2026
Cardano Making Progress in Google Quantum AI Report
The recent Google Quantum AI whitepaper has rattled the crypto sector with the ranking of Cardano over Ethereum in quantum resistance. The results confused most investors and developers particularly considering the fact that Ethereum had dominated the decentralized applications and smart contracts.
The report stated that Cardano has performed better than Ethereum as well as Solana and XRP, which were ranked in the second-best rank in the field of quantum resilience. Quantum-proof blockchains were only ranked higher by specially designed blockchains.
This acknowledgement is an important achievement of Cardano, which supports the reputation of the blockchain as a research-based and security-oriented one.
The whitepaper mentions Cardano several times, indicating the increasing academic and institutional attention to its architecture. These results are now leading to a more general re-evaluation of the way blockchains need to be ready against future quantum threats.
The UTXO Model of Cardano Is Unique Because of the Following Reasons
The use of the UTXO (Unspent Transaction Output) model is one of the largest strengths of Cardano. UTXO structures provide greater transaction exposure and wallet security compared to the account-based system of Ethereum.
Public keys are not incessantly revealed in the system of Cardano following transactions. This minimizes the attack surface that quantum computers may utilize in future. Cardano offers extra protection to users because of its ability to make sensitive cryptographic data harder to see by restricting the time that the data is in view.
On the contrary, Ethereum design reveals the public keys after a transaction. These keys are stored on the blockchain permanently, which provides a long-term weakness. With the development of quantum computing, this design decision might be a significant security threat.
The results of Google give indirect support to the strategy adopted by Cardano and imply that the architecture would be more resistant to upcoming quantum threats. This competitive edge makes Cardano a good competitor in the dynamic blockchain security market.
The Structural Risks of Ethereum Get into Focus
The same report cast serious doubt on the strength of Ethereum during a quantum computing era. Five possible attack vectors were described by researchers, which focus on various elements of the network.
Wallet exposure is one of the most urgent problems. The report approximates the number of ETH already in wallets with exposed public keys to be 20.5 million. In case a quantum computer powerful enough appears, these wallets would be broken in the nearest future, which may be in a few minutes per key.
The wallets with high value are especially vulnerable. Tens of billions of dollars of digital assets could be at risk with a potential of being exposed to dozens of major wallets. More vulnerabilities are also brought about by the smart contract ecosystem of Ethereum.
Most of the smart contracts that are run by an administration, such as stablecoins and token issuance, use a set of cryptographic standards that might not resist quantum attacks. The report indicates that there are approximately 70 large contracts that are in this high risk category.
The Future of Ethereum
These risks are not being overlooked by Ethereum developers. As a reaction, a post-quantum research program was initiated earlier this year, with a long-term upgrade roadmap expected to be completed by 2029. The plan will contain various hard forks that will enhance the cryptographic defenses.
Nevertheless, these upgrades are associated with enormous challenges. The current smart contracts cannot be updated automatically through the network. Every protocol should update its codebase separately, adopt new cryptographic standards, and change keys in the cases when it is required.
This piecemeal system may slow the adoption and expose sections of the ecosystem to long durations. Other projects can postpone or even skip upgrades, which exposes the risk window.
A Movement toward Structural Resilience
The results of Google Quantum AI have changed the discussion to long-term security instead of short-term performance. Although Ethereum remains the most widely used and innovative, its architecture is under greater scrutiny now.
Cardano, in its turn, enjoys the advantage of being founded on formal approaches and proactive security standards. Its model is based on UTXO and eliminates the need for more intricate upgrades and quantum threats.
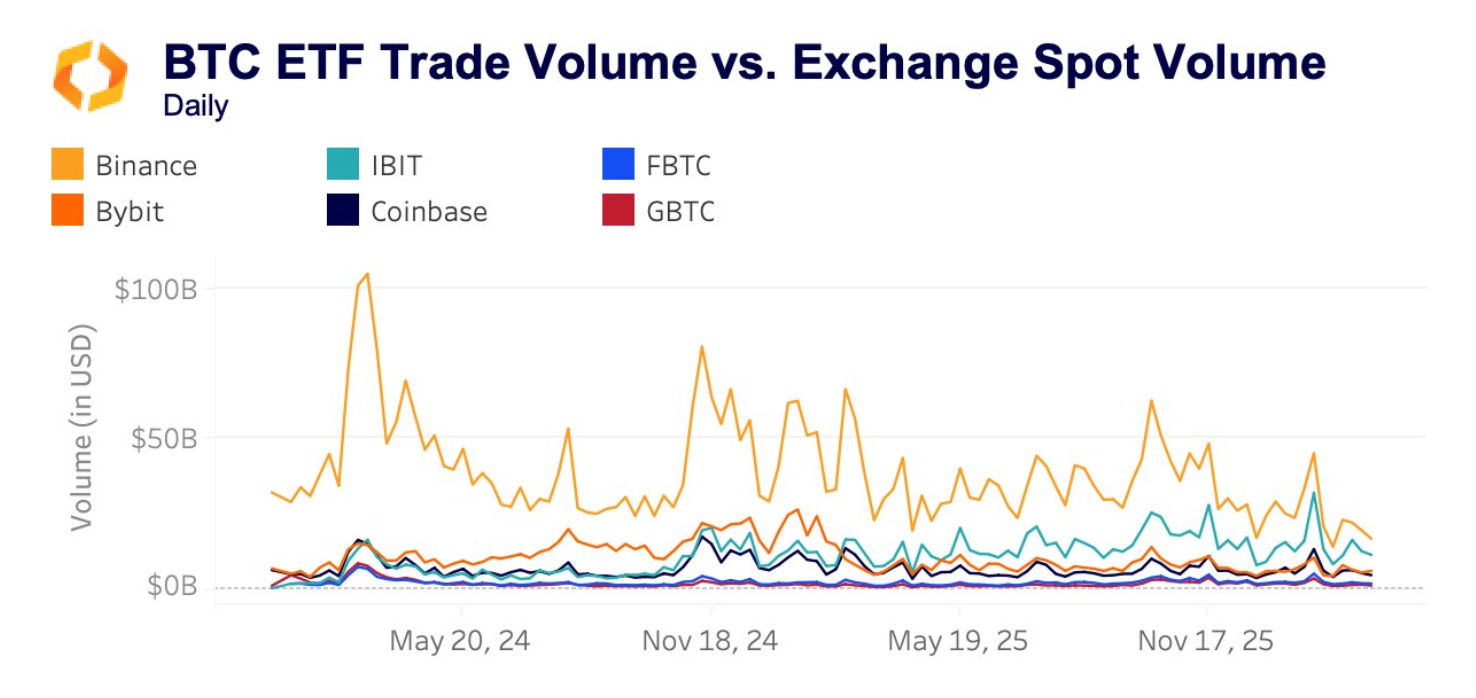
BlackRock’s iShares Bitcoin Trust (IBIT) now processes between $16 billion and $18 billion in daily trading volume, positioning the regulated fund as a direct competitor to the world’s largest crypto exchanges.
The data, reported by analytics firm Kaiko, signals that institutional-grade products are pulling liquidity away from crypto-native platforms at a pace few anticipated.
A Regulated Giant Takes on Crypto Exchanges
IBIT’s daily turnover now more than doubles the $6 billion to $8 billion that Coinbase processes on its spot market.
The figure also approaches Binance’s spot trading activity, long considered the benchmark for global crypto liquidity.
The shift suggests regulated financial products are becoming competitive alternatives to traditional cryptocurrency exchanges. For an ETF that launched in January 2024, the speed at which IBIT has scaled is striking.
BlackRock’s fund commands roughly 70% market share by volume among U.S. spot Bitcoin (BTC) ETFs.
That dominance has only grown as institutional allocators increase their exposure through listed products rather than direct exchange access.
Q1 2026 Tested ETF Conviction
Despite IBIT’s trading volume surge, broader ETF flows told a more complicated story during the first quarter.
Spot Bitcoin ETFs saw $496.5 million in net outflows during Q1, with $1.8 billion leaving in the first two months.
Bitcoin fell 23.8% in Q1 2026, its worst first-quarter performance since 2018. The selloff, compounded by geopolitical tensions in the Middle East and the Federal Reserve’s cautious policy, triggered heavy redemptions in January and February.
However, figures from SoSoValue show that the funds added $1.32 billion in March and ended a dry spell that had lasted since October 2025. March’s reversal marked the first monthly gain for spot BTC ETFs in 2026.
On April 2, U.S. spot Bitcoin ETFs recorded a modest $8.99 million in total net inflows, led by Fidelity’s FBTC with $7.29 million.
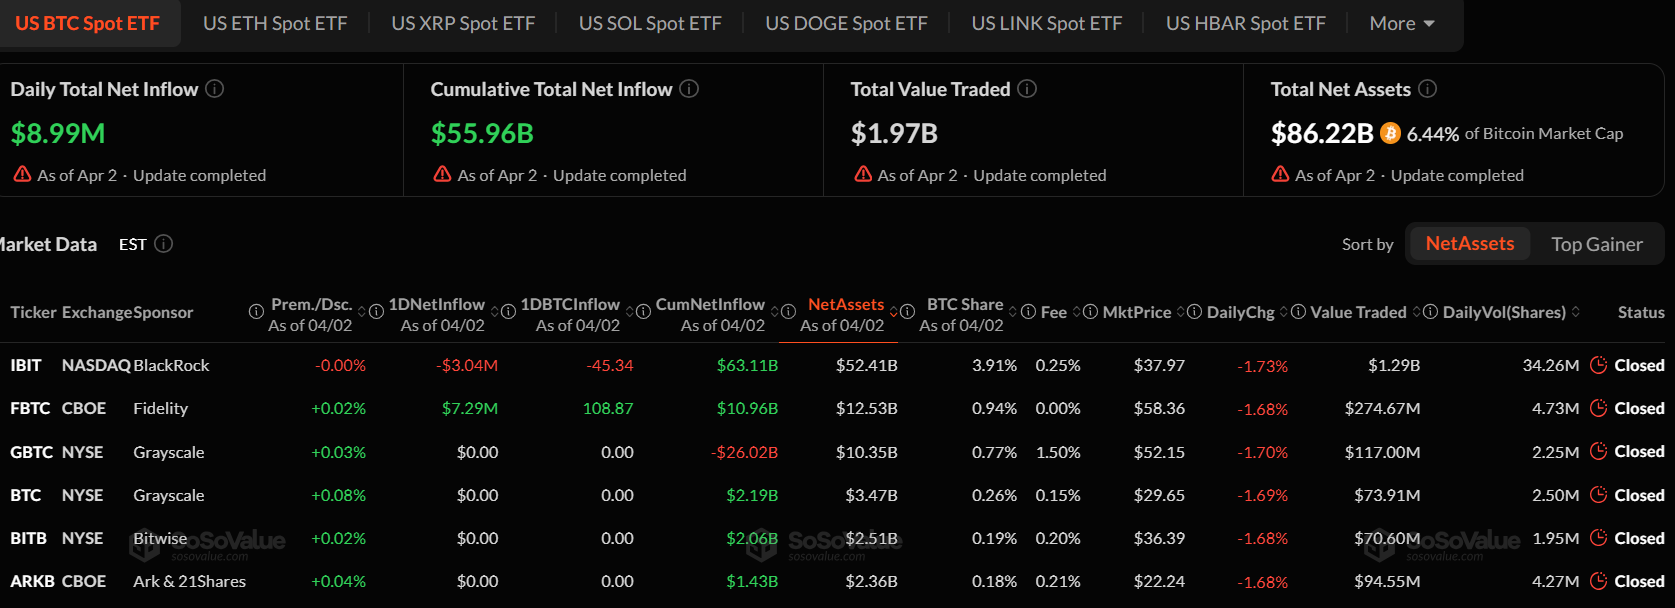
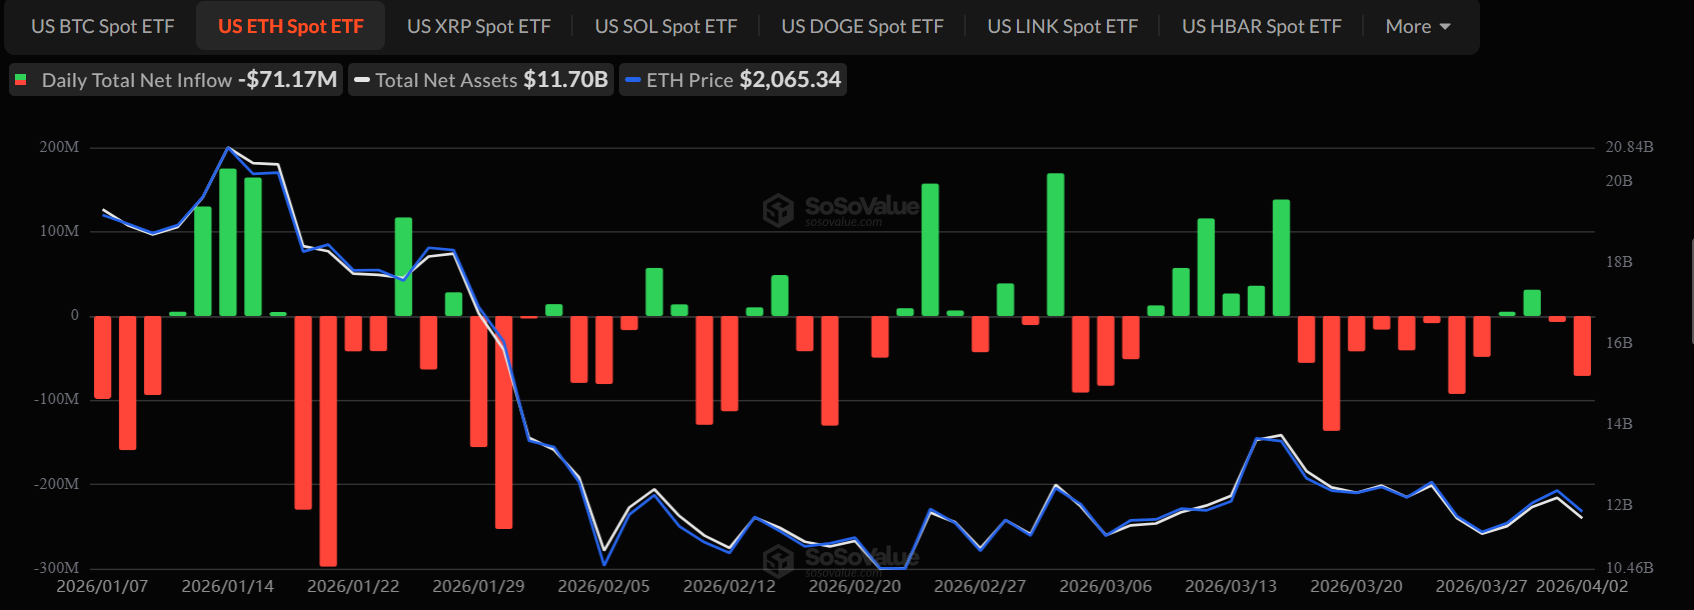
Spot Ethereum ETFs, meanwhile, posted $71.17 million in net outflows, with BlackRock’s ETHA seeing the largest single-day withdrawal at $46.66 million.
What Comes Next for ETF Flows
The contrast between IBIT’s surging volume and the broader category’s uneven flows raises an important question.
- Trading activity does not always equal fresh capital entering the market.
- High volumes can also reflect hedging, rebalancing, or short-term positioning.
Spot Bitcoin ETFs closed Q1 as their second-worst quarterly performance since launch, only behind Q4 2025’s $1.15 billion in cumulative outflows.
Whether April sustains March’s momentum or reverts to the pattern seen earlier in the quarter will likely depend on macroeconomic signals and BTC price stability.
In the meantime, IBIT’s ability to match crypto-native exchange volumes confirms that the line between TradFi and digital asset markets continues to blur.
The post BlackRock’s Bitcoin ETF Now Rivals Binance, Doubling Coinbase in Daily Volume appeared first on BeInCrypto.
Key Highlights
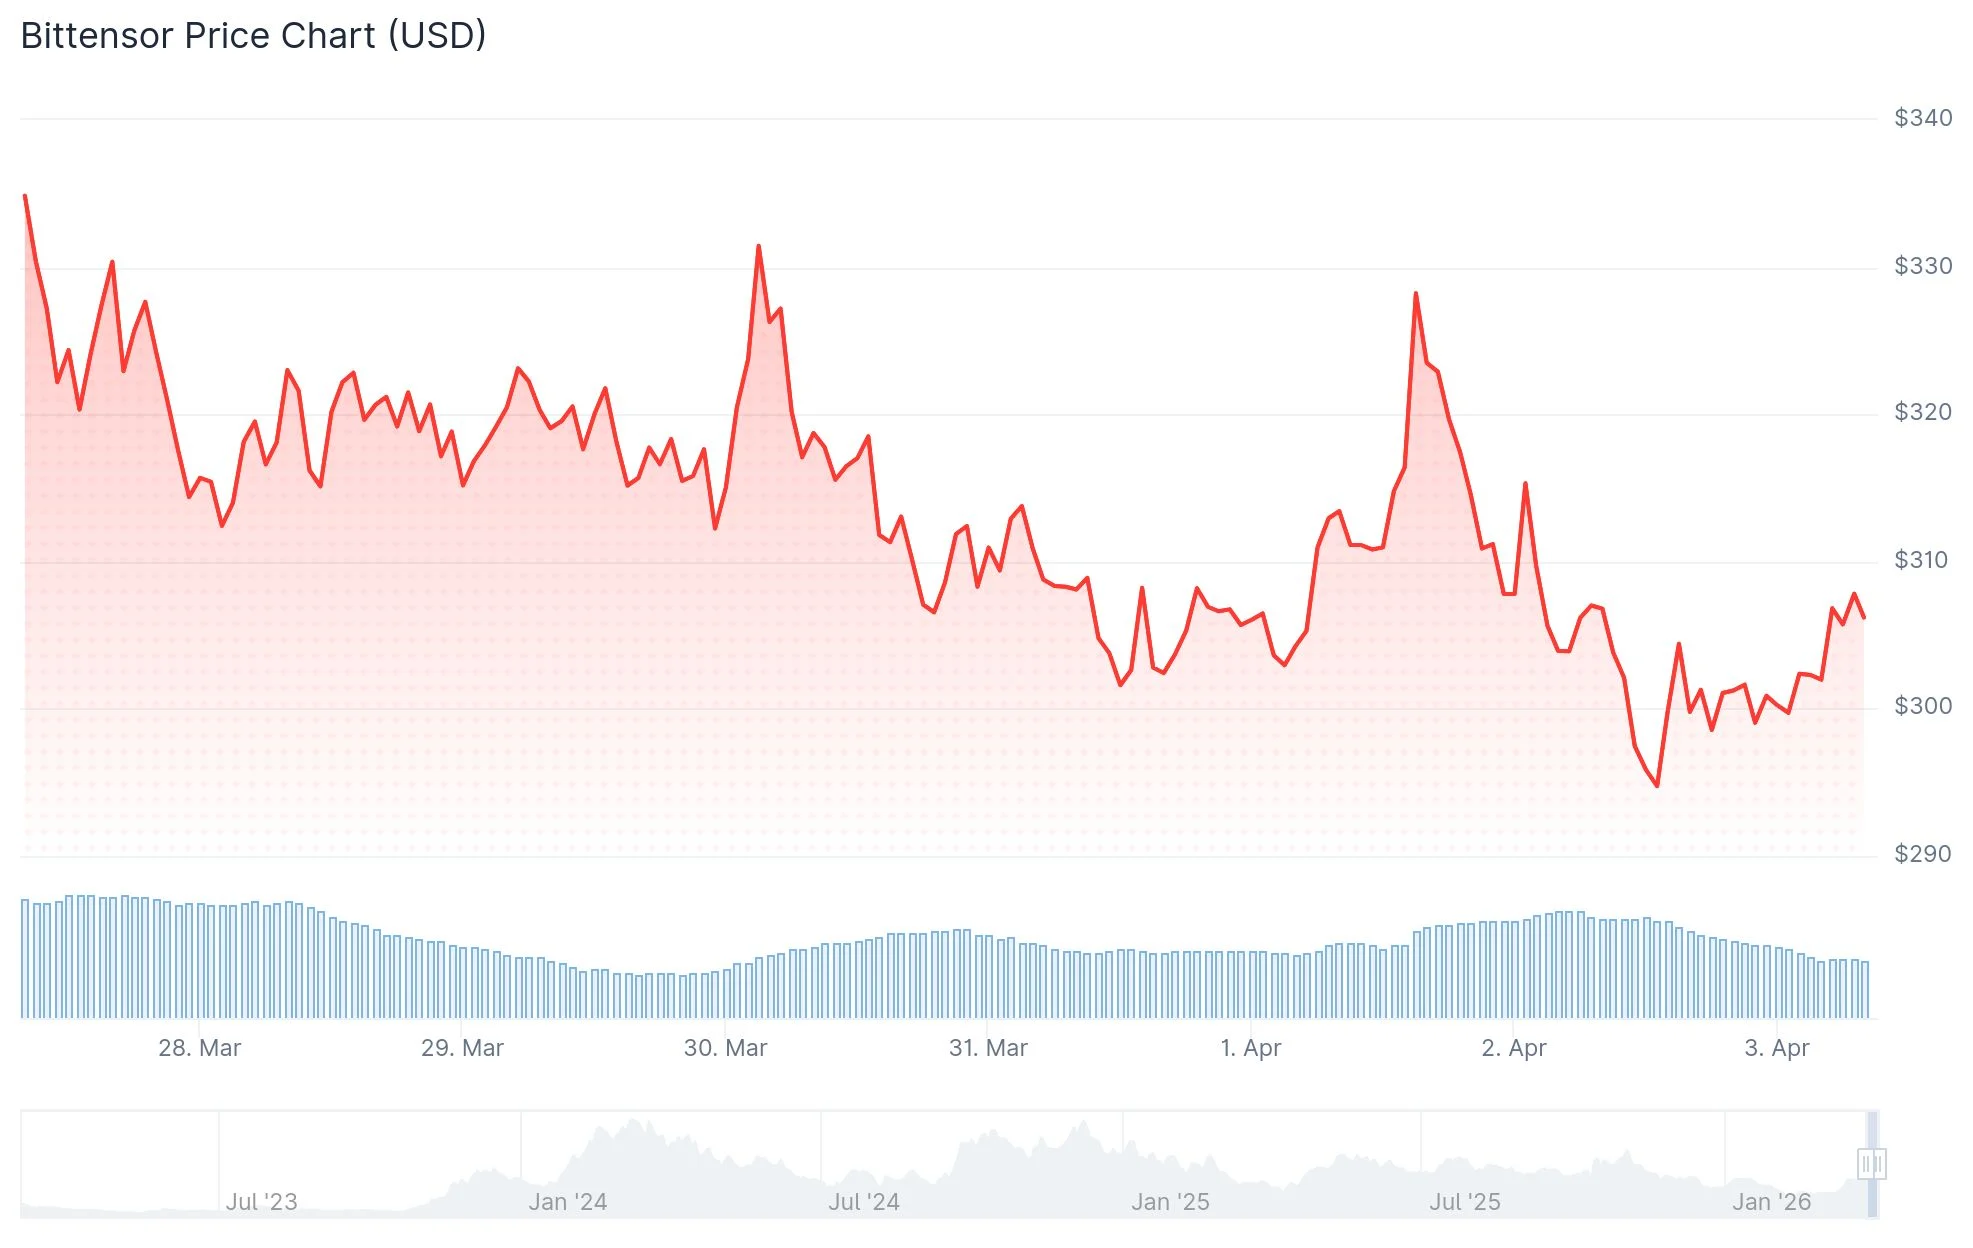
- Bittensor’s TAO token experienced a near-doubling in value throughout March, reaching around $317 with a market capitalization exceeding $3 billion
- Subnet 3 of the Bittensor network unveiled Covenant-72B, a large language model with 72 billion parameters developed through over 70 decentralized nodes
- Covenant-72B achieved a 67.1 score on the MMLU evaluation, performing comparably to Meta’s Llama 2 70B model
- Grayscale submitted an amended S-1 registration statement to the SEC for establishing a Bittensor (TAO) Trust
- More than 68% of TAO’s 10.7 million token supply is locked in staking
The TAO token from Bittensor experienced remarkable growth throughout March 2026, with its value nearly doubling to reach approximately $317. This substantial price movement propelled the network’s overall market capitalization beyond the $3 billion threshold.

This significant price appreciation occurred alongside a groundbreaking technical achievement within the Bittensor network. The development team behind Subnet 3 unveiled Covenant-72B, an impressive language model containing 72 billion parameters that was trained using a network of more than 70 geographically distributed nodes.
The model demonstrated its capabilities by achieving a 67.1 score on the MMLU benchmark, an industry-standard evaluation metric for assessing large language model performance. This performance level positions Covenant-72B competitively alongside Meta’s Llama 2 70B model.
The achievement marked a significant validation point, demonstrating that decentralized, permissionless artificial intelligence training infrastructure can deliver performance metrics comparable to traditional centralized approaches. Previously, distributed training methodologies faced skepticism regarding their viability, with critics arguing they were inherently too inefficient and disjointed for practical applications.
The primary subnet token associated with this breakthrough, τemplar (SN3), experienced explosive growth exceeding 400% over the preceding month, achieving a market valuation approaching $130 million.
Expanding Ecosystem Activity Beyond Covenant-72B
The wider Bittensor subnet infrastructure experienced notable developments across multiple projects. Targon (SN4), which operates as a decentralized marketplace for GPU computational resources under Manifold Labs’ management, successfully negotiated a substantial six-figure partnership to provide infrastructure for Dippy AI’s operations, a platform serving 8.6 million active users.
The GMCI AI Index, a composite metric tracking leading AI-focused cryptocurrency tokens, experienced a 48% appreciation since early February. Bittensor holds a substantial 24.89% allocation within this index and served as the primary catalyst for the overall performance.
The index composition also features Render (RNDR) and Artificial Superintelligence Alliance (ASI), with these three assets collectively representing more than 71% of total index weighting. However, despite recent positive momentum, the index continues trading 84% below its peak valuation established during the first quarter of 2024.
Grayscale Advances SEC Registration for TAO Trust
On April 3, 2026, Grayscale filed an amended S-1 registration statement with the Securities and Exchange Commission for a Bittensor (TAO) Trust. The investment vehicle is designed as a passive holding structure that maintains TAO tokens and provides investors with exposure to the token’s price performance through tradable trust shares.
Bittensor’s circulating supply currently stands at 10.7 million TAO tokens. More than 68% of this available supply is currently committed to staking mechanisms.
The launch of Covenant-72B alongside Grayscale’s regulatory filing constitute the most significant recent catalysts for TAO token price action as of April 3, 2026.

Crypto World
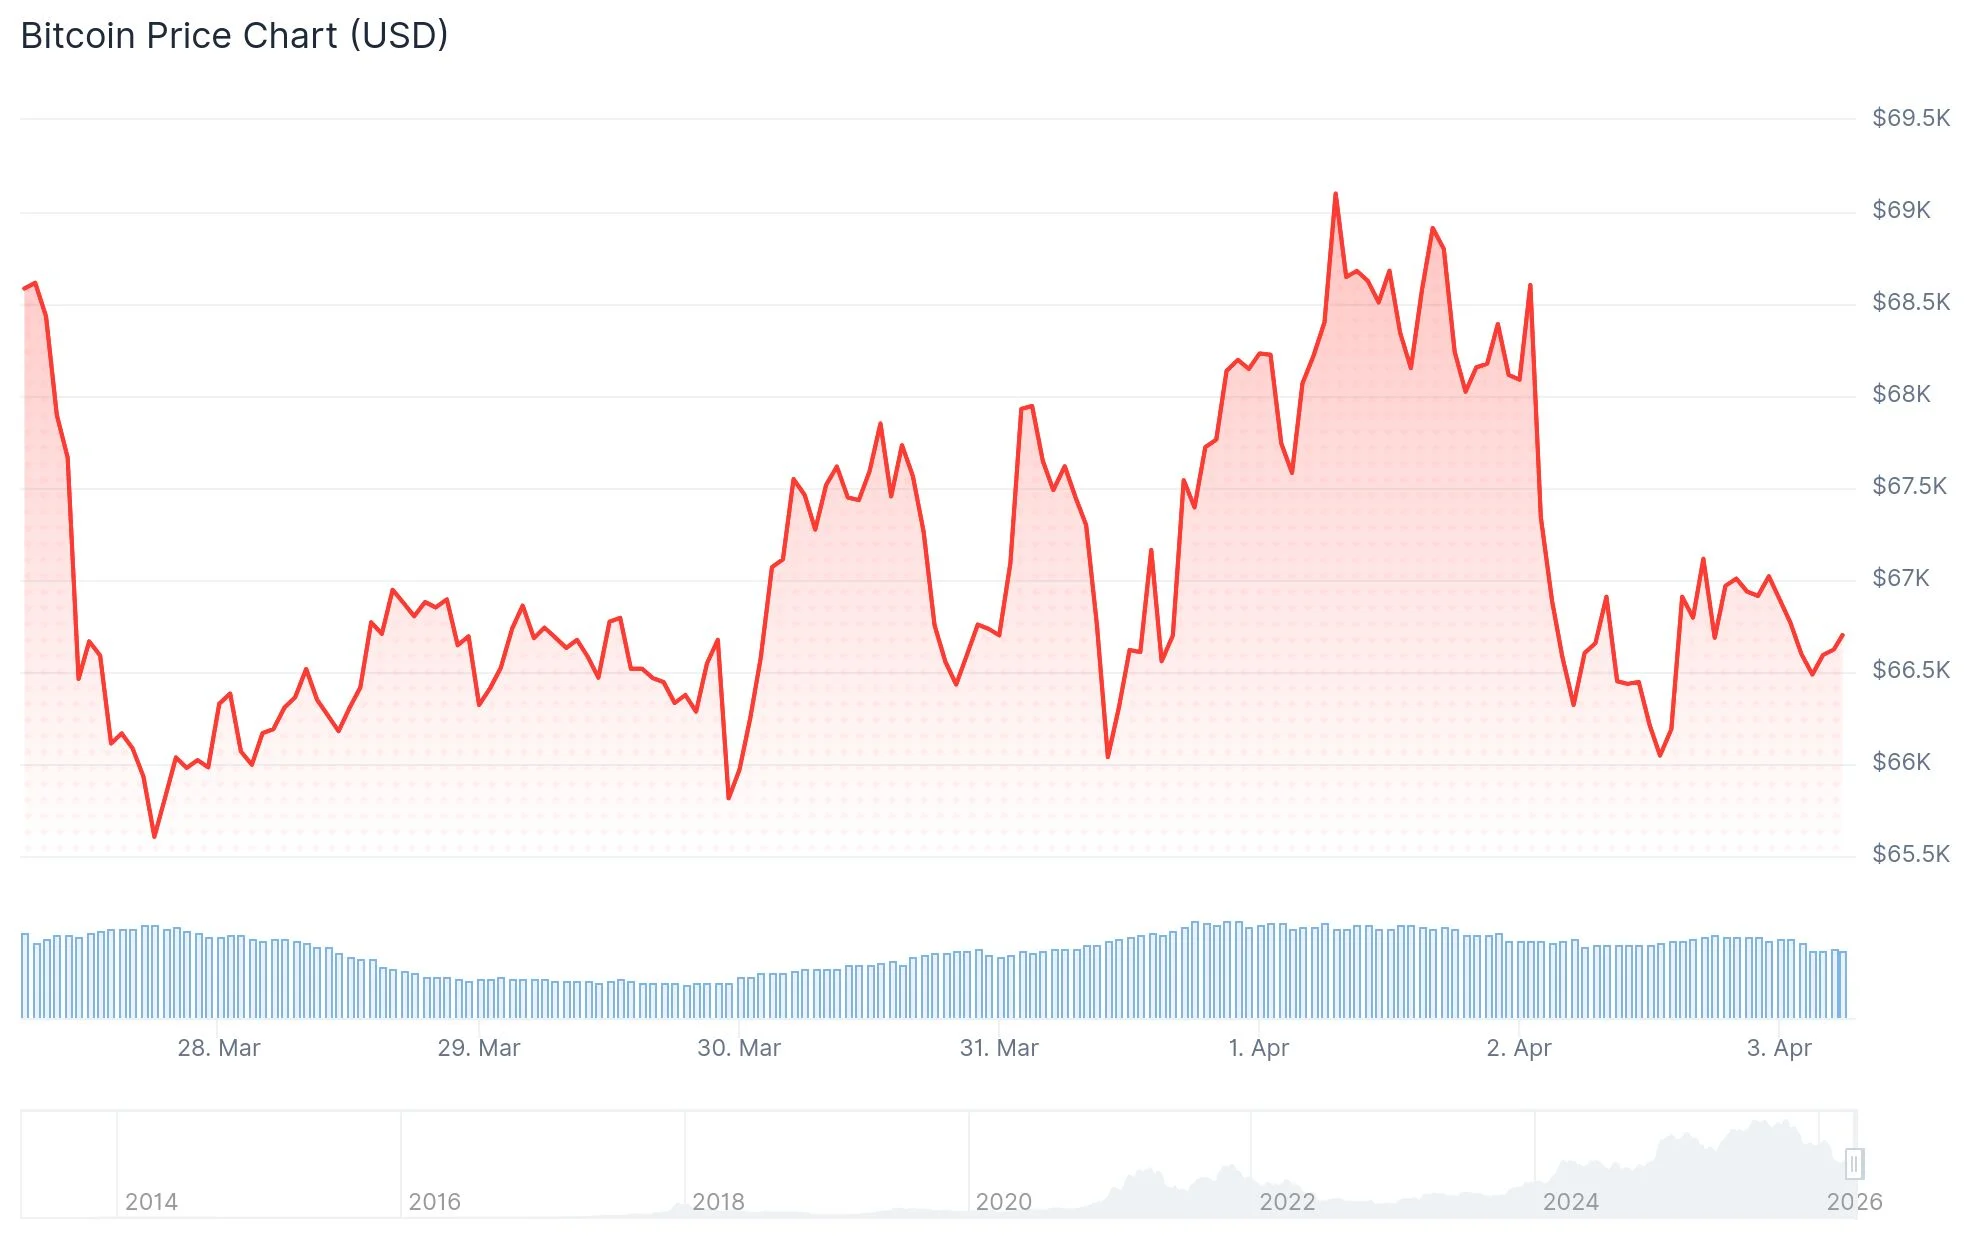
Bitcoin (BTC) Dips Below $67K as Markets Enter Easter Break While Oil Hits 11% Single-Day Surge

Key Takeaways
- Bitcoin hovers near $66,600 as Good Friday shuts down CME futures and ETF trading
- Net Bitcoin demand dropped to -63,000 BTC despite record ETF and corporate buying reaching multi-month peaks
- Major holders have shifted to distribution mode, with 1,000–10,000 BTC wallets declining by approximately 188,000 BTC from highs
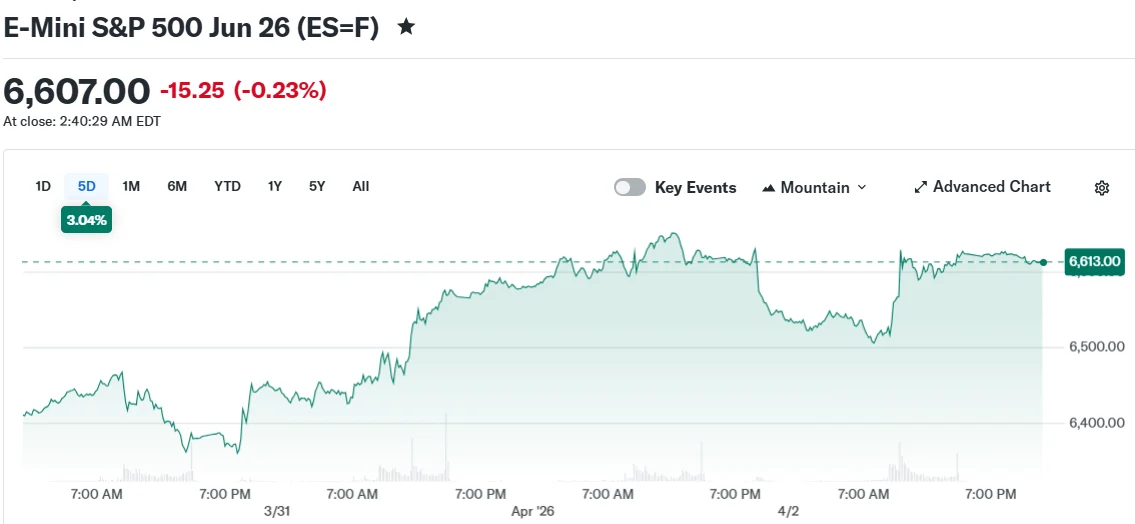
- U.S. equities broke their five-week downtrend, with both S&P 500 and Nasdaq posting modest weekly gains
- WTI crude oil exploded 11% to reach $111.54, marking its biggest single-day dollar increase in over four decades
As Easter weekend approaches, Bitcoin finds itself on shaky ground while traditional equity markets managed to eke out modest gains after an extended selloff.
[[LINK_START_2]]Bitcoin[[LINK_END_2]] was hovering around the $66,600 mark on Thursday as Good Friday holiday closures shuttered both CME futures and ETF trading platforms. This pause eliminates two critical demand channels precisely when buying momentum has already weakened considerably.
According to CryptoQuant analytics, 30-day apparent demand has fallen to approximately -63,000 BTC. This negative reading persists despite ETF purchases reaching roughly 50,000 BTC during the past month—the strongest level observed since October 2025.
Strategy, the prominent corporate Bitcoin accumulator, acquired approximately 44,000 BTC during this same timeframe. However, selling pressure from other market participants proved substantial enough to offset these significant inflows.
Whale Wallets Shift to Distribution
The most significant pressure indicator emerges from large-scale wallet activity. Addresses containing between 1,000 and 10,000 BTC have pivoted toward net selling behavior. Their annual balance shift declined to roughly -188,000 BTC, contrasting sharply with the positive 200,000 BTC recorded at the 2024 cycle top.
Medium-tier holders have similarly decelerated their accumulation patterns. The Coinbase Premium indicator has remained in negative territory, typically signaling diminished appetite among U.S. spot market participants.
Singapore-headquartered market maker Enflux informed CoinDesk that Bitcoin’s downside protection remains partially anchored to Federal Reserve rate cut expectations. This foundational support is currently facing significant testing.
The ISM prices-paid metric surged to 78.3 in March, reaching its highest point since June 2022. Such elevated readings diminish the likelihood of imminent rate reductions, thereby pressuring Bitcoin’s macro-supported price foundation.
ETF movement patterns already mirror this transition. The week ending March 24 recorded $296 million in net ETF withdrawals. Early April inflows have remained subdued.
CryptoQuant identified a resistance band spanning $71,500 to $81,200 for any potential recovery bounce. The upcoming critical data release is U.S. core PCE inflation scheduled for April 9.
Equity and Energy Markets
U.S. stock markets concluded the week with gains despite Thursday’s challenging trading session. The Dow Jones Industrial Average declined 61 points during Thursday’s action, yet all three primary indexes finished the week positively, ending a five-week consecutive losing streak.
The trading day was characterized by an extraordinary movement in crude oil markets. West Texas Intermediate crude concluded trading at $111.54, representing an 11% daily advance. The $11.42 dollar gain constitutes the largest single-session increase in WTI records extending back to 1983.
The price explosion followed President Trump’s address regarding the Iranian conflict situation, which failed to provide fresh details on resolving the Strait of Hormuz closure.
J.P. Morgan strategist Fabio Bassi projected that oil prices will likely maintain elevated levels throughout the second quarter. He positioned near-term risk within the $120–$130 per barrel band, noting that prices exceeding $150 remain possible should Strait disruptions extend into mid-May.
Market participants will also monitor the March nonfarm payrolls data release, scheduled for Friday despite equity market closures. Economic forecasters anticipate employment growth to rebound following February’s weather- and strike-impacted results.

Key Highlights
- ALGO climbed more than 23% to reach an 8-week peak of $0.105 following 32 citations in Google Quantum AI’s research publication
- Google’s study positioned Algorand third behind Bitcoin and Ethereum for post-quantum security initiatives
- Open interest in futures contracts spiked 55% to reach $58.9 million, while funding rates shifted to bullish territory
- Swiss banking institution PostFinance integrated Algorand, providing 2.5 million clients with direct ALGO access
- Revolut launched ALGO staking capabilities on March 30, opening opportunities for its 70+ million user base
On April 1, Algorand reached $0.105, marking its highest price point in eight weeks with daily gains exceeding 23%. This dramatic price movement occurred merely 48 hours after the cryptocurrency touched its record low.
The catalyst behind this surge was a newly published research document from Google Quantum AI. The study examined quantum computing vulnerabilities across leading blockchain networks. Algorand received 32 references throughout the paper, securing third place behind only Bitcoin and Ethereum in terms of post-quantum cryptographic development efforts.
TIL: Google Quantum AI paper confirms Bitcoin & Ethereum are currently secure.
Algorand already running post-quantum Falcon signatures in production since 2025.
Staying ahead by design. $ALGO https://t.co/8Kv5CUO28D
— Dagnum P.I. (@Dagnum_PI) March 31, 2026
By comparison, Solana and XRP garnered approximately half the number of citations. Networks like Hedera and Avalanche were completely absent from the research findings.
This acknowledgment provided Algorand with significant market visibility. Traders who had observed the token reaching historical lows interpreted the Google citation as an opportunity to acquire positions at heavily discounted prices.
Major Platform Integrations Fuel Additional Momentum
Two significant partnership announcements contributed additional upward pressure to ALGO’s price action.
PostFinance, a prominent Swiss retail banking institution, incorporated Algorand into its service offerings. The integration enables the bank’s 2.5 million account holders to purchase and store ALGO directly within their established banking infrastructure.
Additionally, Revolut introduced ALGO staking functionality beginning March 30. Given Revolut’s global user base exceeding 70 million individuals, this development substantially expands accessibility for retail participants. Increased staking activity removes tokens from active circulation, potentially creating upward price pressure in the longer term.
Derivatives market metrics confirmed the legitimacy of the price rally. Data from CoinGlass indicated that futures open interest for Algorand surged 55% within 24 hours, climbing to $58.9 million. The weighted funding rate simultaneously turned positive, indicating that long position holders were compensating short traders — a clear indication of bullish market sentiment.
Critical Price Levels Under Trader Scrutiny
Chart analysis reveals that ALGO escaped from a descending parallel channel formation that had constrained upward movement throughout early 2025. The price successfully breached the 20-day, 50-day, and 100-day simple moving averages in rapid succession.
#ALGO wants some pump👀
Broke out of the weekly falling wedge🚀
🎯1 target: 0.1935$
🎯2 target: 0.2460$$ALGO pic.twitter.com/oXiFVrSMbI— Alex Clay (@cryptclay) April 1, 2026
The supertrend indicator transitioned to green, suggesting sustained near-term bullish momentum.
The critical resistance threshold sits at $0.138, corresponding with the 200-day SMA. Successfully breaking through this barrier could pave the way toward retesting previous annual peaks.
Cryptocurrency analyst Alex Clay identified $0.1935 and $0.2460 as subsequent targets should buying interest persist at current levels.
Conversely, if ALGO retreats beneath the 50-day SMA positioned at $0.088, the breakout pattern would be negated, potentially triggering a retest of the all-time low price level.
As of April 2, Algorand’s market capitalization registered at $950.5 million, accompanied by 24-hour trading volume totaling $158.7 million.
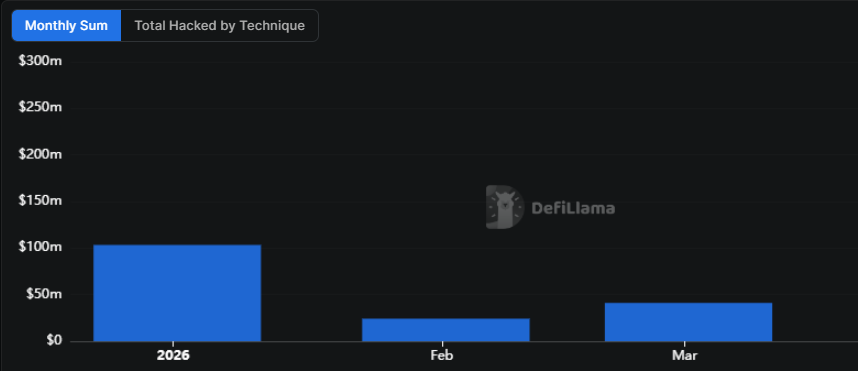
Crypto hackers stole over $168.6 million in cryptocurrency from 34 decentralized finance (DeFi) protocols in the first quarter of 2026, falling significantly from the same period last year, according to data from DefiLlama.
The $40 million private key compromise of Step Finance in January was the largest exploit of the quarter, the data shows, followed by a smart contract manipulation that drained $26.4 million in ether (ETH) from Truebit on Jan. 8. The third-largest was a private key compromise targeting stablecoin issuer Resolv Labs on March 21.
The quarterly figure is low given that the industry saw $1.58 billion stolen in the first quarter of 2025, with the bulk coming from the $1.4 billion Bybit exploit. However, experts warn that crypto hacks aren’t tied to specific periods within a year.

Hackers are more active when industry is booming
Nick Percoco, the chief security officer at crypto exchange Kraken, told Cointelegraph that cybercriminal activity in crypto tends to rise around market and event-driven cycles rather than fixed periods.
Threat actors are also drawn to areas where liquidity is concentrated, meaning attack spikes often follow wherever value is accumulating fastest, according to Percoco.
“Bull markets, major product launches and fast-moving growth phases all create more attractive conditions for attackers because more value is at stake and new infrastructure can introduce risk,” he said.
“That said, attacks are not confined to just these periods. Vulnerabilities can be exploited in any market environment, particularly in complex or rapidly evolving systems, underlining that security in crypto must be continuous.”
Crypto attackers are a “broad and evolving mix”
North Korea-linked actors have been a persistent threat to crypto investors and Web3-native companies alike.
Hackers affiliated with the organization have been suspected of numerous attacks, including the Wednesday attack on Drift Protocol, a decentralized cryptocurrency exchange that lost an estimated $285 million to a private key leak.
Related: Hacked crypto tokens drop 61% on average and rarely recover, Immunefi report says
Percoco said the threat landscape is a mix of actors with different levels of sophistication, highly coordinated groups targeting core infrastructure, organized cybercriminal networks and opportunistic hackers scanning for weaknesses in smart contracts and client-facing systems.
“It is a broad and evolving mix, but they are ultimately targeting the same thing: global, liquid and accessible value. Targeting is rarely purely random. In many cases, attackers are deliberate in how they assess infrastructure, code, access controls and even human behavior,” he said.
“At the same time, crypto’s transparency makes it easier for opportunistic actors to spot weaknesses as they emerge. The most attractive targets tend to be those combining large concentrations of value, technical complexity and gaps in operational security.”
Security experts previously told Cointelegraph that 2026 would likely see an increase in sophisticated credential theft, social engineering, and AI-powered attacks.
Magazine: All 21 million Bitcoin is at risk from quantum computers


Big Tech firms have come together to back a new industry body focused on standardizing how AI agents handle payments across crypto and traditional rails.
Summary
- Big Tech firms including Google, Microsoft and Amazon Web Services backed the launch of the x402 Foundation to standardize AI-driven payment infrastructure.
- The Linux Foundation introduced the initiative with Coinbase, placing the protocol under an open source and nonprofit structure.
The Linux Foundation on Thursday announced the launch of the x402 Foundation, a governance initiative built around the x402 protocol, with early support from companies including Google, Microsoft, and Amazon Web Services.
The project has been developed with input from Coinbase, which originally introduced the x402 protocol. A number of financial and blockchain firms have also signaled early backing, including American Express, Mastercard, Visa, Stripe, Circle, Solana Foundation, and Polygon Labs.
Support has also come from infrastructure and commerce platforms such as Cloudflare and Shopify, along with developer-focused firms like Thirdweb and regional payment provider KakaoPay.
According to Coinbase, placing the protocol under the Linux Foundation gives it a “neutral, nonprofit home,” that could eventually help attract support from tech firms and developers compared to a company banner.
Jim Zemlin, CEO of the Linux Foundation, pointed to the internet’s history of shared infrastructure, stating that “the internet was built on open protocols,” as he made the case for adopting a similar model for AI-driven payments.
The x402 protocol is designed as an open standard that allows AI agents and web services to execute payments on their own, covering use cases such as paying for APIs, accessing data, or purchasing digital services without human intervention.
Momentum around the concept has been building alongside expectations that machine-to-machine transactions could become a dominant force in crypto payment activity.
Brian Armstrong said recently that “there will be more AI agents transacting online than humans very soon,” aligning with earlier remarks from Jeremy Allaire, who projected that “literally billions of AI agents” could be active on-chain within three to five years.
Similarly, former Binance CEO Changpeng Zhao has argued that crypto is the “native currency for AI agents,” particularly for automated payments ranging from ticket purchases to recurring bills.
However, activity tied to the x402 protocol has yet to show steady growth. Data from Dune Analytics indicates that usage surged late last year before tapering off.
Weekly transaction counts climbed to about 13.7 million during the week of Nov. 4–10, followed by another 13.66 million the week after. Activity has since cooled, with weekly volumes ranging from roughly 29,000 to 1.1 million so far in 2026, pointing to uneven adoption despite strong backing from major industry players.
Crypto World
Cantor Equity Partners II (CEPT) Receives Bullish Analyst Rating Before Securitize Deal

Key Takeaways
- Investment firm Benchmark starts coverage on Cantor Equity Partners II (CEPT) with bullish Buy rating and sets $16 price objective.
- The SPAC is preparing to complete a merger with Securitize, a tokenization platform valued at $1.25 billion.
- Securitize commands approximately 70% market share in U.S. tokenization and manages BlackRock’s $2.2B BUIDL fund.
- Securitize and the New York Stock Exchange unveiled plans for a joint tokenized securities platform offering 24/7 trading capabilities.
- Analyst estimates the addressable market for real-world asset tokenization at $300 trillion globally.
CEPT was trading around $11 at the time of writing.
Cantor Equity Partners II, Inc. Class A Ordinary Share, CEPT
Investment banking firm Benchmark has launched coverage of Cantor Equity Partners II with a bullish outlook, highlighting the upcoming combination with Miami-headquartered tokenization specialist Securitize as a significant growth driver. Research analyst Mark Palmer established a $16 price objective, which assumes Securitize will achieve $178 million in annual revenue by late 2026.
Securitize provides a comprehensive platform for converting traditional real-world assets — including equities, fixed income securities, and investment funds — into blockchain-based digital tokens. Benchmark characterizes the company as an attractive “pure-play investment opportunity in the tokenization sector.”
The business combination between CEPT and Securitize was publicly disclosed in October 2024, establishing a $1.25 billion enterprise valuation for Securitize. Following transaction completion, the merged entity will trade on the Nasdaq exchange under the new ticker symbol SECZ.
Palmer highlighted robust revenue predictability for Securitize, noting that origination fees charged to companies tokenizing assets plus ongoing servicing income provide dependable cash flow. The analyst emphasized that Securitize’s platform-agnostic approach across multiple industries represents a strategic advantage.
“Securitize is really focused on providing the process behind tokenization, from origination through servicing, in a way that’s applicable to a breadth of industry verticals,” Palmer said.
Strategic Partnerships with BlackRock and NYSE Strengthen Market Position
Securitize currently operates BlackRock’s BUIDL fund, which stands as the industry’s largest tokenized money-market product at $2.2 billion in assets under management, deployed across eight blockchain networks including Ethereum and Solana. BlackRock previously spearheaded a $47 million strategic investment round in Securitize, creating what Benchmark identifies as a meaningful competitive moat.
Just last week, Securitize and the New York Stock Exchange revealed a strategic collaboration to develop a dedicated platform for tokenized securities that will enable continuous trading around the clock. This partnership positions Securitize as a central player in modernizing American capital markets infrastructure aligned with the SEC’s “Project Crypto” regulatory framework.
Benchmark analyst Palmer contends that Securitize’s technology stack offers distinct advantages over rivals by eliminating reliance on traditional clearing systems like the DTCC. This differentiates the company from competitors such as Figure Technologies, which completed its Nasdaq listing in September 2025 with a narrower focus on tokenized home equity credit products.
Massive $300 Trillion Market Opportunity
Benchmark calculates Securitize’s total addressable market at approximately $300 trillion — representing the aggregate value of real-world assets worldwide. Since the platform works across diverse asset classes and industries, Palmer noted the company faces no artificial ceiling from vertical-specific limitations.
“The concept here really is better and faster across the board,” Palmer told Decrypt. “It’s just a matter of time before the market begins to recognize the benefits both in terms of efficiency and settlement times.”
According to Benchmark’s research, Securitize maintains roughly 70% control of the tokenization market in the United States. This dominant market position, coupled with prestigious institutional partnerships, should enable the company to expand its competitive advantage as adoption accelerates.
CEPT shares were changing hands near $11 when Benchmark released its research report, representing significant discount to the analyst’s $16 price target.

When Radcliffe roads are set to close for gas mains works
De-dollarisation, war, and debt: Why gold is regaining monetary relevance
IMF Identifies 4 Risks Tokenized Finance Poses to Global Financial System


-

 NewsBeat6 days ago
The Story hosts event on Durham’s historic registers
-

 NewsBeat14 hours ago
Steven Gerrard disagrees with Gary Neville over ‘shock’ Chelsea and Arsenal claim | Football
-

 Sports6 days ago
Sweet Sixteen Game Thread: Tide vs Michigan
-
Entertainment4 days ago
Fans slam 'heartbreaking' Barbie Dream Fest convention debacle with 'cardboard cutout' experience
-
 Entertainment5 days ago
Lana Del Rey Celebrates Her Husband’s 51st Birthday In New Post
-
Crypto World3 days ago
Dems press CFTC, ethics board on prediction-market insider trades
-

 Crypto World1 day ago
Gold Price Prediction: Worst Month in 17 Years fo Save Haven Rock
-

 Tech4 days ago
The Pixel 10a doesn’t have a camera bump, and it’s great
-

 Sports3 days ago
Tallest college basketball player ever, standing at 7-foot-9, entering transfer portal
-

 Tech3 days ago
EE TV is using AI to help you find something to watch
-

 Business9 hours ago
No Jackpot Winner and $194 Million Prize Rolls Over
-

 Fashion5 days ago
Amazon Sundays: Soft Spring Layers
-

 Business1 day ago
Login and Checkout Issues Spark Merchant Frustration
-

 Crypto World3 days ago
U.S. rule change may open trillions in 401(k) funds to crypto
-

 Tech3 days ago
How to back up your iPhone & iPad to your Mac before something goes wrong
-

 Tech4 days ago
Avatar Legends: The Fighting Game comes out in July and it looks pretty slick
-

 Tech4 days ago
Apple will hide your email address from apps and websites, but not cops
-

 Politics4 days ago
Should Trump Be Scared Strait?
-

 Tech3 days ago
Flipsnack and the shift toward motion-first business content with living visuals
-

 Tech5 days ago
Elon Musk’s last co-founder reportedly leaves xAI
You must be logged in to post a comment Login