
Crypto World
Real Reason Why Bitcoin and Ethereum ETFs are Bleeding Now
The US Spot Bitcoin and Ethereum ETFs are seeing sustained outflows as investors rotate capital into international equities. Both crypto ETFs have seen only 2 weeks of positive inflows so far in 2026.
The shift comes amid rising Treasury yields, a resilient US labor market, and record inflows into global ex-US stock funds.
Sponsored
Sponsored
Money is Shifting to International ETF Markets
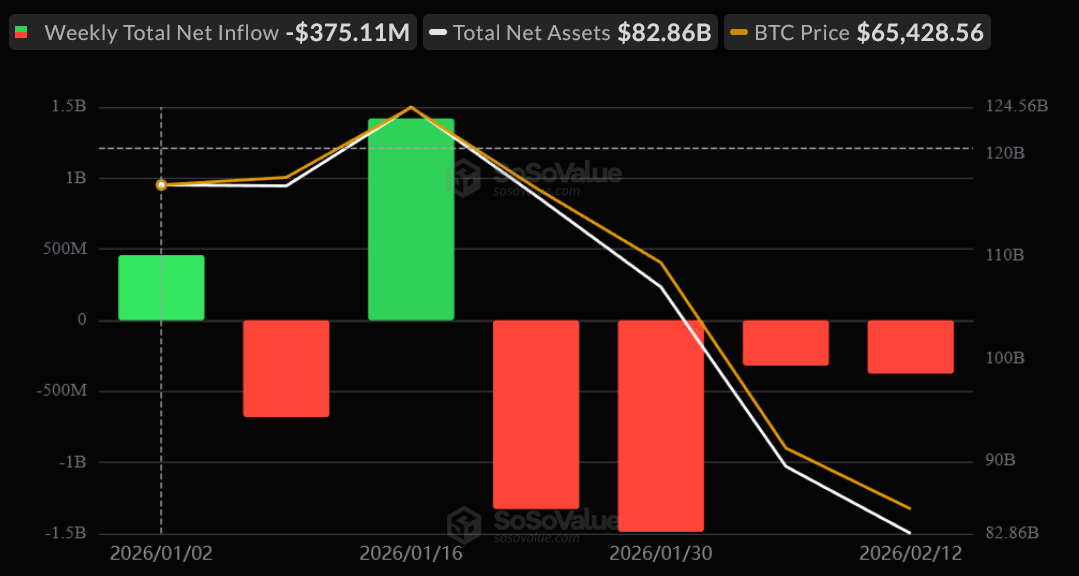
Over the past several weeks, US spot Bitcoin ETFs have moved into clear net outflow territory. Total assets have dropped sharply from recent highs near $115 billion to roughly $83 billion.
Ethereum ETFs show an even steeper contraction, with assets declining from around $18 billion to near $11 billion.
This is not random volatility. It reflects capital leaving the asset class.

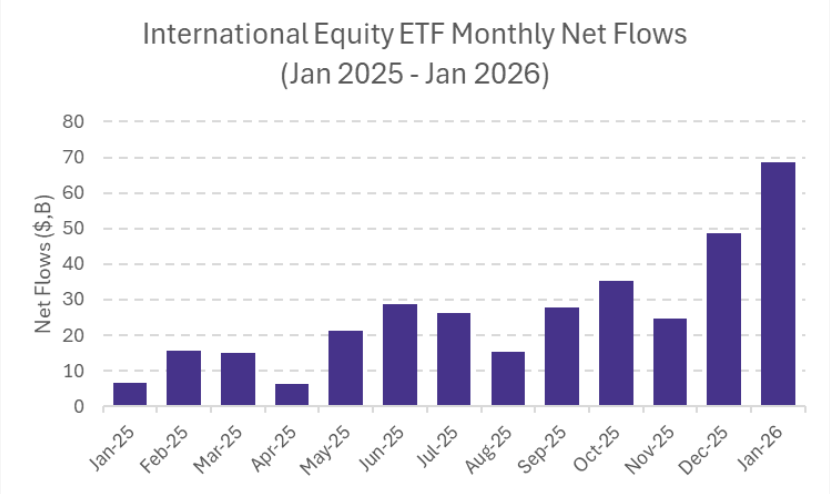
At the same time, international equity ETFs recorded their strongest inflows in years.
January saw record allocations into global ex-US funds, which absorbed roughly one-third of total ETF inflows despite representing a much smaller share of total assets.
That signals major rotation.
Sponsored
Sponsored
Institutional investors appear to be trimming exposure to crowded US growth trades — including crypto — and reallocating to cheaper overseas markets amid improving macro conditions abroad.
Meanwhile, stronger US jobs data pushed Treasury yields higher. Higher yields tighten financial conditions and increase the attractiveness of bonds relative to risk assets.
Bitcoin and Ethereum, which trade as high-beta liquidity plays, tend to weaken when capital moves toward safer or yield-generating assets.
The combination creates a structural headwind.
Crypto ETFs were a major source of demand in 2024, amplifying upward price moves through sustained inflows.
Now that mechanism is reversing. Instead of reinforcing rallies, ETFs are acting as distribution channels.
This does not invalidate the long-term crypto thesis. However, it weakens the short-term liquidity backdrop.
Until capital rotation slows or macro conditions ease, ETF outflows may continue to weigh on Bitcoin, Ethereum, and the broader crypto market.


Ethereum price rose nearly 7% on drawing closer to the $2,200 psychological resistance level after reports suggested that the U.S.-Iran war could end soon.
Summary
- Ethereum price rose nearly 7% to $2,153, rebounding from recent losses.
- Risk sentiment improved after signals of a possible ceasefire between Iran and the U.S.
- A cup and handle pattern has formed on the daily chart.
According to data from crypto.news, Ethereum (ETH) price rose to a six-day high of $2,153 on Wednesday, April 1.
The recovery followed after the leading altcoin fell nearly 16% from its monthly high of $2,360 to $1,972 earlier on Monday. The drop occurred amid growing uneasiness in the market due to the back-and-forth attacks between the U.S. and Iran. A ripple effect of it was the blockade at the Strait of Hormuz, a key maritime corridor that has pushed oil prices to record highs.
Ethereum price rebounded following reports that Iran’s president is willing to end the war with the U.S. and Israel if certain conditions are met.
While details of the demands are still not clear at the time of writing, they have previously called for more control in the Strait of Hormuz region, compensation for wartime damages on the nation, allowing it to continue its nuclear energy program, and a guarantee that the U.S. will not launch another attack on the country.
The U.S., for its part, has also signaled a potential ceasefire with Iran, even if the Strait of Hormuz remains closed, although Gulf countries like Saudi Arabia and the UAE have urged the U.S. to continue the war until the blockade is cleared.
Later today, U.S. President Donald Trump is set to give a speech where he will share major updates on Iran relations.
Notably, the impact of a potential resolution was already felt on energy markets as WTI oil prices dropped nearly 5% shortly following the report. Simultaneously, the crypto market surged along with U.S. equities such as the S&P 500.
Signs of de-escalation have offered Ethereum traders some short-term relief, easing the bearish pressure that emerged after Google’s quantum computing research raised concerns that Ethereum’s encryption could eventually be compromised.
On the daily chart, Ethereum price has formed a cup and handle pattern, a popular bullish continuation pattern in technical analysis. ETH price has recently broken out of the handle pattern, a sign that the upward trend is resuming.
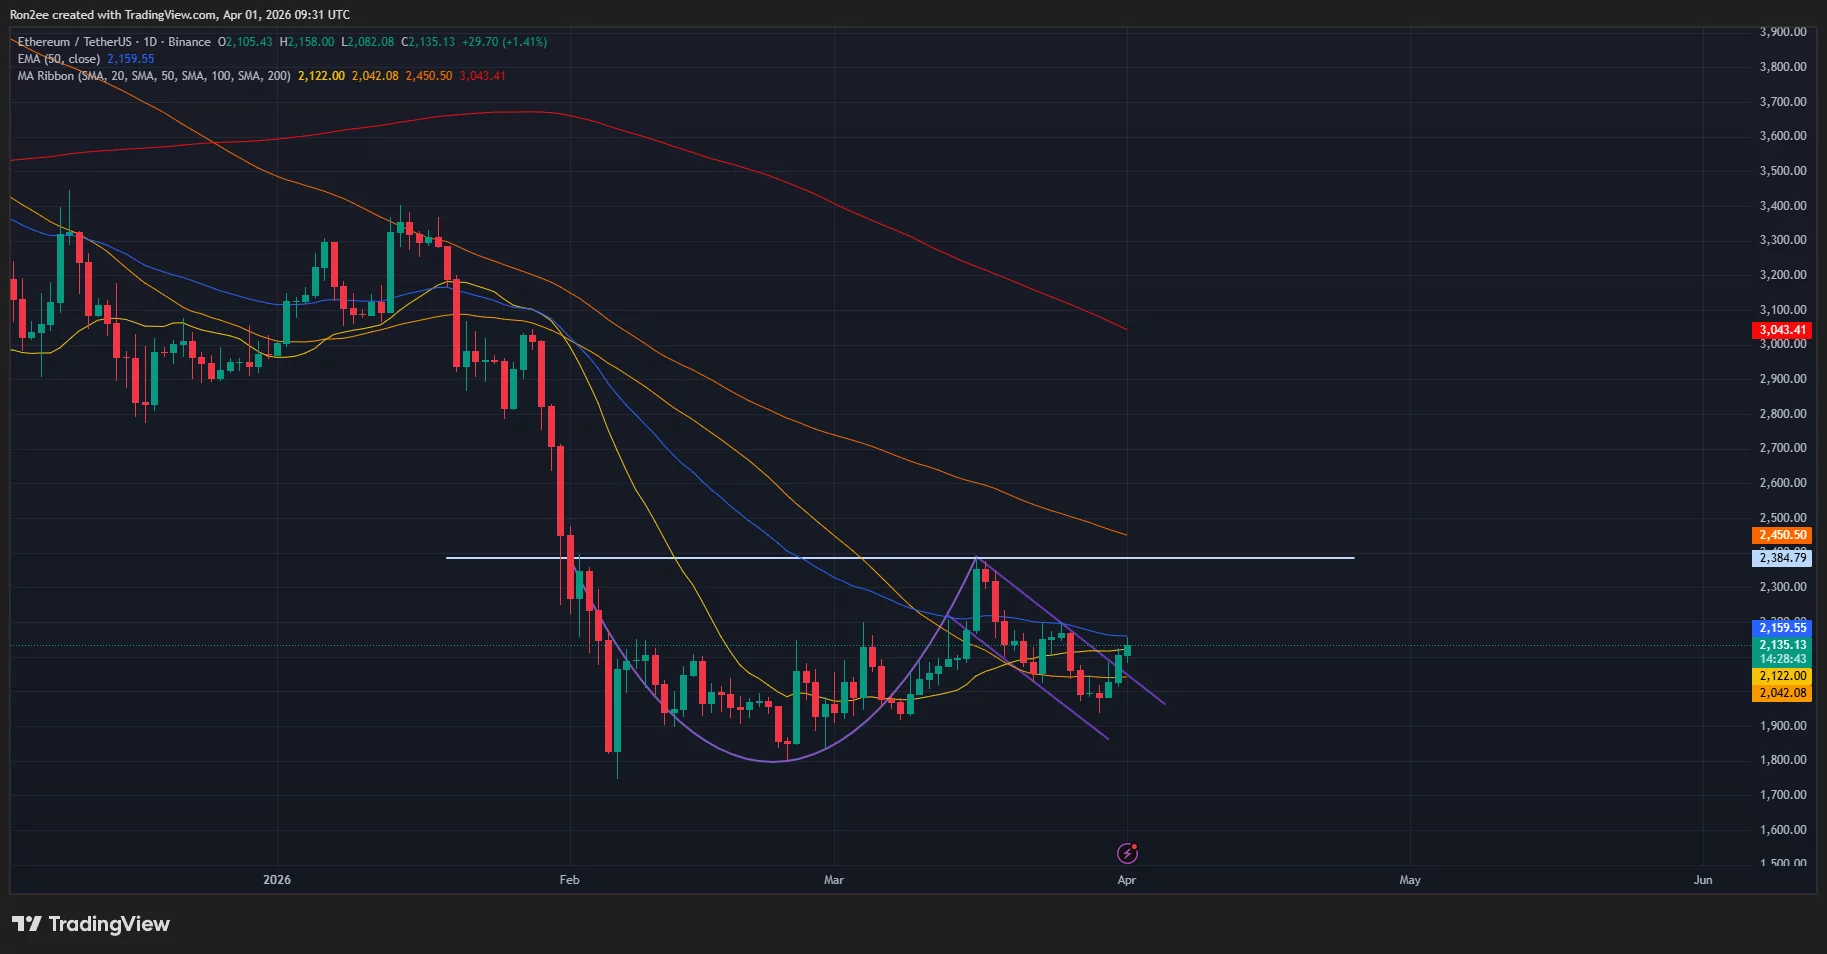
Technical indicators suggest bulls have the upper hand at the moment. Notably, the 20-day SMA has crossed above the 50-day SMA, with Ethereum price eyeing the 50-day EMA next at $2,160. Additionally, the supertrend has flashed green, indicating a buy signal.
Hence, the next immediate resistance level that traders would be keeping an eye on lies at $2,200, a level where previous selling pressure has historically intensified.
A break above this level could spur Ethereum towards the neckline of the cup and handle pattern at $2,384, with the next major target at $2,450, which coincides with the 100-day SMA.
Disclosure: This article does not represent investment advice. The content and materials featured on this page are for educational purposes only.
Crypto World
Attention bitcoin traders. These indicators matter more than what Trump says about Iran


The past four weeks have been brutal for bitcoin traders as prices keep chasing comments by President Donald Trump, who can’t make up his mind about Iran.
One day, he talks peace and BTC and risk assets go up while oil drops, the next day he talks hawkish again, sending BTC down and oil up. Meanwhile, Iran declares the Strait of Hormuz is “closed forever,” and analysts throw out wildly bullish and bearish oil targets. It’s nearly impossible to navigate this choppy environment.
Traders may be better off focusing on the following real indicators that actually matter. These, unfortunately, do not paint a positive picture for risk assets, including bitcoin.
The mid-April SPR cliff
The fate of the global economy and risk assets could hinge on the next couple of weeks as a managed oil disruption threatens to become an unmanaged one.
After the Iran war began on Feb. 28, tanker traffic through the pivotal Strait of Hormuz, which handles roughly 20% of the world’s seaborne oil trade, all but collapsed. In response, the International Energy Agency’s 32 member nations agreed to the largest coordinated strategic stock release in its 50‑year history – about 400 million barrels, later raised to 426 million as more countries pitched in.
Those emergency barrels have been offsetting a supply shortfall of roughly 4.5 to 5 million barrels per day, the gap created by the near‑shutdown of Hormuz flows.
But now those reserves are expected to hit the wall in the next couple of weeks, in which case, that manageable deficit could double to roughly 10 to 11 million barrels per day – the projected deficit due to reserve depletion and disruption of normal flows.
The House of Saud described it as “a shock of unprecedented scale with no obvious buffer left to absorb it.”
So it doesn’t matter whether Trump continues the war against Iran or stops. If oil supplies aren’t materially restored within the next two weeks, we could see massive risk aversion across both crypto and traditional financial markets.
Ship insurance premiums through Hormuz
A ship insurance premium is the payment a shipowner makes to an insurance company to protect against financial losses that could happen while operating the ship.
Insurance costs for navigating the Strait of Hormuz have increased significantly, with reports indicating rates jumping from less than 1% of ship’s value before the war to as high as 7.5% per trip. This means that a $100 million ship now has to pay around $2- $3 million in insurance, versus $250,000 before the conflict.
When premiums drop below 2%, that’s the clearest sign the route is genuinely safer, and it’s time to take risk in markets again. No press conference, briefing, or Truth Social post from Trump can replicate the certainty embedded in those prices.
Tanker traffic
Trump has at times suggested that passage through the Strait of Hormuz can be secured, but so far, there is no clear evidence that tanker traffic has returned to anything like normal volumes.
In fact, only 21 tankers have transited Hormuz since the war began, compared with more than 100 ships daily before the conflict, according to S&P Global Market Intelligence.
A sustainable rally in risk assets requires this number to pick up materially; until then, Trump’s attempts to calm markets are likely to be short-lived.
Crypto World
Dogecoin Price Stalls at $0.092 as Qubic Mining Goes Live While Pepeto Presale Fills Past $8 Million Before Listing

The dogecoin price sits at $0.092 with Qubic launching its DOGE mining mainnet on April 1, but money flow reads exactly zero. Three presale names keep dominating the conversation, and Pepeto is the first meme exchange with zero fee trading and contract screening backed by the cofounder’s track record of $11 billion. DOGE turned small entries into fortunes with zero products behind it.
More tools behind Pepeto logically reaches more than what zero tools reached, and the debate about which entry leads this cycle is already settled by the $8 million that flowed in during fear.
Qubic launched its Dogecoin mining mainnet on April 1, adding a new demand catalyst for DOGE, but money flow reads exactly zero, signaling no clear buying or selling pressure, according to BeInCrypto. DOGE sits inside a descending channel with the upper trendline converging toward $0.099.
CoinPedia confirmed the dogecoin price is also shaped by the total memecoin market cap dropping from $50 billion to $33 billion since January, with speculative assets hit hardest in this risk off environment.
Where the First Meme Exchange Outperforms While the Dogecoin Price Waits
Why Pepeto Is the First Meme Exchange With Zero Fee Trading and a Proven Track Record
Pepeto is the first meme exchange with zero fee trading and contract screening, combining the cofounder’s track record of building $11 billion with the exchange revenue and cross chain volume that pure meme coins cannot generate. The presale has raised more than $8 million at $0.000000186, and whales keep entering because the Binance listing converts presale positions into the returns the dogecoin price takes months to approach.
Just this cycle, one category of investor keeps outperforming: the ones who entered presales with real products during fear. PepetoSwap handles trades at zero cost across Ethereum, BNB Chain, and Solana. The risk scorer checks every contract.
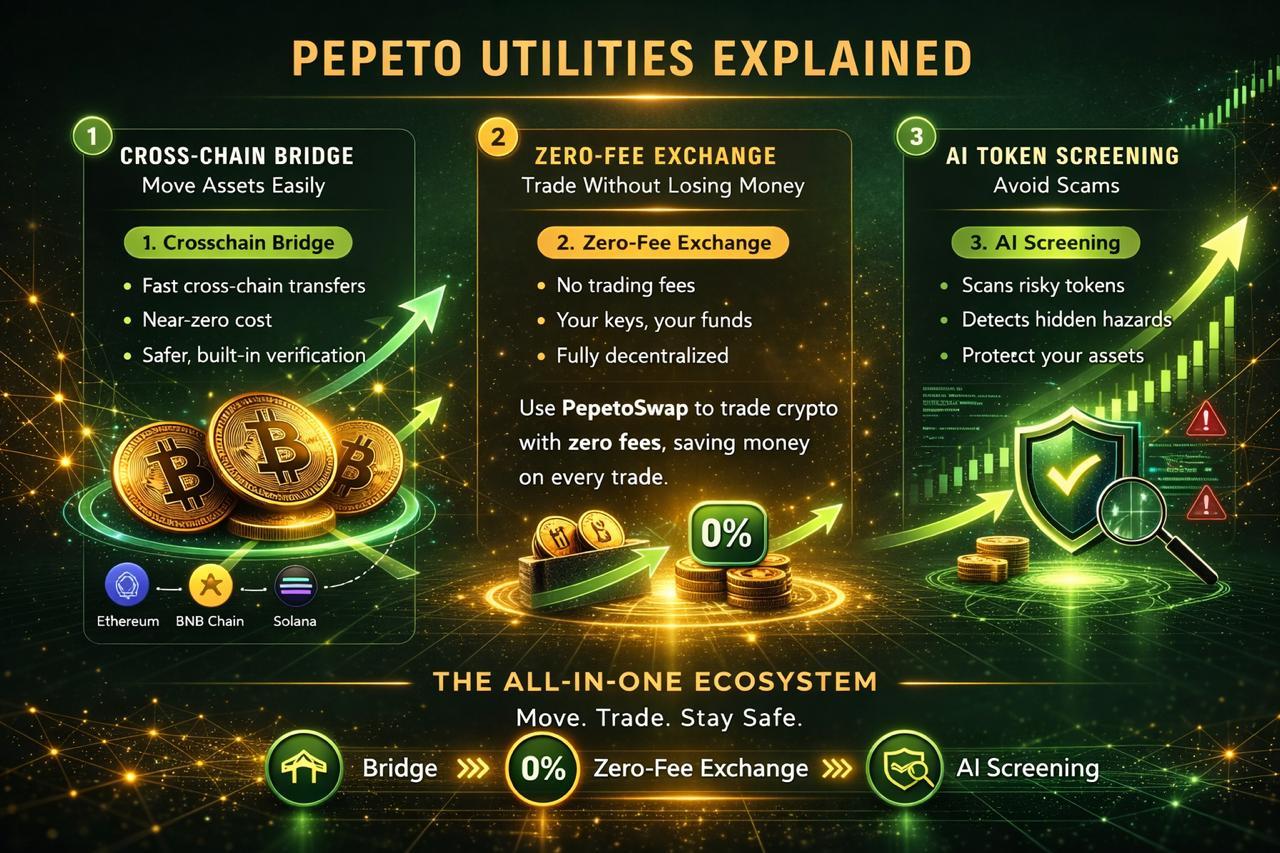
A former Binance expert structured the listing, and a SolidProof audit verified the code is clean. Holders earn 189% APY through staking, and the 420 trillion supply matches what took PEPE to $11 billion.
DOGE turned small entries into fortunes with zero products behind it. More tools behind Pepeto logically reaches more than what zero tools reached. Analysts project 100x from presale to Binance listing, and the debate about which entry leads this cycle is settled by the capital that flowed in while DOGE flatlined.
Dogecoin Price Prediction: Targets, Levels, and Mining Impact for 2026
DOGE trades at $0.092 on April 1 according to CoinMarketCap, holding above the 0.618 Fibonacci level at $0.088 inside a descending channel. Qubic’s mining mainnet is the first demand catalyst in months, but the total memecoin market cap fell from $50 billion to $33 billion since January.
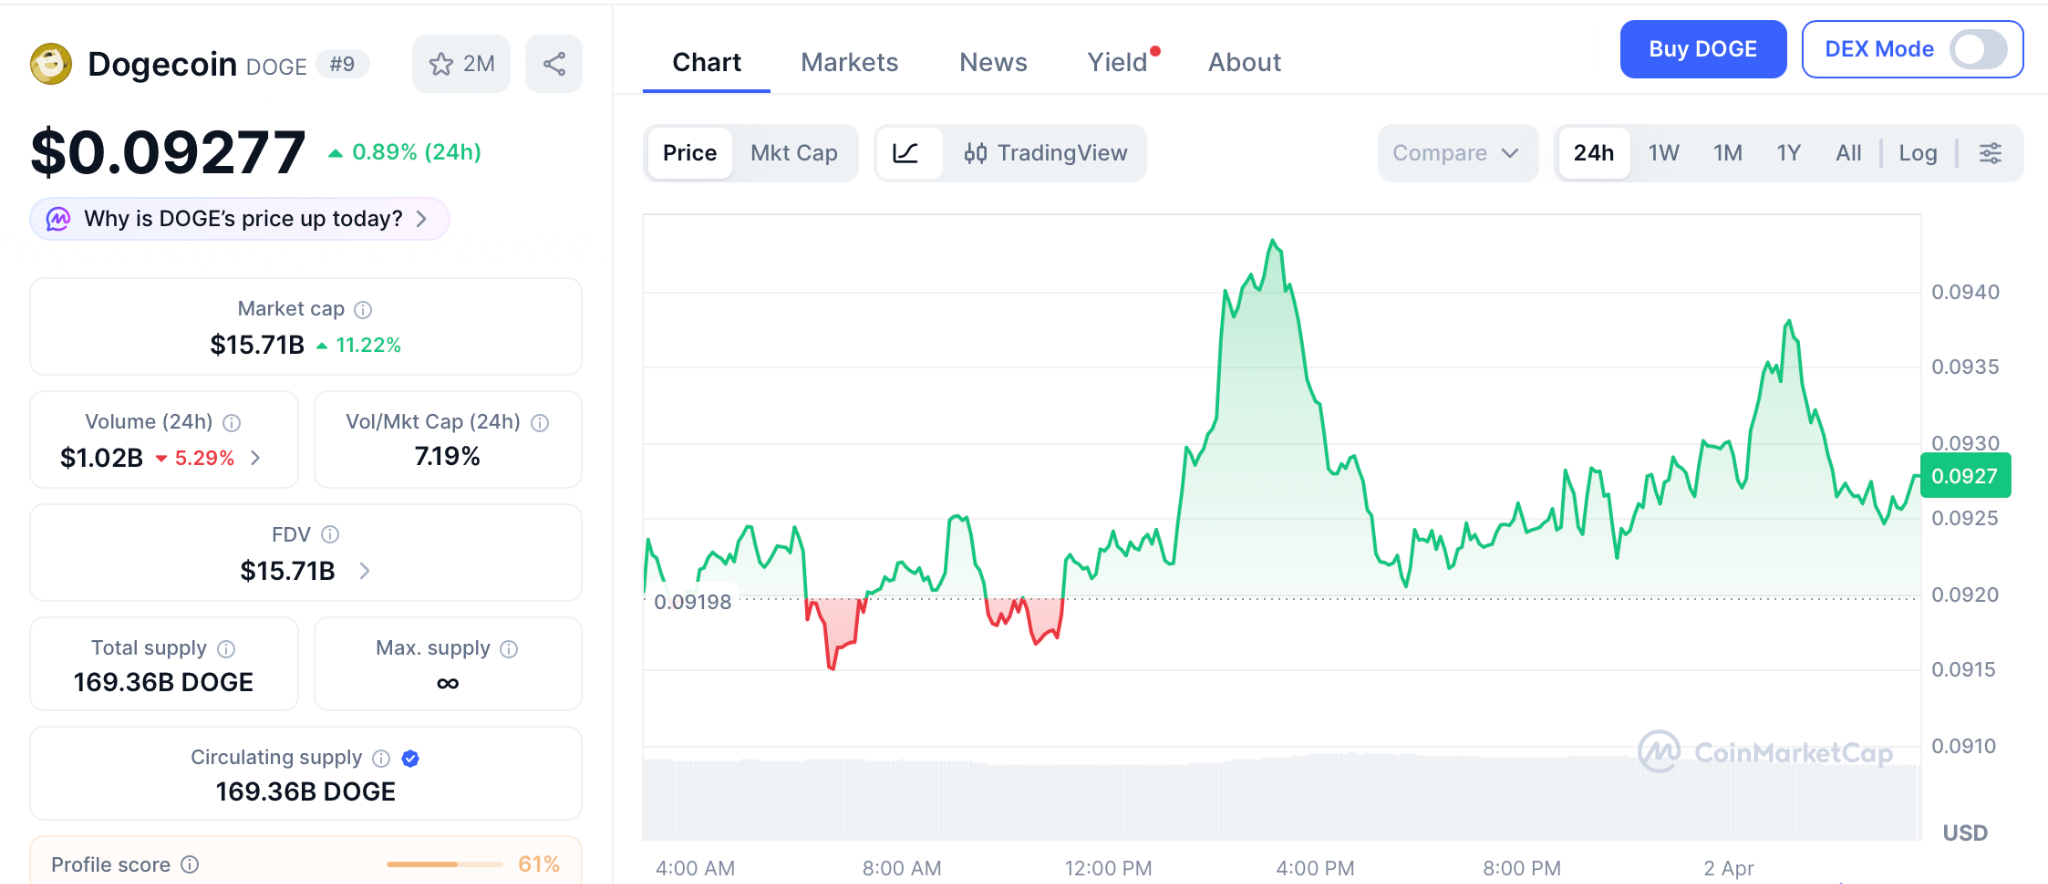
A break above $0.099 could push DOGE toward $0.12 to $0.15 resistance. Support at $0.088 must hold or the dogecoin price risks sliding to $0.07. Analyst year end targets range from $0.15 to $0.30 depending on whether meme rotation returns.
From $0.092, reaching $0.30 gives 230% over months, returns that depend on timing nobody can predict while the presale compresses 100x into one listing.
The Dogecoin Price Debate Is Settled by the Capital That Already Entered Pepeto
DOGE turned small entries into fortunes with zero products. More tools behind Pepeto logically reaches more, and $8 million during fear already settled the debate about which entry leads. The Pepeto official website shows stages filling faster each round.
Entering this presale while DOGE stalls and the Binance listing approaches is how the math that zero products proved gets multiplied by real exchange tools, and letting it pass while DOGE waits for meme rotation could be the one missed position where working products outperform everything that depends on sentiment alone.
Visit Pepeto before this presale stage closes and the Binance listing opens at a price nobody inside today will ever pay.
Click To Visit Pepeto Website To Enter The Presale

FAQs
What is the dogecoin price on April 1 2026?
DOGE trades at $0.092 with Qubic mining live and money flow at zero. Analyst year end targets range from $0.15 to $0.30 depending on meme rotation.
How does the dogecoin price affect presale entries?
Meme coins stalling creates rotation into presales. The Pepeto official website shows capital entering during fear before the Binance listing arrives.
Is Pepeto a better entry than DOGE right now?
DOGE targets 230% over months. Pepeto targets 100x to a confirmed listing with a full exchange platform and the proven track record of the PEPE cofounder.
Disclaimer: This is a Press Release provided by a third party who is responsible for the content. Please conduct your own research before taking any action based on the content.

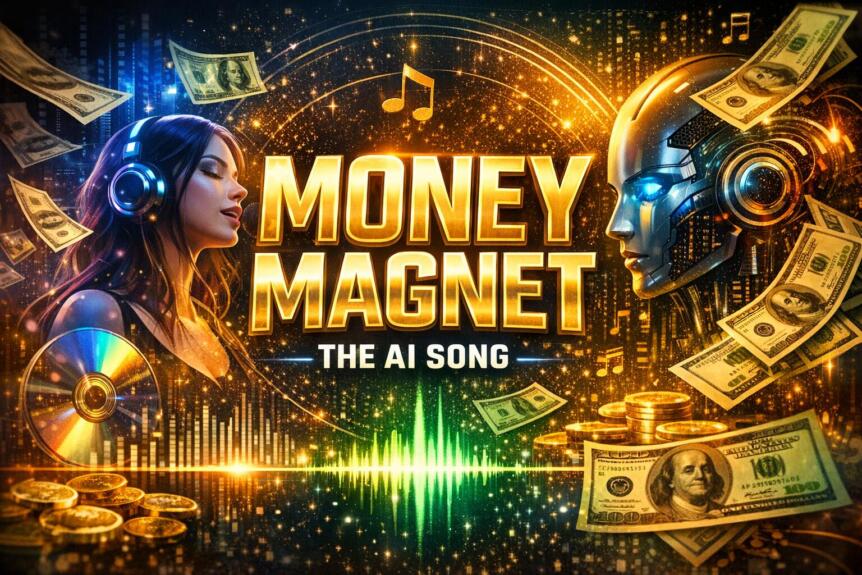
Artificial intelligence is already reshaping industries such as finance, software, design, education and media. Music is now rapidly joining that list, as AI-assisted tools make it possible to move from concept to release in a fraction of the time and cost required by traditional production models.
A new independent experiment is now testing exactly that. The project centers on Lunayah, a virtual artist created as part of a real-world music test, and its debut single “Money Magnet”, a pop-dance track designed to blend catchy, repeatable music with mindset-driven lyrical themes.
The experiment was initiated by Vincenzo Stefanini, entrepreneur, investor and founder of Web3 Digital, a Dubai-based agency operating across digital, AI and Web3-related sectors. While Stefanini does not come from a traditional music production background, he saw AI-assisted music creation as an opportunity to test a broader idea: whether music can evolve from pure entertainment into a practical tool for repetition, emotional conditioning and affirmation-driven listening.
From Affirmations to Music
The concept behind “Money Magnet” is simple but notable. Traditional affirmations are often spoken, repeated or written as part of personal development practices. This project takes a different route by turning those repetitive positive messages into a melodic, commercial pop-dance format that is easier to replay, remember and internalize.
Instead of asking listeners to read affirmations daily, the experiment asks a different question: what happens when those same ideas are embedded into a song structure with rhythm, melody and emotional energy?
That is the central thesis behind “Money Magnet,” which explores themes of abundance, financial well-being and positive mental reinforcement without positioning itself as financial advice or a literal promise. The aim is to create music that is enjoyable first, but also intentionally structured to stay in the mind.
AI as Accelerator, Not Replacement
One of the strongest takeaways from the project is not just the song itself, but the production model behind it. What would previously have required a studio, vocalists, producers, engineers and a significantly longer timeline was instead prototyped, refined and prepared for release in just a few days with the support of AI-assisted creative tools.
That does not mean the process was fully automated or idea-free. The original concept, direction, lyrical intent, stylistic choices, branding, launch strategy and final selection decisions remained human-led. AI functioned as an accelerator, helping translate creative direction into a finished musical product far more quickly than in a conventional setup.
For founders, creators, agencies and independent brands, this may be the more important story. The barrier to producing high-quality commercial music is falling. That opens the door not only to new artists, but to a wider range of experiments, formats and business models.
A New Creative Format
While “Money Magnet” is the first release, the project is being treated as a repeatable framework rather than a one-off track. Future songs may expand beyond financial themes into other areas commonly associated with personal development and emotional focus, including health, self-confidence, love, peace of mind and motivation.
That makes the release relevant beyond the music industry itself. It also points to the growing convergence of AI, branding, audio content, personal development and direct-to-consumer digital products.
In practical terms, the same underlying workflow could be adapted for artists, creators, events, milestone celebrations, personalized songs, branded campaigns and other custom audio experiences. That alone makes the launch of “Money Magnet” more than just another independent release.
Built in Dubai, Released Worldwide
The project was developed from Dubai, a city increasingly associated with entrepreneurship, speed, experimentation and digital-first business models. In a broader environment marked by global uncertainty and rapid technological change, the release reflects a different response: building, testing and shipping rather than waiting for ideal conditions.
“Money Magnet” is being distributed across more than 25 streaming platforms, including Spotify, Apple Music, YouTube Music, Amazon Music and other major services via its global release infrastructure.
The track and project hub are available at lunayah.com, while the direct release page can be accessed at this link.
Why It Matters
AI-generated content is no longer a niche topic. The real question is not whether it can be used, but how it should be used and what kinds of new formats it can unlock. “Money Magnet” may not answer all of those questions, but it offers a practical and public example of what the next phase of music creation could look like: faster, leaner, more experimental and increasingly accessible to non-traditional creators.
Whether this evolves into a larger music brand, a new category of personalized songs, or a service model for creators and businesses, the release marks a notable shift. It shows that music creation is no longer limited to those already inside the music industry.
Listen to the track and follow the project at https://lunayah.com/.

Bitcoin has slid roughly 50% this market cycle, a markedly milder pullback than in prior cycles, according to Fidelity Digital Assets. The firm’s researchers note that post-peak declines have historically ranged from 80% to 90%, but this cycle has seen a substantially smaller drawdown.
Fidelity’s data suggest a pattern of diminishing returns when looking at price performance from the previous all-time high, a sign of a maturing market. “Each cycle has been less dramatic to the upside than the previous,” Fidelity analyst Zack Wainwright said, adding that downside risk has been less pronounced in 2026 as well.
From a price perspective, Bitcoin touched a cycle low just above $60,000 on Feb. 6, representing a drop of about 52% from the Oct. 6 all-time high near $126,000, according to TradingView. It has since traded at roughly a 46% retreat from its peak six months earlier. For context, the prior cycle featured a much deeper decline—about 77%—from the 2021 high near $69,000 to a bear-market low just below $16,000 in November 2022.
Key takeaways
- Fidelity Digital Assets’ assessment: this cycle’s drawdown (~50%) is substantially smaller than the historical 80–90% range, signaling a maturing market with potentially reduced volatility.
- Current price action: cycle low around $60k on Feb. 6, with ~52% fall from the all-time high of ~$126k and ~46% below the six-month peak.
- Historical comparison: the previous bear phase saw a sharper 77% decline to a sub-$16k trough in late 2022, underscoring a notable shift in cycle severity.
- Halving cadence and bottom timing: Alphractal founder Joao Wedson highlighted a decaying pattern where the top occurred 534 days after the last halving, implying a bottom could fall between 912 and 922 days after halving—pointing to late September or early October 2026, though this remains a cycle-based projection.
- Technical watchlist: Bitcoin remains below the 50-day and 200-day exponential moving averages, with the 200-week EMA hovering around $68,000 and acting as a historical support level during downturns.
A shallower cycle, a maturing market
Fidelity’s framework suggests that the current cycle’s more gradual drawdown and compressed upside signal a shift in market dynamics. The research implies growing institutional interest and a broader base of participants that can absorb volatility without triggering extreme selloffs. In discussing the implications, Nick Ruck, director of LVRG Research, described the development as a move toward a more stable Bitcoin—one that could pave the way for deeper adoption beyond speculative trading.
“This shift signals that Bitcoin is changing from a speculative asset toward a more stable store of value, potentially paving the way for greater adoption in the future.”
Where the chart stands and what traders are watching
Despite the shallower drawdown, Bitcoin’s price action remains cautious. The asset has been trading in a zone where traditional trend indicators—such as moving averages—still show a wrestle between momentum and consolidation. The 50-day and 200-day exponential moving averages remain as benchmarks to gauge short- and mid-term momentum, while the 200-week EMA near $68,000 has historically provided a floor during extended downturns. This confluence of levels is a focal point for traders assessing whether a new leg higher can begin or if price action will retest prior support.
Halvings, cycles, and future pacing
Wedson’s observation about the halving cycle adds a nuanced layer to the discussion. He noted that Bitcoin’s peak arrived 534 days after the last halving—a shorter interval than in the previous cycle—highlighting a “decaying pattern” across cycles. If the bottom timing aligns with his projection that bottoms may occur roughly 912 to 922 days after halving, the window would imply a potential low in late September or early October 2026. While such timing draws from historical cycle dynamics, it remains a probabilistic forecast rather than a guarantee, underscoring the uncertainty that still surrounds Bitcoin’s macro path.
That framing reinforces a broader narrative: as cycles compress and volatility bottoms, investors may rely more on structural drivers—institutional participation, macro policy, and on-chain activity—to gauge the sustainability of a new regime for Bitcoin as an asset class.
Looking ahead, market participants will be closely watching whether Bitcoin can reclaim the shorter-term moving averages and whether the observed shallower drawdown persists as macro conditions evolve. The coming months could illuminate whether the market’s maturation translates into steadier pricing, greater institutional involvement, and clearer adoption milestones—or whether fresh shocks reintroduce the volatility that defined earlier cycles.

Venture capital firm Paradigm is reportedly developing a prediction markets trading terminal aimed at professional traders and market makers, according to Fortune.
Paradigm partner Arjun Balaji is spearheading the effort, which sources say has been underway since the late 2025.
The venture capital firm has been one of the most active backers of Kalshi, a leading prediction market platform. The firm participated in three successive funding rounds for Kalshi in 2025.
The prediction market platform recently raised more than $1 billion in a new round, pushing its valuation to $22 billion.
“Matt Huang, the venture firm’s cofounder and managing partner, is on the startup’s board of directors. Paradigm’s development of a prediction markets trading terminal isn’t competitive with Kalshi’s platform, said a source,” the report read.
Follow us on X to get the latest news as it happens
Beyond the terminal, sources suggest that Paradigm has considered establishing an internal market-making desk. A separate source said the firm has also engaged researchers to explore the feasibility of creating prediction market indexes.
Meanwhile, Paradigm has started to collect prediction market data into a public dashboard.
A Sector Gaining Institutional and Retail Momentum
Paradigm’s infrastructure push arrives at a time of rapid growth. Prediction market transactions surpassed a record high of 207 million in March, according to Dune data.
Monthly notional volume reached roughly $25.7 billion, up from $1.2 billion in early 2025. Meanwhile, major exchanges are also moving into the space. Binance is beta-testing an in-app prediction market feature inside its Wallet app.
Coinbase unveiled its prediction market offering through a partnership with Kalshi in January. Moreover, Crypto.com launched a standalone platform called OG.
Subscribe to our YouTube channel to watch leaders and journalists provide expert insights
The post Paradigm Targets Pro Traders and Market Makers in Latest Prediction Markets Push appeared first on BeInCrypto.
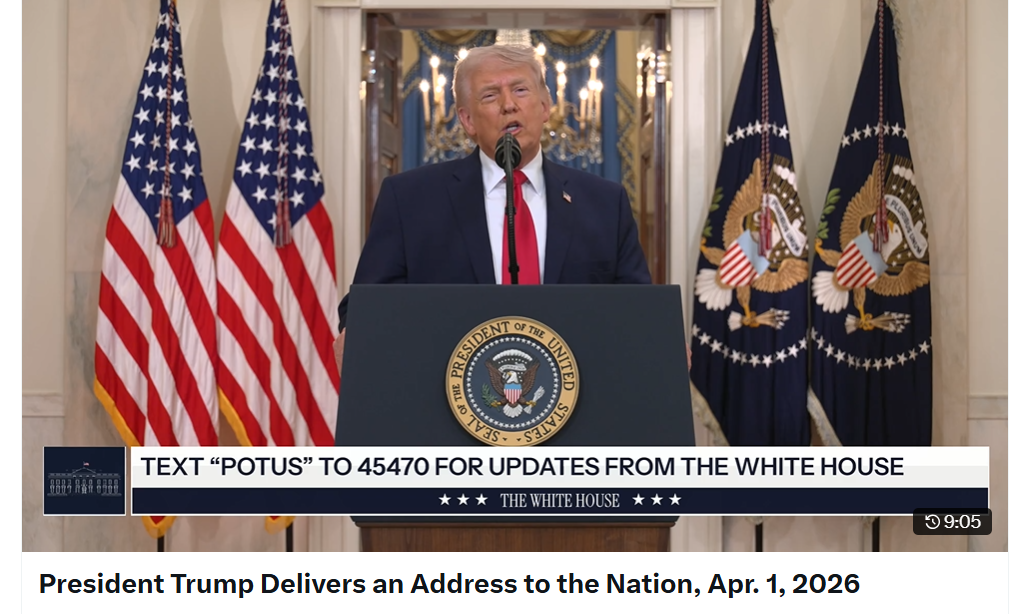
Crude oil rose to over $100 a barrel while Bitcoin fell 2% after a national address by US President Donald Trump on the conflict in Iran, where he vowed to hit Iran “extremely hard” over the next few weeks.
Speaking at the White House on Wednesday during an address to the nation, Trump said the US military is “very close” to finishing “Operation Epic Fury,” claiming to have wiped out Iran’s nuclear and naval capabilities while also significantly hampering its drones, missiles and weapon factories.
“I can say tonight that we are on track to complete all of America’s military objectives shortly. Very shortly, we are going to hit them extremely hard over the next 2 to 3 weeks.”
Stocks, crude oil, and crypto prices have been impacted by conflict in the Middle East over the last few months. Oil prices eased on Tuesday after Trump said the war would be wrapping up in the next few weeks, though his latest speech has seen it rise again.
At the time of writing, the price of crude oil has spiked back above $100 per barrel to $103.59. Meanwhile, Bitcoin dipped by around 1% over the course of the speech and has since fallen further to $66,904, down 2% since the start of the speech.
However, Trump also said discussions are ongoing. Both sides have made key demands for ending the conflict, with the US pushing for Iran to dismantle its nuclear programs, open up commercial shipping channels and stop regional support for proxy groups.
Iran wants a permanent end to the war, compensation for damages and an end to US military presence in the region, among other demands.
“The new group is less radical and much more reasonable. Yet, if during this period of time no deal is made, we have our eyes on key targets.”

Trump says oil blockade will end soon
Conflict in the Middle East intensified in February after the US and Israel launched strikes against Iran. This ultimately saw Iran respond by leading a blockade of the Strait of Hormuz in a bid to cut oil supply on one of the world’s busiest shipping channels.
Related: Who is Kevin Warsh? Trump’s Fed pick wants ‘regime change’ at central bank
The president claimed that the stock market will pick back up soon as the conflict begins to wind down, while gas prices will drop as he argued that Iran will remove the blockade “naturally” so that it can start rebuilding the economy.
“And in any event, when this conflict is over, the strait will open up naturally. It’ll just open up naturally. They’re going to want to be able to sell oil because that’s all they have to try and rebuild. It will resume flowing and the gas prices will rapidly come back down. Stock prices will rapidly go back up,” he said.
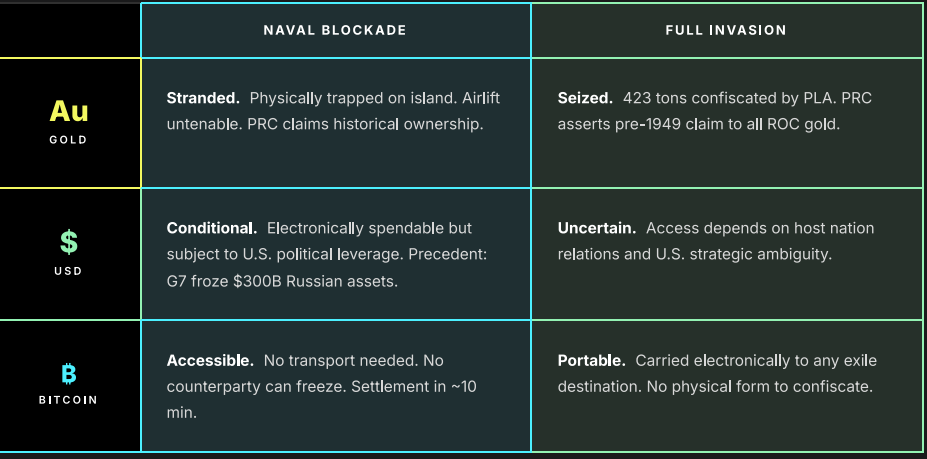
Taiwan should reconsider adopting Bitcoin as a reserve asset to hedge against global turmoil and the risk of war, according to a research fellow at the Bitcoin Policy Institute.
In a report on Tuesday, Jacob Langenkamp said that should China pursue reunification with Taiwan by military force, either through a blockade or full invasion, Bitcoin (BTC) would be the only reserve asset that would remain fully accessible and spendable.
“Uniquely for Taiwan, Bitcoin provides geopolitical resilience: in a PRC blockade or invasion, gold is stranded or seized and USD reserves face potential restrictions, but Bitcoin remains fully accessible without physical transport,” he added.

Nation-states have begun to explore the idea of launching strategic Bitcoin reserves, seen as a bullish signal for Bitcoin.
Last year, Taiwan’s central bank sought to investigate establishing a national Bitcoin reserve. However, the bank ruled it out in December, citing volatility, liquidity and custody concerns and instead identified the US dollar as a safer alternative.
US currency debasement is a risk to Taiwan: Langenkamp
Taiwan is heavily exposed to the risks of US dollar debasement, Langenkamp said, because its central bank reserves are at least 80% in USD-denominated assets, as is most of its trade.
Growing US debt, Federal Reserve monetary expansion, a potential AI market downturn and declining semiconductor revenues could also accelerate dollar debasement, he said.

“Bitcoin can couple with gold to offer that hedge against USD debasement. It can provide another opportunity for the CBC to adopt a reserve asset before its peers and benefit the people of Taiwan with the subsequent price appreciation,” Langenkamp added.
“It can offer geopolitical insurance against scenarios that hopefully do not come to pass. It can open new methods of trade with less friction. Bitcoin can provide Taiwan with a great measure of monetary resilience.”
Related: US Bitcoin reserve still has no plan to stack sats
Langenkamp also argued that the CBC’s concerns about Bitcoin’s liquidity and volatility are valid, but contended that both issues will diminish as the asset matures and gains adoption among nations.
“The CBC’s concerns are valid but addressable with institutional expertise on custody, liquidity, and volatility,” he added.
Taiwan has at least 210 Bitcoin
Despite ruling out a Bitcoin reserve for now, the CBC committed to testing the technology further in a digital asset sandbox using the crypto the country already holds.
Taiwanese lawmaker Ko Ju-Chun revealed on X last year that the country’s Ministry of Justice holds 210 Bitcoin, worth $14 million, confiscated during criminal investigations.
BitBo doesn’t list Taiwan in its country reserve rankings; its disclosed holdings would make it the seventh-largest national Bitcoin holder, behind El Salvador but ahead of Finland.
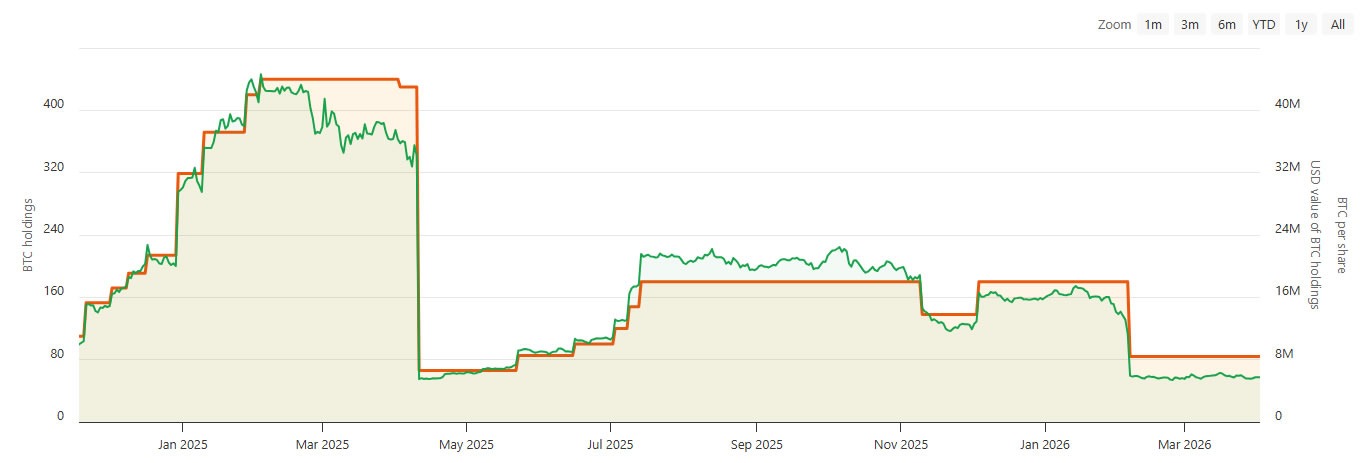
AI-powered Bitcoin treasury and education company Genius Group revealed on Tuesday that it sold the remainder of its Bitcoin in Q1 to pay off debt, adding to a recent wave of companies offloading assets amid a crypto bear market.
“The company will recommence building its Bitcoin Treasury when it believes market conditions are more favorable,” it stated.
The move appears to go against its “Bitcoin first” strategy, which it touted in November 2024, vowing at the time to commit 90% or more of its current and future reserves to be held in Bitcoin.
Genius Group held 84 BTC worth around $5.7 million as of March 2026, but holdings have declined since April 2025, around the time it was temporarily barred by a US court from expanding its Bitcoin treasury. It resumed buying in June of that year.
The recent announcement came as Genius Group reported strong results in Q1, with revenue up 171% year-on-year to $3.3 million and gross profit up 228% to $2 million. The company swung from a $500,000 operating loss in Q1 2025 to a $2.7 million net profit in Q1 2026.

Bitcoin treasuries liquidating in 2026
Genius Group is not the only Bitcoin-related company to offload assets in recent months.
MARA Holdings sold 15,133 BTC for around $1.1 billion in March, dropping its treasury to 38,689 BTC and down to the third largest corporate Bitcoin treasury, behind Twenty One Capital.
The proceeds were used to repurchase approximately $1 billion of convertible senior notes and the remainder for general corporate purposes.
Related: Bhutan offloads another $37M in Bitcoin as sovereign wallet shrinks
Meanwhile, mining company Bitdeer liquidated its entire stash of 943 BTC and sold newly mined coins, cutting corporate holdings to zero in February.
Other notable recent sales include Bitcoin miner Cango Inc., which sold 4,451 BTC, and AI tech firm GD Culture Group, confirming authorization of the sale of some of its 7,500 BTC treasury in February.
Stalwart Strategy keeps on buying
Michael Saylor’s Strategy, the world’s largest corporate Bitcoin treasury, has bucked the trend and has continued buying Bitcoin, dominating purchases this year.
“Strip out Strategy, and the rest of the ecosystem’s buying pace has collapsed,” reported BTC mining analytics outlet BitcoinMiningStock in March.
The firm’s last purchase was 1,031 BTC on March 23, and it has accumulated 89,581 BTC worth around $6.1 billion at current market prices so far this year, according to the Saylor Tracker.
Magazine: Nobody knows if quantum secure cryptography will even work


US-listed spot Bitcoin ETFs ended the first quarter of 2026 in negative territory. March did see a return of inflows, but that came only after two straight months of steady withdrawals.
Summary
- US spot Bitcoin ETFs ended Q1 2026 with about $500 million in net outflows, as early-quarter redemptions outweighed March inflows of $1.32 billion.
- Ether ETFs saw $769 million in quarterly outflows, while Solana funds attracted $213 million.
Figures from SoSoValue show that the funds added $1.32 billion in March and ended a dry spell that had lasted since October 2025.
Yet the inflows were not enough to offset the heavy redemptions that occurred in January, when $1.61 billion was pulled from the funds. Subsequently, February saw further withdrawals of $207 million, leaving the quarter with roughly $500 million in net outflows.
Outflows picked up pace as Bitcoin fell by more than 22% over the quarter, extending losses after a 23% drop in the final quarter of 2025. Consecutive declines across two quarters added pressure on investor positioning and fund flows.
Investor sentiment remained fragile even as capital returned in March. Readings from the Crypto Fear & Greed Index stayed under 20 for most of the month, a range tied to “Extreme Fear.”
Even under those conditions, ETF inflows picked up toward the end of the quarter. Some analysts link that resilience to continued institutional participation, despite uncertainty tied to geopolitical tensions in the Middle East.
However, trading activity slowed, with spot Bitcoin ETF volumes falling to around $79 billion in March, compared with $93 billion in February and $87 billion in January. By the end of the quarter, cumulative inflows into the segment reached close to $56 billion, while total assets under management stood near $87.5 billion.
Spot Ether ETFs recorded the largest quarterly losses among altcoins at about $769 million. These products have recorded three consecutive months of outflows after closing March with $46 million in net withdrawals.
XRP ETFs also recorded outflows in March with roughly $31 million exiting the funds. Earlier inflows kept the quarterly figure positive, with net additions of roughly $43 million.
Meanwhile, Solana ETFs brought in a combined $213 million over the quarter. Since their launch in October 2025, they have yet to post a month of net outflows.

Ethereum price approaches $2,200 as Iran signals willingness to end war

How to Build Finance Dashboards with Claude in Minutes (Full Tutorial)

Massachusetts man accused of murdering his 90-year-old grandmother by beating her to death with skateboard


-

 Business6 days ago
Instagram, YouTube Found Responsible for Teen’s Mental Health Struggle in Historic Ruling
-
 Tech7 days ago
Intercom’s new post-trained Fin Apex 1.0 beats GPT-5.4 and Claude Sonnet 4.6 at customer service resolutions
-

 NewsBeat5 days ago
The Story hosts event on Durham’s historic registers
-

 Sports5 days ago
Sweet Sixteen Game Thread: Tide vs Michigan
-
Entertainment3 days ago
Fans slam 'heartbreaking' Barbie Dream Fest convention debacle with 'cardboard cutout' experience
-
 Entertainment4 days ago
Lana Del Rey Celebrates Her Husband’s 51st Birthday In New Post
-
Crypto World2 days ago
Dems press CFTC, ethics board on prediction-market insider trades
-

 Tech3 days ago
The Pixel 10a doesn’t have a camera bump, and it’s great
-

 Crypto World9 hours ago
Gold Price Prediction: Worst Month in 17 Years fo Save Haven Rock
-

 Sports2 days ago
Tallest college basketball player ever, standing at 7-foot-9, entering transfer portal
-

 Tech2 days ago
EE TV is using AI to help you find something to watch
-

 Tech3 days ago
Apple will hide your email address from apps and websites, but not cops
-

 Tech2 days ago
Flipsnack and the shift toward motion-first business content with living visuals
-

 Tech2 days ago
How to back up your iPhone & iPad to your Mac before something goes wrong
-

 Fashion7 days ago
En Vogue in Brown Leather and Tailored Neutrals by Atelier Savoir, Styled by J Bolin
-

 Politics2 days ago
Should Trump Be Scared Strait?
-

 Crypto World2 days ago
U.S. rule change may open trillions in 401(k) funds to crypto
-

 Fashion7 days ago
What Are Your Favorite T-Shirts for the Weekend?
-

 Fashion6 days ago
Weekly News Update, 3.27.26 – Corporette.com
-

 Fashion4 days ago
Amazon Sundays: Soft Spring Layers
You must be logged in to post a comment Login