
Crypto World
Relative Strength Index (RSI): Trading Strategies, Settings, and Market Applications
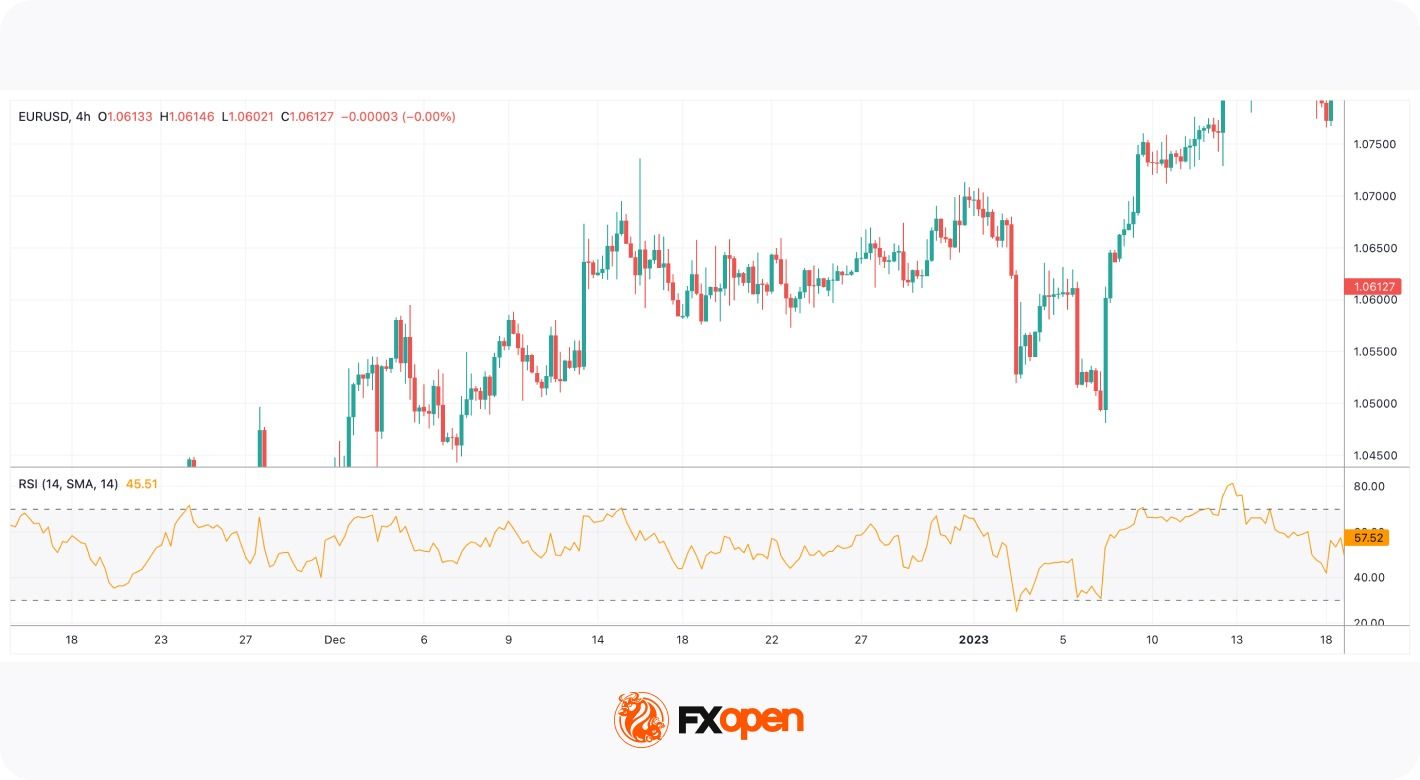
RSI is a popular momentum indicator in technical trading across forex, stock, and cryptocurrency* markets. The Relative Strength Index (RSI) is a momentum oscillator developed by J. Welles Wilder that measures the speed of price movements on a 0–100 scale. Traders use it to detect overbought/oversold conditions, trend strength, pullbacks, and exhaustion.
Although often viewed as a basic oscillator, the RSI plays a more nuanced role in professional trading strategies, particularly when combined with trend and volatility indicators. Understanding how the RSI behaves in different market environments may help traders refine entries, implement risk management strategies, and confirm trade setups.
In this article, we will consider how the RSI indicator works, how it is calculated, and how it can be applied in practical trading strategies across multiple asset classes.
Takeaways
- The Relative Strength Index (RSI) is a momentum indicator that measures the speed and magnitude of recent price movements to evaluate whether an asset is overbought or oversold.
- Developed by J. Welles Wilder, the RSI is plotted on a scale from 0 to 100 and is most commonly calculated over a 14-period timeframe.
- At its core, the RSI compares the average size of recent gains with the average size of recent losses over a defined period.
- Traditionally, RSI trading rules suggest that readings above 70 indicate overbought conditions, while readings below 30 signal oversold levels.
- Besides overbought and oversold signals, the indicator can provide divergence, trend strength, and failure swings signals.
What Is the Relative Strength Index?
The Relative Strength Index (RSI) is a momentum oscillator in modern technical analysis. Developed by J. Welles Wilder Jr. and introduced in 1978 in New Concepts in Technical Trading Systems, the indicator measures the speed and magnitude of recent price movements in order to evaluate underlying market momentum.
The RSI is plotted on a scale from 0 to 100 and is classified as an oscillator because it fluctuates within a fixed range rather than following price directly. This structure allows traders to evaluate whether buying or selling pressure is strengthening or weakening relative to recent market activity.
In practice the RSI functions less as a reversal indicator and more as a momentum persistence gauge. In directional markets the oscillator spends extended time in one half of its range, reflecting order-flow imbalance rather than exhaustion. Professional traders therefore interpret extreme readings as trend participation signals unless market structure begins to break.

Although the RSI is often introduced as a simple overbought-oversold tool, its practical application in professional trading is considerably broader. In leveraged markets such as forex and CFDs, traders use the indicator to identify pullbacks within trends, detect momentum divergence, and refine entry timing across multiple timeframes. The RSI therefore functions less as a standalone signal generator and more as a contextual momentum filter within broader trading systems.
The RSI belongs to the family of bounded momentum oscillators introduced by J. Welles Wilder in New Concepts in Technical Trading Systems (1978), alongside the average true range (ATR), the average directional movement index (ADX), and the parabolic stop and reverse (Parabolic SAR).
RSI Formula and Calculation
How is RSI calculated? It’s quite difficult to calculate the RSI. Fortunately, you don’t need to do it manually, as it’s one of the standard indicators implemented in most trading platforms. For instance, you can use TickTrader to examine the RSI without making complicated calculations.
However, it’s worth understanding how the indicator is measured to know which metrics can affect its performance.
The RSI Formula Explained
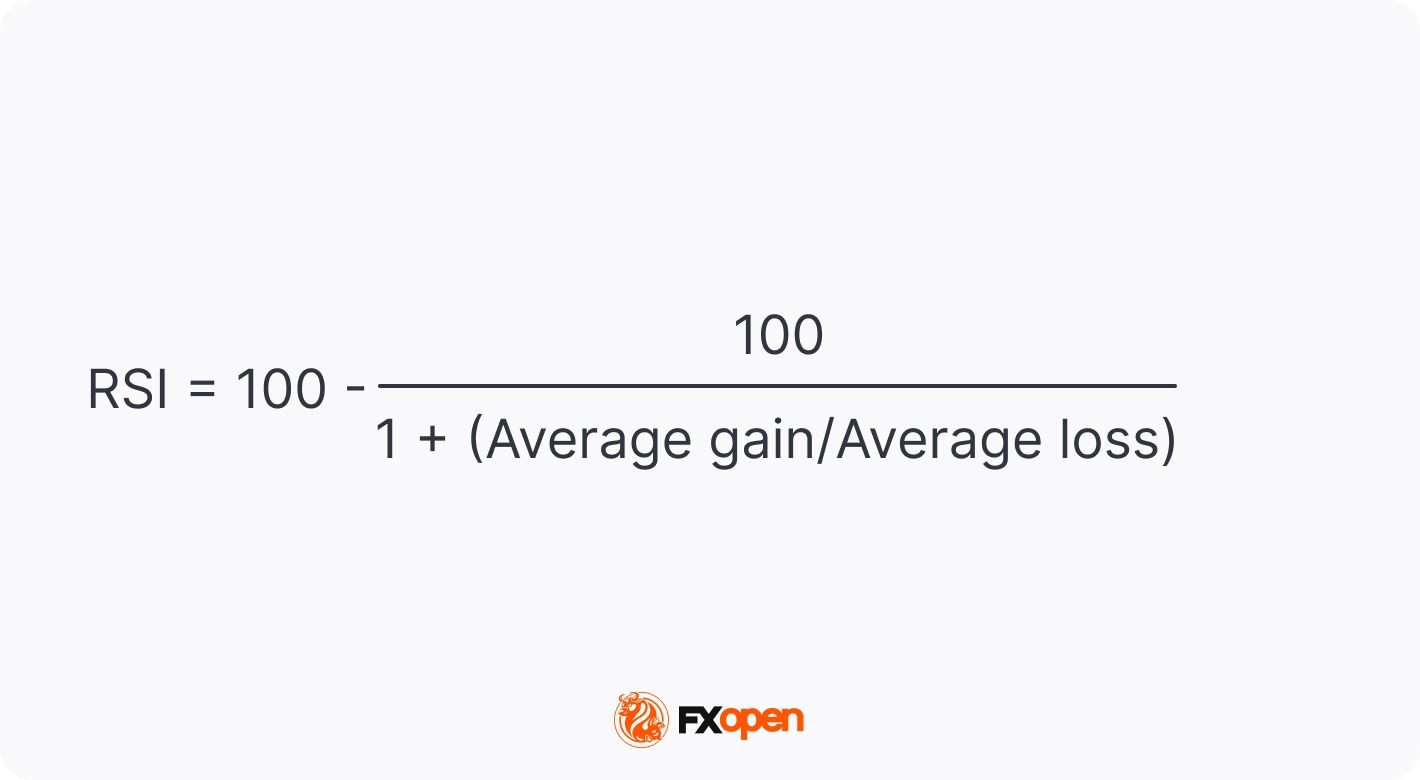
RSI formula
The calculation involves three main steps. First, the average gain and average loss over the selected period are determined. Second, these values are used to calculate relative strength, defined as the ratio of average gains to average losses. Finally, this ratio is transformed into an index value between 0 and 100 using the RSI formula.
The most popular RSI period is 14, meaning its values are based on closing prices for the latest 14 periods, regardless of the timeframe. We will use this period as an example of RSI calculations.
The standard RSI formula description:
Step 1: Average Gain and Average Loss
To calculate average gains and losses, you need to calculate the price change from the previous period.
Note: If the current price is higher than the previous one, add the gain to a total gain variable. If the price declined from the previous period, add the figure to a total loss variable.
After you calculate the change for all 14 periods, you need to add up the gains and divide them by 14 and sum up the losses and divide the total by 14.
Step 2: Calculate the Relative Strength (RS)
RS = Average Gain / Average Loss
To calculate the relative strength, divide the average gain by the average loss.
Step 3: Calculate the RSI
Now that you calculated the RS, you can proceed with the RSI value. For this, you need to add 1 to RS, divide 100 by the sum, and subtract the result from 100.
Relative Strength Index = 100 – 100 / (1 + RS)
Because the calculation uses smoothed averages of gains and losses, the RSI reacts to volatility contraction faster than to volatility expansion. This asymmetry explains why the indicator often gives early signals near market tops but delayed signals near lows.
What RSI Setting Do Traders Use?
The standard period is 14. Shorter lookback periods produce a more sensitive indicator that reacts quickly to price changes but generates more noise. Longer periods smooth out fluctuations but may lag behind rapid market shifts. This trade-off explains why RSI settings are often adjusted according to strategy type, whether scalping, day trading, or swing trading.
The following adjustments are common depending on strategy and timeframe:
Scalping strategies often use shorter RSI periods to capture rapid momentum shifts on lower timeframes. While this increases signal frequency, it also requires stricter risk management due to higher noise levels.
Want to learn how to read the RSI indicator signals?
How Is the RSI Indicator Used in Trading?
How to interpret the RSI indicator? There are four common ways to use the RSI indicator when trading: spot overbought and oversold conditions, find price divergences, implement failure swings for reversal signals, and determine market trends.
Relative Strength Index: Overbought/Oversold Indicator
The traditional interpretation of RSI levels focuses on the 70 and 30 thresholds. Readings above 70 are commonly described as overbought, while readings below 30 are considered oversold. However, in professional trading environments these thresholds are treated as reference zones rather than absolute signals.
The 70/30 framework works primarily in rotational markets. During macro-driven trends, price commonly continues moving after entering overbought or oversold territory because positioning flows dominate short-term mean reversion. In these conditions the RSI defines pullback zones rather than reversal zones.
During sustained uptrends, the RSI typically fluctuates between 40 and 80 (sometimes reaching 90 in very strong trends). Pullbacks often hold above 40, showing that bullish momentum remains intact. In sustained downtrends, the RSI usually ranges between 20 and 60, with rallies failing near 60, reflecting persistent selling pressure. These shifting RSI ranges may help traders assess trend strength rather than relying solely on the traditional 70/30 overbought–oversold levels.
Sustained RSI range shifts usually reflect systematic positioning rather than retail momentum. When the oscillator establishes a higher equilibrium range, dips towards the mid-zone often coincide with passive liquidity absorption rather than trend rejection.
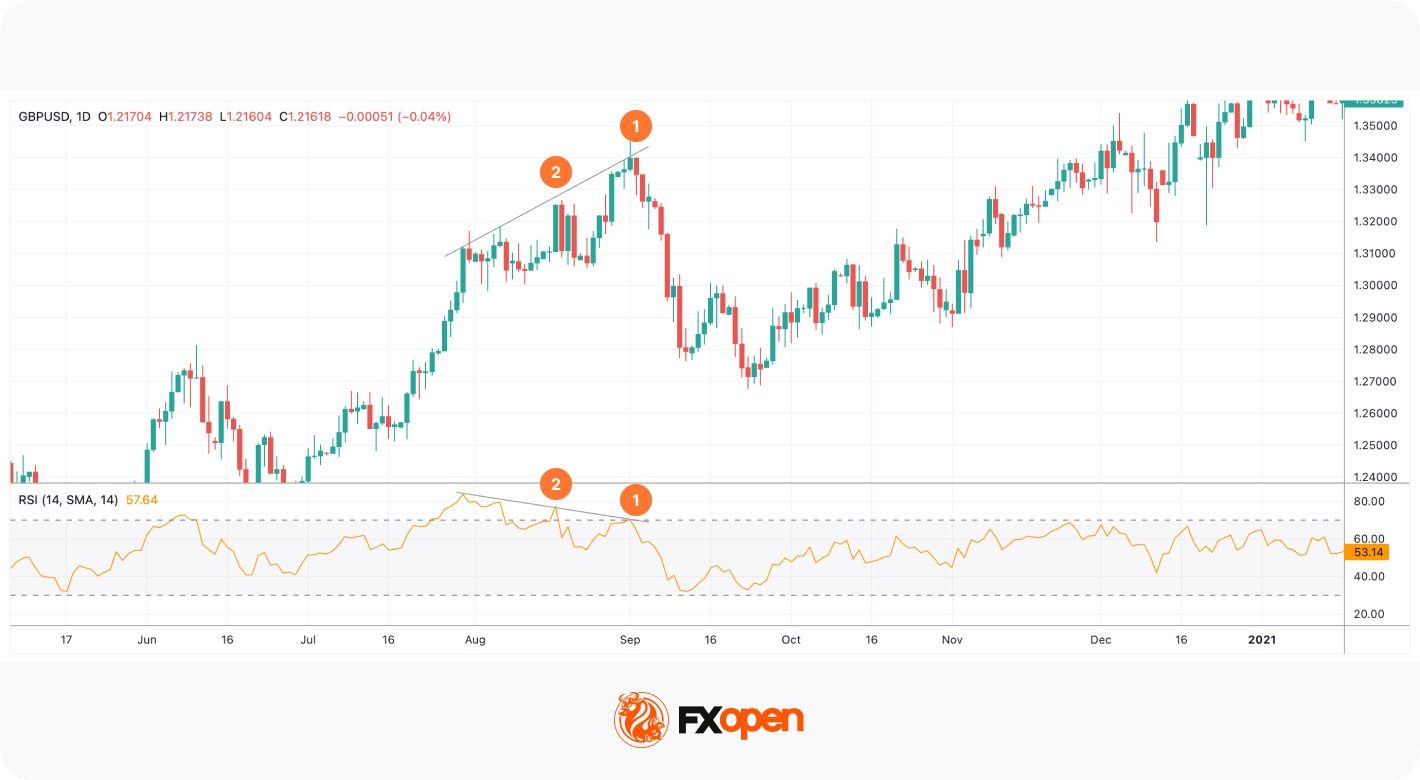
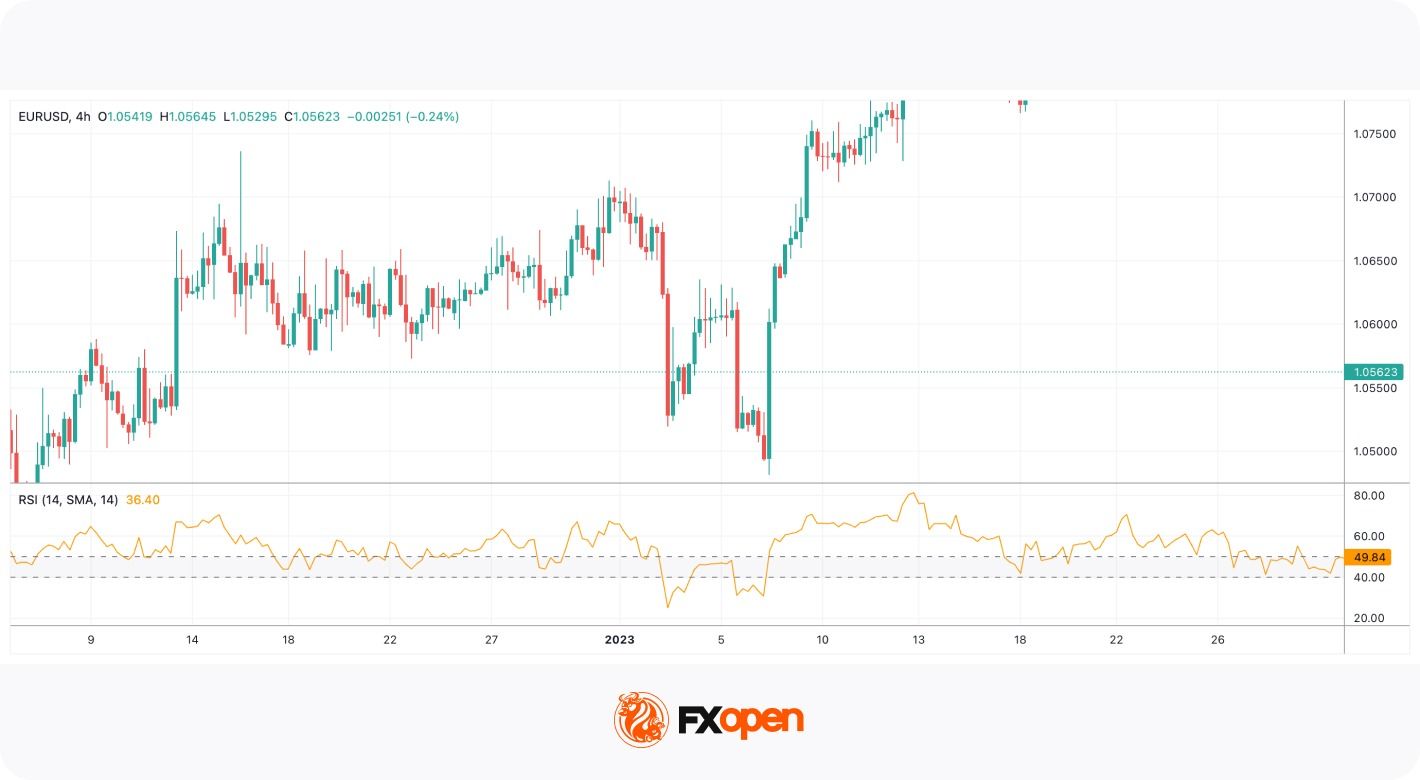
On the daily chart of the GBP/USD pair, the RSI entered the oversold area on 22nd April, left it for a while on 4th May, but returned to it and continued moving upwards only on 15th May.
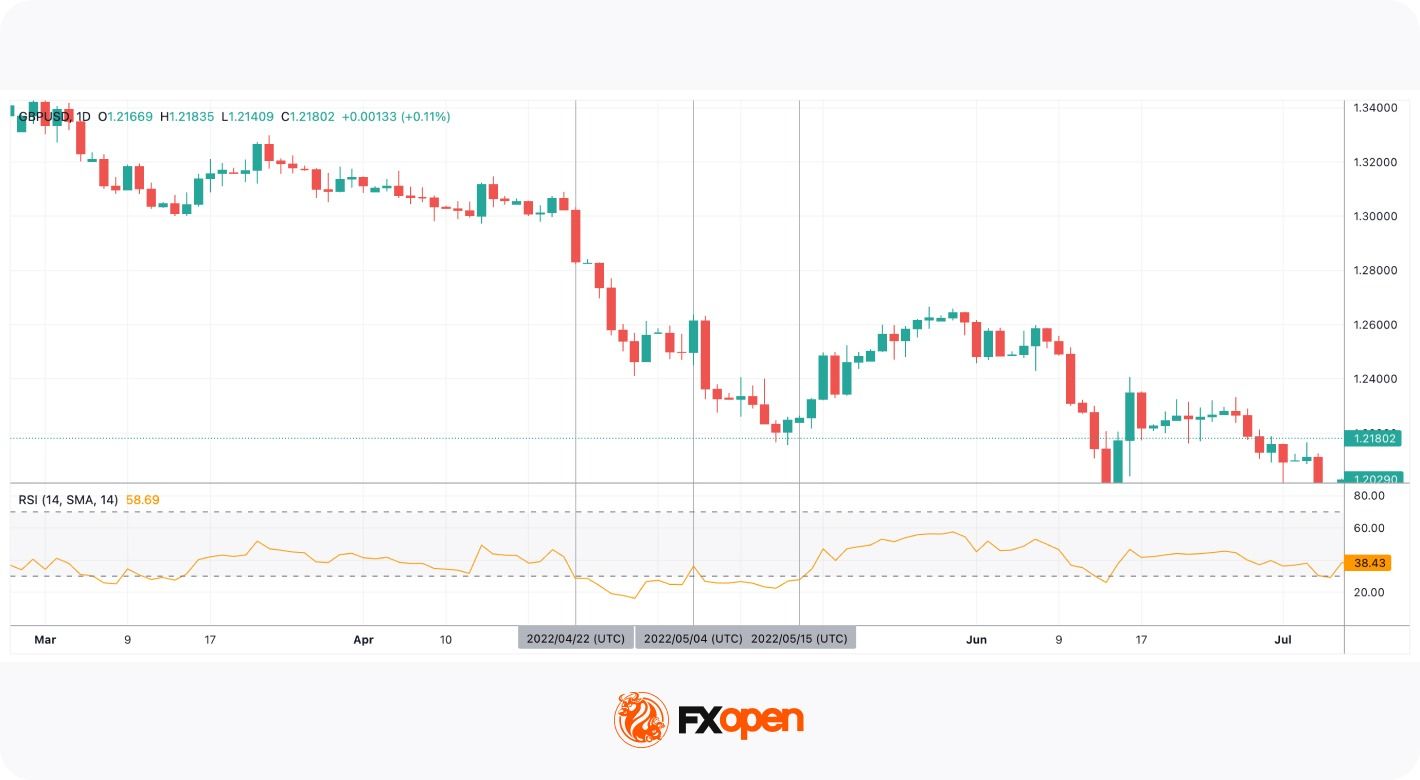
An example of the oversold RSI
Additionally, when using overbought/oversold signals, traders keep in mind that they can reflect an upcoming correction, not a trend reversal. The GBP/USD pair was trading in a strong downtrend, and the RSI provided a signal of a short-term correction only.
To distinguish between corrections and reversals, traders combine the RSI with other tools. A cross of a moving average can confirm a change in the trend.
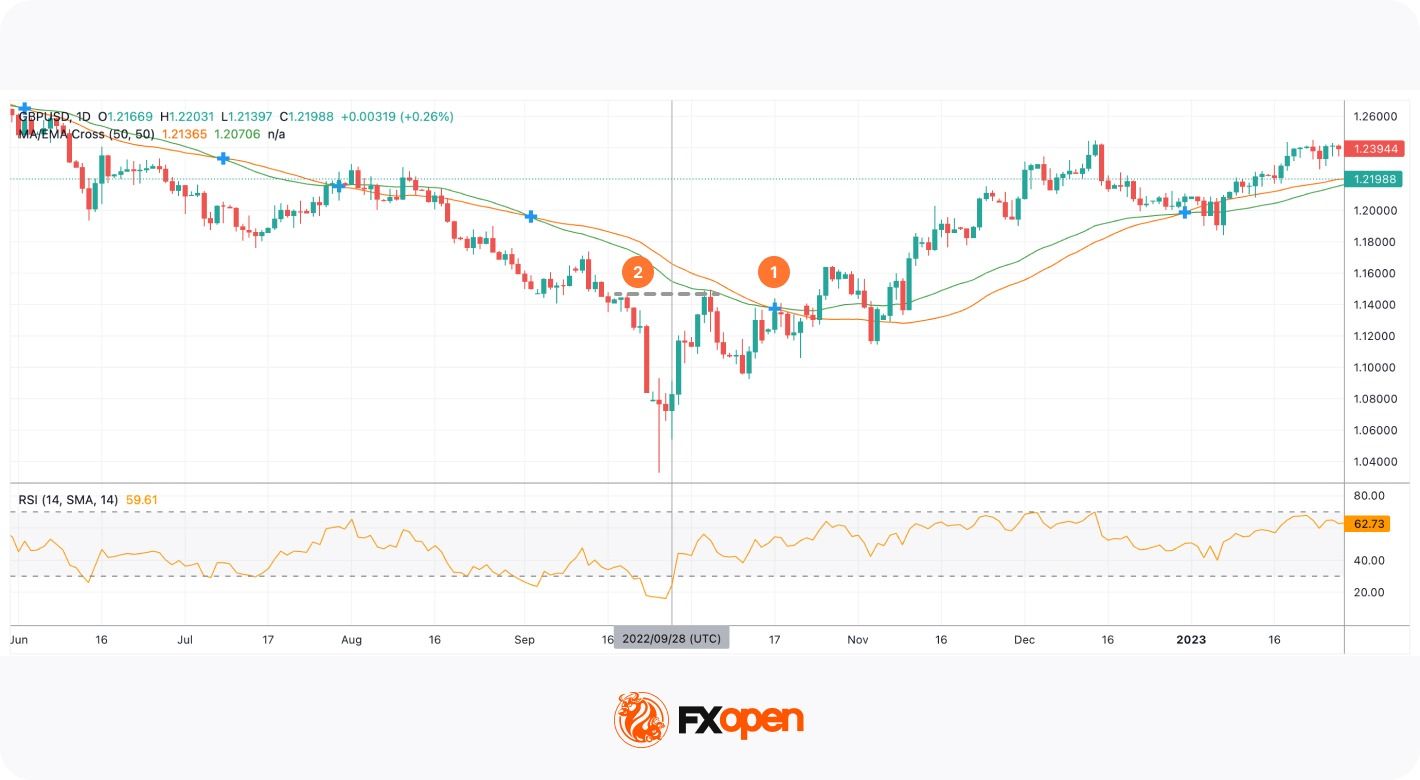
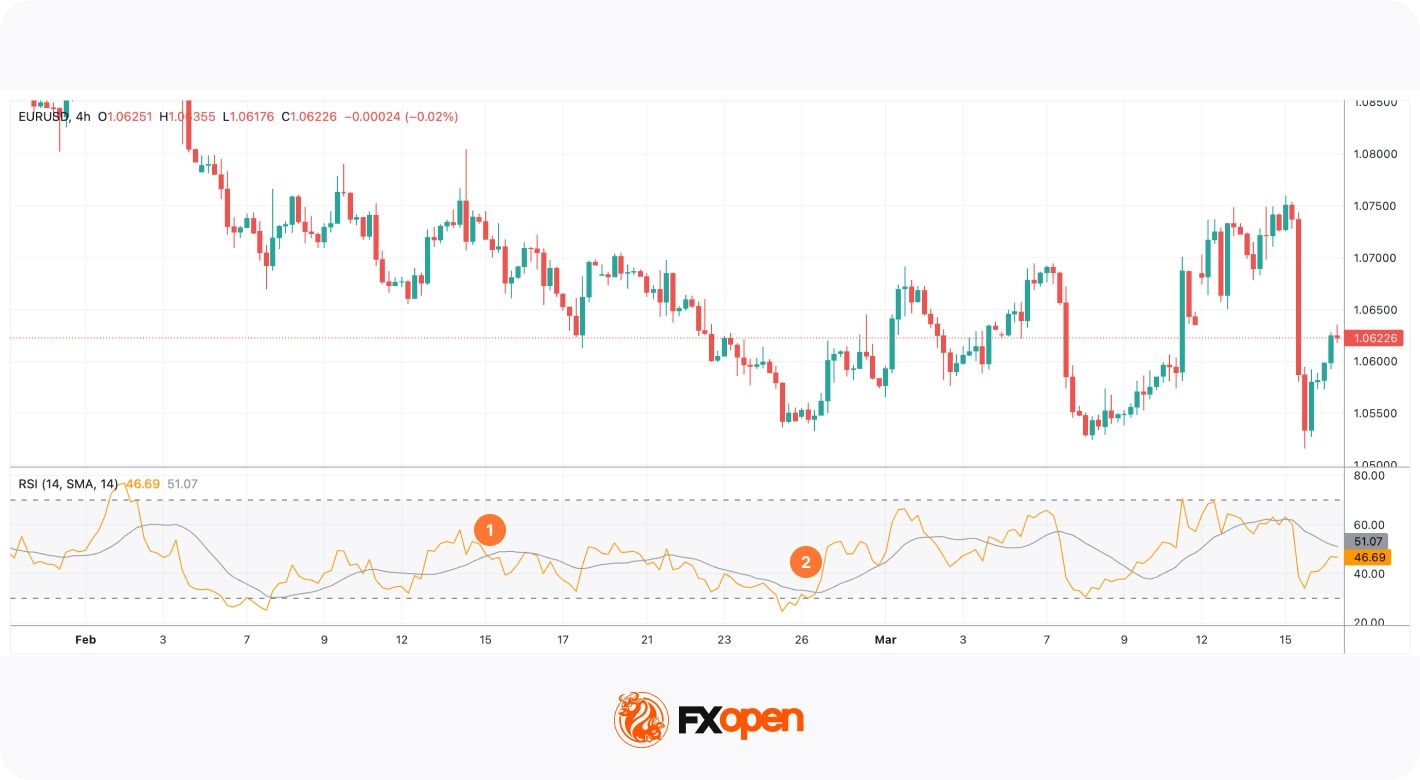
Oversold RSI strategy
On the chart above, the RSI broke above the 30 level on 28th September. A trader could go long, using a trailing take profit. After the MA/EMA cross occurred (1), a trader could trail the take-profit target. Another option would be to place the take-profit order at the closest resistance level (2) and wait for the cross to confirm the reversal signal. After the confirmation, a trader could open another buy position and drive the uptrend.
RSI Divergence Strategy
RSI is a divergence indicator. Another option for using the RSI is to look for divergences between the indicator and the price chart. Divergence occurs when price action and indicator momentum move in opposite directions, signalling a potential shift in underlying market dynamics.
A convention widely used in exchange educational materials is:
- An RSI bullish divergence forms when price records a lower low while the RSI prints a higher low. This pattern indicates that selling pressure is weakening even as price continues to decline.
- An RSI bearish divergence, by contrast, appears when price reaches a higher high but the RSI forms a lower high, suggesting diminishing upward momentum.
Divergence is more popular when it occurs near key support or resistance levels. However, because divergence can persist for extended periods before price reverses, it is rarely traded in isolation. Many traders confirm RSI divergence using tools such as the MACD or structural breaks in market structure.
Hidden divergence is another variation that signals trend continuation rather than reversal. In trending markets, this form of divergence may help traders identify pullbacks that are likely to resolve in the direction of the prevailing trend.
- A bullish divergence forms when the price rises with higher lows, but the relative strength index declines with lower lows, traders expect the price to move upwards.
- A bearish divergence forms when the price falls with lower highs, but the relative strength index moves upwards with higher highs, traders believe the price will decline.
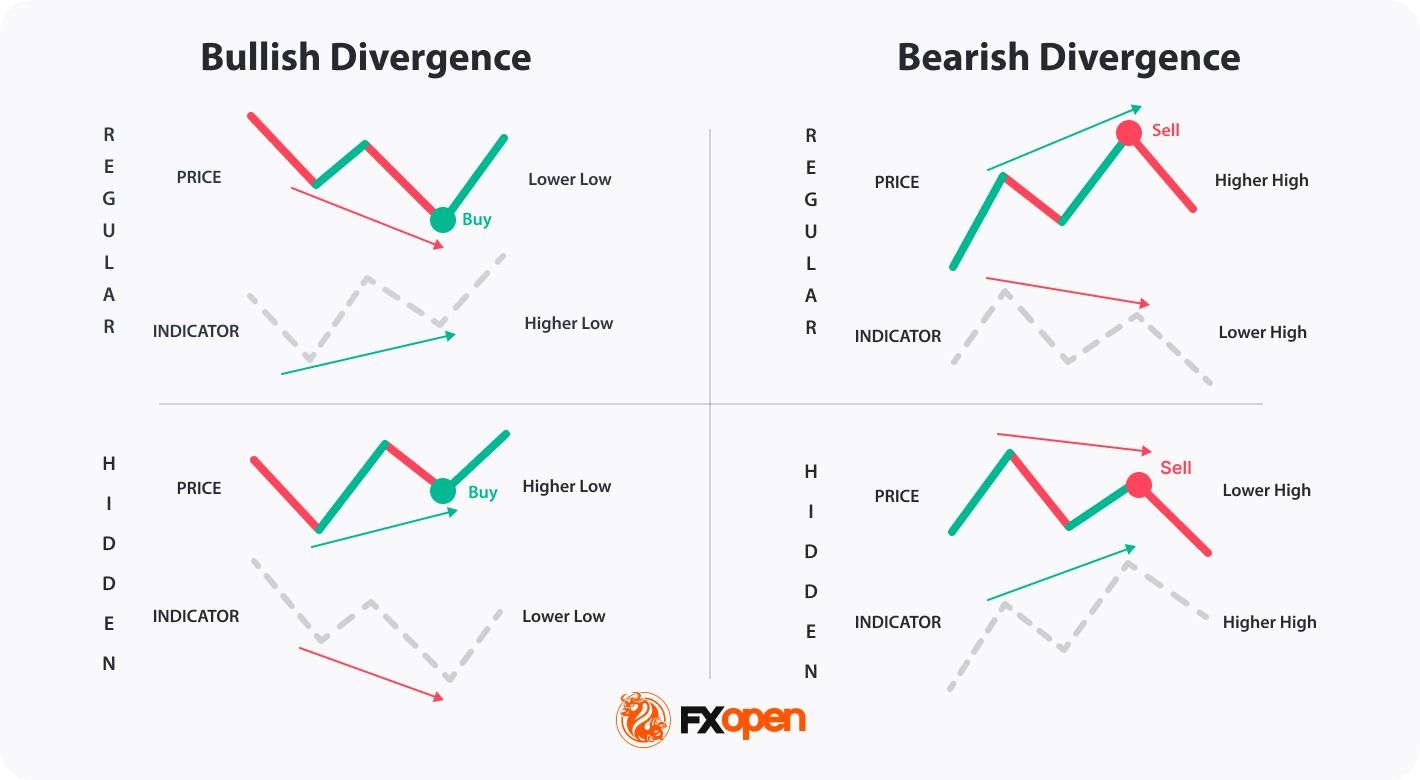
Regular and hidden RSI divergence
Divergence frequently precedes momentum slowdown instead of immediate reversal. Markets often transition into consolidation before changing direction, which is why many traders wait for structure breaks rather than trading the first divergence signal. For example, in liquid index markets the first divergence often leads to range formation before trend change.
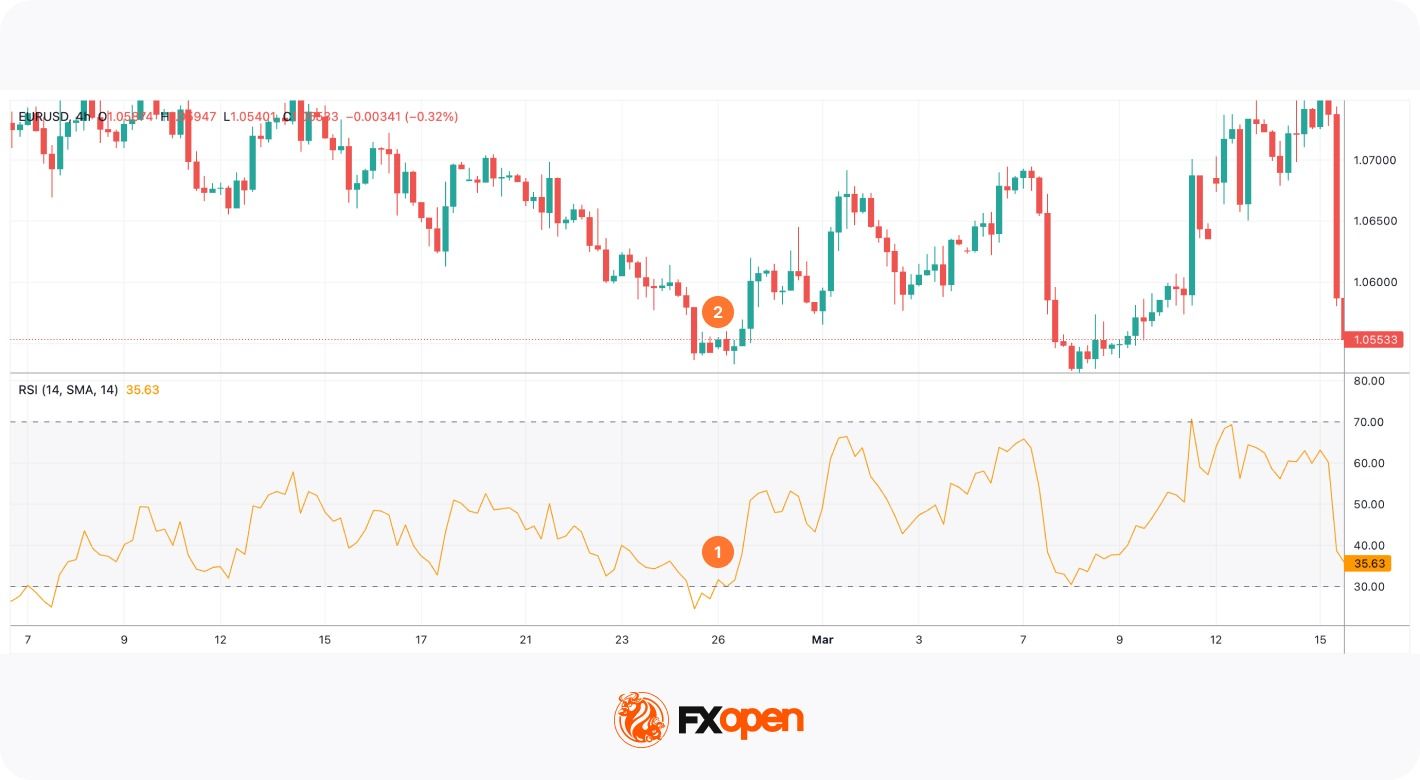
In the RSI example chart below, the indicator and the price formed a regular bearish divergence. As a result, the price fell (1). There was another divergence before the fall, but the price decline was short-lived (2). This highlights risks associated with the incorrect signals the RSI divergence may provide.
An example of the RSI divergence
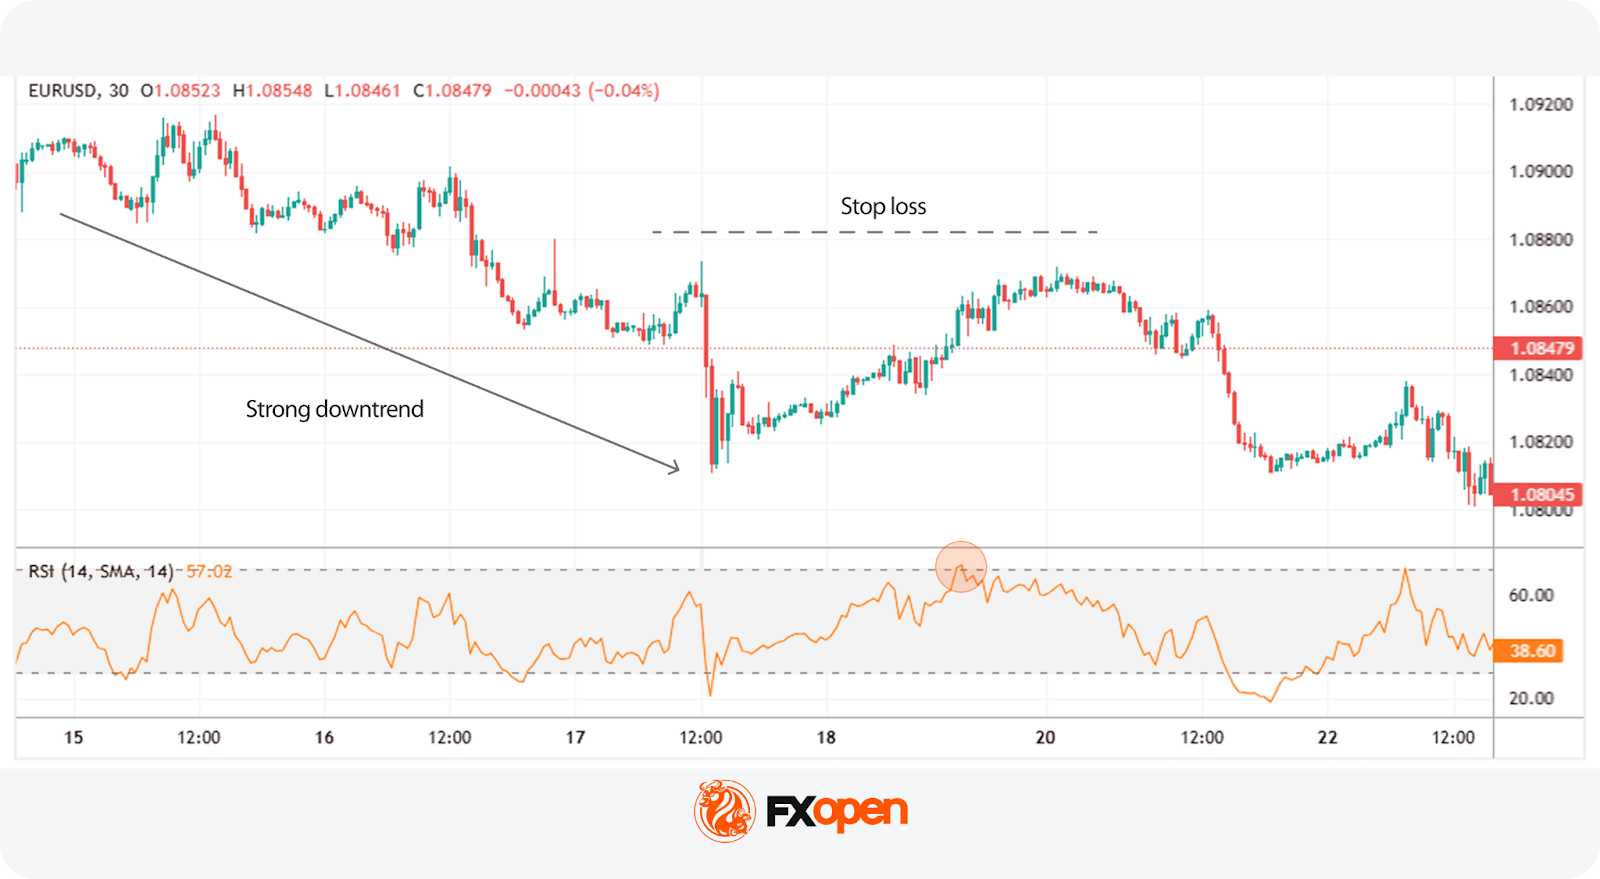
RSI Failure Swings: A Reversal Signal
Another signal that traders can consider is failure swings of the RSI which occur before a strong trend reversal. Although it is less common than the others, traders can add it to their list of tools.
The theory suggests traders don’t consider price actions but look at the indicator alone.
- Bullish reversal. A trend may turn bullish when the RSI breaks below 30, leaves the oversold area, falls to 30 but doesn’t cross it and rebounds, continuing to rise.
- Bearish reversal. A trend may reverse down when the RSI enters the overbought area, crosses below 70, and returns to 70 but bounces and continues falling.
An example of RSI failure swings
Failure swings lose significance during volatility expansion events such as economic releases, when directional movement is driven by repricing rather than momentum decay.
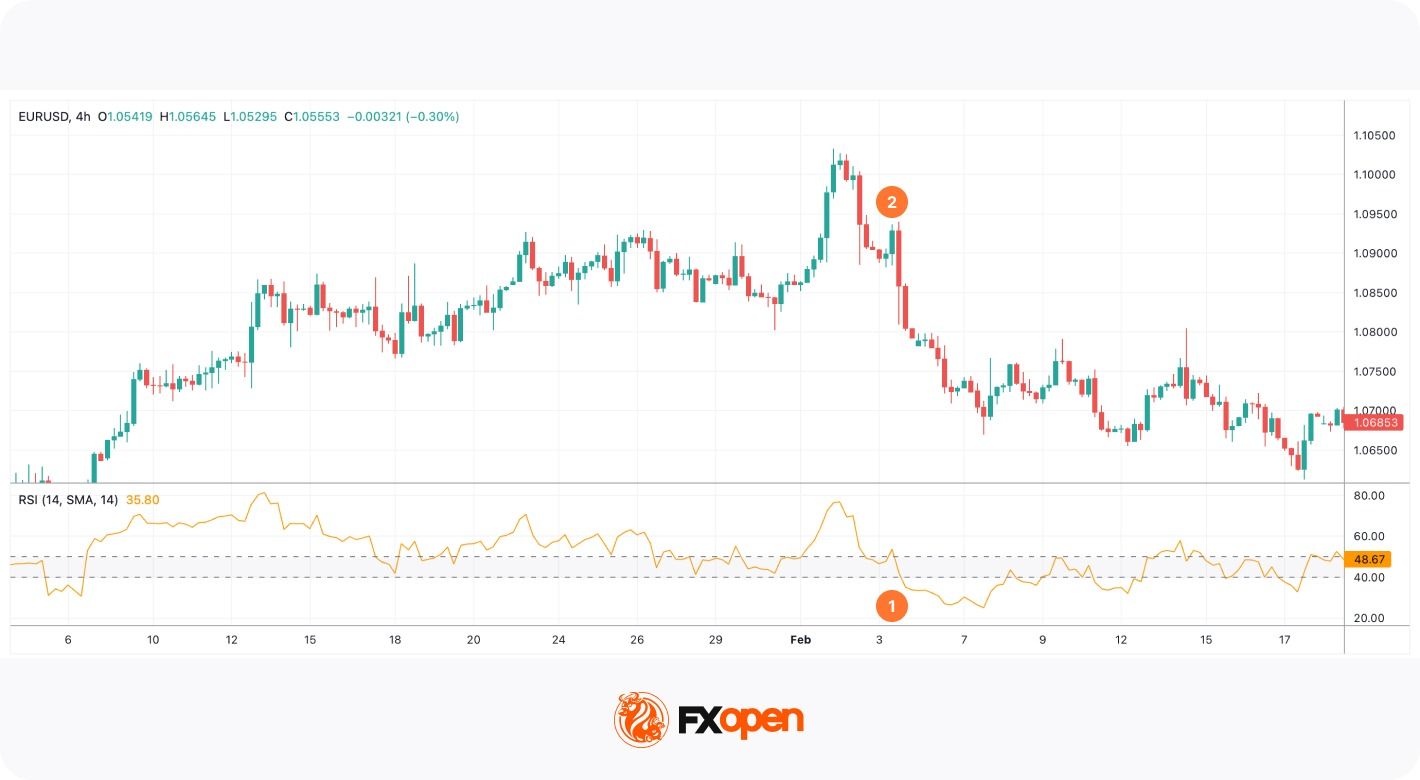
In the chart above, the RSI trading indicator broke below 30, left the oversold area, and retested the 30 level (1). At the same time, the price formed the bottom, and the downtrend reversed upwards (2).
Failure swings are more common on short-term timeframes and do not always reflect a trend reversal. Therefore, traders combine the RSI with trend and volume indicators.
How Traders Identify Market Trends with RSI
The RSI can be used to identify a trend direction. Constance Brown, the author of multiple books about trading, noticed in her book Technical Analysis for the Trading Professional that the RSI indicator doesn’t fluctuate between 0 and 100. In a bullish trend, it moves in the 40-90 range. In a bearish trend, it fluctuates between 10 and 60.
To identify the trend, traders consider support and resistance levels. In an uptrend, the 40-50 zone serves as support. In a downtrend, the 50-60 range acts as resistance.
An example of trend determination using the RSI
In the chart above, the RSI stayed above 40 as the price was moving in a solid uptrend. Once it broke below the 40-50 support level (1), the trend changed (2).
However, there may be incorrect signals. In the chart below, the RSI broke below the support level twice, but the trend didn’t change.
An example of unsuccessful trend detection using RSI
Ranges may vary depending on the trend strength, price volatility, and the period of the RSI.
RSI and Simple Moving Average
Usually, the RSI indicator consists of a single line. However, there are variations of the indicator. It can be combined with the simple moving average. The moving average usually has the same period as the RSI.
The rule is that when the RSI breaks below the SMA, the price is supposed to fall (1). When the RSI rises above the SMA, the price is expected to increase (2).
RSI and Simple Moving Average
However, there are some aspects to consider. Firstly, traders avoid using RSI/SMA cross signals in the ranging market as the lines move close to each other and cross all the time, providing many fake signals. Secondly, a cross doesn’t determine the period of a rise or a fall. Traders use additional tools to identify where the price may turn around.
Note: The RSI is sensitive to volatility clustering. During news-driven sessions the indicator’s thresholds lose value because price movement is distribution-driven rather than momentum-driven.
RSI Trading Strategies Used by Professional Traders
Professional use of the RSI typically involves integrating the indicator into structured trading frameworks rather than relying on single signals. Several widely used approaches illustrate how momentum analysis can support decision-making.
What Is the 70-30 RSI Trading Strategy?
70-30 RSI Trading Strategy
The 70-30 RSI strategy simply uses the overbought and oversold RSI readings to identify potential turning points. However, instead of simply going short above 70 (overbought RSI) and long below 30 (oversold RSI), traders typically apply a few levels of refinement.
Entry:
- Traders determine if the trend is bullish or bearish.
- They apply a trend filter. The RSI can produce false signals in a strong trend, showing overbought for a long time in a bullish trend and vice versa. They often use the 70-30 strategy to look for shorts when the price rallies in a downtrend and longs when the price dips in an uptrend.
- They enter the market when the RSI crosses back into the normal range. For instance, they’ll open a short trade when the RSI falls back below 70, indicating that a potential bearish reversal may be underway.
Stop Loss:
- Stop losses are often set beyond a nearby swing point.
Take Profit:
- Profits might be taken at an area of support or resistance when the RSI hits the opposite extreme (e.g. 70 when long), or when other indicators signal a price reversal.
Mean-reversion RSI strategies statistically depend on market volatility compression. As volatility expands, breakout continuation tends to dominate over oscillator reversal signals.
50-60 and 40-50 Trading Strategies
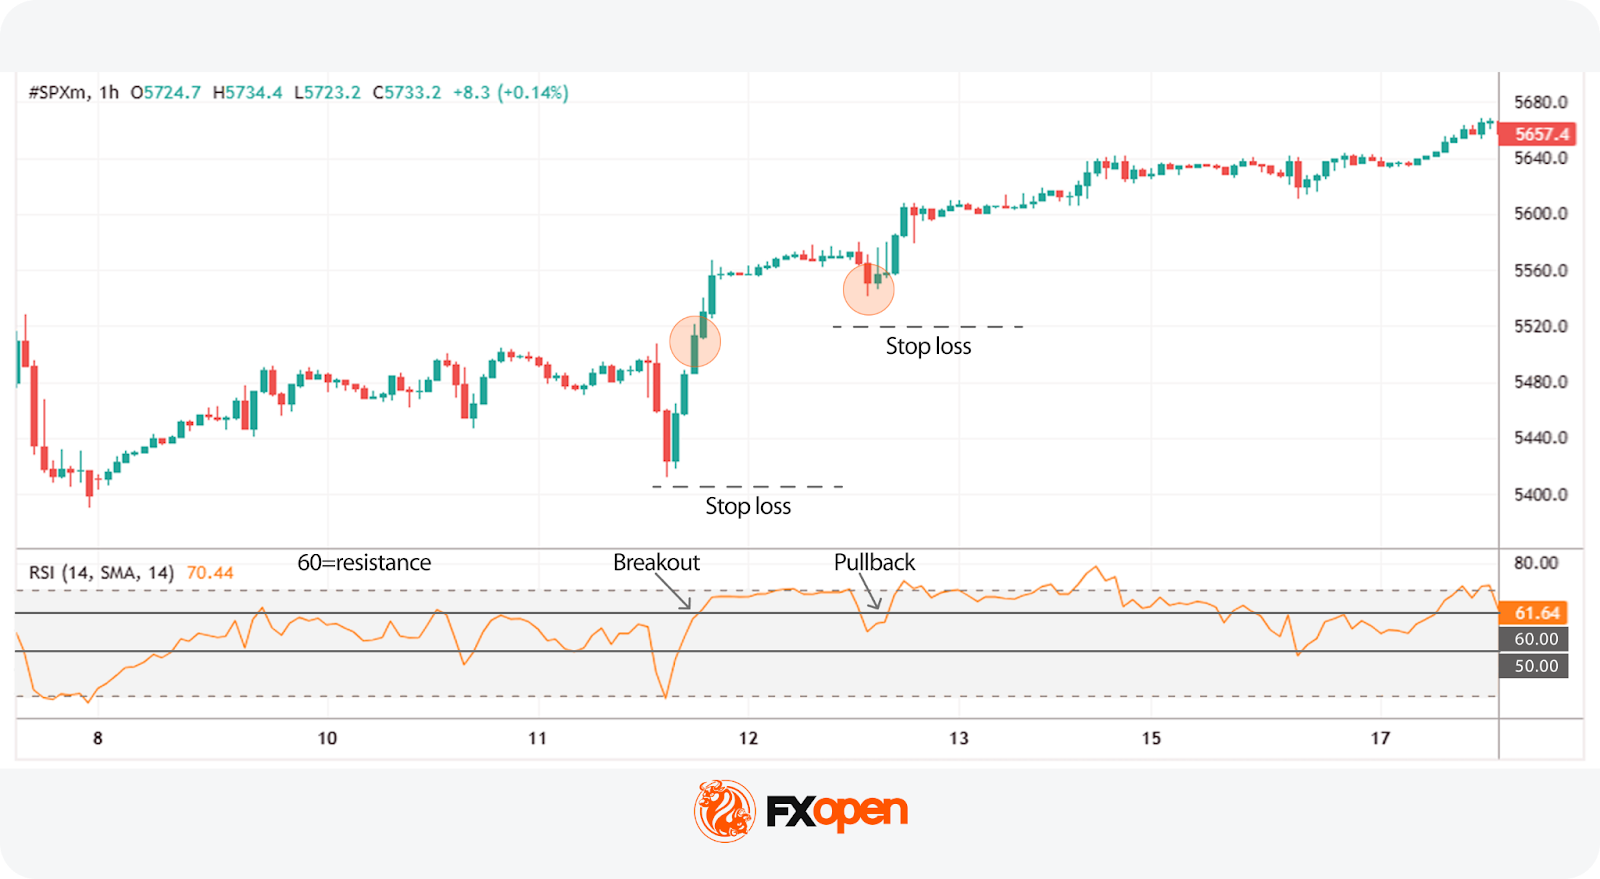
50-60 RSI Trading Strategy
What is the 50-60 RSI trading strategy? The 50-60 RSI strategy works on the idea that the market shows bullish momentum above 50, with 60 acting as a resistance level. When the price breaks through 60, it can signal that bullishness is strong, offering a potential entry point.
Note:
- Despite the name, the same logic can be applied in a bearish trend, where 40 acts as a support level.
- This strategy is popular in markets with a strong trend. Indices, such as the S&P 500 and Nasdaq 100, or commodities like gold, that exhibit strong trends are often chosen by traders.
Entry:
- Traders may enter the market when the price crosses above 60 for the first time.
- Alternatively, they might wait for a pullback to 60 before going long.
Stop Loss:
- A stop loss may be set beyond the nearest major swing point or just beyond the entry candle on a pullback.
- Alternatively, some traders manually stop out if the price crosses below 50.
Take Profit:
- Profits might be taken when the price crosses below 50, giving room for the trade to run in a strong trend. However, this may limit potential returns when trading on short-term timeframes. Therefore, some traders prefer the closest resistance levels.
Typical RSI Strategy Comparison
RSI Meaning in Trading: Forex, Stocks, and Crypto* Markets
The RSI is applied across asset classes, but it behaves differently because persistence characteristics vary. Equity indices exhibit autocorrelation, currencies exhibit mean reversion around macro levels, and digital assets display momentum clustering. RSI interpretation should therefore be adjusted to the instrument’s structural behaviour rather than fixed thresholds.
In forex trading, where macroeconomic factors often drive sustained directional moves, the RSI is commonly used to identify pullbacks within trends rather than outright reversals. Currency pairs can remain overbought or oversold for extended periods when central bank policy or macro data supports a strong directional bias.
What is the RSI indicator in the stock market? In the stock markets, the indicator is frequently applied to mean-reversion strategies around key support and resistance levels. Stocks tend to exhibit more frequent range-bound behaviour than major currency pairs, making traditional overbought-oversold interpretations somewhat more applicable.
Cryptocurrency* markets, characterised by high volatility and rapid sentiment shifts, often produce extreme RSI readings. In this environment, divergence analysis becomes particularly valuable, as momentum frequently weakens before price reverses.
How to Use the Relative Strength Index with Other Indicators
In professional trading systems, the RSI is rarely used in isolation. Combining momentum analysis with trend, volatility, and volume tools may help traders filter signals and false entries.
RSI with MACD
RSI and MACD (moving average convergence divergence) are oscillators. However, they measure momentum differently, which allows one to confirm the signals of another. Usually, traders look for RSI overbought/oversold signals and MACD divergence. For instance, when the RSI is in the oversold zone but the MACD has a bullish divergence with the price chart, traders consider this a confirmation of a coming price rise. Read our article RSI vs. MACD.
RSI with Moving Averages
Early signals are one of the limitations of the RSI indicator. Therefore, traders often combine them with lagging technical analysis tools. An exponential moving average (EMA) is one of the options. Traders add two EMAs with different periods to the chart and wait for a cross to confirm the trend reversal signal the RSI provided.
RSI with Bollinger Bands
Bollinger bands are used similarly to the RSI, showing when the market is possibly overbought or oversold. Used together, these two indicators can provide confluence; for example, if the RSI indicates overbought and the price has closed through the upper band, then there may be an increased likelihood of a bearish reversal, and vice versa.
RSI with On-Balance Volume (OBV)
The on-balance volume (OBV) is a tool that tracks volume to confirm trends. Paired with the RSI, it has two uses. The first is that it can indicate trend strength. If the RSI is falling alongside the OBV, the bearish trend is likely genuine and vice versa. The second is confirming divergences. The OBV can diverge from the price like the RSI, so if both diverge, a reversal may be inbound.
Using RSI on Trading Platforms
Most trading platforms include the RSI as a standard built-in indicator. Platforms such as MetaTrader 4 and MetaTrader 5 allow traders to adjust periods, apply smoothing, and set custom alert levels. Also, you can implement the RSI indicator into your trading strategy on TradingView and TickTrader platforms, which also allow you to set up the indicator for your unique trading style.
Professional traders often integrate RSI signals into multi-timeframe analysis. For instance, a higher-timeframe RSI reading may define directional bias, while a lower-timeframe signal provides entry timing. This approach reduces the likelihood of trading against broader market momentum.
Pros and Cons of the RSI Indicator
Although the relative strength index is one of the most popular indicators, it has limitations. Let’s explore the two sides of the coin.
Benefits of the RSI in Trading
The relative strength index is a useful tool because of:
- Numerous signals. The RSI provides different signals so traders with different trading approaches can add it to their tool list.
- Numerous assets and timeframes. One of its advantages is that you can use the RSI on any timeframe of any asset. What does the RSI stand for in stocks? The same thing that it stands for in forex, commodity, and cryptocurrency* markets.
- Simplicity. Despite the wide range of signals, it’s easy to remember them. If you are familiar with other oscillators such as the stochastic oscillator, you will quickly learn how to use the RSI indicator.
- Standard settings. Although you can change the period of the RSI, its standard period of 14 is used in many trading strategies.
- Working signals. The RSI is one of the most popular trading tools. However, the reliability of its signals depends on trader skills and market conditions.
Limitations and False Signals of RSI
Although the RSI is a functional tool, there are some pitfalls traders should consider.
- Weak at trend reversals. The indicator may provide early signals when spotting trend reversal.
- False signals. The relative strength index isn’t a very popular tool in ranging markets.
- Lagging indicator. The RSI is based on past price data, meaning it may be relatively slow to react to sudden movements.
- Overbought/oversold conditions can persist. In strong trends, prices may remain above 70 or below 30 for long periods, leading to premature entries and exits.
Note: The RSI does not determine price direction; it measures the condition of the current move. Its primary value lies in distinguishing continuation conditions from exhaustion conditions.
Final Thoughts
The Relative Strength Index continues to play a central role in technical trading across forex, equities, and cryptocurrency* markets. Its value lies not in reflecting reversals in isolation but in providing insight into the strength and sustainability of price movements. When used alongside trend analysis, volatility measures, and volume indicators, the RSI becomes a powerful component of structured trading strategies.
For traders operating in leveraged CFD and forex markets, proper application involves combining the indicator with broader analytical tools, adapting settings to the trading timeframe, and maintaining disciplined risk management.
You can consider opening an FXOpen account today to build your own trading strategy in over 700 instruments with tight spreads from 0.0 pips and low commissions from $1.50 (additional fees may apply).
FAQ
What Does the RSI Stand For?
RSI stands for relative strength index. It’s a momentum-based indicator that measures the speed and magnitude of price movements.
What Is the RSI Setting?
The only setting of the Relative Strength Index is the period, which reflects the number of past candles used to calculate average gains and losses, affecting how sensitive the RSI is to price changes. The default period is 14, though shorter or longer settings may be applied depending on trading style and timeframe.
How Traders Use the RSI Indicator
The RSI moves between 0 and 100, with >70 meaning the asset is overbought and <30 meaning oversold. It can be used to spot potential market reversals and confirm trend strength.
Is RSI Used in Forex Trading?
Yes. The RSI is widely used in forex to identify pullbacks, confirm trends, and detect divergence signals.
How Do Traders Use RSI Divergence?
Divergence between price and RSI is often used to identify weakening momentum and potential reversals, particularly when confirmed by other indicators or price-structure analysis.
What Is the RSI in Stocks?
The RSI meaning in stocks refers to the same RSI indicator used in other asset classes. It’s used to gauge buying and selling pressure.
Is High RSI Bullish or Bearish?
A high RSI (above 70) signals bullish momentum, suggesting an overbought market and a potential soon downward reversal.
*Important: At FXOpen UK, Cryptocurrency trading via CFDs is only available to our Professional clients. They are not available for trading by Retail clients. To find out more information about how this may affect you, please get in touch with our team.
This article represents the opinion of the Companies operating under the FXOpen brand only. It is not to be construed as an offer, solicitation, or recommendation with respect to products and services provided by the Companies operating under the FXOpen brand, nor is it to be considered financial advice.

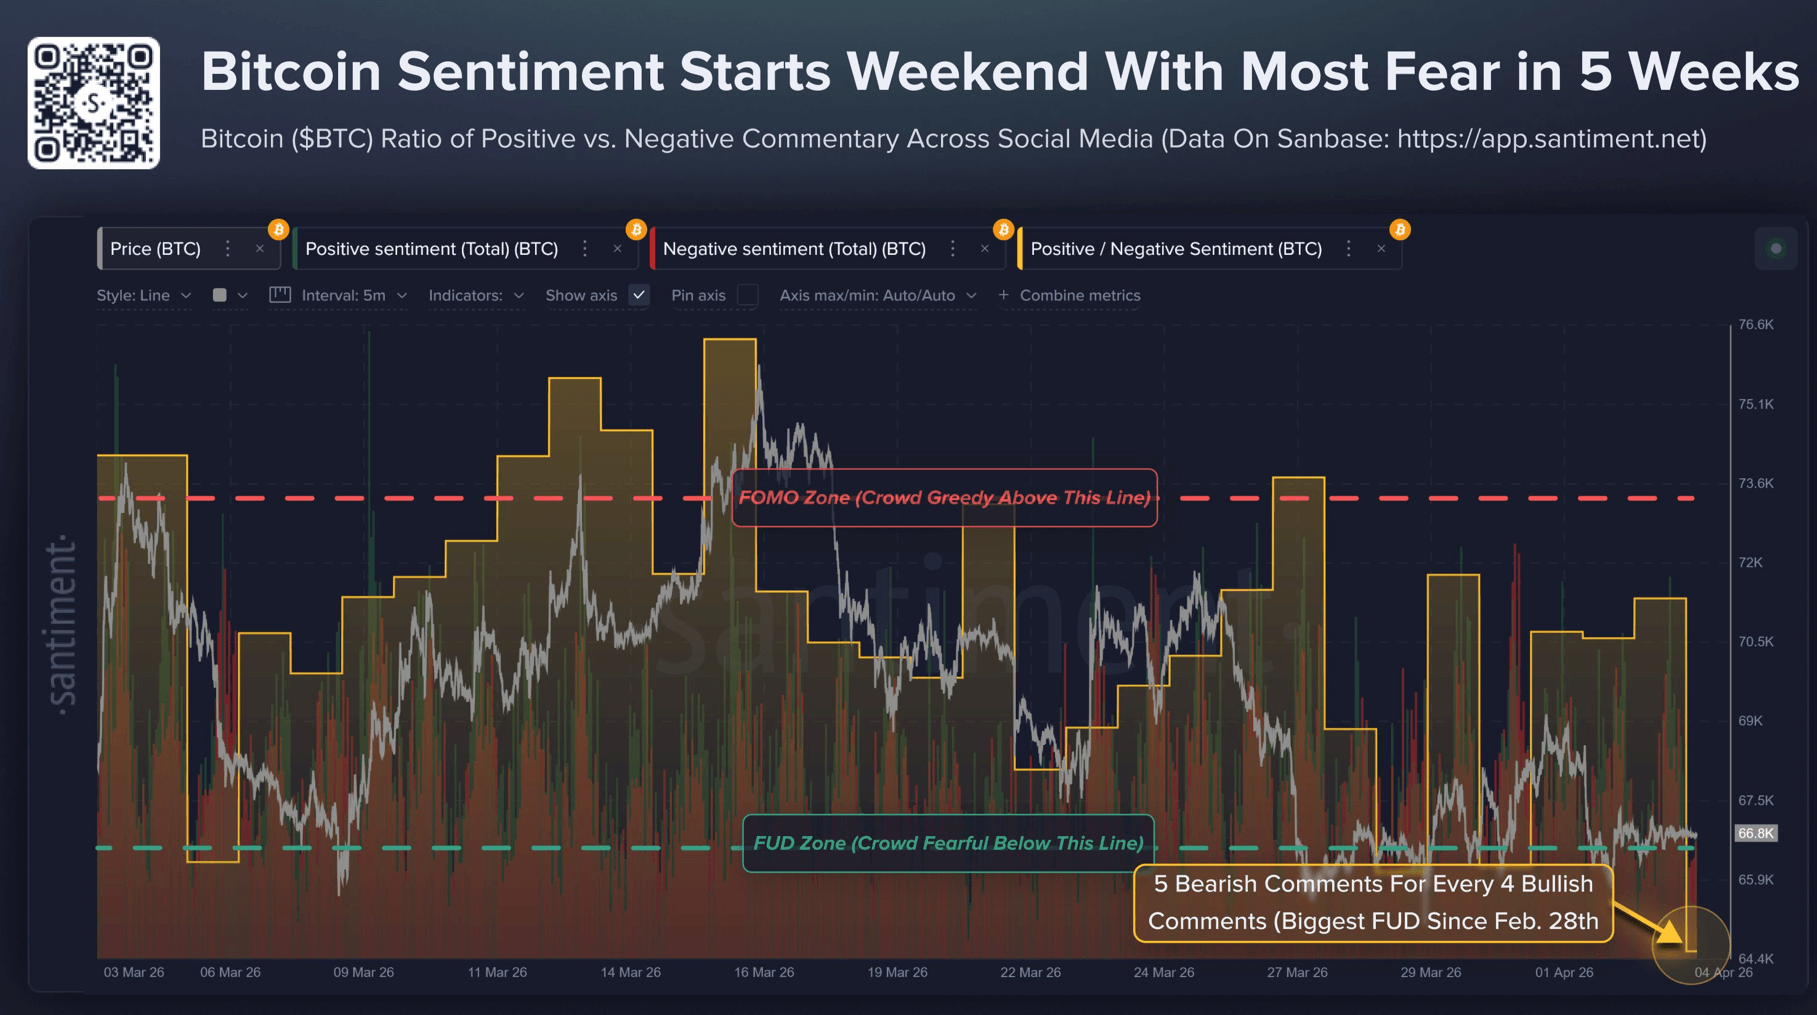
Social media bearishness around Bitcoin has reached its highest level since the end of February, according to crypto sentiment platform Santiment.
“FUD has crept back in with the community showing a key lack of optimism,” Santiment said in an X post on Saturday, adding that it is “usually a common ingredient for prices rebounding.”
The data comes from a large sample of crypto-focused social media accounts and tracks the ratio of bullish to bearish Bitcoin (BTC) comments across X, Reddit, and other social media platforms.
Markets move in “opposite direction,” says Santiment
On Saturday, the ratio of bullish to bearish Bitcoin comments stood at 0.81, the lowest level since Feb. 28.

Bitcoin holders often look at broader market sentiment to guide buying and selling decisions. When sentiment is low, most expect more downside, and when optimism picks up, traders start to expect further upside.
However, Santiment said the market often moves in the opposite way. “Markets typically move in the opposite direction of the crowd’s expectations,” Santiment said. “A high level of FUD like this is a good sign that things can turn positive sooner rather than later,” Santiment added.
Bitcoin is trading at $67,100 at the time of publication, down 5.53% over the past 30 days, according to CoinMarketCap.

Santiment pointed to the US CLARITY Act, which is a highly anticipated piece of legislation that the crypto industry is watching closely, as a potential “what-if” catalyst holding back Bitcoin’s price.
Crypto market sentiment stays in “Extreme Fear”
On Wednesday, Coinbase chief legal officer Paul Grewal said the legislation is “moving toward” a markup hearing in the US Senate Banking Committee and could eventually move to a floor vote if senators resolve the stablecoin yield dispute and schedule a markup.
Related: Rich Bitcoin traders lost $337M daily in first quarter of 2026
Other indicators suggest that investors are taking a cautious approach to the crypto market.
The Crypto Fear & Greed Index, which measures overall crypto market sentiment, has stayed within “Extreme Fear” territory, posting a score of 12 on Sunday.
Magazine: Bitcoin 85% crashes ‘done,’ CLARITY Act speculation mounts: Hodler’s Digest, Mar. 29 – April 4


Quantum computers capable of breaking the Bitcoin blockchain do not exist today. Developers, however, are already considering a wave of upgrades to build defenses against the potential threat, and rightfully so, as the threat is no longer hypothetical.
This week, Google published research suggesting that a sufficiently powerful quantum computer could crack Bitcoin’s core cryptography in under nine minutes — one minute faster than the average Bitcoin block settlement time. Some analysts believe such a threat could become a reality by 2029.
Stakes are high: About 6.5 million bitcoin tokens, worth hundreds of billions of dollars, sit in addresses a quantum computer could directly target. Some of these coins belong to Bitcoin’s pseudonymous creator, Satoshi Nakamoto. Besides, the potential compromise would damage Bitcoin’s core tenets – “trust the code “and “sound money.”
Here’s what the threat looks like, along with proposals under consideration to mitigate it.
Two ways a quantum machine could attack Bitcoin
Let’s first understand the vulnerability before discussing the proposals.
Bitcoin’s security is built on a one-way mathematical relationship. When you create a wallet, a private key and a secret number are generated, from which a public key is derived.
Spending bitcoin tokens requires proving ownership of a private key, not by revealing it, but by using it to generate a cryptographic signature that the network can verify.
This system is foolproof because modern computers would take billions of years to break elliptic curve cryptography — specifically the Elliptic Curve Digital Signature Algorithm (ECDSA) — to reverse-engineer the private key from the public key. So, the blockchain is said to be computationally impossible to compromise.
But a future quantum computer can change this one-way street into a two-way street by deriving your private key from the public key and draining your coins.
The public key is exposed in two ways: From coins sitting idle onchain (the long-exposure attack) or coins in motion or transactions waiting in the memory pool (short-exposure attack).
Pay-to-public key (P2PK) addresses (used by Satoshi and early miners) and Taproot (P2TR), the current address format activated in 2021, are vulnerable to the long exposure attack. Coins in these addresses do not need to move to reveal their public keys; the exposure has already happened and is readable by anyone on earth, including a future quantum attacker. Roughly 1.7 million BTC sits in old P2PK addresses — including Satoshi’s coins.
The short exposure is tied to the mempool — the waiting room of unconfirmed transactions. While transactions sit there awaiting inclusion in a block, your public key and signature are visible to the entire network.
A quantum computer could access that data, but it would have only a brief window — before the transaction is confirmed and buried under additional blocks — to derive the corresponding private key and act on it.
Initiatives
BIP 360: Removing public key
As noted earlier, every new Bitcoin address created using Taproot today permanently exposes a public key onchain, giving a future quantum computer a target that never goes away.
The Bitcoin Improvement Proposal (BIP) 360 removes the public key permanently embedded on-chain and visible to everyone by introducing a new output type called Pay-to-Merkle-Root (P2MR).
Recall that a quantum computer studies the public key, reverse-engineers the exact shape of the private key and forges a working copy. If we remove the public key, the attack has nothing to work from. Meanwhile, everything else, including Lightning payments, multi-signature setups and other Bitcoin features, remains the same.
However, if implemented, this proposal protects only new coins going forward. The 1.7 million BTC already sitting in old exposed addresses is a separate problem, addressed by other proposals below.
SPHINCS+ / SLH-DSA: Hash-based post-quantum signatures
SPHINCS+ is a post-quantum signature scheme built on hash functions, avoiding the quantum risks facing elliptic curve cryptography used by Bitcoin. While Shor’s algorithm threatens ECDSA, hash-based designs like SPHINCS+ are not seen as similarly vulnerable.
The scheme was standardized by the National Institute of Standards and Technology (NIST) in August 2024 as FIPS 205 (SLH-DSA) after years of public review.
The tradeoff for security is size. While current bitcoin signatures are 64 bytes, SLH-DSA are 8 kilobytes (KB) or more in size. As such, adopting SLH-DSA would sharply increase block space demand and raise transaction fees.
As a result, proposals such as SHRIMPS (another hash-based post-quantum signature scheme) and SHRINCS have already been introduced to reduce signature sizes without sacrificing post-quantum security. Both build on SHPINCS+ while aiming to retain its security guarantees in a more practical, space-efficient form suitable for blockchain use.
Tadge Dryja’s Commit/Reveal Scheme: An Emergency Brake for the Mempool
This proposal, a soft fork suggested by Lightning Network co-creator Tadge Dryja, aims to protect transactions in the mempool from a future quantum attacker. It does so by separating transaction execution into two phases: Commit and Reveal.
Imagine informing a counterparty that you will email them, then actually sending an email. The former is the commit phase, and the latter is the reveal.
On the blockchain, this means you first publish a sealed fingerprint of your intention — just a hash, which reveals nothing about the transaction. The blockchain timestamps that fingerprint permanently. Later, when you broadcast the actual transaction, your public key becomes visible — and yes, a quantum computer watching the network could derive your private key from it and forge a competing transaction to steal your funds.
But that forged transaction is immediately rejected. The network checks: does this spend have a prior commitment registered on-chain? Yours does. The attacker’s does not — they created it moments ago. Your pre-registered fingerprint is your alibi.
The issue, however, is the increased cost due to the transaction being broken into two phases. So, it’s described as an interim bridge, practical to deploy while the community works on building quantum defences.
Hourglass V2: Slowing the spending of old coins
Proposed by developer Hunter Beast, Hourglass V2 targets the quantum vulnerability tied to roughly 1.7 million BTC held in older, already-exposed addresses.
The proposal accepts that these coins could be stolen in a future quantum attack and seeks to slow the bleeding by limiting sales to one bitcoin per block, to avoid a catastrophic overnight mass liquidation that could crater the market.
The analogy is a bank run: you cannot stop people from withdrawing, but you can limit the pace of withdrawals to prevent the system from collapsing overnight. The proposal is controversial because even this limited restriction is seen by some in the Bitcoin community as a violation of the principle that no external party can ever interfere with your right to spend your coins.
Conclusion
These proposals are not yet activated, and Bitcoin’s decentralized governance, spanning developers, miners and node operators, means any upgrade is likely to take time to materialize.
Still, the steady flow of proposals predating this week’s Google report suggests the issue has long been on developers’ radar, which may help temper market concerns.
Crypto World
Bitcoin Price Prediction: BTC Drops to $67K but Whales Keep Buying the Dip While Pepeto Loads Quietly

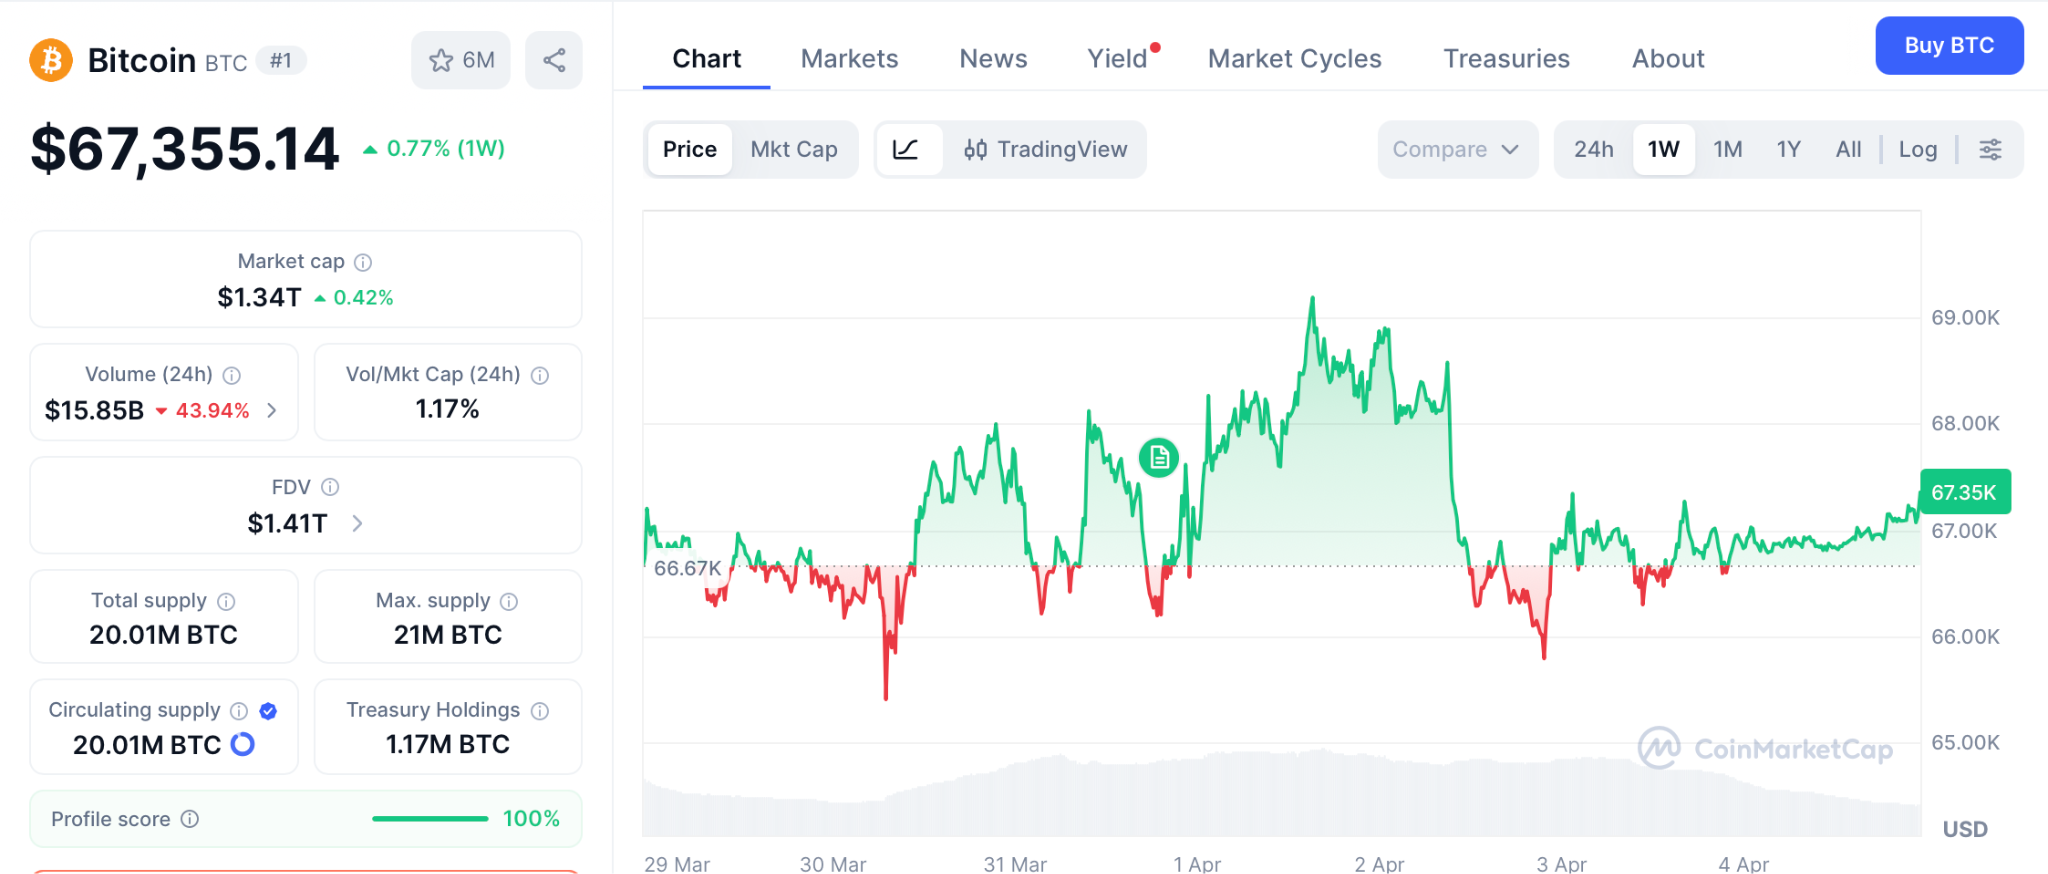
Nearly half of all Bitcoin in circulation is now held at a loss. CoinMarketCap data from April 3 shows 8.8 million BTC, roughly 44% of total supply, sits underwater with $600 billion in unrealized losses as the price hovers near $67,335.
But whale wallets keep adding through the fear while exchange reserves drop to multi-year lows. Pepeto has also proven why it matters. The presale has pulled $8.68 million with the Binance listing approaching, and the real 100x math lives inside the Pepeto presale, not in a large cap at $67,335.
Bitcoin Price Prediction Faces Pressure as 44% of Supply Falls Into Loss Territory
Strategy holds 717,722 BTC at an average cost of $67,335, meaning the largest corporate holder in history is hovering near breakeven as of April 3, according to Phemex. Miners like Riot Platforms sold 3,778 BTC in Q1 alone, adding sell pressure from producers who need cash to cover operations.
BTC dropped from its October 2025 high of $126,198 to $67,335 a 47% decline in six months. The weekly RSI sits at deeply oversold levels not seen since 2018 at $3,500, right before a massive run began.
The bitcoin price prediction will recover because every time this percentage of supply sat at a loss, it marked a redistribution from weak hands to strong ones. But BTC keeps reacting like a risk asset whenever oil spikes and geopolitics flare, and from $67,335, even $100K is only 49% over months.
Bitcoin Price Prediction and the Presale Whales Are Loading While Retail Panics
If you watched BTC run from $16,000 to $126,000 without entering, this window matters. Pepeto is attracting heavy capital during the exact fear conditions that turned 2022 buyers into 2024 winners.
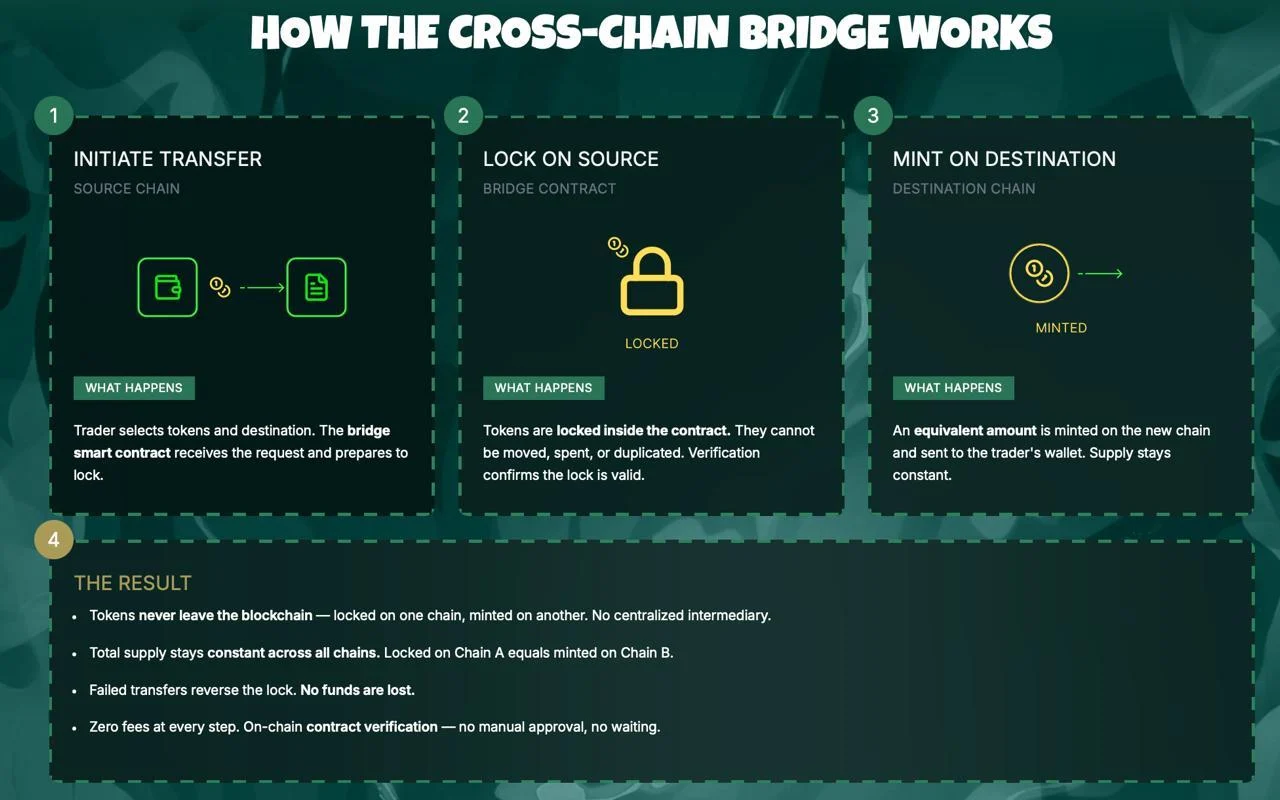
Unlike large caps that bleed with every headline, this exchange already runs during the presale. The bridge transfers tokens between Ethereum, BNB Chain, and Solana at zero cost, so what you send is what lands. The contract scanner checks every token for hidden traps and scam patterns before your capital gets exposed, giving a clear risk score in seconds.
Early wallets are already well ahead, and every round since has pushed the presale past $8.68 million. The Binance listing is coming, and the moment trading begins this presale entry shuts permanently.

A former Binance executive leads the technical architecture. SolidProof completed the full audit before any capital entered, and 188% APY staking grows positions daily while others wait on the sidelines. More exchange listings across CEX and DEX platforms follow Binance.
At the center of Pepeto is the founder who scaled Pepe from zero to an $11 billion market cap with the same 420 trillion supply and zero products. Reaching that valuation from the current entry of $0.0000001862 is over 100x, and Pepeto has PepetoSwap running zero-fee trades, the bridge, and the contract scanner that Pepe never had. The bitcoin price prediction would need BTC past $7 million to match that return, and no analyst alive has projected that number. The fortunes that defined prior cycles were made by wallets that entered infrastructure presales during fear, and Pepeto’s confirmed Binance listing will permanently close this window along with every multiple attached to it.
Bitcoin Price Prediction: Will BTC Recover From $67K and Reach $100K?
BTC trades near $67,335 as of April 4, down 47% from the $126,198 peak, according to CoinMarketCap. Strategy keeps buying through the drawdown. Exchange reserves sit at multi-year lows. The weekly RSI mirrors oversold prints from 2015 and 2018, both before massive rallies.
When the Iran situation settles and markets begin pricing in rate cuts again, the bitcoin price prediction of $100,000 becomes realistic. But from $67,335 that is a 49% return over months. The crash is temporary. But a presale-to-listing multiple of 100x is a return no large cap at $67,335 can deliver in any timeframe.
Bitcoin Price Prediction Points to Recovery but the Presale Delivers What the Recovery Cannot
More than $8.68 million committed while the Fear Index sat near single digits, led by a founder who built $11 billion and a former Binance executive running the exchange. Smart capital reads that setup and enters before the crowd catches on.
The bitcoin price prediction turns bullish the moment sentiment shifts. The wallets watching whale movement patterns have already locked Pepeto at presale pricing. The ones who wait will buy from them after the listing at whatever price those early wallets set. Visit the Pepeto official website and lock the entry that disappears the moment the Binance listing goes live.
Click To Visit Pepeto Website To Enter The Presale

FAQs
What caused the bitcoin price prediction to turn bearish short term?
44% of BTC supply ($600B) sits at a loss, creating sell pressure. Whale accumulation signals a bottom forming.
Does the bitcoin price prediction support buying BTC at $67K?
Yes, the bitcoin price prediction targets $100K recovery, but that is 49% over months, not the multiples presales offer.
What is the strongest entry in crypto right now?
Pepeto at $0.0000001862 with a $7B cofounder, SolidProof audit, and confirmed Binance listing targets 100x from presale.
Disclaimer: This is a Press Release provided by a third party who is responsible for the content. Please conduct your own research before taking any action based on the content.


Todd Blanche is now the interim head of the Department of Justice, and the crypto industry is paying attention for a specific reason that has nothing to do with his biography.
President Trump announced Thursday that Blanche, previously serving as deputy attorney general, would replace Pam Bondi as Attorney General. The real headline: the man who authored the DOJ’s crypto enforcement memo now controls the institution that executes it.
Blanche signed the four-page directive in April 2025 that disbanded the DOJ’s National Cryptocurrency Enforcement Team and instructed prosecutors to stand down from regulatory-violation cases against the crypto industry. That document has already reshaped at least one active prosecution. Its author now runs the department.
Key Takeaways:
- Who He Is: Todd Blanche, Trump’s former personal criminal defense attorney, was confirmed as deputy attorney general in March 2025 and is now interim AG following Pam Bondi’s removal.
- What the Memo Did: Blanche’s April 2025 DOJ memo disbanded the National Cryptocurrency Enforcement Team and barred prosecutors from pursuing regulatory violation cases against crypto firms.
- Ethics Exposure: A ProPublica investigation found Blanche held between $159,000 and $485,000 in crypto assets – including BTC, ETH, SOL, and ADA – when he signed the enforcement memo, potentially violating his divestiture pledge.
- Enforcement Scope: The memo’s reach has already been tested in the Southern District of New York’s case against Tornado Cash developer Roman Storm, where one charge was dropped after prosecutors cited it.
- DeFi Regulation Impact: With Blanche now at the top, enforcement posture on DeFi protocols, mixing services, and unhosted wallets is unlikely to harden in the near term.
- What to Watch: Whether Blanche pursues permanent nomination and how his interim tenure intersects with ongoing federal legislative debates – including FIT21 and the GENIUS Act – will determine how durable this enforcement reset actually is.
Discover: The Best Crypto Presales Live Right Now
What the DOJ Crypto Enforcement Memo Actually Does – and Why Todd Blanche Authorship Changes the Calculus
The memo Blanche signed last April did two things simultaneously: it eliminated the DOJ’s dedicated crypto prosecution unit and it narrowed the prosecutorial mandate to fraud and clear criminal conduct, pulling back from the Biden-era framework that treated regulatory non-compliance as a criminal predicate.
The National Cryptocurrency Enforcement Team, formed in 2022, had been the institutional infrastructure for that broader approach.
The document’s downstream effects were immediate. In the SDNY’s case against Tornado Cash developer Roman Storm, prosecutors referenced the DOJ memo before dropping one charge against Storm – a direct application of the new enforcement philosophy to an active DeFi regulation case.
Storm was later convicted on a separate charge and faces retrial on two more, but the memo’s influence on prosecutorial discretion is already on the record.
Blanche’s elevation to interim Attorney General doesn’t change the memo’s text. It does remove any institutional uncertainty about whether it would survive a leadership transition. The man who wrote the policy now sets DOJ priorities at the highest level.
Discover: The Best Crypto to Get Right Now
Blanche as Interim AG – What Shifts for DeFi, Mixing Services, and Offshore Platforms
The immediate enforcement implication is continuity, not escalation. DOJ under Blanche is unlikely to reopen the regulatory-violation runway the memo closed. That matters most for DeFi protocols operating under uncertain legal status and for mixing services that had been in the crosshairs of the prior enforcement framework.
What’s less settled is the ethics exposure Blanche carries into the role. ProPublica reported that Blanche held crypto assets worth between $159,000 and $485,000 at the time he signed the enforcement memo – a potential violation of his divestiture pledge.
His most recent government ethics disclosure shows he subsequently transferred holdings in Bitcoin, Solana, ADA, Ethereum, Polygon, DOT, and Quant to his children and grandchild. That timeline is now a liability, not a footnote.

For exchanges navigating jurisdiction-specific compliance – the kind of localized licensing pressure seen as platforms push into regulated U.S. markets – the Blanche appointment signals that federal enforcement will remain restrained even as state-level regulators operate independently. The divergence between federal pullback and active state enforcement is the tension that defines this moment.
CBS News reported expectations of a prolonged interim tenure, citing Senate confirmation challenges for a permanent AG. Trump praised Blanche on Truth Social as “a very talented and respected legal mind”; Blanche responded on X: “Thank you for the trust and the opportunity to serve.”
With FIT21 and broader crypto market structure legislation still unresolved in the Senate, the durability of Blanche’s enforcement reset depends heavily on whether Congress codifies the regulatory boundaries the memo only sketched – and whether his ethics exposure becomes a confirmation obstacle before that happens.
Explore: The best pre-launch token sales with asymmetric upside potential
The post Crypto Enforcement Architect Todd Blanche Named Interim Attorney General appeared first on Cryptonews.
Crypto World
Hyperliquid Coin Price Prediction: HYPE Gains Traction While Pepeto Lands on CoinMarketCap With 300x Ahead Of Binance Official Launch
Hyperliquid just launched its mobile app and clocked $205 billion in monthly trading volume, and the hyperliquid coin price prediction now targets $41 by April. With the entire decentralized trading category being treated as a serious threat to the old guard, the signal of where capital flows next is confirmed even as major coins correct.
As a result, traders are entering presale entries in large numbers hoping to find the return that established tokens no longer deliver. With the confirmed Binance listing just days away, the opportunity to enter Pepeto at presale price is shrinking fast. This inspired massive capital rotation as the project has been projected by analysts to deliver 100x to 300x.
Hyperliquid Coin Price Prediction: HYPE Launches Mobile App as $17 Million Oil Liquidation Shakes the Platform
Hyperliquid launched its mobile app MVP on Google Play on April 1 and recorded a $17 million Brent oil liquidation after Trump’s Iran speech, the largest single crypto liquidation of the week.
According to CoinEdition, HYPE trades at $35.65 after pulling back from $44 highs with the Keltner Channel pressing the lower band. 99Bitcoins confirmed HYPE is up 20% on the month, making it one of the strongest performers in 2026.
Pepeto and Hyperliquid forecast heading into April
Pepeto: The wallets buying now are the ones who will enjoy the returns when the listing arrives
Retail traders often feel like they are running blind in a market where most signals are noise and the real opportunities vanish before you can act. Pepeto just landed on CoinMarketCap, confirming the Binance listing draws closer by the day. The exchange platform eliminates that problem with a working exchange platform that cuts through the chaos.
The cross chain bridge moves meme tokens between networks in seconds and the discovery engine surfaces new projects at their earliest price, making it simple to find entries before the crowd and act before the opportunity fades. The interest in this kind of daily tool is strong because Pepeto raised more than $8 million at $0.000000182 during the worst fear readings since 2022.
Wallets are already rushing in to reserve the presale entry because, in addition to delivering the working exchange, Pepeto also inspired 100x to 300x projections from analysts once Binance volume opens. SolidProof cleared the contract before the presale opened, a cofounder of the original Pepe token leads the project, and a former Binance professional drives the listing from inside the dev team. With 420 trillion tokens, an FDV near $78 million, and staking at 188% APY compounding daily, buying at presale price before the listing is the one decision that turns your capital into 300x returns, and the wallets entering now are locking in that return before the listing sets the price.
Hyperliquid coin price prediction: HYPE targets $41 by April and $58 by year end from $35.65
HYPE trades at $35.65, down from its $59 all time high per CoinMarketCap. According to CoinPedia, the HYPE forecast targets $41 by April and up to $90 by year end in the bull case.
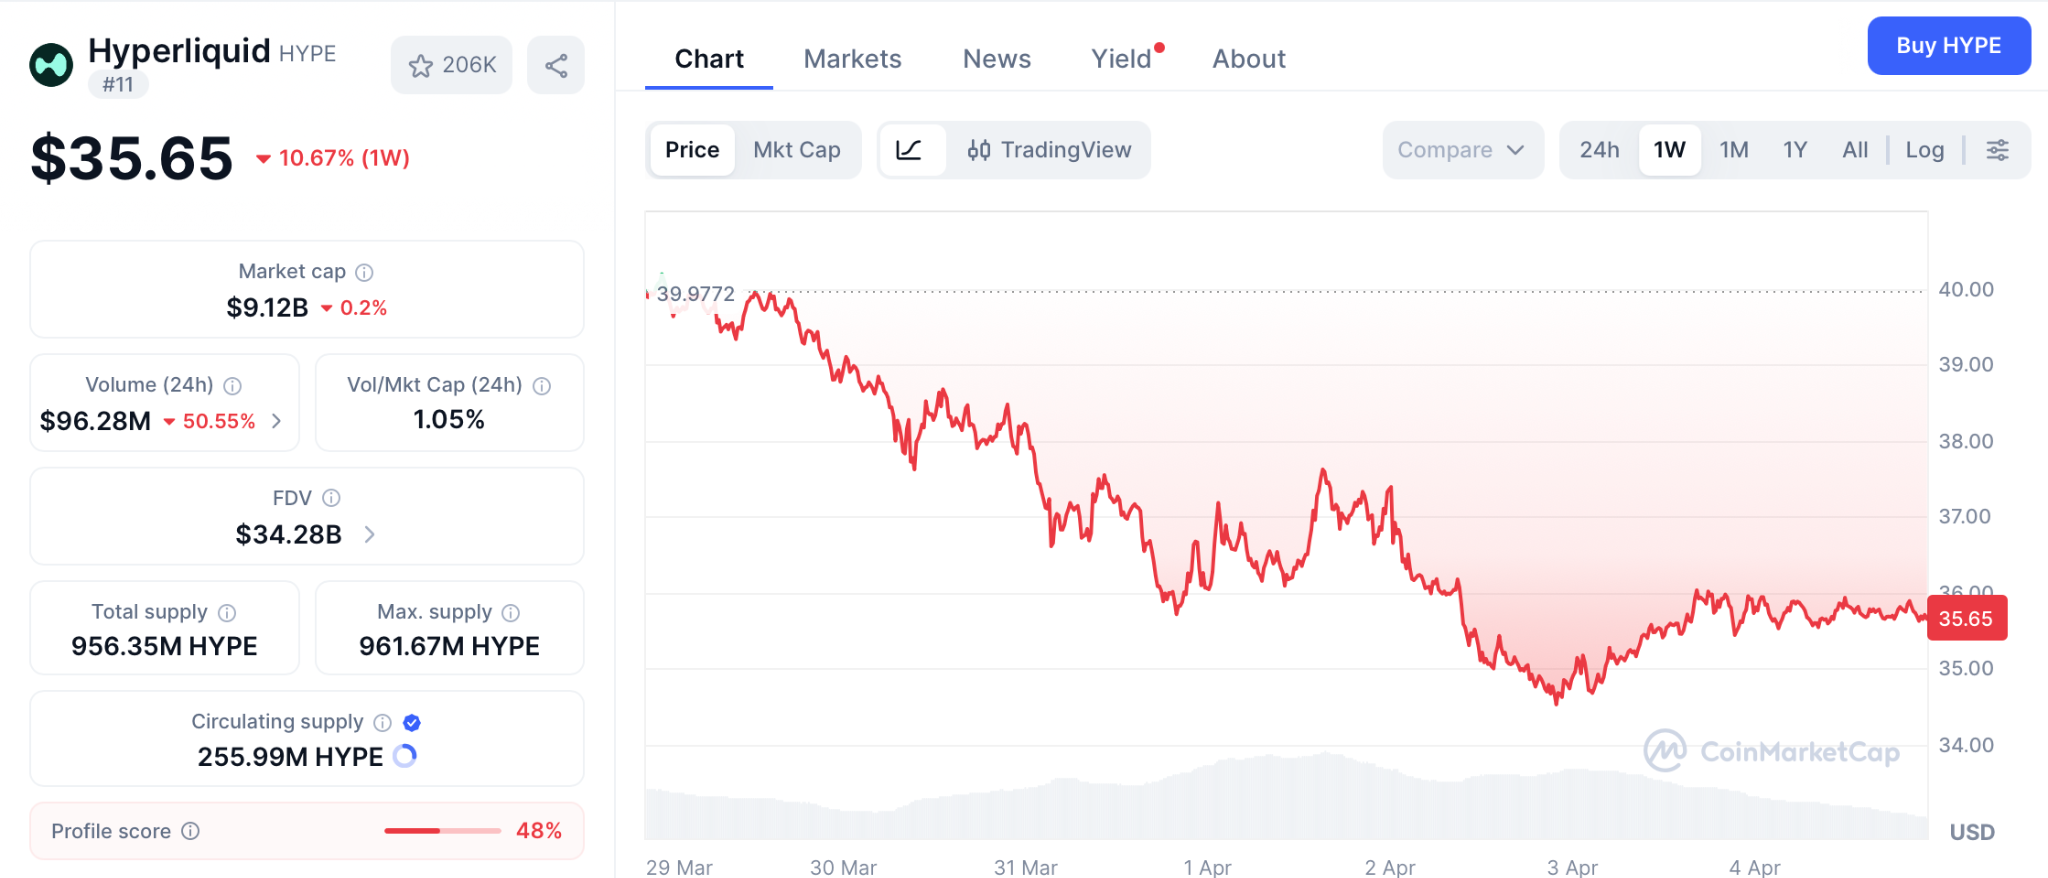
A move from $35.65 to $58 delivers about 66%, strong for a mid cap but structurally limited by a $9.12 billion valuation that needs enormous new capital to deliver more.
Conclusion
The hyperliquid coin price prediction points to limited returns at $9 billion, but despite the Binance listing being days away, Pepeto is still a ground floor play that already has everything necessary to break out, and the wallets entering at presale price are locking in the return that becomes unreachable the moment Binance sets the open market price.
Moonshots are hard to find in a market where HYPE needs billions in new capital to move another 66%, but Pepeto’s working exchange, SolidProof audit, Pepe cofounder, and confirmed Binance listing make the 100x to 300x projection feel grounded because the utility is real, the capital is confirmed, and the listing is the catalyst that converts presale price into the returns that every wallet buying after the listing pays full price to chase.
Visit the Pepeto official website and enter now because buying at presale price before the listing is how the biggest returns in crypto are made and missing this entry means missing the returns the listing delivers.
Click To Visit Pepeto Website To Enter The Presale

FAQs
What is the HYPE forecast for 2026?
HYPE targets $41 by April and $58 to $90 by year end. Pepeto at presale price with a confirmed Binance listing and 100x to 300x projections offers the return ceiling HYPE cannot reach from its $9 billion cap.
Why are hyperliquid coin price prediction followers looking at Pepeto?
HYPE delivers 66% at best from $35.65. Visit the Pepeto official website to see the working exchange and Binance listing that position it for 300x returns from presale price.
Is Pepeto a stronger entry than the HYPE forecast suggests?
HYPE is one of the strongest performers in 2026, but at $9 billion the explosive returns belong to its past. Pepeto at presale price with a confirmed listing is where that kind of return is still available.
Disclaimer: This is a Press Release provided by a third party who is responsible for the content. Please conduct your own research before taking any action based on the content.
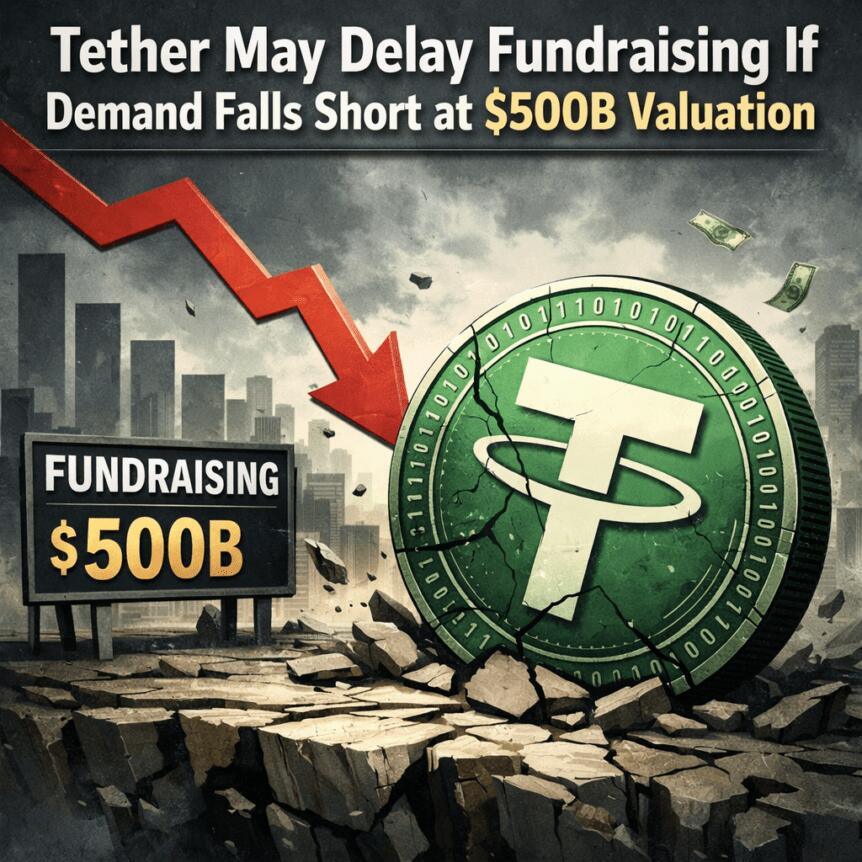
Tether is accelerating a private fundraising push, aiming to secure fresh capital at a stated valuation near $500 billion within a short window. People familiar with the matter say the round could close within roughly two weeks, but management has signaled it may push back the timeline if investor demand falls short of expectations.
The Information reported last Friday that Tether has been seeking new investment since late last year, with the $500 billion target circulating as the implied valuation behind a potential raise. The report notes that if commitments don’t meet expectations, the company is likely to delay the round. The scaled ambition would position Tether among the world’s largest financial firms by market value, far eclipsing most traditional banks outside of JPMorgan Chase, should the round proceed as planned.
According to The Information, the fundraising plan could amount to up to $20 billion in private placements, representing roughly a 3% stake in the company. Cantor Fitzgerald was cited as the lead adviser for the deal. If completed, the round would mark a notable shift for the stablecoin issuer, extending Tether’s reach beyond plain-vanilla stablecoins into broader financial and commodity-related ventures as it frames a multi-line expansion strategy.
Valuation context helps frame the scale. JPMorgan Chase, often cited as the largest bank by market capitalization, sits around $795 billion, with Bank of America at about $353 billion. Tether’s USDt stablecoin — the world’s largest stablecoin by market cap — was around $184 billion at the time of reporting, illustrating the gap between a private fundraising target and the actual on-chain liquidity footprint. Beyond USDt, Tether’s product line includes Tether Gold (XAUt) and Tether EURt (EURt), pegged to gold and the euro respectively, underscoring a broader asset management and distribution strategy alongside its core stablecoin business.
Key takeaways
- The fundraising round aims for a $500 billion implied valuation, with commitments due within about two weeks and a potential delay if demand falters.
- The plan reportedly envisions raising up to $20 billion for roughly a 3% stake, positioning Tether as a major new investor in its own enterprise expansion.
- The Information cites unnamed sources; Cantor Fitzgerald is said to be the lead adviser on the deal.
- Past statements by Tether executives have fluctuated between discussing hypothetical scenarios and signaling active fundraising, with public comments differing from earlier reports.
- Separately, Tether is moving toward a formal audit of USDt, signaling a governance shift as it seeks broader external validation of its reserves and internal controls.
Tether’s fundraising push and the valuation calculus
The Information’s reporting situates Tether’s private fundraising as a strategic attempt to accelerate growth across existing and new business lines — including stablecoins, distribution ubiquity, and potential ventures into AI, commodity trading, energy, and media — by several orders of magnitude, according to statements attributed to the company’s management on X. The publication notes that in September of last year, Bloomberg reported Tether was exploring a raise of up to $20 billion that could value the company around $500 billion, with plans for a private placement that would imply roughly a 3% stake. Cantor Fitzgerald was named as the lead adviser in that report, underscoring the seriousness of the capital-formation effort at a scale rarely seen in the crypto‑fintech space.
Publicly available comments from Tether’s leadership have been nuanced. In February, Paolo Ardoino, Tether’s chief executive, told Cointelegraph that earlier discussions about a $20 billion fundraising scenario were hypothetical rather than an active plan. He argued that the valuation framing reflected the company’s earnings power by comparing it with AI-driven platforms in terms of potential profitability, yet stopped short of articulating a concrete timetable or commitment to raising a specific amount. The company did not respond to Cointelegraph’s requests for comment before publication, leaving investors with a varying degree of clarity about the path forward.
For investors assessing the deal, the implied $500 billion valuation invites comparisons with traditional financial institutions. JPMorgan Chase remains the benchmark large-cap bank by market capitalization, while Bank of America sits notably smaller. USDT’s role in the crypto ecosystem — as the largest stablecoin by market cap at roughly $184 billion — amplifies questions about how a private round and expanded business lines could influence reserve management, liquidity provisioning, and regulatory scrutiny in the months ahead. The market cap figures provide rough scale but do not translate directly into the credit or solvency profile of a private fundraising round; nonetheless, they underscore the magnitude of the ambition behind such a round for a crypto infrastructure firm with a global footprint.
Audits and governance: a shift toward external validation
Beyond fundraising chatter, Tether has moved to bolster governance through formal auditing. The Financial Times reported that Tether has engaged KPMG to conduct its first full audit of USDt’s financial statements, with PwC assisting in preparing internal systems. This marks a shift away from relying solely on reserve attestations from BDO Italia toward a comprehensive audit that would scrutinize assets, liabilities, and internal controls across Tether’s balance sheet. While a reserve attestation provides a snapshot of reserve backing, a full audit promises a more complete view of financial health and governance practices — a development that could affect how market participants perceive USDt’s resilience during stress scenarios.
The push toward external audit coverage aligns with growing calls in the industry for greater transparency around stablecoin reserves and liquidity risk. If successful, the KPMG-led audit could set a new benchmark for the sector and influence conversations with regulators and potential counterparties seeking deeper assurance about stablecoin inventories and treasury management. Tether’s current stablecoin business remains dominant, but how the audit findings are interpreted will likely hinge on the scope, timing, and exact audit opinions delivered by the Big Four firm, alongside any remediation measures the company implements in response to findings.
Related coverage and discussions have emphasized the importance of credible audits to reduce counterparty risk and to bolster confidence among users and institutions that rely on USDt for liquidity, payments, and cross-border transfers. Meanwhile, Tether’s broader product suite — including XAUt and EURt — continues to position the issuer as a diversified, though still crypto-centric, financial services provider. The outcome of the audit process could influence not just USDt’s perceived safety but also investor appetite for any future fundraising rounds and strategic investments tied to the company’s growth plan.
What to watch next in the evolving stablecoin landscape
Several factors will shape the trajectory of Tether’s fundraising, governance initiatives, and broader market impact. First, investor appetite for a multi-hundred-billion-dollar implied valuation hinges on the perceived durability of USDt’s reserves and the credibility of a full audit. Market participants will look for clear outcomes from the KPMG-led audit, including a transparent accounting of assets, liabilities, and internal controls, as well as any findings that could affect reserve adequacy or liquidity management.
Second, regulatory developments across major jurisdictions will influence both the feasibility and timing of large-scale fundraising by a crypto infrastructure firm with a global footprint. While the exact regulatory status of stablecoins remains unsettled in several markets, a demonstrated commitment to external audits can help ease some concerns, though it does not guarantee regulatory approvals or blanket acceptance.
Third, the strategic rationale behind a $500 billion valuation deserves scrutiny. If the fundraising proceeds, investors will want a clear articulation of how proceeds would be deployed to accelerate growth across existing and new business lines, how this expansion would affect the stability and liquidity of USDt, and what governance reforms might accompany scaled operations. The contrast between historical statements that framed funding rounds as hypothetical and the current push toward a defined private placement underscores the need for clarity on governance, risk, and long-term value creation for holders of USDt and related products.
Finally, observers should monitor how market dynamics respond to such a bold capital raise in a sector that already features intense competition among stablecoins, evolving custody and settlement infrastructure, and a continually shifting regulatory climate. The upcoming weeks and months will be telling as Tether balances fundraising ambitions with ongoing governance improvements and broader market sentiment around stablecoins’ role in decentralized finance, cross-border payments, and the broader crypto economy.
In the near term, investors and users will want to see whether the fundraising timing aligns with demand signals, how the 500 billion valuation is justified by growth prospects, and how the audit findings translate into practical steps for risk management and transparency. As Tether elevates its governance and corporate-financial objectives, the broader market will be watching to determine if the company can sustain its leadership role while addressing the scrutiny that accompanies such an ambitious expansion.
The unfolding narrative around USDt — from fundraising ambitions to audit commitments — will likely shape conversations about stablecoin resilience, regulatory expectations, and the path to broader financial integration for crypto-native infrastructure players. Readers should stay tuned for updates on the audit progress, the fundraising milestones, and any formal responses from Tether as it navigates investor feedback and external oversight.
Sources and additional context: The Information reported on the fundraising push and $500 billion valuation plan; September Bloomberg reporting on a potential $20 billion raise with Cantor Fitzgerald as adviser; public statements from Paolo Ardoino on X regarding the fundraising discussions; Cointelegraph coverage of Ardoino’s February comments; Financial Times reporting on Tether engaging KPMG for USDt’s first full audit, with PwC assisting; reserve attestations previously provided by BDO Italia; USDt market capitalization data from CoinMarketCap.
Related coverage: Stablecoin supply dynamics and comparative positioning among major tokens continue to evolve as centralized issuers seek greater transparency and scale.

Bitcoin’s future resilience and decentralization hinge on how conservatively its core node software evolves. Jimmy Song, co-founder of ProductionReady—a non-profit funding open-source Bitcoin node development and education—argues for a “conservative” client approach. In his view, preserving Bitcoin’s monetary properties means resisting large-scale code changes unless there is overwhelming community support.
ProductionReady has a stated bias against major software overhauls, and Song told Cointelegraph the principle is simple: if a change isn’t clearly improving the money itself, it shouldn’t be implemented. A key area of interest for the group is data limits within transactions. Song said the organization intends to restore an 83-byte OP_RETURN data limit for non-monetary information, a move aimed at keeping node storage costs manageable and, by extension, broadening participation in running full nodes. He framed it as a practical way to enhance self-sovereignty: “The more self-sovereign Bitcoin users are, the more decentralized and resilient the network becomes. That means keeping the cost of running a node low enough for ordinary people to do it.”
Song’s stance underscores a broader industry debate: how to balance on-chain capability with decentralization. ProductionReady’s position is that excessive data requirements, if not carefully bounded, can deter everyday users from operating nodes and inadvertently centralize verification power among a smaller group of participants.
Key takeaways
- Conservative node design aims to preserve Bitcoin’s monetary properties and prevent centralization by keeping operational costs accessible to ordinary users.
- ProductionReady advocates restoring the 83-byte OP_RETURN limit for non-monetary data to curb data bloat while preserving self-sovereignty.
- Bitcoin Core’s latest upgrade era has intensified debates over data limits and on-chain spam, prompting renewed attention on node accessibility and network health.
- Bitcoin Knots has gained traction as an alternative node implementation, rising to roughly 4,700 nodes and about 21.7% of the network, according to Coin Dance data.
- The 2024 baseline for Knots was near 1%, highlighting a dramatic shift in the node ecosystem following Core’s changes.
OP_RETURN debate reshapes the node landscape
Central to the discussion is how non-monetary data is handled in Bitcoin transactions. In 2024–2025, the community has grappled with on-chain data limits and their impact on both spam prevention and node operability. The targeted 83-byte cap—designed to allow small metadata without enabling widespread data bloat—has become a focal point for those who see it as essential to maintaining lower running costs and broader participation in network validation. ProductionReady’s approach reflects a cautionary stance: if a protocol change risks making running a node expensive or technically daunting, it should be scrutinized carefully and backed by broad support.
Market observers note that data limits are more than technical details; they influence who can participate in securing the network. In a Bitcoin ecosystem where the number of full nodes acts as a gauge of decentralization, conservative limits can help keep the barrier to entry approachable for independent operators, hobbyists, and smaller operators alike.
Core v30 and the rise of Bitcoin Knots
The past year has seen a dramatic shift in how many participants run non‑core node software. In October 2025, Bitcoin Core version 30 rolled out with a controversial change: the OP_RETURN limit was removed from its 83-byte constraint, allowing much larger data payloads—up to 100,000 bytes. The move sparked a robust pushback from portions of the community, with the GitHub pull request for the change drawing roughly four times as many downvotes as upvotes, according to the PR page.
The outcome of Core 30’s rollout appears to have reshaped the node landscape. Bitcoin Knots—an alternative node implementation—surged in usage, with its share rising to multi-thousand nodes. Current figures show about 4,746 Knots nodes, accounting for roughly 21.7% of the Bitcoin network, while Bitcoin Core remains the dominant implementation at about 77.8% share. Coin Dance data firms the Knots share at around 21.7–21.8%, illustrating a material shift in the distribution of node software choices.
Prior to this shift, Knots represented a much smaller slice of the network—roughly 1% in 2024. The post‑Core 30 period has thus been pivotal in broadening the mix of node implementations, with implications for decentralization, governance, and resilience. These dynamics matter not just for operators choosing software, but for the broader community tracking how changes to consensus and validation are tested across diverse implementations.
As the ecosystem absorbs Core 30’s changes, observers are watching whether the increase in Knots adoption translates into deeper decentralization or if other forces—such as infrastructure costs, governance dynamics, or future protocol tweaks—reassert influence over which node implementations proliferate.
For readers and builders, the Bitcoin node conversation remains a practical reminder: the choice of node software affects who can participate in verification, what data can be stored on-chain, and how resilient the network remains against attempted centralization or manipulation. The balance between protocol evolution and accessible participation will likely determine the network’s long-term robustness.
Going forward, market watchers and network participants alike will want to monitor how proposals around OP_RETURN data handling evolve, how wallet and exchange operators respond to changes in node diversity, and whether any further steps are taken to harmonize performance, security, and cost across different node implementations.
What remains uncertain is how much of the ongoing decentralization push will hinge on formal governance signals from the broader Bitcoin community versus the practical realities of how many operators can realistically afford to run full nodes as data and bandwidth demands shift. In the near term, the trend toward greater node diversity appears to be accelerating, signaling a broader rebalancing of the network’s architecture as stakeholders weigh the trade-offs between scalability, data inclusivity, and fortifying the network’s distributed backbone.
The next phase will likely reveal whether more pragmatic limits, incremental improvements, or broader consensus on non-monetary data usage will prevail—an outcome that will shape who can verify transactions and how resilient the system remains to potential centralization pressures.

TLDR:
- MARA sold 15,133 BTC for $1.1B and used most funds to repurchase $1B in convertible debt.
- The company reduced total convertible debt by nearly 30%, lowering it from $3.3B to about $2.3B.
- Layoffs affecting 15% of staff come as MARA restructures operations across multiple departments.
- MARA is shifting focus toward AI and high-performance computing alongside its mining business.
MARA Holdings has begun workforce reductions shortly after executing a large Bitcoin sale and debt repurchase strategy.
The company sold over 15,000 BTC and used most proceeds to reduce outstanding convertible notes, while also adjusting operational priorities.
MARA Executes Bitcoin Sale and Workforce Reduction
A recent update on X shared by Bitcoin News confirmed that MARA Holdings sold 15,133 Bitcoin for about $1.1 billion.
The transaction came just days before the company initiated layoffs affecting roughly 15% of its workforce. The cuts span several departments, signaling a broad internal adjustment.
According to the same update, the company directed most of the sale proceeds toward repurchasing $1 billion in convertible senior notes.
This move aligns with efforts to reduce financial obligations and improve balance sheet strength. The timing of the layoffs alongside the financial restructuring has drawn attention across the crypto sector.
Data from NS3.AI indicates that the debt repurchase is expected to save approximately $88.1 million in cash. This reduction provides near-term relief in terms of interest and repayment pressure. At the same time, it lowers the company’s exposure to future conversion risks tied to those notes.
The company’s total convertible debt has decreased by nearly 30% following the transaction. It has moved from around $3.3 billion to approximately $2.3 billion. This marks a notable shift in MARA’s financial position within a short period.
The tweet referenced in the update outlines both the Bitcoin sale and the workforce reduction. It presents a clear sequence of actions, linking capital management decisions with operational changes. The information has circulated widely among market participants tracking mining firms.
Debt Reduction Strategy and Operational Shift
The decision to reduce debt appears closely tied to broader operational planning. By lowering its liabilities, MARA gains more flexibility in allocating capital toward future initiatives. This includes investments beyond its core Bitcoin mining business.
At the same time, the company is expanding into artificial intelligence and high-performance computing. These sectors require substantial infrastructure and energy resources, areas where mining firms already maintain expertise. The shift suggests a move to diversify revenue streams.
Workforce reductions may also reflect this transition. As the company reallocates resources, certain roles may become redundant while new technical demands emerge. This type of restructuring often accompanies strategic pivots in capital-intensive industries.
The use of Bitcoin reserves to manage debt highlights a practical treasury approach. Rather than holding assets passively, MARA converted part of its holdings into liquidity. This allowed the company to address financial obligations without relying on external financing.
Moreover, reducing convertible debt can help stabilize shareholder structure. Convertible notes often carry dilution risks if converted into equity. By repurchasing a portion of these instruments, MARA limits potential dilution over time.
The sequence of actions shows a coordinated financial and operational plan. The company adjusted its asset holdings, reduced liabilities, and streamlined its workforce within a short timeframe. Each step connects to a broader repositioning effort.
While the layoffs mark a challenging moment for employees, they form part of a larger restructuring process. The company appears focused on maintaining efficiency while preparing for expansion into adjacent sectors.
MARA’s recent moves reflect a shift in how mining firms manage capital during changing market conditions. The combination of asset sales, debt reduction, and operational adjustments points to an evolving business model within the industry.
TLDR:
- Solana Agent Skills allows developers to integrate AI tools with blockchain functions using a simple one-line installation.
- The toolkit provides prebuilt components, including security checks, error handling, and version compatibility tools.
- More than 60 community-built skills support areas such as DeFi services, payments, and blockchain infrastructure.
- Platforms like JupiterExchange, Raydium, Helius, dflow, and Metaplex contributed tools to the skills ecosystem.
The Solana Foundation has introduced Solana Agent Skills, a toolkit designed to help developers connect AI tools directly to the Solana ecosystem.
The initiative offers prebuilt components that simplify the creation of AI agents capable of performing on-chain actions.
Prebuilt Skills Aim to Simplify AI Integration With Solana
The Solana Foundation announced the launch of Solana Agent Skills through its official communication channels. The toolkit provides developers with ready-to-use components designed for AI applications interacting with the Solana network.
According to the announcement, developers can install these skills using a single line of code. This approach allows faster integration without complex development steps. As a result, builders can connect AI tools to blockchain functions more easily.
A post shared by the Solana Foundation on X described the purpose of the release. The update stated that developers can embed these skill components directly into AI tools. This setup enables AI agents to perform on-chain operations inside the Solana ecosystem.
The toolkit includes several official skills designed to support development and security practices. These features include common error handling tools and built-in security checklists. Developers can also access compatibility tools designed to maintain version stability during updates.
Another feature within the toolkit supports confidential transfers. This function allows developers to build AI agents that manage certain transactions while maintaining privacy parameters on the network.
Together, these components provide a standardized framework for building AI-powered tools on Solana. Developers can integrate the features quickly while maintaining consistent functionality across projects.
Community Skills Expand AI Capabilities Across the Solana Ecosystem
The Solana Agent Skills toolkit also includes contributions from the wider developer community. More than 60 additional skills are currently available through community development efforts.
These community-built tools extend the capabilities of AI agents interacting with the Solana blockchain. The skills cover several areas across the ecosystem, including decentralized finance services and payment integrations.
Developers can also access infrastructure-related tools designed to assist with blockchain data interactions. Other components focus on developer utilities that simplify AI-powered workflows inside blockchain applications.
Several ecosystem platforms contributed skills to the initiative. These include tools from JupiterExchange, Raydium, Helius, dflow, and Metaplex. Each platform provides specific functionality related to its service area.
Through these integrations, developers can combine AI systems with existing Solana-based platforms. The approach enables AI agents to access services such as trading tools, payment functions, and blockchain data infrastructure.
Foresight News also reported that the toolkit allows developers to build agents capable of interacting with Solana through simple installation steps. The report noted that these integrations require minimal setup compared with traditional blockchain development methods.
The release places AI integration within reach for a wider developer audience. As more contributors add skills to the library, the range of AI-enabled blockchain applications may continue to grow.
Solana Agent Skills therefore, provide a structured way for developers to build AI-powered tools that interact directly with the blockchain network. The framework combines official components with community-built extensions to support a broader range of use cases.
TLDR:
- Japan’s 10-year yield reached 2.393%, marking its highest level since 1999 amid shifting rate expectations
- Rising yields may unwind carry trades, reducing global liquidity that supported stocks and crypto markets
- The long-term chart shows a sharp reversal after years of near-zero rates under loose monetary policy
- Higher domestic yields could redirect capital flows back to Japan and influence global bond markets
Japan’s 10-year government bond yield has climbed to 2.393%, marking its highest level since 1999. The move signals a shift in Japan’s long-standing low-rate environment, drawing attention across global financial markets and raising concerns about tightening liquidity conditions.
Yield Surge Signals Shift in Monetary Conditions
A recent post by Wise Advice noted that Japan has broken a 25-year record as its 10-year yield moved above 2.39%. The update pointed to a changing rate environment that has remained subdued for decades.
The chart shows that yields stayed elevated in the late 1990s and early 2000s before entering a long decline. During that period, rates gradually moved toward near-zero levels. This trend aligned with weak growth and persistent deflationary pressures across Japan’s economy.
By 2016, yields had reached near-zero or negative levels. This phase followed aggressive monetary easing by the Bank of Japan. Yield Curve Control policies kept long-term rates tightly anchored for years.
However, the trend shifted after 2021. The chart shows a steady upward move that accelerated after 2023. The latest reading near 2.4% stands out compared to the flat conditions seen in prior years.
The sharp rise on the right side of the chart reflects a break from the earlier pattern. The move appears stronger than previous cycles, suggesting a change in direction for Japan’s rate structure.
Market participants are now watching for further adjustments in central bank policy. The rise in yields suggests that pricing is adjusting to a less accommodative stance.
Global Liquidity Concerns and Market Reactions
The same post explained that Japan has long served as a low-cost funding source for global markets. Low yields supported carry trades, where investors borrowed cheaply in yen to invest in higher-yield assets.
With yields rising, those trades may begin to unwind. As borrowing costs increase, the appeal of such strategies weakens. This shift can reduce liquidity flows that have supported global markets for years.
The post also noted that tighter liquidity conditions could affect risk assets. Stocks and cryptocurrencies may face periods of volatility as capital flows adjust.
At the same time, higher domestic yields may encourage Japanese investors to keep funds within local markets. This shift could reduce overseas investments, including positions in foreign bonds.
Currency movements are also part of the discussion. Rising yields tend to support the Japanese yen, which has remained weak for an extended period. A stronger currency could further influence global capital allocation trends.
The chart reflects a broader transition from prolonged low rates toward normalization. The pace of the recent increase suggests that markets are adjusting quickly to new expectations.
While the long-term direction remains uncertain, the current data shows a clear departure from past conditions. As a result, investors are closely monitoring policy signals and market responses in the coming months.

48K Salary, 7L Loan – What is the PLAN?! | Money Matters Ep. 106 | Ankur Warikoo Hindi

How to track Storm Dave as heavy snow and wind to hit UK

West Ham Utd vs Leeds Utd – Predicted lineup and team news

Smart energy pays enters the US market, targeting scalable financial infrastructure

Why Israel is blocking foreign journalists from entering

Bitcoin: We’re Entering The Most Dangerous Phase
48K Salary, 7L Loan – What is the PLAN?! | Money Matters Ep. 106 | Ankur Warikoo Hindi

DAVID SCHWARTZ: XRP Bombshell! +70% Market Domination Confirmed!!!

War, Gold and Dollar: How To Protect Your Money Now and What to Avoid Next | Kishore Narne | FWS 106
-

 NewsBeat2 days ago
Steven Gerrard disagrees with Gary Neville over ‘shock’ Chelsea and Arsenal claim | Football
-

 Business2 days ago
No Jackpot Winner and $194 Million Prize Rolls Over
-

 Fashion1 day ago
Weekend Open Thread: Spanx – Corporette.com
-
Entertainment6 days ago
Fans slam 'heartbreaking' Barbie Dream Fest convention debacle with 'cardboard cutout' experience
-

 Crypto World3 days ago
Gold Price Prediction: Worst Month in 17 Years fo Save Haven Rock
-

 Tech6 days ago
The Pixel 10a doesn’t have a camera bump, and it’s great
-
Crypto World5 days ago
Dems press CFTC, ethics board on prediction-market insider trades
-

 Tech6 days ago
Avatar Legends: The Fighting Game comes out in July and it looks pretty slick
-

 Business3 days ago
Login and Checkout Issues Spark Merchant Frustration
-

 Sports8 hours ago
India men’s 4x400m and mixed 4x100m relay teams register big progress | Other Sports News
-

 Tech6 days ago
Apple will hide your email address from apps and websites, but not cops
-

 Tech5 days ago
EE TV is using AI to help you find something to watch
-

 Sports5 days ago
Tallest college basketball player ever, standing at 7-foot-9, entering transfer portal
-

 Politics5 days ago
Should Trump Be Scared Strait?
-

 Tech5 days ago
Flipsnack and the shift toward motion-first business content with living visuals
-

 Tech7 days ago
Elon Musk’s last co-founder reportedly leaves xAI
-

 Fashion6 days ago
The Best Spring Trends of 2026
-

 Tech5 days ago
How to back up your iPhone & iPad to your Mac before something goes wrong
-
Crypto World6 days ago
Bitcoin’s Six-Month Losing Streak: What On-Chain Data Says About the Market’s Next Move
-
Tech5 days ago
Daily Deal: StackSkills Premium Annual Pass
You must be logged in to post a comment Login