
Crypto World
Ripple Co-Founder Leads $40M Push to Counter California Wealth Tax

Ripple co-founder Chris Larsen and venture capitalist Tim Draper have launched Grow California, a $40 million political initiative designed to elect moderate state legislators and push back against labor unions, with a proposed wealth tax serving as the primary catalyst for Silicon Valley’s latest political mobilization.
According to NYT, the effort, which began with $5 million checks from each founder in September, represents one of the most significant financial commitments from the tech and crypto sectors to reshape California politics.
The ballot measure that triggered this response, backed by Service Employees International Union-United Healthcare Workers West, would impose a one-time 5% tax on net worth exceeding $1 billion, including unrealized gains on assets not yet sold.
“Whoever designed that wealth tax in the unions — wow,” Larsen said. “They woke up the sleeping giant like I have never seen.“

Tech Billionaires Challenge Union Influence With Business-Friendly Candidates
Larsen, whose net worth is nearly $15 billion from Ripple holdings and crypto assets, said he expects to personally commit $30 million to the organization.
“If it takes a couple of cycles, fine — that’s what we’re here for,” he told The New York Times when asked about potential November losses.
The group plans to target about a dozen state legislative seats this year, focusing on public safety, homelessness, and budget discipline, according to Shaudi Fulp, the former Sacramento lobbyist leading daily operations.
While Democrats control more than two-thirds of seats in both legislative chambers, Grow California will not engage in the 2026 gubernatorial race or expensive ballot proposition campaigns.
Both founders come from the crypto industry, though they stress that the initiative does not represent the interests of the crypto sector specifically.
Larsen acknowledged learning lessons from Fairshake, the crypto super PAC backed by Ripple that spent over $100 million shaping the current Congress.
Draper, known for Bitcoin-themed accessories and his persistent campaign to split California into multiple states, did not respond to requests for comment.
“The government unions do a great job,” Larsen said, adding with a laugh, “I have respect for the job that they’ve done. They show up, and they’re there consistently. But that’s going to clash with a lot of the things that are going to make California successful if there’s no counterforce.“
Crypto and tech leaders warn California’s proposed 5% billionaire tax on unrealized gains could trigger capital flight and an exodus of high-net-worth residents ahead of the 2026 ballot vote.#CaliforniaTax #CryptoBillionaires https://t.co/Sl1SR9z6Gw
— Cryptonews.com (@cryptonews) December 29, 2025
California Crypto Politics Intensifies Amid Governor Race And Regulatory Expansion
The wealth tax debate coincides with former Assembly member Ian Calderon’s entry into the 2026 gubernatorial race on a pro-Bitcoin platform.
Calderon, 39, who served as Assembly Majority Leader from 2016 to 2020, declared his vision for California to become “the undisputed leader on Bitcoin” in his campaign announcement video.
Meanwhile, Governor Gavin Newsom has intensified criticism of President Donald Trump’s crypto-related pardons, launching a state-backed website tracking what his office calls “criminal cronies.“
The site prominently features Binance founder Changpeng Zhao, who received a full pardon in October after serving four months for Bank Secrecy Act violations, and Ross Ulbricht, whose life sentence for Silk Road operations was commuted.
— Cryptonews.com (@cryptonews) December 17, 2025
 California Governor Newsom slams Trump’s crypto pardons, calling @binance's CZ and Silk Road’s Ross Ulbricht “criminal cronies” in a new state tracker highlighting controversial pardons.#GavinNewsom #TrumpPardons https://t.co/j9Sac1g4Th
Beyond political battles, California continues advancing digital asset infrastructure through the Digital Financial Assets Law, which takes effect in July 2025 and requires all crypto service providers to obtain state licenses.
The Assembly also unanimously passed AB 1180 in June, creating a pilot program for state fee payments using digital assets that runs through 2031.
Global Tax Frameworks Contrast California’s Uncertain Trajectory
While California debates wealth taxation, other jurisdictions are implementing clearer crypto tax structures.
Japan’s 2026 tax reform blueprint reduces crypto taxation from up to 55% to a flat 20% for specified digital assets handled by registered businesses, though the exact qualifying criteria remain undefined.
Similarly, the European Union’s DAC8 tax transparency law took effect on January 1, requiring crypto exchanges and service providers to collect and report user information to national tax authorities, with data sharing between EU countries beginning July 1.
“Tax authorities now have an automated dashboard tracking your digital assets,” wrote Bitcoin educator Heidi Chakos.
— Cryptonews.com (@cryptonews) January 19, 2026
 DAC8 took effect on Jan. 1, giving the EU power to seize crypto linked to unpaid taxes, while negating privacy for individual holders.#Crypto #Tax #DAC8 #EUhttps://t.co/JWKHNvbA3C
However, just like California, South Korea faces mounting uncertainty over its repeatedly delayed crypto tax regime, now scheduled for January 2027 despite lacking essential infrastructure.
Switzerland also postponed the automatic exchange of crypto account information with foreign tax authorities until at least 2027, though legal frameworks take effect in January 2026.
The post Ripple Co-Founder Leads $40M Push to Counter California Wealth Tax appeared first on Cryptonews.

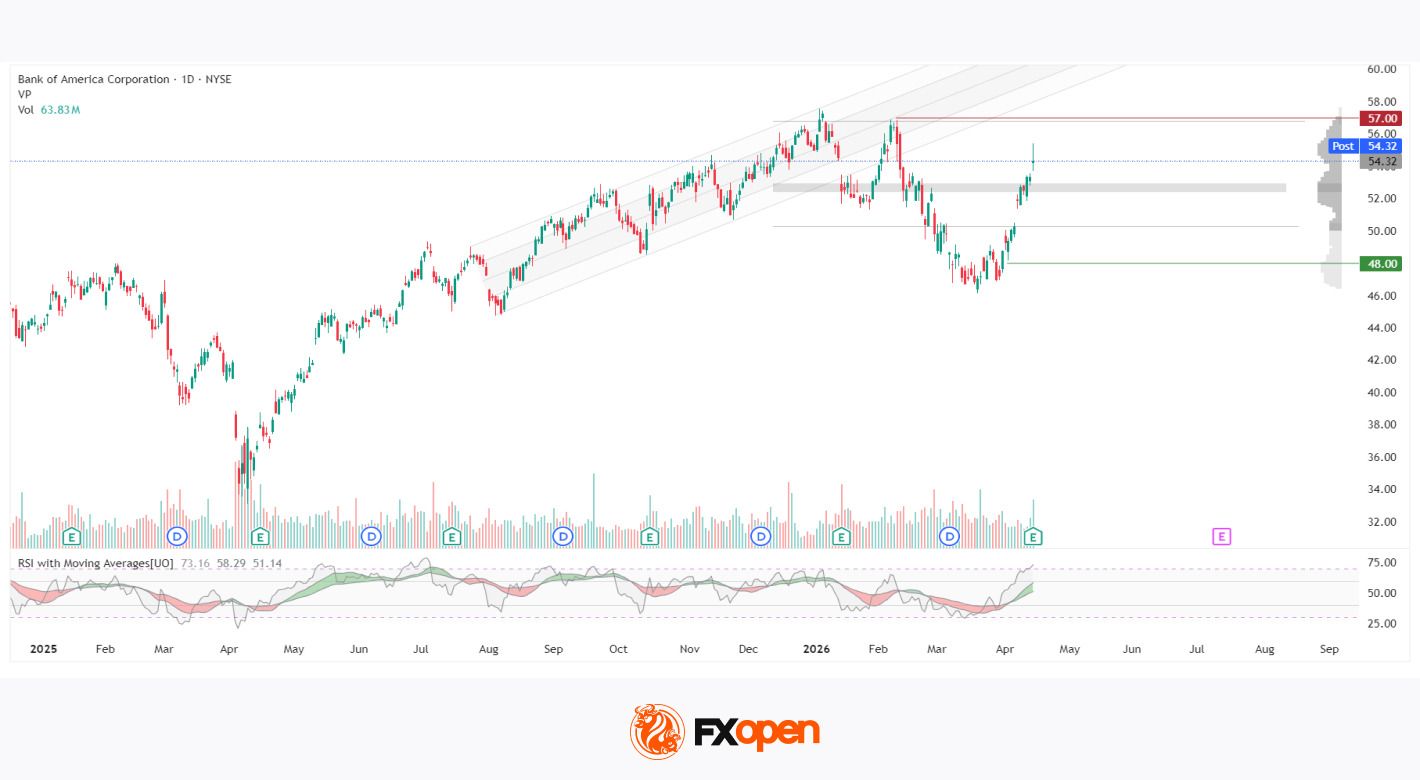
On 15 April 2026, Bank of America reported its Q1 2026 financial results, exceeding analysts’ consensus estimates for both profit and revenue. Net income came in at $8.6 billion (+17% year-on-year), while revenue reached $30.3 billion (+7% YoY). Earnings per share stood at $1.11 versus a forecast of $1.01 — the highest EPS level in nearly two decades.
Growth was primarily driven by net interest income ($15.7 billion, +9%), alongside gains in trading, investment banking fees, and asset management. Equity trading revenue rose by 30% to $2.83 billion, beating expectations by roughly $350 million.
Technical Outlook

On the daily timeframe, the earnings release triggered a strong wave of buying within a high-density horizontal volume zone. The price is currently attempting to advance following a breakout above the Point of Control (POC) at 52.50–53.00, with the next target near 57.00, which aligns with the upper boundary of the volume range.
Above current levels, the market profile shows a notable decline in trading volume. If the price manages to hold above the POC, this could create conditions for an acceleration towards the 57.00 resistance level.
The RSI, currently at 73, is in overbought territory but remains above its moving averages, confirming the strength of the ongoing bullish impulse. At the same time, the rapid rise in the RSI with Moving Averages suggests increasing risks of a corrective pullback if buyers fail to maintain prices above the POC in upcoming sessions. The 48 level serves as the lower boundary of the current market structure.
Summary
The stock is attempting to break out of a horizontal volume range, supported by a strong fundamental catalyst. The 48 and 57 levels define the current structure, while further price action will likely depend on whether buyers can sustain a move above the 52.50–53.00 POC zone, which could then act as support.
Buy and sell stocks of the world’s biggest publicly-listed companies with CFDs on FXOpen’s trading platform. Open your FXOpen account now or learn more about trading share CFDs with FXOpen.
This article represents the opinion of the Companies operating under the FXOpen brand only. It is not to be construed as an offer, solicitation, or recommendation with respect to products and services provided by the Companies operating under the FXOpen brand, nor is it to be considered financial advice.


Key takeaways
- PancakeSwap is holding above the key support level at $1.55, hinting at an upside move ahead.
- Rising open interest alongside positive funding rates signals increasing participation.
PancakeSwap (CAKE) is trading in the green above $1.60 on Thursday after finding support around this key level the previous day. Positive derivatives data, along with constructive price action, suggest that CAKE could continue its upward trajectory in the coming days.
Bullish derivatives data pushes CAKE higher
CoinGlass data reveals a sharp increase in the futures’ Open Interest (OI) for PancakeSwap, which rose to $32.48 million on Tuesday and climbed further to $32.28 million on Thursday, the highest level since March 17.
The steady increase in OI signals that new money is entering the market, which could sustain CAKE’s ongoing price rally.
Additionally, the funding rates are showing a positive shift, further supporting the bullish sentiment. CoinGlass’ OI-Weighted Funding Rate for CAKE turned positive on Wednesday and reads 0.0056% on Thursday.
This indicates that long positions are paying short positions, further suggesting that the market sentiment remains bullish.
PancakeSwap price forecast: momentum indicators suggest further rally
The CAKE/USDT 4-hour chart is bullish and efficient, as Pancakeswap is trading at $1.60 at press time.
The coin retains a constructive bias, supported by its positioning above the 50-day and 100-day Exponential Moving Averages (EMAs) at $1.46 and $1.57, respectively.
CAKE’s current price action indicates that underlying demand continues to drive the recent advance, despite CAKE remaining below the 200-day EMA at $1.81, which marks the upper boundary of the broader corrective structure.
The Relative Strength Index (RSI) on the daily chart is at 64, suggesting that while the price has firm upside momentum, it could be vulnerable to consolidation as it nears overbought territory.
The Moving Average Convergence Divergence (MACD) remains positive, reinforcing the bullish short-term outlook.
On the upside, initial resistance is found at the 50% retracement of the latest swing at $1.67, followed by the 61.8% Fibonacci level at $1.78 and a nearby horizontal resistance at $1.79. The 200-day EMA at $1.81 represents a more substantial barrier.

However, if the bears regain control, immediate support lies at the 100-day EMA at $1.57, followed by the 38.2% retracement at $1.55.
A deeper pullback could test the 50-day EMA at $1.46 and the 23.6% Fibonacci level at $1.40, with stronger structural support emerging near $1.28.
Crypto World
Musk’s Terafab Project Makes Contact with Leading Semiconductor Equipment Manufacturers

TLDR
- Applied Materials, Lam Research, and Tokyo Electron received quote requests from Musk’s Terafab initiative
- The venture represents a collaboration between Tesla and SpaceX focused on achieving AI chip independence
- Intel became a participant in the initiative last week
- The planned output target is 1 terawatt of computing power annually
- Equipment suppliers received urgent quote requests, with some contacted during holidays for expedited responses
Elon Musk’s ambitious Terafab initiative has initiated contact with leading semiconductor equipment manufacturers to obtain pricing information and projected delivery schedules. Bloomberg first disclosed this development on April 15, 2026.
The companies receiving outreach include Applied Materials, Lam Research, and Tokyo Electron. Additional reports indicate that Samsung Electronics has also been contacted.
The Terafab project operates as a collaborative venture between Tesla and SpaceX. Musk publicly revealed the initiative in March 2026.
The primary objective involves establishing complete chip production independence for Tesla, SpaceX, and xAI. According to Musk, the operation will consolidate chip design, manufacturing, lithography, masking, and packaging processes within a single integrated facility.
The annual production target stands at 1 terawatt of computing capacity. This ambitious figure would surpass the aggregate output of most existing global semiconductor manufacturers.
Intel announced its participation in the Terafab project last week. This marks Intel as among the first established semiconductor companies to officially commit to the venture.
Accelerated Timeline Driving Supplier Engagement
According to industry sources, Musk’s team has approached suppliers with notable urgency. Multiple instances show representatives contacting equipment makers during holiday periods with requests for same-week delivery schedules.
Suppliers frequently received limited information regarding the specific products planned for manufacture. This lack of detail has generated questions about how thoroughly the project’s operational plans have been developed.
This rapid approach aligns with Musk’s public commitment to executing the project at what he describes as “lightning speed.”
Terafab’s Strategic Purpose
The semiconductors manufactured at Terafab will support Musk’s artificial intelligence, robotics, and autonomous vehicle initiatives. These applications span his ventures including Tesla, SpaceX, and xAI.
Establishing independent chip manufacturing capabilities represents Musk’s strategy to eliminate dependency on external suppliers such as Nvidia and TSMC.
The proposed facility would integrate the entire semiconductor production process under one structure. This degree of vertical integration represents an uncommon approach within the semiconductor sector.
Terafab’s geographic location has not been officially disclosed. The project’s completion timeline also remains uncertain given the preliminary nature of current supplier communications.
Applied Materials and Lam Research rank among the world’s foremost providers of semiconductor manufacturing equipment. Their involvement at the quotation phase indicates Terafab remains in preliminary planning rather than active construction.
Tokyo Electron maintains a position as a prominent Japanese equipment manufacturer and critical supplier to semiconductor foundries globally.
Intel’s entry into the project last week represents the most current confirmed milestone in Terafab’s evolution.


The Cato Institute, a prominent US think tank, is urging policymakers to rethink capital gains taxation on Bitcoin and other cryptocurrencies. In a new policy note, researcher Nicholas Anthony argues that removing or reshaping capital gains taxes could unlock cheaper, more competitive money by reducing the tax distortions that currently incentivize long-term holding and heavy reporting requirements.
Anthony suggests the simplest option might be to eliminate capital gains taxes on crypto entirely. As an alternative, he outlines measures that would exempt crypto and foreign currency transactions when used to purchase goods or services, aiming to “take the government’s thumb off the scale and let competition be the true decider of the best money.” He emphasizes that a tax regime that treats everyday crypto spending like ordinary taxable events can undermine the practical use of digital assets as a means of exchange.
Key takeaways
- Policy proposal: The Cato Institute recommends either scrapping capital gains taxes on crypto entirely or exempting crypto transactions used for everyday purchases from CGT to foster competition among money-like assets.
- Tax burden for users: The note highlights how even simple, routine crypto spending can trigger complex tax filings, deterring everyday usage and broader adoption.
- Alternative approaches: A de minimis tax threshold is proposed as another option to limit CGT triggers unless gains exceed a defined amount.
- Adoption signals: Recent data show growing real-world use of crypto for goods and services, underscoring the potential market impact of tax policy reforms.
Rethinking the tax kernel of crypto spending
The policy paper frames capital gains taxes as a friction point for crypto’s evolution from speculative asset to currency. Anthony notes that when individuals buy daily items, such as coffee, with crypto, the IRS-like framework can convert a routine transaction into a complex tax event. He stresses that while Bitcoin and other digital assets have gained practical use, the tax code has not kept pace, creating unnecessary reporting burdens for compliant users.
Anthony’s reasoning aligns with a broader critique circulating among crypto researchers: tax policy should reflect the functional realities of digital currencies as both stores of value and mediums of exchange. By removing or narrowing CGT exposure, proponents argue, the United States could reduce compliance costs for ordinary users, drive greater merchant adoption, and enhance global competitiveness in a landscape where several jurisdictions are actively adjusting crypto tax rules to attract activity and investment.
“Bitcoiners know the frustration of tax season all too well. It’s never been easier to use Bitcoin as money. Yet, at the same time, the tax code puts an incredible burden on law-abiding citizens. Something as simple as buying a cup of coffee every day with Bitcoin can result in more than 100 pages of tax filings.”
The note adds that eliminating CGT entirely would be the most straightforward route, but it also acknowledges practical concerns, such as how to structure exemptions without creating loopholes or excessive compliance challenges. An interim path—removing CGT on crypto purchases of goods and services—could be more politically feasible but would still require robust systems to verify eligible transactions and prevent abuse. A de minimis threshold, where gains are ignored unless they surpass a specific limit, is presented as another approach that could balance simplicity with tax integrity.
Context, costs, and what could change next
The Cato Institute’s position sits within a long-running debate about how best to classify and tax digital assets. The policy note stresses that many Americans already use crypto in everyday life, and the current tax framework often complicates routine spending more than it incentivizes long-term investment. This tension matters not just for individual taxpayers, but for merchants, exchanges, and developers seeking to build crypto-aware ecosystems that function like mainstream payment rails.
Anthony has a track record of engaging lawmakers on crypto policy. The institute has historically argued for policies aimed at reducing unnecessary regulatory frictions, and this latest report continues that stance by centering tax design as a lever for broader crypto adoption. While the note does not propose immediate legislative milestones, it invites policymakers to consider how tax rules could better align with the practical realities of digital money, potentially spurring more competition among payment methods and currencies.
From a market perspective, the implications could be meaningful if tax changes reduce perceived friction around crypto usage. Investors and builders may watch how lawmakers respond to these arguments, particularly in an environment where tax policy remains a primary channel through which government policy shapes crypto activity. The balance to strike is clear: preserve tax integrity while removing unnecessary barriers to use and innovation.
Early signals about real-world crypto usage reinforce the conversation. A 2025 survey from the National Cryptocurrency Association found that 39% of US crypto holders reported using crypto to purchase goods and services. Meanwhile, academic data compiled by Springer Nature indicate roughly 11,000 merchants worldwide accept Bitcoin as payment, illustrating that the flow of crypto into everyday commerce is not merely theoretical. These numbers suggest that any policy shift could have a tangible impact on consumer behavior and merchant acceptance, potentially widening the circle of everyday crypto users.
Beyond the United States, the debate on crypto taxation is part of a broader international trend. Some policymakers argue that tax rules should be simpler and more predictable to reduce compliance costs and uncertainty, while others warn against eroding fiscal bases or creating gaps that could invite abuse. The Cato paper contributes to this ongoing conversation by centering the tax treatment of crypto as a practical driver of adoption and a determinant of how competitive a country’s money system can be.
What to watch as the debate evolves
Readers should monitor potential legislative developments or regulatory proposals that reflect this shift in thinking. If a framework that lightly taxes or exempts crypto transactions gains traction, it could influence not only consumer behavior but also the operating models of wallets, exchanges, and merchants seeking to optimize payment flows. On the flip side, any move to preserve or tighten CGT could sustain the existing friction that incentives buy-and-hold strategies over active use.
As the policy discussion unfolds, market participants and observers will be watching for concrete proposals, transitional rules, and how enforcement and reporting would be handled under new regimes. The central question remains: can tax policy reshape crypto usage in a way that strengthens competition and broadens access without eroding fiscal safeguards?
What remains uncertain is the precise design of any reform and how it would interact with state taxes, international tax agreements, and evolving regulatory views on digital assets. Still, the debate underscores a growing consensus that the tax treatment of crypto is not just about revenues—it’s a lever that could influence the pace of crypto adoption, the behavior of users, and the strategic choices of builders in the ecosystem.
Investors and practitioners should keep a close eye on policymaker statements, study updates from organizations advocating for tax reform, and assess how changes to CGT could affect demand, merchant acceptance, and the broader competitive landscape of money in the digital era.
Crypto World
Bitcoin (BTC) can be used as cash, but capital gains taxes turn even a cup of coffee into a mountain of paperwork


You can buy a cup of coffee with bitcoin easily enough in the U.S. — and get a tax headache thrown in for free.
The form-filling burden is enough to deter users from using the largest cryptocurrency to pay for real-world transactions, according to the Cato Institute, a libertarian think tank known for its support of free markets, limited government and individual liberty. Abolishing capital gains tax could change that, it said.
“It’s never been easier to use Bitcoin as money,” Nicholas Anthony, a research fellow at the institute’s Center for Monetary and Financial Alternatives, wrote in a report. “Yet, at the same time, the tax code puts an incredible burden on law-abiding citizens. Something as simple as buying a cup of coffee every day with Bitcoin can result in over 100 pages of tax filings.”
That’s because the tax system doesn’t treat bitcoin as cash at the point of payment. Instead, every transaction is treated as if an asset has been sold just at that moment, triggering capital gains calculations. And the calculations aren’t straightforward.
That means figuring out when the bitcoin (or fraction of bitcoin) used in the transaction was originally acquired, how much it cost and the value at the moment it was spent. The difference is then treated as a taxable capital gain or loss.
Then it gets complicated. It’s quite possible the BTC was accumulated in several batches rather than a single purchase. So when you paid for the coffee, the coins could have been acquired at different times, each with its own cost basis and purchase price. Those details need to be retrieved, recorded and reported. Every time.
The headache doesn’t stop there, because there is always a risk of penalty or audit in case you make a mistake in reporting.
The fix
Anthony said the system is broken and Congress can fix it in several ways, including abolishing capital gains tax on bitcoin.
“Doing so would take the government’s thumb off the scale and let competition be the true decider of the best money,” he said.
Another option is to exempt bitcoin from capital gains specifically when used as a payment method. However, this creates the additional hassle of proving that the coins were spent to purchase goods and services.
A third option involves creating a “de minimis tax,” under which capital gains apply only if the transaction exceeds a certain threshold.
He cited the Virtual Currency Tax Fairness Act as a potential fix, noting that it could exempt personal crypto transactions from capital gains taxes as long as the gains do not exceed $200. He argued this threshold is too low, and suggested linking it to average household spending, around $80,000, to better reflect real-world consumption.
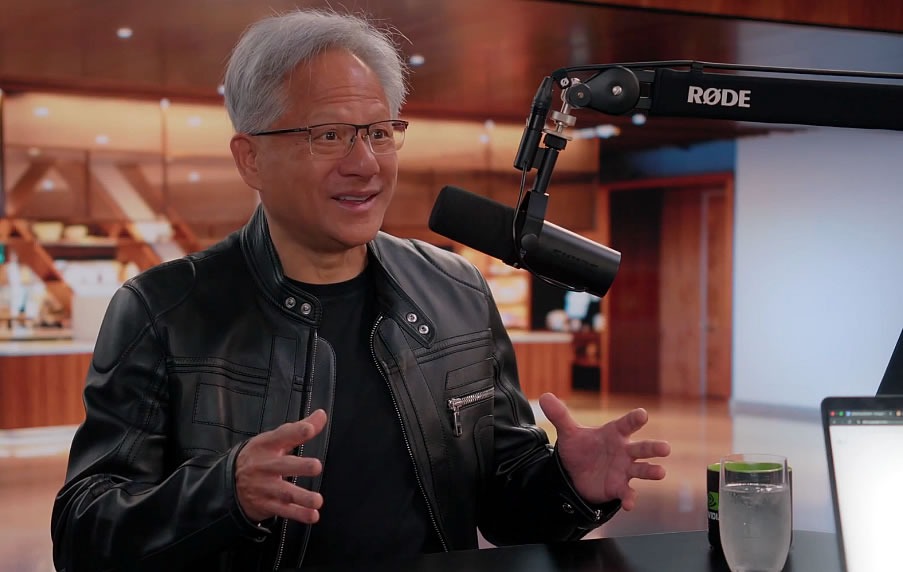
Nvidia CEO Jensen Huang has warned that China already has the computing power and data center capacity necessary to train an AI model at the same level as Anthropic’s AI model Claude Mythos, which could threaten global cybersecurity.
Huang was asked in an interview on the Dwarkesh Patel podcast on Wednesday whether the Chinese government’s access to chips to train a model like Claude Mythos — which has cyberoffensive capabilities — could be a threat to US national security.
Mythos was trained on a “fairly mundane capacity,” Huang said.
“The amount of capacity and the type of compute it was trained on is abundantly available in China, so you just have to first realize that chips exist in China.”
Anthropic limited access to its new AI model in April after it identified thousands of software vulnerabilities across major operating systems and browsers, raising concerns about potential misuse in cyberattacks. A Chinese-made AI model with the same capability could wreak havoc if misused.
Huang said that the amount of compute China has is “enormous.”
“They have datacenters that are sitting completely empty, fully powered. You know, they have ghost cities, they have ghost datacenters too. They have so much infrastructure capacity. If they wanted to, they [could] just gang up more chips.”

A call for dialogue, not conflict
Huang added that China manufactures 60% of the world’s mainstream chips, has some of the best computer scientists, has 50% of the world’s AI researchers and an abundance of energy.
“Victimizing them, turning them into an enemy, likely isn’t the best answer,” he said. “They are an adversary.”
“We want the United States to win. But I think having a dialogue and having research dialogue is probably the safest thing to do.”
Related: Anthropic limits access to AI model over cyberattack concerns
On Tuesday, US Treasury Secretary Scott Bessent hailed Mythos as a revolutionary step that will keep America ahead of China in the AI race. “This Anthropic Mythos model was a step function change in abilities, learning capabilities,” he said, according to Bloomberg.
Claude Mythos poses a real threat
Anthropic released findings on Claude Mythos Preview on April 7, sparking concern that the model could be used in cyberattacks due to its ability to discover and potentially exploit zero-day vulnerabilities. The company also claimed that 99% of the vulnerabilities the model discovered have not been patched yet.
Meanwhile, the AI Security Institute (AISI) evaluated Mythos on April 13, finding that the AI model could “execute multi-stage attacks on vulnerable networks and discover and exploit vulnerabilities autonomously,” tasks that would take human professionals days of work.
AI-boosted hacks with Mythos could also have dire consequences for banks, which often use decades-old software, Reuters reported on Tuesday.
Last year, Anthropic reported in November that a “Chinese state-sponsored group” manipulated its Claude Code tool in an attempt to infiltrate about 30 global targets and succeeded in a small number of cases.
Magazine: How AI just dramatically sped up the quantum risk for Bitcoin
- Partnership cuts bond settlement time from two days to near real-time.
- Bond settlements will use blockchain to reduce risk and remove intermediaries.
- Impact expands into payments, liquidity, and treasury systems.
Ripple has partnered with Kyobo Life Insurance, one of South Korea’s largest institutional investors, stepping into government bond settlement.
This move signals a shift in how traditional financial infrastructure is being rebuilt.
Instead of relying on legacy systems that take days to complete transactions, the partnership is focused on bringing government bond settlements onto blockchain rails, where transactions can be executed almost instantly.
At the same time, the price of Ripple’s native token XRP is up 4.1% to $1.41 after stalling below $1.38 for a while following the announcement of the partnership.
A move away from slow settlement systems
Government bond markets are among the most important pillars of any financial system. Yet, the infrastructure behind them has remained largely unchanged for decades.
Today, settling bond transactions typically takes two days. This delay, often referred to as T+2, creates several inefficiencies.
Capital remains locked during the waiting period, institutions face counterparty risk, and multiple intermediaries are required to complete a single transaction.
The new system being developed in South Korea aims to remove these bottlenecks.
By tokenising government bonds and settling them on-chain, transactions can move from a two-day process to near real-time execution.
This reduces the need for intermediaries and allows both parties to complete transactions simultaneously, improving trust and transparency.
For large institutional players like Kyobo Life, which manages tens of billions of dollars in assets, even small efficiency gains can translate into significant financial impact.
Building institutional-grade blockchain infrastructure
The backbone of this initiative is Ripple’s custody and settlement technology, designed specifically for regulated financial institutions.
This is not a public, open-ended blockchain experiment. It is a controlled, compliant system built to meet the standards of traditional finance.
Security, auditability, and regulatory alignment are central to its design.
The idea is simple: replicate the functions of existing financial infrastructure, but do it faster, with fewer layers, and with better visibility.
Kyobo Life’s role in the partnership is equally important. As a major institutional investor, it brings real-world scale to the project.
This is not a theoretical use case. It is a live test of how blockchain can support high-value financial instruments in a regulated environment.
The project has already progressed beyond early-stage research.
After initial proof-of-concept work in 2025, it has moved into a test environment, where the system is being evaluated under real-world conditions.
By bringing government bond settlement onto blockchain, Ripple and Kyobo Life are laying the groundwork for a more efficient financial system. One where transactions are faster, risks are lower, and capital moves with fewer constraints.
And if it succeeds, it could reshape not just how bonds are settled in Korea, but how financial markets operate more broadly.
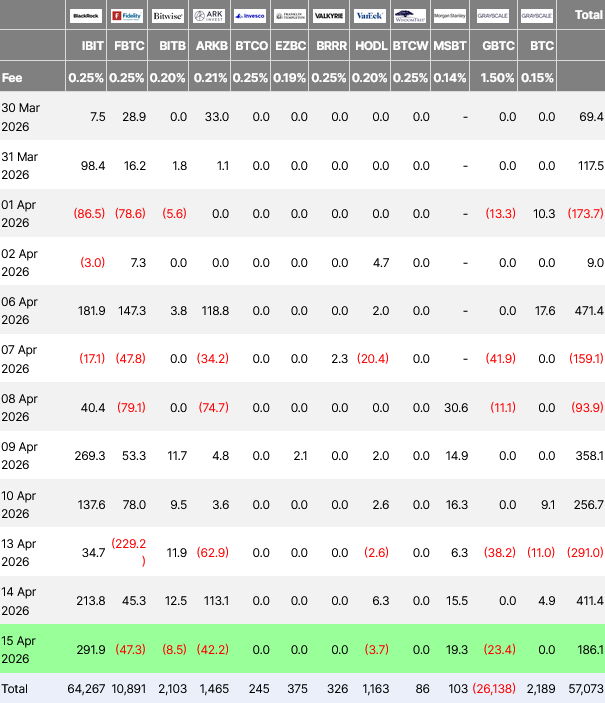
Morgan Stanley’s new spot Bitcoin exchange-traded fund has just surpassed the WisdomTree Bitcoin Fund (WBTC) in total net inflows, despite launching just over a week ago.
The Morgan Stanley Bitcoin Trust (MSBT) added $19.3 million of investor inflows on Wednesday, bringing its total net inflow to $103 million.
The figure has now passed WisdomTree Bitcoin Fund’s (WBTC) total net inflow of $86 million, which it had been accumulating since launching in January 2024, Farside Investors data shows.
More asset managers are looking to push into the growing Bitcoin ETF space. On Tuesday, Goldman Sachs, a former crypto critic, filed with the SEC to launch its own Bitcoin-linked ETF.

The Morgan Stanley spot Bitcoin ETF product launched on April 8 at a market-low fee of 0.14%, undercutting the Grayscale Bitcoin Mini Trust ETF (BTC) by one base point.
It joined 11 other spot Bitcoin ETFs, including BlackRock’s iShares Bitcoin Trust ETF (IBIT) — the current market leader with $64.3 billion in net inflows and the Fidelity Wise Origin Bitcoin Fund at $10.9 billion.
MSBT’s other competitors include Bitcoin ETFs issued by Bitwise, ARK 21Shares and Grayscale.
Continuing momentum could also see Morgan Stanley’s Bitcoin ETF surpass Invesco Galaxy Bitcoin ETF (BTCO), Valkyrie Bitcoin ETF (BRRR) and the Franklin Bitcoin ETF (EZBC), which have accumulated net inflows of $245 million, $326 million and $375 million, respectively.
The average lifespan of ETFs is shrinking
A Bloomberg report from April 2 found that the average lifespan of ETFs fell from 4.66 years in 2024 to about 3.5 years in 2025.
Over 40 ETFs have also been liquidated in the first two months of 2026, though none of those include any notable crypto ETFs.
Related: Bitcoin ETFs could eventually be larger than gold ETFs: Analyst
The ETFs that were liquidated across the first two months of 2026 had an average lifespan of 21 months, half that of the ETFs that were liquidated in 2025.
Bloomberg ETF analyst James Seyffart predicted in December that many crypto exchange-traded products would be liquidated by the end of 2027 due to a lack of demand.
At the time, over 126 ETP applications were awaiting an outcome from the SEC.
Magazine: Bitcoin will not hit $1M by 2030, says veteran trader Peter Brandt


A recap of a podcast hosted by Alevtina Labyuk, Chief Strategic Partnerships Officer at BeInCrypto, in partnership with The Top Voices — a community-led media platform for early-stage startups and IT talent, backed by a global network of 3,000+ entrepreneurs — featuring Anthony Tsivarev, VP of Ecosystem Development at the TON Foundation.
Building a startup inside a large ecosystem can look deceptively simple from the outside. The distribution is already there. The infrastructure is ready. Millions of users are just one click away.
But according to Anthony VP of Ecosystem Development at the TON Foundation, this perception is one of the biggest misconceptions founders bring into platforms like Telegram and TON.
During the conversation, he explained why building inside an ecosystem is fundamentally different from launching an independent product – and why many teams fail to recognize the shift in mindset required to succeed.
Ecosystem Distribution Is Not the Same as Demand
In a traditional go-to-market strategy, startups usually follow a straightforward sequence: build a strong product and then acquire users through marketing, partnerships, or distribution channels.
Platforms such as Telegram change this dynamic completely. The distribution already exists. But crucially, it does not belong to the startup.
“You still need to build a great product,” Anthony explained. “But on top of that, you need to integrate it into the native behavior of the platform.”
That means founders must think beyond functionality. A product launched inside Telegram needs to understand how people communicate there – through chats, channels, stories, and friend networks.
Ecosystem products succeed because they naturally fit into how people already behave on the platform. For example, with TON, founders must design not only for user behavior but also for token economics, incentives, and payment mechanics.
“Classic GTM is one layer,” Anthony said. “In ecosystems you also have social graphs, social interaction, and in blockchain you add an economic layer on top of that.”
Creativity Comes From Behavior
A common fear among founders building in ecosystems is that the environment limits creativity. After all, the infrastructure, identity layer, and wallet systems are already defined.
Anthony sees the opposite. Platforms like Telegram mini-apps provide standardized building blocks, but differentiation emerges from how founders use social behavior.
Successful products often rethink how their app interacts with chats, communities, and sharing patterns. They create loops that encourage users to bring their friends into the experience.
The most important design question becomes surprisingly simple: Why would users come back?
Retention loops, Anthony emphasized, matter far more than simply launching inside the ecosystem.
“You need to think about why people should use your product consistently,” he said. “Integration is only the beginning.”
The Founders Who Actually Succeed
Working inside an open ecosystem means anyone can launch a product. Today, developers can build a mini-app in a day and distribute it instantly through social channels. That openness creates both opportunity and clutter.
When Anthony evaluates new builders entering the ecosystem, two things matter most:
- The first is experience. Teams with a track record of building social products often understand platform dynamics much faster.
- The second is what he calls ecosystem product fit.
In other words, the product should leverage the ecosystem (not just sit inside it).
Anthony often asks founders to clearly explain how their product will amplify itself using the platform. That explanation should include how the product will leverage the social graph, how users will naturally share it with friends, and what incentives will drive organic growth.
Without clear answers, many products remain technically functional but struggle to gain real traction.
“You can end up with a good mini-app,” Anthony said, “but without users and without distribution.”
The Most Common Founder Mistake
One misconception appears again and again in new projects. Founders assume that access to a massive user base automatically generates demand.
Anthony calls this confusion between distribution and product-market fit.
Just because millions of users exist on a platform does not mean they will automatically use a new product.
He compares the situation to a supermarket shelf. Even when dozens of chocolate brands sit side by side, shoppers still choose only a few.
Platforms create opportunities for visibility and activation, but they do not replace the need for strong product mechanics and clear user value.
For founders, that means focusing first on the fundamentals: the core loop, user retention, and behavioral integration with the platform.
Ecosystems Are Opportunity Engines
Despite the challenges, Anthony believes ecosystems remain one of the most powerful environments for startups. Their role, however, is often misunderstood.
Rather than being designed to guarantee success, ecosystems simply change the economics of building. They typically reduce two critical startup costs:
- The first is development cost. Infrastructure such as identity layers, wallets, payment systems, and mini-app frameworks dramatically lowers the technical barrier to entry.
- The second is customer acquisition. Platforms already contain communities and social graphs that startups can leverage for growth.
Together, these factors can accelerate experimentation and iteration. But the responsibility for success still belongs to the founder.
“Ecosystems amplify success,” Anthony said. “They don’t generate success for you.”
AI Is Changing How Startups Are Built
Another theme that emerged during the conversation was the growing impact of AI on startup development.
Anthony described a change that many developers are already experiencing, where products that once required large teams and significant funding can now be prototyped in days.
He shared his own experience building an internal product called Identity Hub, which he developed over a few weekends – something that would previously have required hundreds of thousands of dollars in development resources.
AI-driven coding tools are drastically increasing development velocity.
This change is transforming the role of founders. Instead of spending years building a single product, startups can now test multiple ideas rapidly in search of the right business model.
The result is a startup environment where experimentation becomes the default.
AI Agents and Multi-Ecosystem Products
Looking further ahead, Anthony believes the future of Web3 development will likely revolve around two major things.
The first is the rise of multi-ecosystem products. As integration becomes easier, applications will increasingly operate across multiple blockchains and platforms rather than staying confined to a single ecosystem.
The second is the growing role of AI agents.
Blockchain infrastructure remains complex for everyday users, but AI systems may act as intermediaries that interact with decentralized protocols on their behalf.
In that scenario, agents (not humans) could become some of the largest users of blockchain networks.
“Agents could become the main consumers of blockchains,” Anthony suggested.
If that happens, the next generation of Web3 products may be designed not only for people but also for autonomous systems.
Focus First, Expand Later
Anton returned to one timeless principle of entrepreneurship – focus.
Early-stage founders often feel pressure to expand quickly into multiple ecosystems, markets, or features. But spreading attention too early can prevent a product from succeeding anywhere.
He encourages startups to build a strong success story inside one ecosystem before thinking about expansion.Once a product proves itself, it becomes far easier to replicate that success elsewhere. Until then, focus remains the most powerful advantage a startup can have.
The post Building in an Ecosystem: What Founders Often Get Wrong appeared first on BeInCrypto.

Key Highlights
- Bitwise introduced the BAVA spot ETF for Avalanche on NYSE trading starting April 15, 2026
- Investors receive an estimated 5.4% annual yield through the fund’s staking mechanism
- The ETF charges a 0.34% management fee, temporarily reduced to 0% for initial $500M during the first 30 days
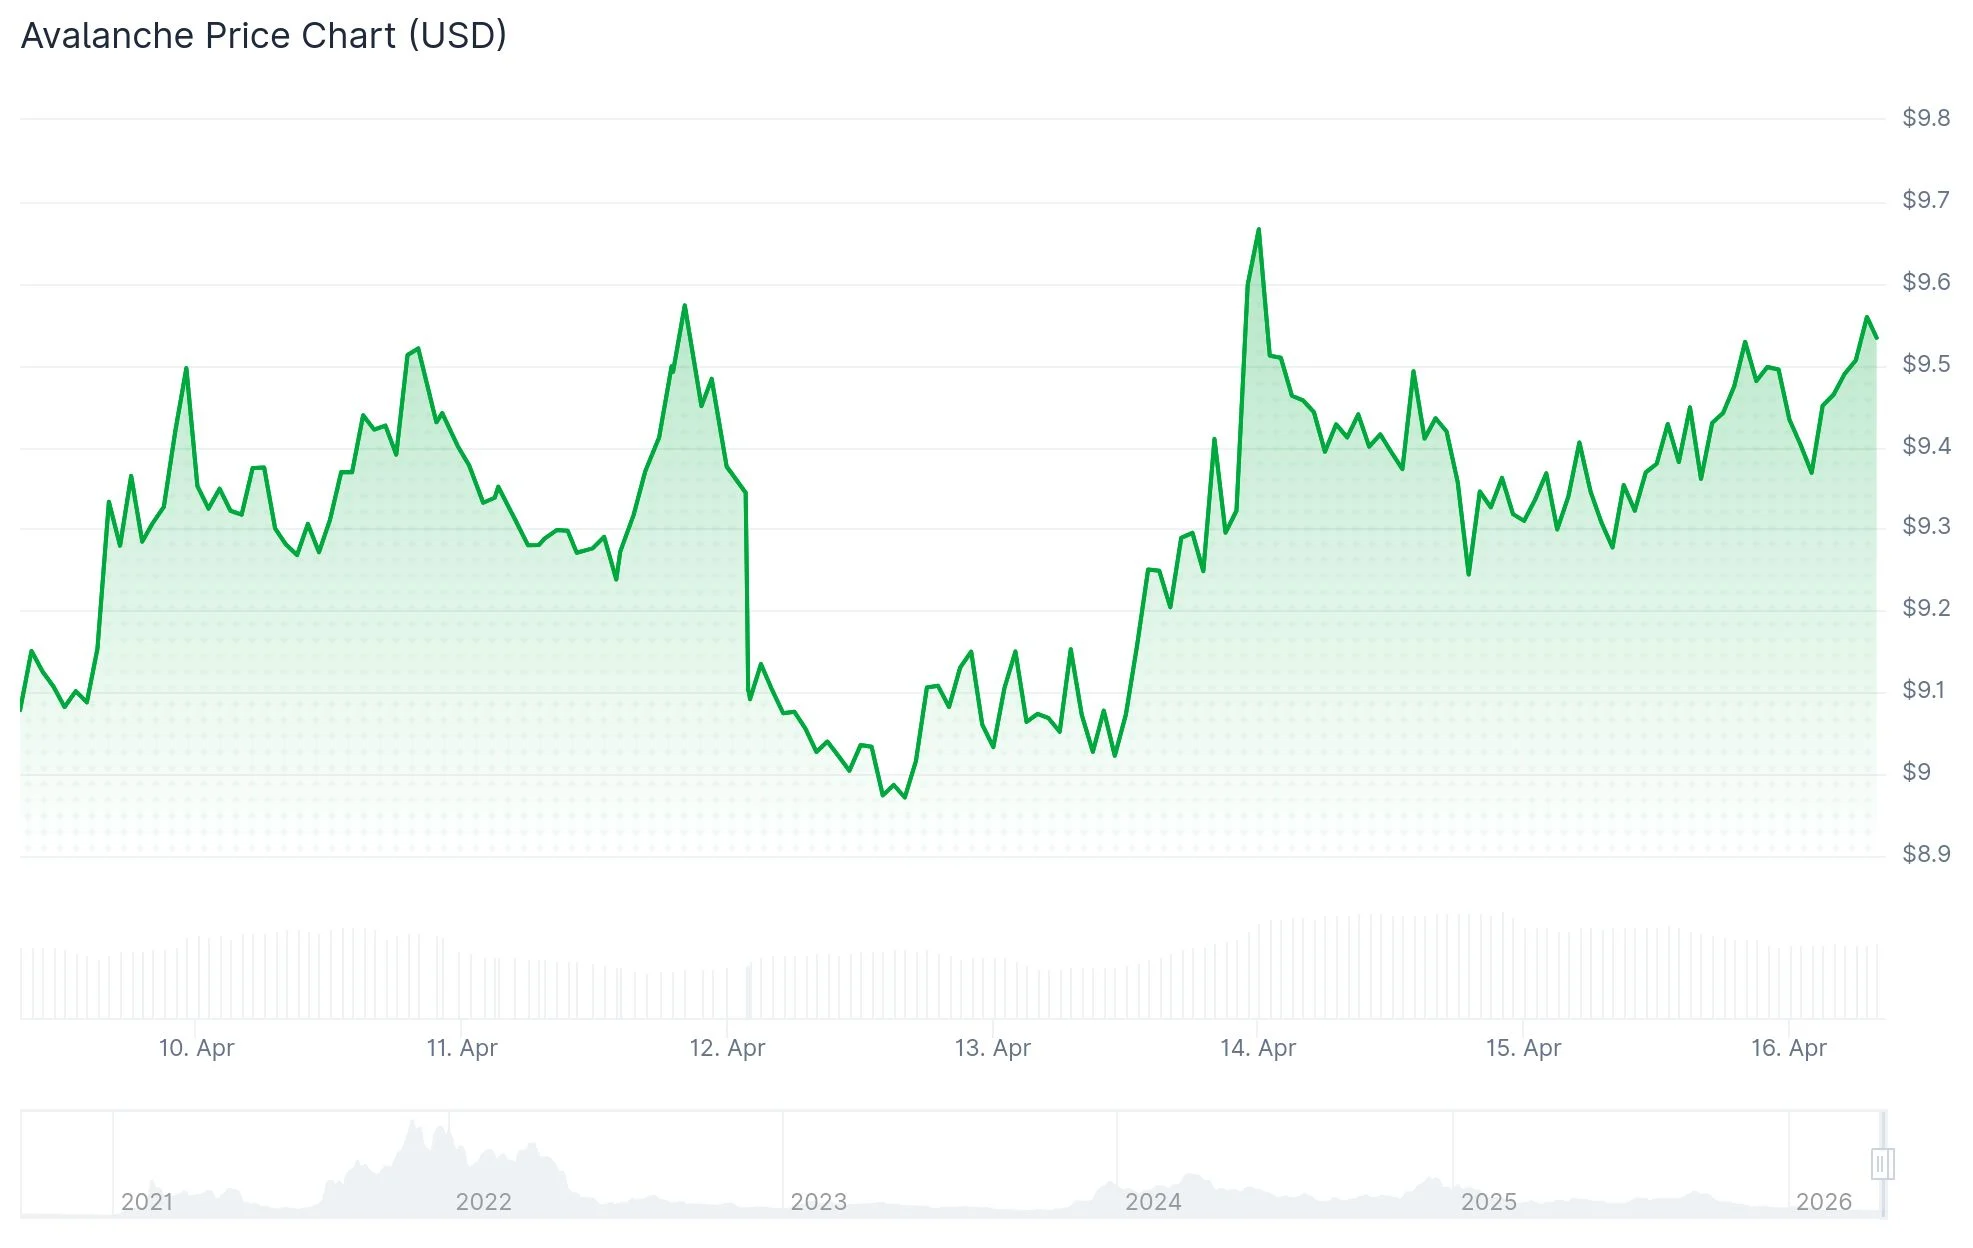
- AVAX currently trades at approximately $9.52, struggling to break the $10 threshold
- VanEck has submitted regulatory paperwork for a competing Avalanche ETF product
Bitwise Asset Management introduced its exchange-traded fund for Avalanche to the New York Stock Exchange on April 15, 2026. Trading under the symbol BAVA, this investment vehicle provides market participants with straightforward access to AVAX tokens.
The fund’s design allocates approximately 70% of its AVAX portfolio to staking operations managed by Bitwise Onchain Solutions, the company’s proprietary staking division. The balance of 30% remains available as liquid reserves to facilitate investor redemptions and cover operational requirements.
Current projections indicate an annual staking return of 5.4%. Participants earn these returns through newly minted AVAX tokens, which the fund distributes to investors on a recurring basis as net income from investments.
The product imposes a 0.34% annual sponsor charge. During its initial 30-day period, Bitwise has eliminated this fee entirely on the first half-billion dollars in managed assets, a strategic incentive designed to draw institutional money.
BAVA concluded its inaugural trading session with a 1.5% gain, settling at $25.50 per share. Meanwhile, AVAX recorded a price of $9.52, representing a 1.8% daily increase, per CoinMarketCap data.
Matt Hougan, Chief Investment Officer at Bitwise, stated: “With BAVA, investors can gain exposure to an asset that we believe is powering the next wave of blockchain adoption across global finance and enterprise.”
AVAX Price Struggles Below $10 Barrier
AVAX has remained anchored around the $9 mark throughout much of 2026, with the $10 price point proving to be a stubborn barrier since the start of the year. Technical observers have identified a descending triangle formation on daily charts, with $8 representing crucial support and $6.80 marking the subsequent demand area if downside pressure intensifies.
A successful breach above $10, bolstered by improving market dynamics, might pave the way toward the $15 zone, although prevailing market sentiment continues to exhibit hesitation.
Competing AVAX investment products, including VanEck’s offering and Grayscale’s Avalanche Trust, have registered zero net capital inflows since March 17, 2026.
Growing Competition in Avalanche ETF Space
Bitwise isn’t the sole asset manager pursuing AVAX market exposure. Nasdaq submitted documentation to the SEC in recent days seeking approval to trade shares of the VanEck Avalanche Trust, a proposed fund operating under commodity-based trust share regulations.
The Avalanche network supports tokenization initiatives connected to FIFA, Wyoming’s government-backed stablecoin program, Toyota, and BlackRock.
Bitcoin and Ethereum currently encounter price ceilings around $76,000 and $2,400 respectively, while recent ETF capital withdrawals signal broader investor wariness stemming from macroeconomic uncertainties. AVAX mirrors this subdued market attitude.
The BAVA debut coincides with CME Group’s recent expansion of cryptocurrency derivatives products to encompass Avalanche and Sui futures contracts.

Pentagon taps GM and Ford to ramp up US weapons production capacity

Royal Fleet Auxiliary RMT members are on strike again

Hornets’ LaMelo Ball assessed flagrant foul, fined for play that injured Bam Adebayo


-

 Politics6 days ago
US brings back mandatory military draft registration
-
 Sports6 days ago
Man United discover Nico Schlotterbeck transfer fee as defender reaches Dortmund agreement
-

 Fashion6 days ago
Weekend Open Thread: Veronica Beard
-

 Politics6 days ago
Malcolm In The Middle OG Turned Down ‘Buckets Of Money’ To Appear In Reboot
-

 Politics4 days ago
World Cup exit makes Italy enter crisis mode
-

 Crypto World7 days ago
Canary Capital Files SEC Registration for PEPE ETF
-

 Business6 days ago
Tesla Model Y Tops China Auto Sales in March 2026 With 39,827 Registrations, Beating Cheaper EVs and Gas Cars
-

 Crypto World3 days ago
The SEC Conditionalises DeFi Platforms to Be Avoided for Broker Registration
-

 Crypto World2 days ago
SEC Signals Exemption for Crypto Interfaces From Broker Registration
-

 News Videos1 day ago
Secure crypto trading starts with an FIU-registered
-
 NewsBeat3 days ago
Pep Guardiola and Gary Neville agree over Arsenal title problem that benefits Man City
-

 Business6 days ago
OpenAI Halts Stargate UK Data Centre Project Over Energy Costs and Copyright Row
-

 Business5 days ago
Ireland Fuel Protests Enter Day 5 as Blockades Spark Shortages and Government Prepares Support Package
-

 Crypto World5 days ago
Federal judge blocks Arizona from bringing criminal charges against Kalshi
-

 Politics6 days ago
LBC Presenter Mocks Trump Over Iran War Failures
-

 NewsBeat2 days ago
Trump and Pope Leo: Behind their disagreement over Iran war
-
 NewsBeat4 days ago
JD Vance announces ‘no agreement’ with Iran over nuclear weapons fear
-

 Crypto World2 days ago
SEC Proposes Certain Crypto Interfaces Don’t Need to Register as Brokers
-

 Tech6 days ago
A version of Windows 10 released a decade ago is now eligible for additional security patches
-

 Business5 days ago
IMF retains floor for precautionary balances at SDR 20 billion
You must be logged in to post a comment Login