
Crypto World
Ripple’s prime brokerage platform adds support for decentralized exchange Hyperliquid


Ripple has announced that its institutional prime brokerage platform, Ripple Prime, now supports the decentralized derivatives trading protocol Hyperliquid.
The integration gives Ripple Prime clients access to Hyperliquid’s onchain perpetuals liquidity while keeping margin and risk managed inside Ripple Prime. The company said clients will be able to cross-margin decentralized finance derivatives exposures, alongside positions in other markets the platform supports.
Ripple Prime currently supports traditional assets that include FX, fixed income, over-the-counter swaps, and more. The platform acts as a single point of access for institutions managing multi-asset portfolios, offering centralized risk management and capital efficiency, Ripple said.
The integration builds on growing interoperability in the space. Earlier this year Flare, a blockchain focused on interoperability, launched the first XRP spot market on Hyperliquid with the listing of FXRP. Ripple’s announcement focuses on derivatives access through Ripple Prime rather than retail spot trading.
Hyperliquid has drawn attention over its rapid growth to become the largest perpetual contracts decentralized exchange. As of mid-January, it had surpassed $5 billion in open interest and $200 billion in monthly trading volume, outpacing several rival exchanges.
Its recent surge in tokenized commodity trades, including silver futures, has attracted interest in the space and helped its HYPE token outperform during the ongoing selloff. The platform is also eyeing prediction markets.
Ripple launched its Prime platform in late 2025 following its $1.25 billion acquisition of prime brokerage firm Hidden Road.

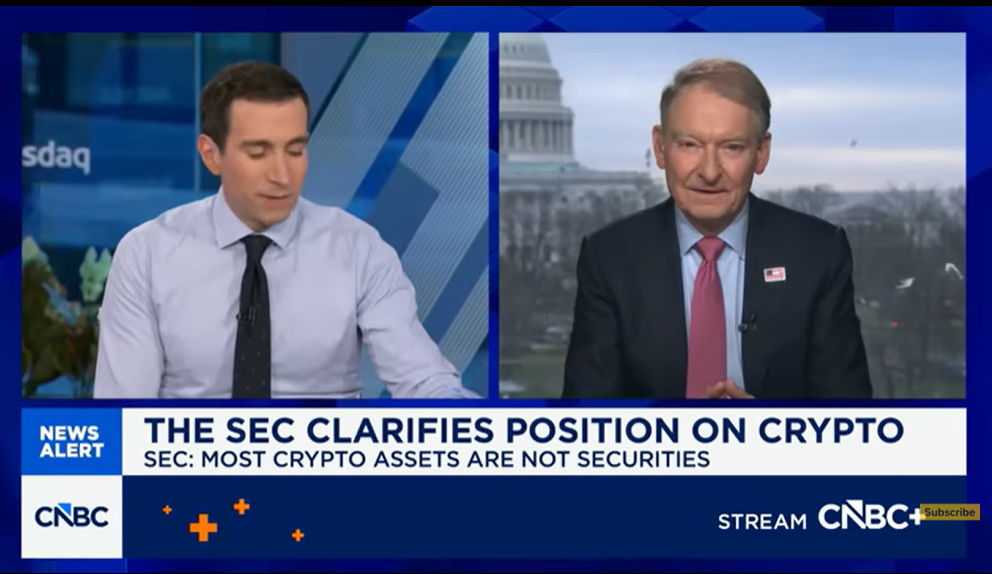
After the US Securities and Exchange Commission (SEC) outlined four broad categories of digital assets that fall outside securities laws, Chair Paul Atkins offered further clarity on why nonfungible tokens (NFTs) generally do not meet that definition.
In a Wednesday interview with CNBC, Atkins reiterated that the agency’s recent interpretive release identified four types of digital assets that are typically not considered securities: digital commodities, digital tools, digital collectibles such as NFTs, and stablecoins.
During the interview, host Andrew Ross Sorkin pressed Atkins on digital collectibles, noting they could more easily resemble securities depending on how they are structured.
“Well, that’s true with anything,” Atkins replied, emphasizing that the SEC’s analysis still hinges on the facts and circumstances of each asset, particularly whether it involves an investment contract under longstanding legal precedent.
Atkins said digital collectibles are generally treated as items that are bought and held, similar to physical collectibles, rather than as investment contracts — the defining feature of securities.
“Some of these collectibles, like a baseball card, a meme or one of those memecoins, NFTs — those are something that somebody buys,” he said. “It’s an immutable purchase… it’s not something like another asset where people are trading it.”

Related: SEC chair Paul Atkins floats ‘safe harbor’ exemptions for crypto
SEC continues to move away from enforcement-led crypto policy
The securities regulator has recalibrated its approach to digital assets under Atkins, a shift that has coincided with the arrival of a more crypto-friendly Trump administration in early 2025.
“We’re breaking with the past,” Atkins said during the CNBC interview, describing the SEC’s push to provide clearer guidance and a more predictable regulatory framework for the digital asset sector.
Last year, Atkins criticized the agency’s previous reliance on “regulation through enforcement” and pledged to move away from that approach. He also pointed to tokenization as a key innovation that regulators should support rather than restrict.
He has since reiterated that past regulatory missteps have left the United States lagging behind in crypto development by as much as a decade, and has vowed to reverse that trend.
Related: CFTC issues ‘no-action’ letter for crypto wallet provider Phantom


Bitrefill said hackers drained hot wallets and exploited gift card supply flows after gaining access through stolen credentials from an employee’s device.
Bitrefill disclosed that it was targeted in a cyberattack on March 1, which resulted in the theft of cryptocurrency funds, and said its investigation found multiple indicators linking the incident to tactics used by the DPRK-associated Lazarus/Bluenoroff group.
The company stated that similarities in the attackers’ methods, malware, on-chain tracing patterns, and the reuse of IP and email addresses are consistent with previous operations attributed to the group.
Bitrefill Cyberattack
According to the company, the breach originated from a compromised employee’s laptop, where a legacy credential was extracted. That credential allowed access to a snapshot containing production secrets, which the attackers then used to expand their access across Bitrefill’s systems. This enabled them to reach parts of the database and certain cryptocurrency wallets.
In its latest tweet, Bitrefill said it first identified the incident after detecting unusual purchasing patterns involving some suppliers, which indicated that its gift card inventory and supply flows were being misused. At the same time, it observed that some hot wallets were being drained, and funds were sent to addresses controlled by the attackers. Once the breach was confirmed, the company shut down all systems to contain the situation.
Following the incident, Bitrefill confirmed that it has been working with external cybersecurity experts, incident response teams, blockchain analysts, and law enforcement.
The company said there is no indication that customer data was the main focus of the attack. According to its logs, the attackers ran a limited number of database queries consistent with probing activity to identify what could be extracted. This included cryptocurrency and gift card inventory. Bitrefill added that it stores minimal personal data and does not require mandatory KYC, with any verification information held by an external provider.
However, it confirmed that about 18,500 purchase records were accessed, including email addresses, cryptocurrency payment addresses, and metadata such as IP addresses. In roughly 1,000 cases where customers had provided names for specific products, the information was encrypted, but the company is treating it as potentially accessed due to possible exposure of encryption keys. Those users have been notified.
You may also like:
Bitrefill said it does not currently believe customers need to take specific action, but advised vigilance regarding any unexpected communications related to Bitrefill or cryptocurrency.
The company added that it has strengthened its security measures, including conducting further external cybersecurity reviews and penetration testing, tightening internal access controls, improving monitoring and logging systems, and refining incident response procedures. It said the financial losses will be covered from its operational capital, and that most services, including payments and inventory, have been restored.
Lazarus Havoc
Even as many crypto platforms have ramped up their security frameworks in recent years, threat actors continue to bypass protections. The Lazarus Group remains the sector’s most persistent and dangerous adversary, responsible for the largest crypto hack on record after stealing $1.4 billion from Bybit in February 2025.
Blockchain investigator ZachXBT previously said that breaches involving platforms such as Bybit, DMM Bitcoin, and WazirX saw stolen funds laundered with ease. The on-chain investigator had added that the laundering groups have “seemingly won the battle” over enforcement.
Binance Free $600 (CryptoPotato Exclusive): Use this link to register a new account and receive $600 exclusive welcome offer on Binance (full details).
LIMITED OFFER for CryptoPotato readers at Bybit: Use this link to register and open a $500 FREE position on any coin!
Crypto World
Solana (SOL) Network Revenue Plunges 93% From Peak, Why Taurox (TAUX) Is One Of the Best Alternatives
Solana’s network revenue has plunged 93% from its January peak. Daily DEX volume cratered from $35.9 billion on January 21 to $979.5 million by mid-March. Transaction fees dropped 83% in a single month. Active daily addresses fell from 6.4 million to 2.8 million, more than halving since November. The memecoin engine that powered Solana’s fee revenue through Pump.fun and Meteora has stalled after a string of celebrity rug pulls and scam launches that drained user trust. SOL trades at $94, and the on-chain activity that justified higher prices has evaporated.
A 93% revenue collapse is not a correction. It is a structural repricing of what the network actually earns when the hype cycle ends. Taurox (TAUX) is a decentralized hedge fund where AI agents will trade pooled capital across DEXs and CEXs once the presale ends. Stakers keep 80% of net profits from diversified strategies that do not depend on a single network’s fee revenue staying elevated through speculative memecoin launches.

How Triple-Layer Oracle Protection Guards Every Trade
Accurate pricing data is the foundation of every trade an agent will execute. Taurox uses Chainlink as its primary oracle, providing multi-provider aggregated USD pricing across all supported assets. If Chainlink data goes stale or becomes unavailable, Pyth Network steps in as a fallback with high-frequency institutional-grade pricing. Every price feed carries asset-specific staleness thresholds.
If data exceeds the allowed age, the system pauses execution until fresh pricing arrives. On top of both oracle layers, Taurox validates pricing through time-weighted average price calculations using on-chain liquidity pools. This three-layer architecture prevents agents from executing trades on manipulated or outdated data, a risk that grows as more venues and liquidity sources come online.
Stakers keep 80% of net profits at the standard tier. The protocol takes 5% on gains only, with 30% burned permanently and 70% flowing to the DAO treasury. Solana’s revenue depended on memecoin volume that vanished when users lost trust. Taurox protects trade execution at the oracle level so pricing integrity never depends on hype cycle volume.
Why $314.7K in Capital Keeps Flowing While SOL Revenue Falls
Phase 1 of the TAUX presale sold out in under 24 hours at $0.01 per token. Phase 1 buyers are sitting on a 20% gain with Phase 2 priced at $0.012, and they have not staked or seen an agent trade. The presale has raised $314.7K so far, and Phase 2 is already 23.9% filled. Nineteen phases run from $0.01 to $0.07, each closing permanently when its allocation is gone. The price steps up with no extensions.
Waiting costs real money when each closed phase eliminates the cheapest entry forever. Staking activates at the end of the presale, and agents will begin trading real capital once the pool goes live. SOL’s revenue dropped 93% because the activity that generated it was speculative and temporary. The TAUX presale raises capital that positions buyers ahead of a protocol designed to produce returns through managed execution, not through fee spikes from unsustainable memecoin volume.
Every token sold at $0.012 brings Phase 2 closer to closing permanently. The demand that cleared Phase 1 in a single day has carried directly into Phase 2. The buyers entering now are positioning before agents begin trading real capital. Phase 2 is filling, and the entry at $0.012 will not exist once this allocation runs out.

Phase 2 Numbers
Phase 2 is live at $0.012 per TAUX. Listing at $0.08 gives buyers 6.67x before the pool generates profit. A $1 target means x83 from today. At a $1 billion pool with 30% gross returns, implied price reaches $1.85, or x154 from $0.012. The protocol charges 5% on gross profits only. Zero management fees. Thirty percent of that fee is burned permanently against a fixed supply of 2 billion tokens.
The remaining 70% funds the DAO treasury. Every profitable trading period compresses circulating supply against a cap that never increases. The remaining 70% of fees funds the DAO treasury for ecosystem growth. Total raised: $314.7K and climbing. SOL’s revenue cratered 93% because the volume that generated it was temporary. The TAUX presale raises capital backed by a protocol designed to produce returns through managed execution. Phase 2 will not survive the demand pattern that emptied Phase 1 in under a day.
Learn More
Buy TAUX: https://taurox.io/
Whitepaper: https://docs.taurox.io/
Official Telegram: https://t.me/tauroxlabs
The post Solana (SOL) Network Revenue Plunges 93% From Peak, Why Taurox (TAUX) Is One Of the Best Alternatives appeared first on Blockonomi.

S&P Dow Jones Indices has licensed its S&P 500 Index to Trade[XYZ] for the launch of a perpetual futures contract on Hyperliquid, a development described by the index provider as the first officially licensed on-chain product offering continuous, leveraged exposure to the index for eligible non-U.S. users. The contract enables long or short positions on the index without an expiry date, with markets operating around the clock outside traditional exchange hours and data sourced from S&P Dow Jones Indices itself.
The move signals an important pivot in the crypto industry’s appetite for traditional financial benchmarks, extending on-chain derivatives beyond cryptocurrencies into mainstream equity exposure. Trade[XYZ] asserts that its on-chain markets have processed more than $100 billion in volume since October 2025, with an annualized run rate exceeding $600 billion, underscoring growing liquidity in tokenized, perpetual-style products.
Key takeaways
- The S&P 500 is now accessible on-chain through a perpetual futures contract on Hyperliquid, licensed by S&P Dow Jones Indices for eligible non-U.S. users.
- The contract offers 24/7, non-expiring exposure to the index, using official S&P Dow Jones Indices data for pricing and settlement.
- Trade[XYZ] reports on-chain volume surpassing $100 billion since October 2025, with an annualized run rate above $600 billion, highlighting strong liquidity.
- This development follows a July collaboration between the index maker and Centrifuge to bring the S&P 500 on-chain via proof-of-index infrastructure and a tokenized index fund.
- Other major exchanges are expanding perpetuals into traditional assets, including Binance’s TradFi contracts, Kraken’s tokenized futures, and Coinbase’s plan for 24/7 BTC/ETH futures in the U.S.
- Tokenized equities on-chain have grown to roughly $1.09 billion in total value, with Circle Internet Group, Exodus Movement, and Alphabet among the largest holders, per RWA.xyz data.
On-chain access to the S&P 500 and beyond
In a strategic pivot for the crypto market, S&P Dow Jones Indices’ licensing enables Trade[XYZ] to list a perpetual futures contract tied to the S&P 500 index on Hyperliquid. The product is positioned as a pioneering on-chain offering that provides continuous, leveraged exposure to a leading U.S. equity benchmark for eligible non-U.S. users, with pricing and settlement anchored to official index data.
Cointelegraph notes that the contract’s design eliminates expiry dates, a hallmark of traditional perpetuals, while maintaining a governance and data backbone aligned with the S&P 500’s official methodology. The arrangement marks a notable step in integrating established financial benchmarks with blockchain-native trading venues, highlighting a trend toward wider adoption of on-chain derivatives beyond the crypto-native asset class.
Trade[XYZ] emphasizes liquidity and accessibility, pointing to more than $100 billion in on-chain volume since late 2025 and an annualized run rate above $600 billion. While those figures underscore interest, they also set expectations for how quickly institutional-grade benchmarks can scale within a tokenized framework. This data aligns with broader market signals that on-chain perpetuals are moving deeper into traditional assets, offering leveraged exposure with 24/7 trading hours.
The development arrives on the heels of a July collaboration with Centrifuge to put the S&P 500 on-chain through proof-of-index technology and a tokenized index fund built on blockchain-based systems. The aim is to blend the reliability of traditional index construction with the efficiency and accessibility of decentralized infrastructure, potentially lowering barriers to entry for users who want continuous exposure to the benchmark without the constraints of conventional market hours.
Related coverage has framed this as part of a broader shift toward on-chain tokenization of traditional assets and perpetual derivatives, with perpetual DEX activity documented as a burgeoning wave in 2025. The broader context suggests that the S&P 500 on Hyperliquid could be a litmus test for how far on-chain versions of established financial instruments can scale and attract meaningful liquidity.
Expanding perpetuals into traditional markets
The broader crypto industry has been steadily moving toward perpetual-style contracts tied to real-world assets. In January, Binance launched TradFi perpetual contracts, offering USDT-settled derivatives linked to commodities such as gold and silver with around-the-clock trading and no expiry. The following month, Kraken expanded this model to equities, introducing tokenized perpetual futures that provide leveraged exposure to U.S. stock indexes, gold, and select companies.
Earlier in the year, Coinbase signaled plans to introduce round-the-clock trading for Bitcoin and Ether futures in the U.S. and to broaden its perpetual-style contracts. These moves collectively illustrate a converging path where crypto-native platforms seek to bridge on-chain liquidity with traditional asset classes, potentially widening the audience for perpetuals beyond pure crypto traders.
In parallel with these developments, tokenized equities have continued to grow on-chain. Data from RWA.xyz shows total on-chain value rising to about $1.09 billion from roughly $300 million at the start of 2025. The market remains relatively concentrated, with Circle Internet Group among the largest holdings at roughly $136.8 million, followed by Exodus Movement at about $83 million and Alphabet at around $72.9 million. Tesla and the iShares Silver Trust also feature prominently among on-chain holdings.
These numbers highlight a developing ecosystem where traditional brands and asset classes appear on-chain in a way that can complement or compete with existing financial channels. While on-chain equity exposure remains a small slice of the overall market, the velocity of growth and the involvement of mainstream players suggest a structural shift in how investors access diversified, time-unconstrained exposure to real-world assets.
For readers tracking the evolving landscape, these arrangements reinforce the importance of watching regulatory developments, market liquidity, and the quality of reference data that underpins on-chain pricing and settlement. The S&P 500 on Hyperliquid, and similar products in the pipeline, could shape user behavior, risk management practices, and the competitive dynamics between centralized and decentralized venues for traditional-asset derivatives.
Sources and related coverage include Cointelegraph’s reporting on perpetuals growth and the Centrifuge collaboration to bring the S&P 500 on-chain, as well as ongoing industry notes on TradFi perpetuals from major crypto exchanges and tokenized-equity data from RWA.xyz. For a deeper look at the broader trends in on-chain derivatives and tokenized assets, see the linked materials and ongoing industry analysis.


The Bank of Korea and nine commercial lenders began phase two of a digital won pilot, testing bank-issued deposit tokens backed by central bank infrastructure to determine whether the system can support government subsidy payments and consume transfers and payments nationwide.
The second phase of Project Hangang adds two banks, Kyongnam Bank and iM Bank, to the program’s original seven. The institutions will now begin large-scale testing of the won-pegged deposit tokens built on a wholesale central bank digital currency (CBDC) layer, several local news outlets reported.
“Participating banks are actively securing diverse use cases, such as large businesses and small merchants with high public relevance and significant payment fee burdens, focusing on the potential for drastically reduced fees when using digital currency for payments,” said Kim Dong-sub, who heads the Bank of Korea’s digital currency planning team, according news outlet Chosun,
A key goal is to reduce the cost of transactions. By utilizing the deposit tokens, the BOK hopes to offer a lower-cost payment alternative for both large companies and small businesses that are currently burdened by credit card processing fees, according to the bank.
The Phase 2 start comes as South Korea’s Digital Asset Basic Act (DABA), a sweeping framework meant to govern crypto trading and issuance in one of Asia’s most active digital asset markets, is delayed because of disagreements among regulators over stablecoin issuance. The thorniest issue centeres on who should have the legal authority to issue KRW-pegged stablecoins.
In the new tests, peer-to-peer transfers, which were challenging in Phase 1, will become possible.
Kim also said “the government aims to begin disbursing subsidies in digital currency during the first half of this year,” with electric vehicle charging infrastructure subsidies expected to be among the first use cases.
The Bank of Korea also mentioned plans to enable digital currency as a payment method for ‘AI agents’, which are artificial intelligence systems that search for and purchase goods and services.

Tehran Sends Strong Signals in the Face of Escalation
According to the statements made by the Iranian authorities, the political and military organization of the country is stable enough to lose the leadership. According to Foreign Minister Abbas Araghchi, the institutions were operating normally. Besides, authorities reiterated that personal losses cannot undermine the system at large. These utterances are meant to show strength as the war spreads.
The oil prices shifted downwards with the escalation of geopolitical tensions in the Middle East. The prices of crude fell by over 3 percent and closed at around 92 in the last trade period. Nevertheless, markets responded to a stable supply situation and not to conflict risks. None of the significant disturbances in production or shipping of oil constrained price pressure.
The activity of shipping via the Strait of Hormuz was maintained at a moderate rate, which sustained a stable supply globally. Further, Iran permitted some commercial ships to pass through the important passage. Furthermore, Iraq and Kurdish leaders started again with oil exports through the Ceyhan port of Turkey. The situation created an addition to the supply chain in the international markets and lessened the apprehensions concerning scarcity.
Sanctions relief pushes in the wrong direction
The United States gave a temporary lift on sanctions imposed on the Russian oil shipments stuck at sea. This move gave it the opportunity to supply more supply to the international markets in the short run. As a result, the availability of crude was elevated, weighing on prices even though conflict risks were still there. Even a minor addition of supply, observed by analysts, could have an impact on prices in the existing circumstances.
Geopolitical risks are still pitted against stable supply flows by energy markets. Although tensions are strong, traders are focusing on real disruption of the situation as opposed to possible threats. Also, the existent equilibrium between the supply and demand has curbed price spikes. The oil markets are still sensitive to the developments as the conflict goes on.


Bitcoin’s hash rate is tumbling as the Middle East conflict drives up energy prices, adding pressure to the mining sector and broader market.
The drop in hash rate is likely tied to geopolitical tensions due to the war against Iran and surge in oil prices, given that an estimated 8% to 10% of global bitcoin mining operates in energy markets sensitive to energy costs.
With hash rate down roughly 8% over the past week to 920 EH/s, the network may be entering another phase of miner capitulation. Historically, such periods have coincided with downside pressure on bitcoin’s price, which is currently trading below $72,000, roughly 5% below its Monday high.
As a result, the network is set for an approximately 8% downward difficulty adjustment, which would mark the second-largest negative shift in the past five years, according to mempool.space.
This decline follows one of the largest difficulty drops on record in mid-February, highlighting significant volatility in mining activity.
As a result of rising competition, persistently low transaction fees, and bitcoin price volatility, this has squeezed margins and pushed many publicly traded miners to diversify into AI and high-performance computing, alongside increased bitcoin sales to support operations, acting as a headwind for the bitcoin price.
The Federal Reserve Open Market Committee (FOMC) announced on Wednesday that it would hold the Federal Funds rate steady at 3.5-3.75%, as it monitors macroeconomic impacts from the ongoing war in the Middle East.
Economic activity has expanded at a “solid pace,” Federal Reserve Chairman Jerome Powell said, adding that consumer spending remains “resilient,” while business investment continued to grow.
However, the housing sector remains weak, and the labor market shows signs of softening, Powell said, while inflation remains “somewhat elevated” above the Fed’s 2% target.

This higher inflation and weak labor market is creating a tension between the Federal Reserve’s dual mandate of maximizing employment and stabilizing prices, Powell Said. He added that the war in the Middle East has further clouded the economic outlook. He said:
“The implications of events in the Middle East for the US economy are uncertain in the near term. Higher energy prices will push up overall inflation, but it is too soon to know the scope and duration of the potential effects on the economy.”
Interest rate policy impacts risk asset markets like cryptocurrencies and equities, with lower rates stimulating asset prices and higher rates acting as a restrictive force on risk asset prices, as investment capital flows from riskier asset classes to government bonds.
Related: Fed holds rates amid higher inflation outlook: Bitcoin bounces to $72K
Traders see no chance of rate cuts, while analysts say liquidity will flow
97% of market participants forecast no change in interest rates at the April 2026 FOMC meeting. While 3% forecast a rate hike of 25 basis points (BPS), according to data from the Chicago Mercantile Exchange (CME).
A rate hike of 25 basis points would spike the Federal Funds Rate to a range between 3.75% and 4.00%.

Arthur Hayes, a market analyst and co-founder of the BitMEX crypto exchange, said he is waiting for the Fed to slash rates before he resumes buying Bitcoin (BTC).
Hayes also said that the ongoing war between the US and Iran would likely cause the Federal Reserve to ease monetary policy to finance the war.
Others, like macroeconomist Lyn Alden, say that the Federal Reserve has entered a “gradual print” phase in which new money is steadily being created, slowly raising up all asset prices.
Magazine: Is China hoarding gold so yuan becomes global reserve instead of USD?
The FTX Recovery Trust has disclosed a new creditor payout schedule, confirming a $2.2 billion distribution on March 31, 2026. This fourth round continues the exchange’s multi-year effort to reimburse creditors and former customers of the failed platform, following a sequence of disbursements that have totaled billions since 2025.
Eligible claimants will receive funds through their chosen distribution provider within one to three business days, according to the Trust’s announcement. The fourth distribution allocates 18% to Dotcom Customer claims, 5% to US Customer Entitlement Claims, and 15% to both General Unsecured Claims and Digital Asset Loan Claims. Convenience claims will receive a 120% reimbursement under the recovery plan.
Following this round, roughly $10 billion will have been paid out to creditors and former customers of FTX. The fifth round of payments is scheduled for May 29, 2026, according to the Trust.
The reimbursements could influence crypto prices in the near term if creditors and former customers of FTX deploy the recovery funds into digital assets.
The latest update comes as Sam Bankman-Fried, the convicted former CEO, pursues appeals in his criminal case, amid broader questions about how the recovery process will impact victims and the wider crypto market. Bankman-Fried has been the subject of ongoing legal proceedings and related coverage, with reports indicating relocation discussions and various court filings as part of his efforts to challenge the judgment against him.
Key takeaways
- FTX Recovery Trust sets a $2.2 billion fourth distribution for March 31, 2026, with specific allocations: 18% for Dotcom Customer claims, 5% for US Customer Entitlement Claims, and 15% for General Unsecured and Digital Asset Loan Claims; Convenience claims receive 120% reimbursement.
- Totals to date after this round approach about $10 billion paid to creditors and former customers of FTX; the fifth distribution is slated for May 29, 2026.
- Earlier payouts included approximately $1.2 billion (February 2025), $5 billion (May 2025), and $1.6 billion (September 2025), illustrating a pattern of sizable disbursements over 2025–2026.
- Market implications hinge on how recipients deploy funds; reinvestment into crypto could provide near-term price movements, though broader recovery remains uncertain.
- Ongoing legal actions surrounding Sam Bankman-Fried—appeals and related proceedings—continue to add a layer of regulatory and narrative risk to the recovery program.
Fourth distribution details and payout mechanics
The FTX Recovery Trust’s latest announcement confirms a $2.2 billion payout slated for March 31, 2026. Eligible creditors will see payments delivered through their selected distribution provider within one to three business days, marking the fourth installment in a plan designed to unwind the exchange’s collapsed operations. The distribution breakdown targets specific claim categories: 18% for Dotcom Customer claims, 5% for US Customer Entitlement Claims, and 15% for both General Unsecured Claims and Digital Asset Loan Claims, with Convenience claims receiving a 120% reimbursement under the framework.
The structure underscores a phased approach to restitution, balancing the need to advance recovery with the complexities of asset valuation and creditor eligibility. The Trust’s statement emphasizes that the payout will proceed in a timely manner, enabling creditors to access funds relatively quickly after the distribution date.
Progress of the FTX recovery program
The fourth distribution arrives after a year of active creditor payouts. The recovery process began disbursing funds in February 2025 with a $1.2 billion payment, followed by a $5 billion distribution in May 2025. The third round in September 2025 totalled $1.6 billion. With the March 2026 release, overall disbursements push toward $10 billion across all rounds, reflecting the scale and urgency of addressing creditor claims while acknowledging the recovery remains far from complete for many affected parties.
Several creditors and advocacy voices have argued that the recoveries are not fully satisfactory given the losses incurred when FTX collapsed in 2022. Still, the ongoing payouts represent a tangible step in returning value to those impacted, even as the total figure has been a point of contention among some claimants.
Market and regulatory implications
The prospect of creditors receiving cash and potentially choosing to reallocate those funds into crypto markets has drawn attention from market participants. Observers are watching whether the proceeds will be redeployed into Bitcoin, Ether, or other digital assets, potentially providing a short-term catalyst for price moves even as broader market dynamics remain nuanced and uncertain.
Beyond market effects, the recovery program continues to intersect with high-profile legal developments surrounding Sam Bankman-Fried. Appeals and ongoing court activity related to his case contribute to a broader narrative about accountability, investor protection, and the resilience of the crypto industry in the face of high-profile collapse events.
Ongoing oversight and what to watch next
As the fourth distribution lands, attention will turn to the fifth payout on May 29, 2026, and how subsequent rounds will adapt to evolving market conditions and creditor needs. Market watchers will also monitor updates on the total recovered amount, any changes to the distribution schedule, and new information emerging from legal proceedings that could influence the pace or structure of future disbursements.
Looking ahead, observers will assess whether further recoveries will translate into renewed demand for digital assets among creditors or whether the funds will be used for debt settlements, personal liquidity, or other non-crypto purposes. With another major distribution on the horizon, the FTX creditor storyline remains a focal point for investors seeking to understand the long tail of the exchange’s collapse and its implications for market resilience and creditor rights.
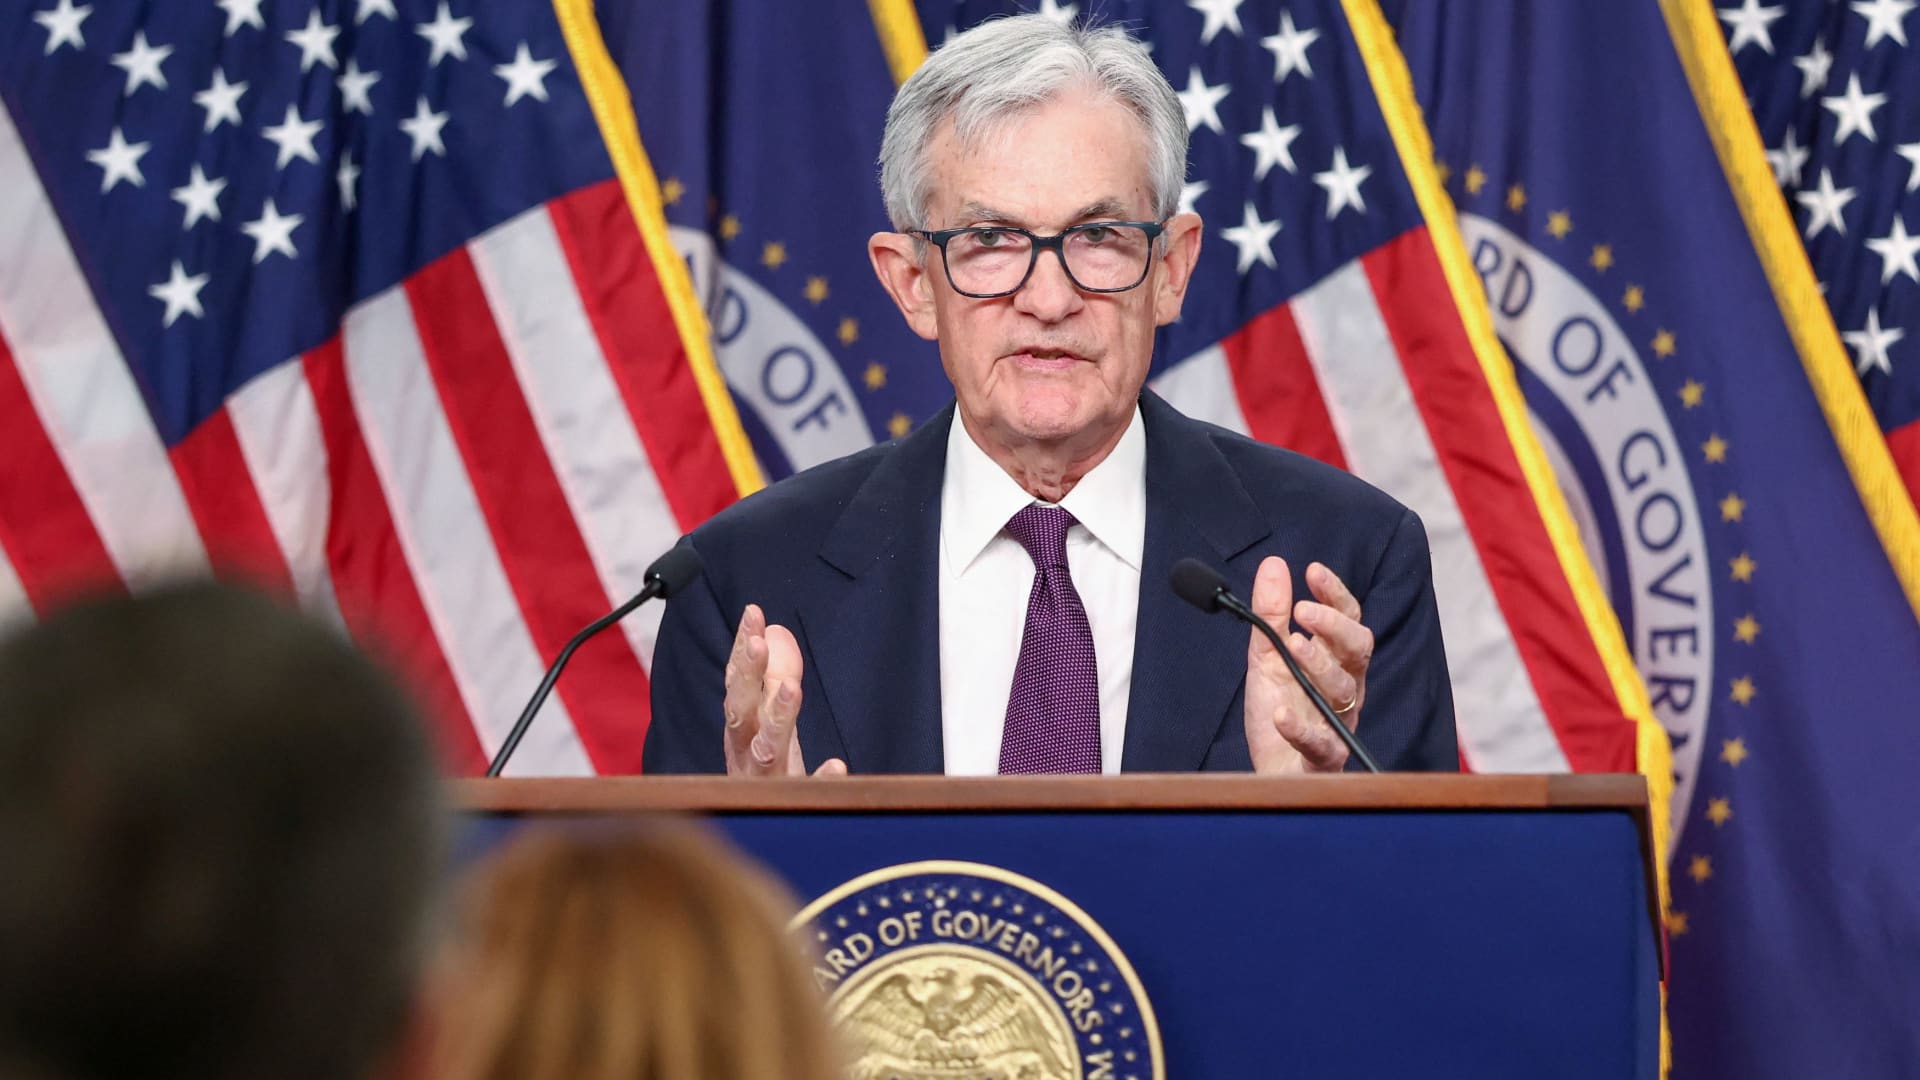
U.S. Federal Reserve Chair Jerome Powell holds a press conference following a two-day meeting of the Federal Open Market Committee (FOMC), at the Federal Reserve in Washington, D.C., U.S., March 18, 2026.
Kevin Lamarque | Reuters
1. Lots of uncertainty
While no one expected the Fed to cut — much less hike — at this meeting, the market always looks for clues about what’s next. Neither the post-meeting statement, the update on economic projections, nor Powell’s news conference provided much in that regard. The statement saw only minor tweaks, the “dot plot” saw a modest dovish shift, and Powell used some form of “uncertain” more than half a dozen times.
2. The war is a problem
Forecasting the future and modeling policy at a time when the U.S. is at war with Iran is nearly impossible, Powell said. He faced repeated questions about the oil shock, and mostly emphasized how much it has muddied the waters for the Fed. “The thing I really want to emphasize is that nobody knows,” he said. “The economic effects could be bigger, they could be smaller, they could be much smaller or much bigger. We just don’t know.”
3. Cuts coming, but timing is highly uncertain
The dot plot still pointed to one more cut this year and another next year. But the grid looked more like a maze than a consensus, underlining just how little underlying consensus exists on the Federal Open Market Committee. For instance: In 2027, one official sees a hike, three see no change from the current level, four expect another cut, six see two more cuts, three forecast three cuts, one official sees four cuts, and a final participant — presumably Governor Stephen Miran — is at five.
4. Powell leaves door open to staying
Each news conference, Powell is questioned on whether he will stay on as governor after his term as chair ends. He again said he hasn’t made up his mind, which, of course, doesn’t eliminate the possibility. But he also said he isn’t going anywhere as long as the investigation into him continues, adding that he’ll also stay on as sort of a “chair pro tem” until someone, presumably former Governor Kevin Warsh, is confirmed as his successor.
5. Powell rejects ‘stagflation’
Don’t use the term “stagflation” around Powell. The chair rejected the notion that the U.S. economy, with its solid growth and low unemployment rate, is heading toward a 1970s nightmare, despite an anemic hiring rate and inflation above the Fed’s target for going on five years. “It’s a very difficult situation, but it’s nothing like what they faced in the 1970s and [I would] reserve ‘stagflation’ for that,” Powell said. “Maybe that’s just me.”
They said it
“The Fed didn’t move today — but it didn’t need to. This is a central bank that’s comfortable waiting, watching, and staying flexible. One projected cut tells you everything: the Fed is not in a rush, and neither should investors be.” — Gina Bolvin, president of Bolvin Wealth Management Group.
“Although the move was widely expected, it underscores the difficult path ahead for the Fed, which now faces pressure on both sides of its dual mandate to keep employment high and inflation muted. Complicating matters further is the fact that Fed leaders are often basing hugely important decisions on weeks- or months-old data that may not fully capture the magnitude of rapid economic shifts, raising the risk that decisions may come too late or be based on outdated assumptions.” — Indeed economist Felix Aidala.
“I expect given the volatile situation that the committee would like to try and do as little as possible so as to not rock the boat ahead of the new Fed chair taking over.” — Stephen Coltman, head of macro at 21shares.

From Horror Icon to Expectant Mother in 2026

SEC Chair Explains Why NFTs Aren’t Securities
Lauren London Stuns In New Photos From Oscars Gold Party


-
 Crypto World5 days ago
HYPE Token Enters Net Deflation as HyperCore Buybacks Outpace Staking Rewards
-

 Tech3 days ago
Your Legally Registered ‘Motorcycle’ Might Not Count Under Proposed US Law
-

 Fashion5 days ago
Weekend Open Thread: Addict Lip Glow
-
Sports4 days ago
Why Duke and Michigan Are Dead Even Entering Selection Sunday
-
 Tech1 day ago
Are Split Spacebars the Next Big Gaming Keyboard Trend?
-

 Business3 days ago
Search for Savannah Guthrie’s Mother Enters Seventh Week with No Arrests
-

 Business4 days ago
US Airports Launch Donation Drives for Unpaid TSA Workers as Partial Government Shutdown Enters Fifth Week
-
Crypto World4 days ago
Coinbase and Bybit in Investment Talks: Could Bybit Finally Enter the US Crypto Market?
-

 Business3 days ago
Australian shares drop as Iran war enters third week
-

 Business4 days ago
Country star Brantley Gilbert enters growing non-alcoholic beer market
-

 Crypto World3 days ago
Crypto Lender BlockFills Enters Chapter 11 with Up to $500M in Liabilities
-

 Sports5 days ago
College Basketball Best Bets: Conference Tournament Semifinal Picks
-

 Politics13 hours ago
The House | The new register to protect children from their abusers shows Parliament at its best
-

 Crypto World7 days ago
Three Binance Charts May Be Hinting at Bitcoin’s Next Move
-

 Business6 days ago
Trump demands Powell cut rates as Iran conflict raises energy prices
-

 Crypto World6 days ago
Senate Votes to Include CBDC Ban in Bipartisan Housing Bill
-

 Fashion2 days ago
25 Celebrities with Curly Hair That Are Naturally Beautiful
-

 News Videos6 hours ago
RBA board divided on rate cut, unusually buoyant share market | Finance Report | ABC NEWS
-

 NewsBeat6 days ago
Deane Road crash near Bolton colleges and university
-

 News Videos6 days ago
Tom Lee: The 100x Opportunity EVEN Bigger Than Bitcoin (New Ethereum Prediction 2026)


You must be logged in to post a comment Login